
Role of ST6GAL1 in Thyroid Cancers: Insights from Tissue Analysis and Genomic Datasets

 , ,
, ,  , , , ,
  and
and
Abstract
:1. Introduction
2. Results
ST6GAL1 mRNA Levels in Thyroid Cancers
3. Discussion
4. Materials and Methods
4.1. Tissue Samples of Patients
4.2. Immunofluorescent Staining and Microphotograph Quantification
4.3. ST6GAL1 mRNA Level Analysis
4.4. Statistical Analysis
5. Conclusions
Author Contributions
Funding
Institutional Review Board Statement
Informed Consent Statement
Data Availability Statement
Conflicts of Interest
References
- Deng, Y.; Li, H.; Wang, M.; Li, N.; Tian, T.; Wu, Y.; Xu, P.; Yang, S.; Zhai, Z.; Zhou, L.; et al. Global Burden of Thyroid Cancer From 1990 to 2017. JAMA Netw. Open 2020, 3, e208759. [Google Scholar] [CrossRef]
- Cabanillas, M.E.; McFadden, D.G.; Durante, C. Thyroid cancer. Lancet 2016, 388, 2783–2795. [Google Scholar] [CrossRef]
- Fagin, J.A.; Wells, S.A., Jr. Biologic and Clinical Perspectives on Thyroid Cancer. N. Engl. J. Med. 2016, 375, 1054–1067. [Google Scholar] [CrossRef] [PubMed]
- Macerola, E.; Poma, A.M.; Vignali, P.; Basolo, A.; Ugolini, C.; Torregrossa, L.; Santini, F.; Basolo, F. Molecular Genetics of Follicular-Derived Thyroid Cancer. Cancers 2021, 13, 1139. [Google Scholar] [CrossRef] [PubMed]
- Agrawal, N.; Akbani, R.; Aksoy, B.A.; Ally, A.; Arachchi, H.; Asa, S.L.; Todd Auman, J.; Balasundaram, M.; Balu, S.; Baylin, S.B.; et al. Integrated genomic characterization of papillary thyroid carcinoma. Cell 2014, 159, 676–690. [Google Scholar] [CrossRef] [PubMed]
- Kimura, E.T.; Nikiforova, M.N.; Zhu, Z.; Knauf, J.A.; Nikiforov, Y.E.; Fagin, J.A. High prevalence of BRAF mutations in thyroid cancer: Genetic evidence for constitutive activation of the RET/PTC-RAS-BRAF signaling pathway in papillary thyroid carcinoma. Cancer Res. 2003, 63, 1454–1457. [Google Scholar] [PubMed]
- Czene, K.; Lichtenstein, P.; Hemminki, K. Environmental and heritable causes of cancer among 9.6 million individuals in the Swedish Family-Cancer Database. Int. J. Cancer 2002, 99, 260–266. [Google Scholar] [CrossRef]
- Gudmundsson, J.; Sulem, P.; Gudbjartsson, D.F.; Jonasson, J.G.; Sigurdsson, A.; Bergthorsson, J.T.; He, H.; Blondal, T.; Geller, F.; Jakobsdottir, M.; et al. Common variants on 9q22.33 and 14q13.3 predispose to thyroid cancer in European populations. Nat. Genet. 2009, 41, 460–464. [Google Scholar] [CrossRef]
- Gudmundsson, J.; Sulem, P.; Gudbjartsson, D.F.; Jonasson, J.G.; Masson, G.; He, H.; Jonasdottir, A.; Sigurdsson, A.; Stacey, S.N.; Johannsdottir, H.; et al. Discovery of common variants associated with low TSH levels and thyroid cancer risk. Nat. Genet. 2012, 44, 319–322. [Google Scholar] [CrossRef]
- Gudmundsson, J.; Thorleifsson, G.; Sigurdsson, J.K.; Stefansdottir, L.; Jonasson, J.G.; Gudjonsson, S.A.; Gudbjartsson, D.F.; Masson, G.; Johannsdottir, H.; Halldorsson, G.H.; et al. A genome-wide association study yields five novel thyroid cancer risk loci. Nat. Commun. 2017, 8, 14517. [Google Scholar] [CrossRef]
- Hurst, Z.; Liyanarachchi, S.; He, H.; Brock, P.; Sipos, J.; Nabhan, F.; Kebebew, E.; Green, P.; Cote, G.J.; Sherman, S.; et al. Risk Haplotypes Uniquely Associated with Radioiodine-Refractory Thyroid Cancer Patients of High African Ancestry. Thyroid 2019, 29, 530–539. [Google Scholar] [CrossRef] [PubMed]
- Hwangbo, Y.; Lee, E.K.; Son, H.Y.; Im, S.W.; Kwak, S.J.; Yoon, J.W.; Kim, M.J.; Kim, J.; Choi, H.S.; Ryu, C.H.; et al. Genome-Wide Association Study Reveals Distinct Genetic Susceptibility of Thyroid Nodules From Thyroid Cancer. J. Clin. Endocrinol. Metab. 2018, 103, 4384–4394. [Google Scholar] [CrossRef] [PubMed]
- Jendrzejewski, J.P.; Sworczak, K.; Comiskey, D.F.; de la Chapelle, A. Clinical implications of GWAS variants associated with differentiated thyroid cancer. Endokrynol. Pol. 2019, 70, 423–429. [Google Scholar] [CrossRef] [PubMed]
- Köhler, A.; Chen, B.; Gemignani, F.; Elisei, R.; Romei, C.; Figlioli, G.; Cipollini, M.; Cristaudo, A.; Bambi, F.; Hoffmann, P.; et al. Genome-wide association study on differentiated thyroid cancer. J. Clin. Endocrinol. Metab. 2013, 98, E1674–E1681. [Google Scholar] [CrossRef]
- Liyanarachchi, S.; Gudmundsson, J.; Ferkingstad, E.; He, H.; Jonasson, J.G.; Tragante, V.; Asselbergs, F.W.; Xu, L.; Kiemeney, L.A.; Netea-Maier, R.T.; et al. Assessing thyroid cancer risk using polygenic risk scores. Proc. Natl. Acad. Sci. USA 2020, 117, 5997–6002. [Google Scholar] [CrossRef] [PubMed]
- Mancikova, V.; Cruz, R.; Inglada-Pérez, L.; Fernández-Rozadilla, C.; Landa, I.; Cameselle-Teijeiro, J.; Celeiro, C.; Pastor, S.; Velázquez, A.; Marcos, R.; et al. Thyroid cancer GWAS identifies 10q26.12 and 6q14.1 as novel susceptibility loci and reveals genetic heterogeneity among populations. Int. J. Cancer 2015, 137, 1870–1878. [Google Scholar] [CrossRef] [PubMed]
- Son, H.-Y.; Hwangbo, Y.; Yoo, S.-K.; Im, S.-W.; Yang, S.D.; Kwak, S.-J.; Park, M.S.; Kwak, S.H.; Cho, S.W.; Ryu, J.S.; et al. Genome-wide association and expression quantitative trait loci studies identify multiple susceptibility loci for thyroid cancer. Nat. Commun. 2017, 8, 15966. [Google Scholar] [CrossRef]
- Zhou, W.; Brumpton, B.; Kabil, O.; Gudmundsson, J.; Thorleifsson, G.; Weinstock, J.; Zawistowski, M.; Nielsen, J.B.; Chaker, L.; Medici, M.; et al. GWAS of thyroid stimulating hormone highlights pleiotropic effects and inverse association with thyroid cancer. Nat. Commun. 2020, 11, 3981. [Google Scholar] [CrossRef]
- Matana, A.; Popović, M.; Boutin, T.; Torlak, V.; Brdar, D.; Gunjača, I.; Kolčić, I.; Boraska Perica, V.; Punda, A.; Rudan, I.; et al. Genetic Variants in the ST6GAL1 Gene Are Associated with Thyroglobulin Plasma Level in Healthy Individuals. Thyroid 2019, 29, 886–893. [Google Scholar] [CrossRef]
- Pleić, N.; Babić Leko, M.; Gunjača, I.; Boutin, T.; Torlak, V.; Matana, A.; Punda, A.; Polašek, O.; Hayward, C.; Zemunik, T. Genome-Wide Association Analysis and Genomic Prediction of Thyroglobulin Plasma Levels. Int. J. Mol. Sci. 2022, 23, 2173. [Google Scholar] [CrossRef]
- Dobie, C.; Skropeta, D. Insights into the role of sialylation in cancer progression and metastasis. Br. J. Cancer 2021, 124, 76–90. [Google Scholar] [CrossRef] [PubMed]
- Haas, Q.; Simillion, C.; von Gunten, S. A Cartography of Siglecs and Sialyltransferases in Gynecologic Malignancies: Is There a Road Towards a Sweet Future? Front. Oncol. 2018, 8, 68. [Google Scholar] [CrossRef] [PubMed]
- Wei, A.; Fan, B.; Zhao, Y.; Zhang, H.; Wang, L.; Yu, X.; Yuan, Q.; Yang, D.; Wang, S. ST6Gal-I overexpression facilitates prostate cancer progression via the PI3K/Akt/GSK-3β/β-catenin signaling pathway. Oncotarget 2016, 7, 65374–65388. [Google Scholar] [CrossRef]
- Hsieh, C.C.; Shyr, Y.M.; Liao, W.Y.; Chen, T.H.; Wang, S.E.; Lu, P.C.; Lin, P.Y.; Chen, Y.B.; Mao, W.Y.; Han, H.Y.; et al. Elevation of β-galactoside α2,6-sialyltransferase 1 in a fructoseresponsive manner promotes pancreatic cancer metastasis. Oncotarget 2017, 8, 7691–7709. [Google Scholar] [CrossRef] [PubMed]
- Wang, P.-H.; Lee, W.-L.; Juang, C.-M.; Yang, Y.-H.; Lo, W.-H.; Lai, C.-R.; Hsieh, S.-L.; Yuan, C.-C. Altered mRNA expressions of sialyltransferases in ovarian cancers. Gynecol. Oncol. 2005, 99, 631–639. [Google Scholar] [CrossRef]
- Wichert, B.; Milde-Langosch, K.; Galatenko, V.; Schmalfeldt, B.; Oliveira-Ferrer, L. Prognostic role of the sialyltransferase ST6GAL1 in ovarian cancer. Glycobiology 2018, 28, 898–903. [Google Scholar] [CrossRef]
- Swindall, A.F.; Bellis, S.L. Sialylation of the Fas death receptor by ST6Gal-I provides protection against Fas-mediated apoptosis in colon carcinoma cells. J. Biol. Chem. 2011, 286, 22982–22990. [Google Scholar] [CrossRef]
- Wang, P.H.; Lee, W.L.; Lee, Y.R.; Juang, C.M.; Chen, Y.J.; Chao, H.T.; Tsai, Y.C.; Yuan, C.C. Enhanced expression of alpha 2,6-sialyltransferase ST6Gal I in cervical squamous cell carcinoma. Gynecol. Oncol. 2003, 89, 395–401. [Google Scholar] [CrossRef]
- Gretschel, S.; Haensch, W.; Schlag, P.M.; Kemmner, W. Clinical relevance of sialyltransferases ST6GAL-I and ST3GAL-III in gastric cancer. Oncology 2003, 65, 139–145. [Google Scholar] [CrossRef]
- Lu, J.; Isaji, T.; Im, S.; Fukuda, T.; Hashii, N.; Takakura, D.; Kawasaki, N.; Gu, J. β-Galactoside α2,6-sialyltranferase 1 promotes transforming growth factor-β-mediated epithelial-mesenchymal transition. J. Biol. Chem. 2014, 289, 34627–34641. [Google Scholar] [CrossRef]
- Yamamoto, H.; Oviedo, A.; Sweeley, C.; Saito, T.; Moskal, J.R. Alpha2,6-sialylation of cell-surface N-glycans inhibits glioma formation in vivo. Cancer Res. 2001, 61, 6822–6829. [Google Scholar]
- Antony, P.; Rose, M.; Heidenreich, A.; Knüchel, R.; Gaisa, N.T.; Dahl, E. Epigenetic inactivation of ST6GAL1 in human bladder cancer. BMC Cancer 2014, 14, 901. [Google Scholar] [CrossRef] [PubMed]
- Vajaria, B.N.; Patel, P.S. Glycosylation: A hallmark of cancer? Glycoconj. J. 2017, 34, 147–156. [Google Scholar] [CrossRef] [PubMed]
- Dorsett, K.A.; Marciel, M.P.; Hwang, J.; Ankenbauer, K.E.; Bhalerao, N.; Bellis, S.L. Regulation of ST6GAL1 sialyltransferase expression in cancer cells. Glycobiology 2021, 31, 530–539. [Google Scholar] [CrossRef] [PubMed]
- Schultz, M.J.; Holdbrooks, A.T.; Chakraborty, A.; Grizzle, W.E.; Landen, C.N.; Buchsbaum, D.J.; Conner, M.G.; Arend, R.C.; Yoon, K.J.; Klug, C.A.; et al. The Tumor-Associated Glycosyltransferase ST6Gal-I Regulates Stem Cell Transcription Factors and Confers a Cancer Stem Cell Phenotype. Cancer Res. 2016, 76, 3978–3988. [Google Scholar] [CrossRef]
- Miao, X.; Zhao, Y. ST6GalNAcII mediates tumor invasion through PI3K/Akt/NF-κB signaling pathway in follicular thyroid carcinoma. Oncol. Rep. 2016, 35, 2131–2140. [Google Scholar] [CrossRef]
- Xu, G.; Chen, J.; Wang, G.; Xiao, J.; Zhang, N.; Chen, Y.; Yu, H.; Zhao, Y. Resveratrol Inhibits the Tumorigenesis of Follicular Thyroid Cancer via ST6GAL2-Regulated Activation of the Hippo Signaling Pathway. Mol. Ther. Oncolytics 2020, 16, 124–133. [Google Scholar] [CrossRef]
- Ma, W.; Zhao, X.; Liang, L.; Wang, G.; Li, Y.; Miao, X.; Zhao, Y. miR-146a and miR-146b promote proliferation, migration and invasion of follicular thyroid carcinoma via inhibition of ST8SIA4. Oncotarget 2017, 8, 28028–28041. [Google Scholar] [CrossRef]
- Citterio, C.E.; Targovnik, H.M.; Arvan, P. The role of thyroglobulin in thyroid hormonogenesis. Nat. Rev. Endocrinol. 2019, 15, 323–338. [Google Scholar] [CrossRef]
- Prpić, M.; Franceschi, M.; Romić, M.; Jukić, T.; Kusić, Z. Thyroglobulin as a tumor marker in differentiated thyroid cancer—Clinical considerations. Acta Clin. Croat. 2018, 57, 518–527. [Google Scholar] [CrossRef]
- Gilbert-Sirieix, M.; Makoukji, J.; Kimura, S.; Talbot, M.; Caillou, B.; Massaad, C.; Massaad-Massade, L. Wnt/β-catenin signaling pathway is a direct enhancer of thyroid transcription factor-1 in human papillary thyroid carcinoma cells. PLoS ONE 2011, 6, 21. [Google Scholar] [CrossRef] [PubMed]
- Civitareale, D.; Lonigro, R.; Sinclair, A.J.; Di Lauro, R. A thyroid-specific nuclear protein essential for tissue-specific expression of the thyroglobulin promoter. EMBO J. 1989, 8, 2537–2542. [Google Scholar] [CrossRef] [PubMed]
- Frenzel, R.; Krohn, K.; Eszlinger, M.; Tönjes, A.; Paschke, R. Sialylation of human thyrotropin receptor improves and prolongs its cell-surface expression. Mol. Pharmacol. 2005, 68, 1106–1113. [Google Scholar] [CrossRef] [PubMed]
- Korta, P.; Pocheć, E. Glycosylation of thyroid-stimulating hormone receptor. Endokrynol. Pol. 2019, 70, 86–100. [Google Scholar] [CrossRef]
- Suzuki, K.; Lavaroni, S.; Mori, A.; Ohta, M.; Saito, J.; Pietrarelli, M.; Singer, D.S.; Kimura, S.; Katoh, R.; Kawaoi, A.; et al. Autoregulation of thyroid-specific gene transcription by thyroglobulin. Proc. Natl. Acad. Sci. USA 1998, 95, 8251–8256. [Google Scholar] [CrossRef]
- Sue, M.; Hayashi, M.; Kawashima, A.; Akama, T.; Tanigawa, K.; Yoshihara, A.; Hara, T.; Ishido, Y.; Ito, T.; Takahashi, S.-I.; et al. Thyroglobulin (Tg) activates MAPK pathway to induce thyroid cell growth in the absence of TSH, insulin and serum. Biochem. Biophys. Res. Commun. 2012, 420, 611–615. [Google Scholar] [CrossRef]
- Sellitti, D.F.; Suzuki, K. Intrinsic Regulation of Thyroid Function by Thyroglobulin. Thyroid 2014, 24, 625–638. [Google Scholar] [CrossRef]
- Ulianich, L.; Suzuki, K.; Mori, A.; Nakazato, M.; Pietrarelli, M.; Goldsmith, P.; Pacifico, F.; Consiglio, E.; Formisano, S.; Kohn, L.D. Follicular thyroglobulin (TG) suppression of thyroid-restricted genes involves the apical membrane asialoglycoprotein receptor and TG phosphorylation. J. Biol. Chem. 1999, 274, 25099–25107. [Google Scholar] [CrossRef]
- Kiljański, J.; Ambroziak, M.; Pachucki, J.; Jazdzewski, K.; Wiechno, W.; Stachlewska, E.; Górnicka, B.; Bogdańska, M.; Nauman, J.; Bartoszewicz, Z. Thyroid sialyltransferase mRNA level and activity are increased in Graves’ disease. Thyroid 2005, 15, 645–652. [Google Scholar] [CrossRef]
- Lonsdale, J.; Thomas, J.; Salvatore, M.; Phillips, R.; Lo, E.; Shad, S.; Hasz, R.; Walters, G.; Garcia, F.; Young, N.; et al. The Genotype-Tissue Expression (GTEx) project. Nat. Genet. 2013, 45, 580–585. [Google Scholar] [CrossRef]
- Li, B.; Dewey, C.N. RSEM: Accurate transcript quantification from RNA-Seq data with or without a reference genome. BMC Bioinform. 2011, 12, 323. [Google Scholar] [CrossRef] [PubMed]
- Wang, S.; Liu, X. The UCSCXenaTools R package: A toolkit for accessing genomics data from UCSC Xena platform, from cancer multi-omics to single-cell RNA-seq. J. Open Source Softw. 2019, 4, 1627. [Google Scholar] [CrossRef]
- Therneau, T.M. A Package for Survival Analysis in R. Available online: https://CRAN.R-project.org/package=survival (accessed on 10 June 2023).
- R Core Team. R: A Language and Environment for Statistical Computing; R Foundation for Statistical Computing: Vienna, Austria, 2021. [Google Scholar]


| ST6GAL1 Expression | ||||
|---|---|---|---|---|
| Variable | N | Median (Q1–Q3) | Min–Max | p-Value |
| Histological type | <0.0001 a | |||
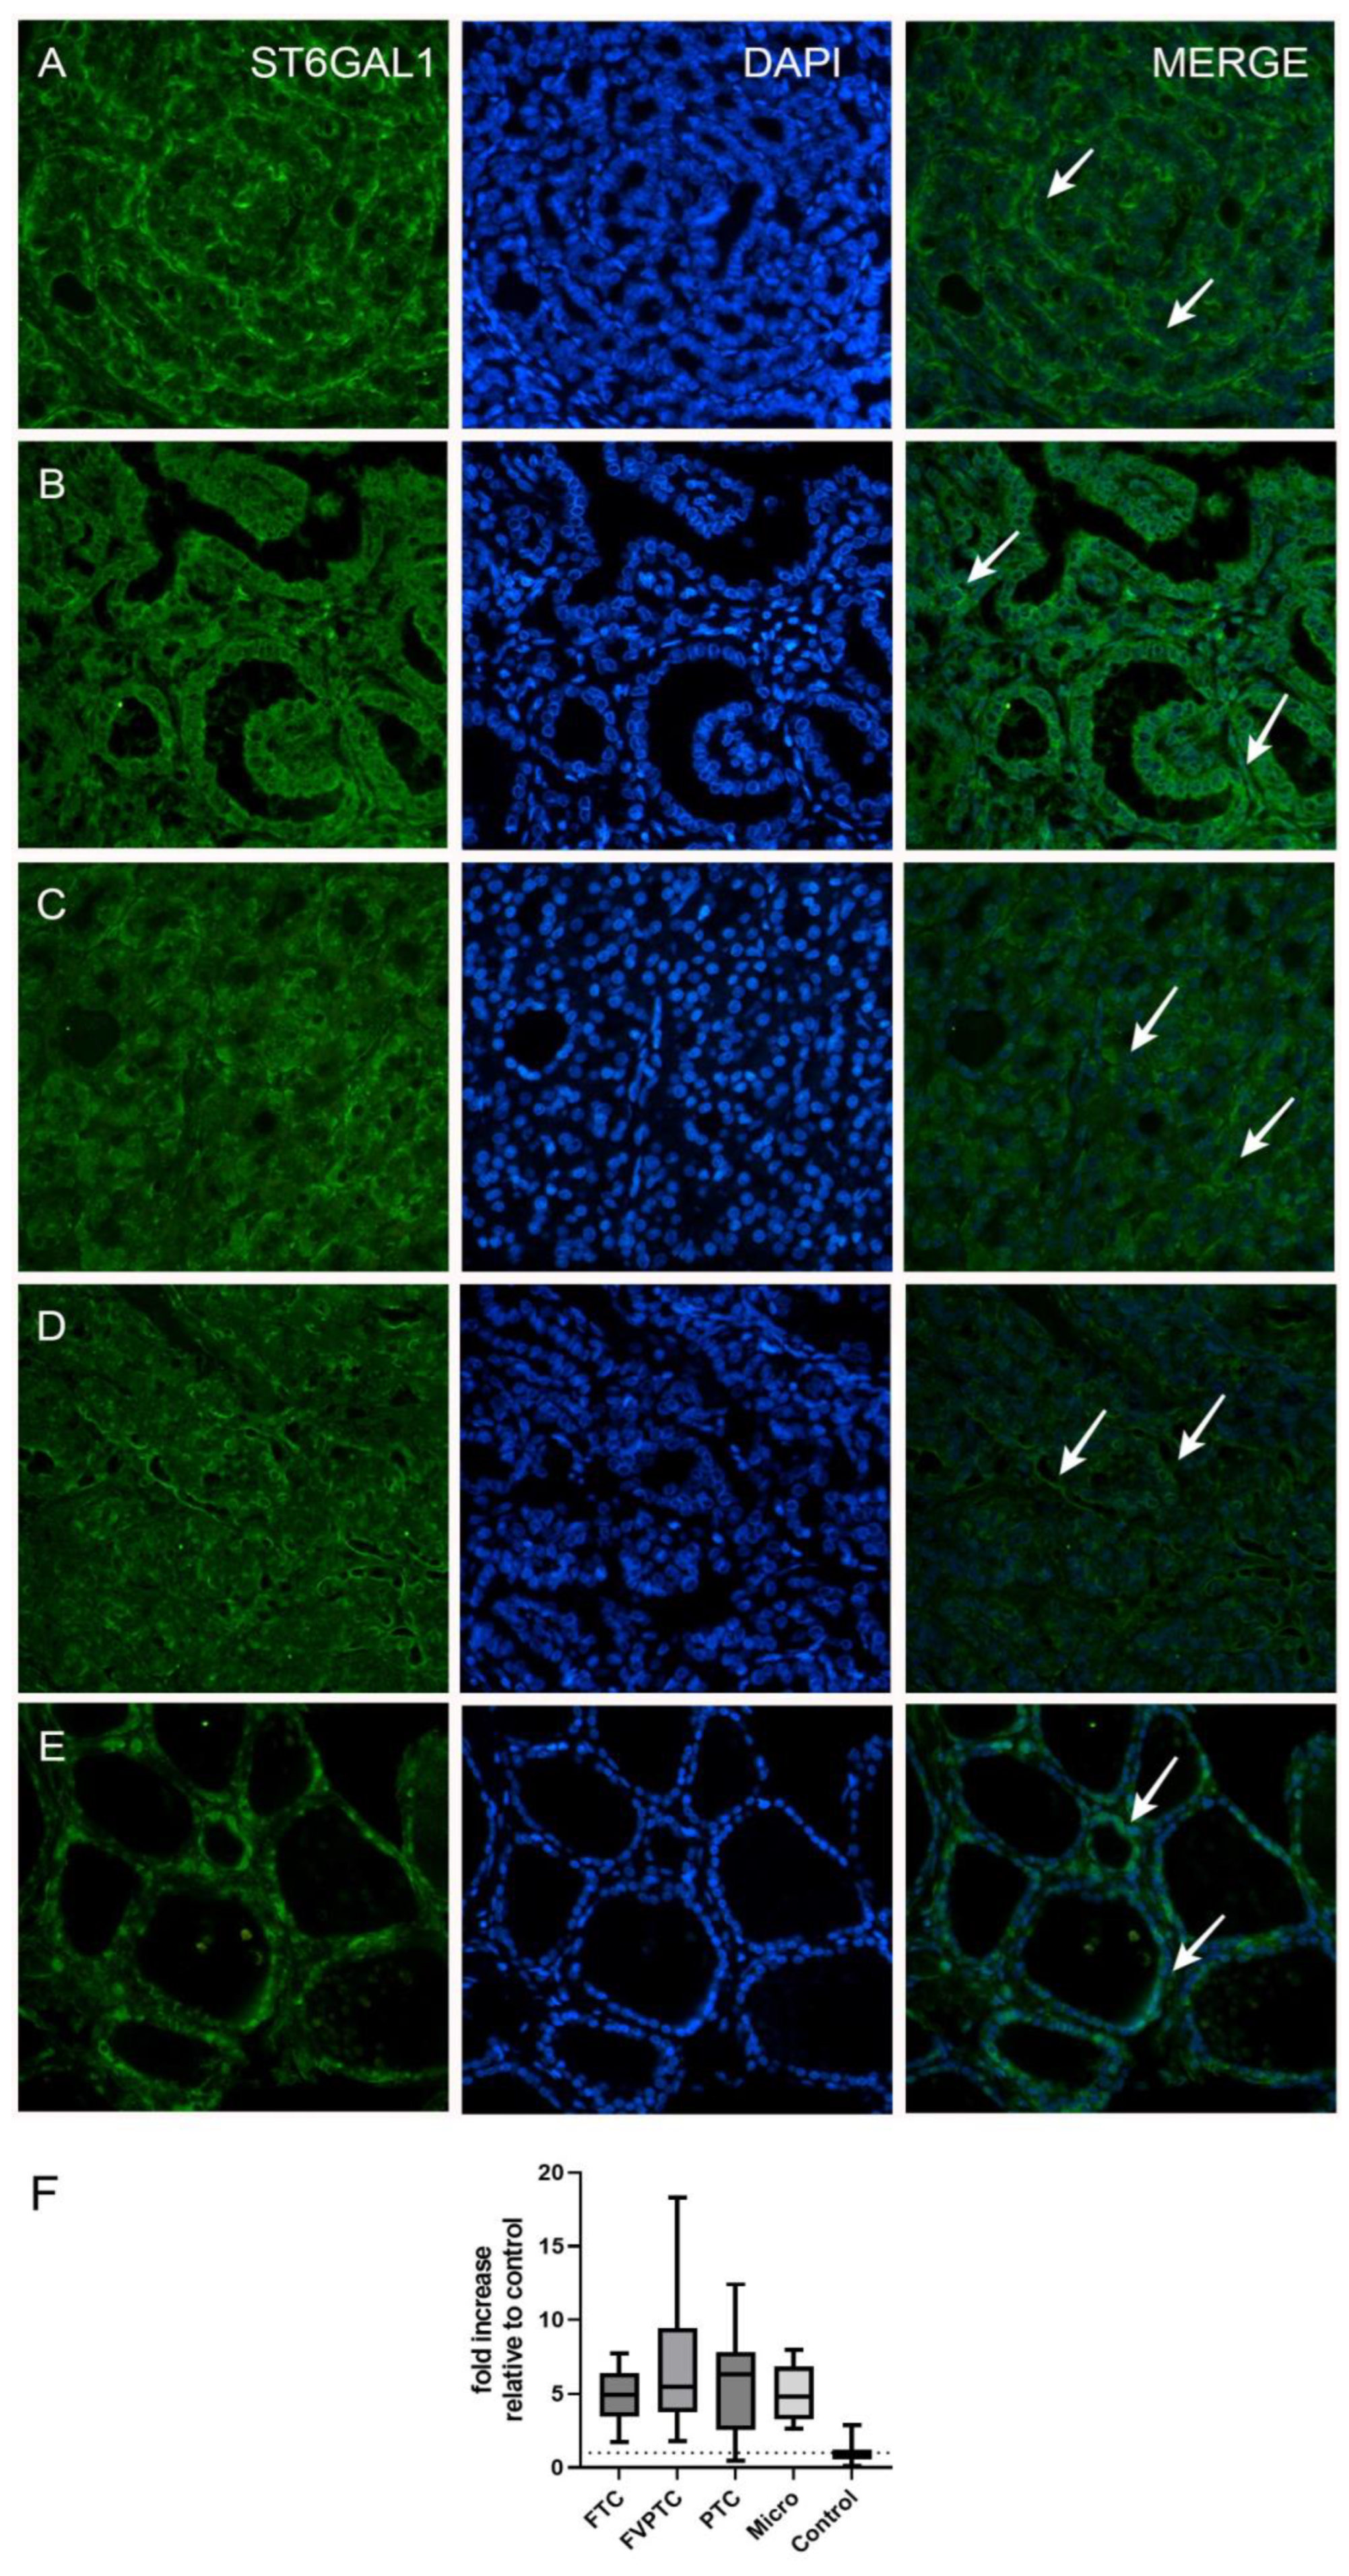
| FTC | 20 | 4.94 (3.47–6.45) | 1.76–7.73 | <0.0001 b |
| FVPTC | 17 | 5.47 (3.78–9.44) | 1.83–18.33 | 0.0002 b |
| PTC | 20 | 6.34 (2.53–7.83) | 0.49–12.40 | <0.0001 b |
| Micro | 18 | 4.84 (3.26–6.85) | 2.64–7.93 | <0.0001 b |
| Control | 14 | 1.02 (0.56–1.23) | 0.10–2.85 | |
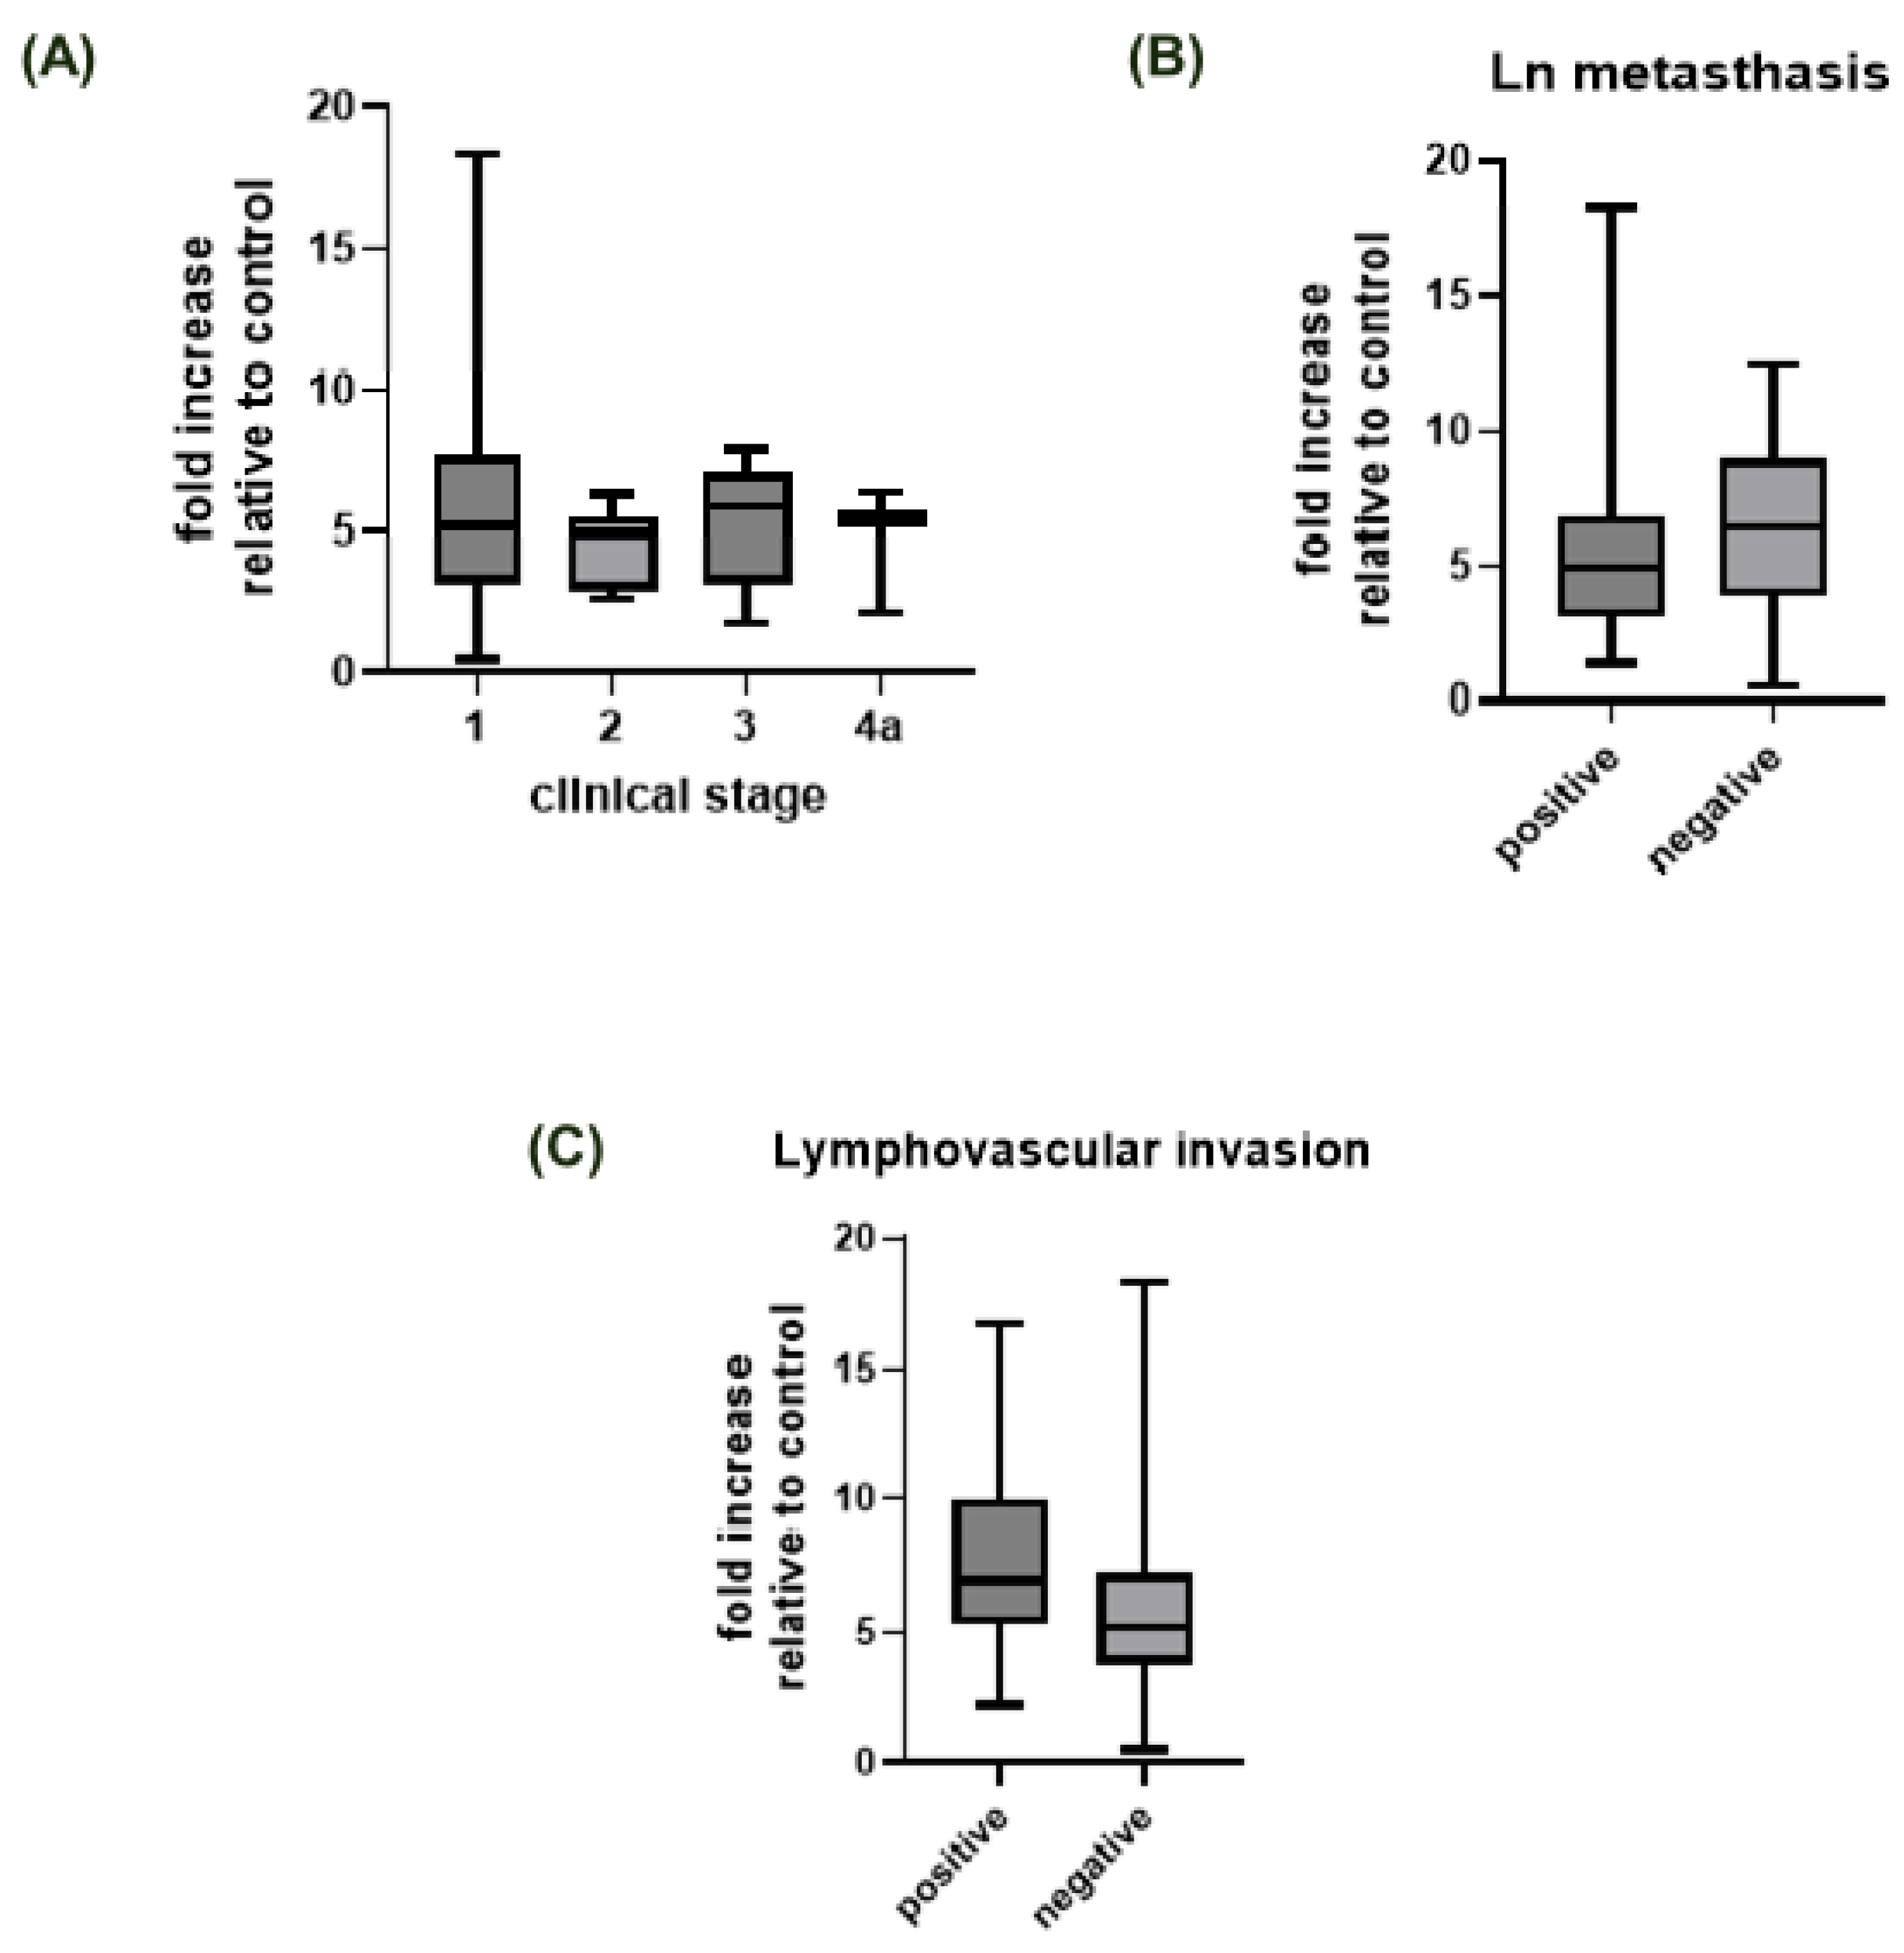
| Clinical stage | 0.299 a | |||
| I | 51 | 5 (3–8) | 0–18 | - |
| II | 8 | 5 (3–5.75) | 3–6 | - |
| III | 9 | 6 (3–7) | 2–8 | - |
| IVa | 3 | 5 (2–/) | 2–6 | - |
| Missing | 4 | |||
| Lymph node status | 0.443 a | |||
| Positive | 9 | 5 (3–7) | 1–18 | - |
| Negative | 63 | 6 (3.50–9) | 0–12 | - |
| Missing | 3 | - | ||
| Invasion of blood or lymph vessels | 0.396 a | |||
| Positive | 6 | 7 (5–10.25) | 2–17 | - |
| Negative | 48 | 5 (4–7) | 0–18 | - |
| Missing | 21 | - | ||
| ST6GAL1 Expression | |||||
|---|---|---|---|---|---|
| Variable | N | Median (Q1–Q3) | Min–Max | p-Value | Post Hoc p-Value * |
| Sample type | 0.008 a | ||||
| Primary and metastatic tumors | 468 | 11.25 (10.28–12.33) | 7.80–16.67 | - | |
| Normal tissue (GTEx) | 279 | 11.12 (10.72–11.51) | 0–14.14 | - | |
| Histological type | 5.50 × 10⁻⁶ a | ||||
| PTC | 366 | 10.30 (9.48–10.41) | 7.20–15.93 | - | |
| FVPTC | 102 | 11.52 (10.23–12.61) | 7.12–15.81 | - | |
| Clinical stage | 0.036 b | ||||
| I | 273 | 10.62 (9.64–11.66) | 7.42–15.93 | I–II: 0.685 | |
| I–III: 0.610 | |||||
| I–IVa: 0.099 | |||||
| II | 51 | 10.84 (9.70–12.24) | 7.27–14.45 | II–III: 0.267 | |
| II–IVa: 0.042 | |||||
| III | 92 | 10.41 (9.62–11.28) | 7.20–15.14 | III–IVa: 0.592 | |
| IVa | 42 | 9.87 (8.95–11.24) | 7.68–13.67 | ||
| Lymph node metastasis status | 1.57 × 10⁻⁴ a | ||||
| Positive | 198 | 10.26 (9.38–11.25) | 7.51–13.67 | - | |
| Negative | 160 | 10.82 (9.78–12.07) | 7.20–15.81 | - | |
| Missing | 110 | - | - | - | |
Disclaimer/Publisher’s Note: The statements, opinions and data contained in all publications are solely those of the individual author(s) and contributor(s) and not of MDPI and/or the editor(s). MDPI and/or the editor(s) disclaim responsibility for any injury to people or property resulting from any ideas, methods, instructions or products referred to in the content. |
© 2023 by the authors. Licensee MDPI, Basel, Switzerland. This article is an open access article distributed under the terms and conditions of the Creative Commons Attribution (CC BY) license (https://creativecommons.org/licenses/by/4.0/).
Share and Cite
Gunjača, I.; Benzon, B.; Pleić, N.; Babić Leko, M.; Pešutić Pisac, V.; Barić, A.; Kaličanin, D.; Punda, A.; Polašek, O.; Vukojević, K.; et al. Role of ST6GAL1 in Thyroid Cancers: Insights from Tissue Analysis and Genomic Datasets. Int. J. Mol. Sci. 2023, 24, 16334. https://doi.org/10.3390/ijms242216334
Gunjača I, Benzon B, Pleić N, Babić Leko M, Pešutić Pisac V, Barić A, Kaličanin D, Punda A, Polašek O, Vukojević K, et al. Role of ST6GAL1 in Thyroid Cancers: Insights from Tissue Analysis and Genomic Datasets. International Journal of Molecular Sciences. 2023; 24(22):16334. https://doi.org/10.3390/ijms242216334
Chicago/Turabian StyleGunjača, Ivana, Benjamin Benzon, Nikolina Pleić, Mirjana Babić Leko, Valdi Pešutić Pisac, Ana Barić, Dean Kaličanin, Ante Punda, Ozren Polašek, Katarina Vukojević, and et al. 2023. "Role of ST6GAL1 in Thyroid Cancers: Insights from Tissue Analysis and Genomic Datasets" International Journal of Molecular Sciences 24, no. 22: 16334. https://doi.org/10.3390/ijms242216334
APA StyleGunjača, I., Benzon, B., Pleić, N., Babić Leko, M., Pešutić Pisac, V., Barić, A., Kaličanin, D., Punda, A., Polašek, O., Vukojević, K., & Zemunik, T. (2023). Role of ST6GAL1 in Thyroid Cancers: Insights from Tissue Analysis and Genomic Datasets. International Journal of Molecular Sciences, 24(22), 16334. https://doi.org/10.3390/ijms242216334