Abstract
In this study, pure CeO2 and oxygen-vacancy-enriched SnO2-CeO2 composite materials were prepared using the sol–gel method, and their microstructures and photocatalytic properties were investigated. The results indicate that SnO2 coupling promotes the separation and transfer of photogenerated electrons and holes and suppresses their recombination. The 50% SnO2-CeO2 composite material exhibited a decreased specific surface area compared to pure CeO2 but significantly increased oxygen vacancy content, demonstrating the highest photogenerated charge separation efficiency and the best photocatalytic performance. After 120 min of illumination, the degradation degree of MB by the 50% SnO2-CeO2 composite material increased from 28.8% for pure CeO2 to 90.8%, and the first-order reaction rate constant increased from 0.002 min−1 to 0.019 min−1.
1. Introduction
Catalytic technology powered by light, occurring through a process known as photocatalysis, has found extensive applications in water pollution treatment. Cerium dioxide (CeO2)-based photocatalytic materials have garnered significant attention due to their high catalytic activity, strong stability, cost-effectiveness, and harmlessness to human health [1,2,3,4]. However, pure CeO2 possesses a relatively wide bandgap, which limits its ability to make use of solar energy. Additionally, pure CeO2 suffers from a rapid recombination of photo-generated electrons and holes, leading to low quantum efficiency. Therefore, the key to enhancing CeO2 photocatalytic performance lies in modifying CeO2 to improve solar light utilization and reduce the recombination rate of photogenerated electrons and holes [5,6,7,8].
Commonly employed methods for CeO2 modification include heterojunction construction and defect engineering [9,10,11,12]. Coupling CeO2 with another semiconductor to create a semiconductor heterojunction has proven effective in enhancing CeO2’s photocatalytic performance. The differing positions of the valence and conduction bands between the two semiconductors not only expedite the transfer of photogenerated charges but also reduce the bandgap width of the photocatalytic material, thereby increasing its light absorption range. Semiconductors such as CuO, g-C3N4, and Co3O4 are often used to form semiconductor heterojunctions with CeO2 [13,14,15]. Zhang et al. [13] prepared CuO@CeO2 composite materials via a template-assisted method. The materials exhibited a synergistic effect on the adsorption and activity of ammonia-containing substances, and the synergistic effect became more pronounced with an increasing CuO content. Zhao et al. [14] synthesized g-C3N4-CeO2 composite materials using an in situ pyrolysis method, significantly reducing the recombination rate of photogenerated electrons and holes compared to pure CeO2 and g-C3N4. After 2.5 h of the photocatalytic degradation of BPA, the degradation degree of the composite material reached 94.1%. On the other hand, increasing the concentration of oxygen vacancies (OVs) is a commonly used approach to enhance the physical and chemical properties of semiconductor photocatalysts. OVs not only facilitate the separation of photogenerated electrons and holes and expand the light absorption range but also provide more reaction sites [16,17,18]. Zhang et al. [17] prepared CeO2 modified with oxygen-vacancy-rich Prussian Blue (PB), resulting in a significant increase in Ce3+ content in the modified CeO2, indicating an enhanced quantity of oxygen vacancies. After 60 min of reaction, the PB-modified CeO2 exhibited a degradation degree for norfloxacin that increased from 5.84% to 82.05%. Kong et al. [18] prepared CeO2 through a template method and prepared oxygen-vacancy-rich CeO2 via oxidation-reduction and a steam treatment. The presence of oxygen vacancies increased the light absorption of CeO2 and reduced the recombination rate of the photogenerated electrons and holes. After 25 h of photocatalysis under 200 °C conditions, there was no significant decrease in activity.
In this study, we synthesized oxygen-vacancy-rich SnO2-CeO2 composite materials with varying Sn/Ce molar ratios using the sol–gel method. We evaluated the photocatalytic performance of the samples using methylene blue (MB) as the target pollutant and discussed the impact of bandgap width, separation, transfer, and recombination of photogenerated electrons and holes on photocatalytic performance. Furthermore, we investigated the photocatalytic mechanism for organic pollutant removal through reactive species experiments.
2. Results and Discussion
Figure 1 shows the XRD (X-ray diffraction) patterns of the samples. In the XRD pattern of pure CeO2, diffraction peaks appeared at 2θ values of 28.6°, 33.2°, 47.5°, 57.4°, 69.6°, and 79.1°, corresponding to the (111), (200), (220), (222), (400), and (420) crystal planes of CeO2, respectively [7,19,20]. For pure SnO2, diffraction peaks were observed at 2θ values of 26.7°, 33.8°, 37.9°, 51.8°, 61.1°, 64.6°, and 65.1°, corresponding to the (110), (101), (200), (211), (002), (310), (112), and (301) crystal planes of SnO2, respectively [14,21,22]. When the amount of Sn added to the CeO2 sample exceeded 30%, diffraction peaks of SnO2 began to appear, indicating that the sample was a two-phase composite material of CeO2 and SnO2. In the 10% SC sample, no diffraction peaks of SnO2 were observed, possibly because the amount of Sn added was too low, and SnO2 was present in the sample In the form of dispersed small particles, making It difficult to detect the characteristic peaks of SnO2 [23]. The absence of any other diffraction peaks in all the samples indicates that the prepared samples had relatively high purity. The crystallinity of the 50% SC sample was the poorest among all the samples; notably, appropriate surface defects can enhance the photocatalytic performance of a sample [24].

Figure 1.
XRD patterns of samples.
Figure 2 displays SEM images of the samples. In the figure, it can be observed that pure CeO2 exhibits a porous structure with evident aggregation. The aggregation phenomenon was not alleviated in the case of SnO2 coupling. Notably, the composite samples have larger pore diameters compared to pure CeO2.
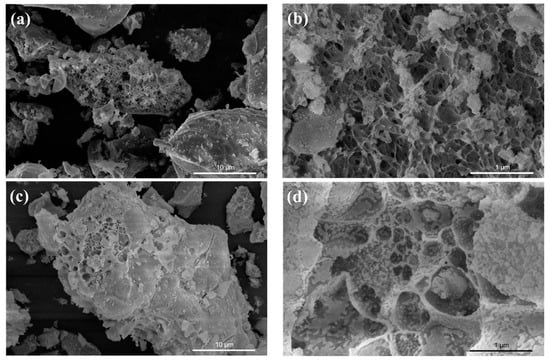
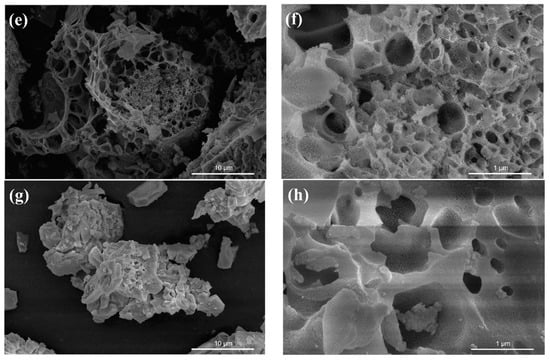
Figure 2.
SEM images of PC (a,b), 10% SC (c,d), 30% SC (e,f), and 50% SC (g,h).
Figure 3 shows the element distribution mappings and EDS (energy-dispersive X-ray spectroscopy) spectra of 50% SC, confirming the presence of O, Sn, and Ce in the samples, distributed relatively uniformly in the matrix.
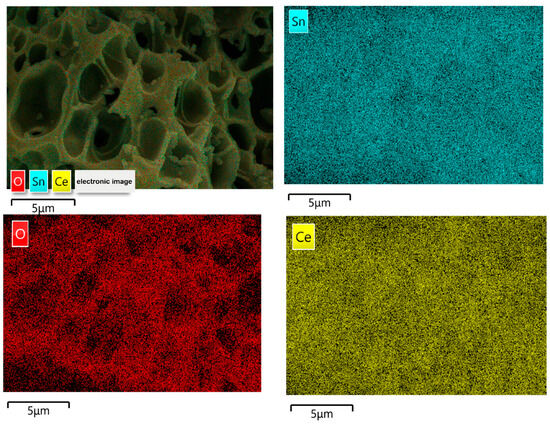
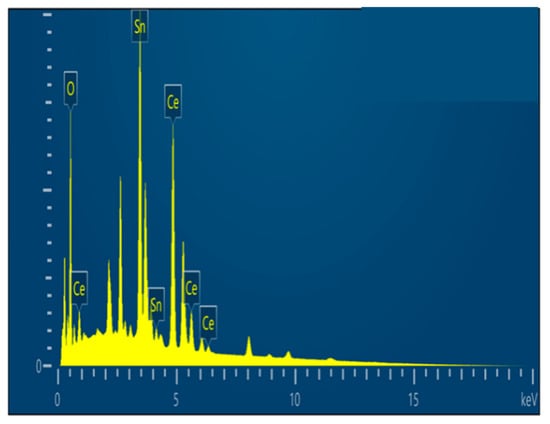
Figure 3.
Element distribution mappings and EDS spectra of 50% SC.
Figure 4 presents TEM (transmission electron microscopy) images of the samples. In Figure 4a, the sample consists of numerous particle-shaped pieces of CeO2 and some rod-shaped pieces of CeO2, displaying clear lattice fringes, indicating good crystallinity. The labeled interplanar spacing of 0.314 nm in Figure 4b corresponds to the (111) crystal plane of CeO2 [25,26]. In Figure 4c, most of the samples appear rod-shaped, and the labeled interplanar spacings of 0.314 nm and 0.336 nm correspond to the (111) crystal plane of CeO2 and the (110) crystal plane of SnO2 [19,27,28], respectively, confirming that the 50% SC sample is a CeO2-SnO2 composite material, in accordance with the XRD test results.

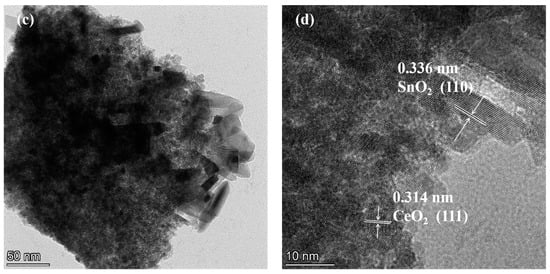
Figure 4.
TEM and HRTEM images of PC (a,b) and 50% SC (c,d).
Figure 5 presents the N2 adsorption–desorption isotherms of the samples. In Figure 5a, it is evident that the pore size of PC mainly centers around 4.7 nm, while the pore sizes of the 30% SC and 50% SC composite materials predominantly center around 14.5 nm and 8.1 nm, respectively, indicating that SnO2 coupling was able to increase the pore size of the samples. The specific surface area of PC is 51.2 m2/g, while that of the 30% SC and 50% SC samples is 60.7 m2/g and 4.1 m2/g, respectively. The specific surface area of the 30% SC sample increased compared to PC, but that of the 50% SC sample decreased, possibly due to the lower crystallinity and significant aggregation in the 50% SC sample, resulting in a relatively lower specific surface area compared to PC.

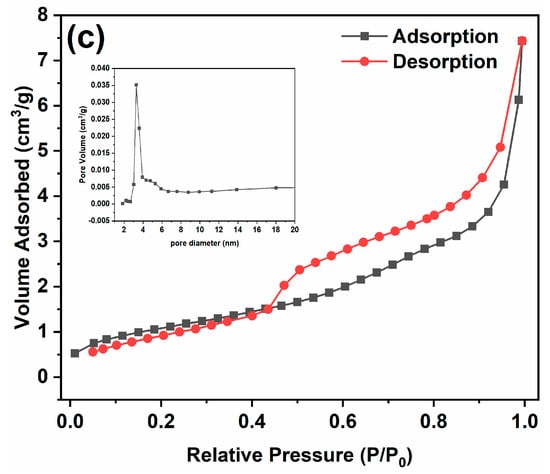
Figure 5.
N2 adsorption desorption isotherms of the samples: PC (a), 30% SC (b), and 50% SC (c).
Figure 6 presents the XPS (X-ray photoelectron spectroscopy) spectra of the samples. Figure 6a shows the survey spectrum of 50% SC, which reveals peaks corresponding to C, Ce, O, and Sn in the sample. Figure 6b displays the Ce 3d spectrum of 50% SC, showing five distinct peaks at binding energies of 881.9 eV, 885.7 eV, 904.3 eV, 900.3 eV, and 916.3 eV. The peaks at 881.9 eV, 885.7 eV, and 904.3 eV correspond to Ce3+ states, while the peaks at 900.3 eV and 916.3 eV belong to Ce4+ states [1,29,30]. Generally, CeO2 is a fluorite-type oxide with Ce4+ occupying its face-centered cubic lattice in its crystal cell and O2− in tetrahedral positions. Thus, each Ce4+ is surrounded by eight O2−s, with O2− primarily coordinating with Ce4+. The presence of Ce3+ indicates the generation of oxygen vacancies in the material, which is consistent with the photoluminescence (PL) description [1,24,31]. As shown in Figure 6c, the Sn 3D spectrum of 50% SC exhibits peaks at binding energies of 486.4 eV and 494.9 eV, corresponding to Sn 3d5/2 and Sn 3d3/2, respectively, indicating Sn in the +4 state [32,33]. Figure 6d displays the O 1s peaks of 50% SC, with peaks at binding energies of 531.7 eV, 530.5 eV, and 533.0 eV corresponding to lattice oxygen (OL), oxygen vacancies (OVs), and chemisorbed oxygen-containing species (OC) [34,35,36]. The content of oxygen vacancies can be estimated using the following formula: SOVs/S. Here, S represents the total area of the O 1s region, and SOVs represents the peak area of oxygen vacancies on the sample surface [37,38]. Through calculation, the oxygen vacancy content was found to be 46.1%. Figure 6e shows the O 1s peaks of 30% SC, and the calculated oxygen vacancy content is 14.2%. The oxygen vacancy content significantly increased in 50% SC compared to 30% SC. In general, oxygen vacancies can serve as traps and adsorption sites for charge carriers, preventing their recombination. A higher oxygen vacancy content typically results in more pronounced effects [16,39]. Wu et al. [40] utilized UV irradiation to prepare oxygen-vacancy-rich CeO2, with increased oxygen vacancy content promoting carrier separation and increasing quantum lifetimes. The photocatalytic reduction of CO2 was achieved with an efficiency of 87.4 μmol g−1 h−1, which is twenty times higher than that of the sample without UV treatment. Grabchenko et al. [41] used various methods to prepare Ag/CeO2 photocatalysts, and all the resulting Ag/CeO2 samples showed an increase in oxygen vacancy concentration compared to pure CeO2, leading to improved catalytic activity in the oxidation of CO and particulate matter.
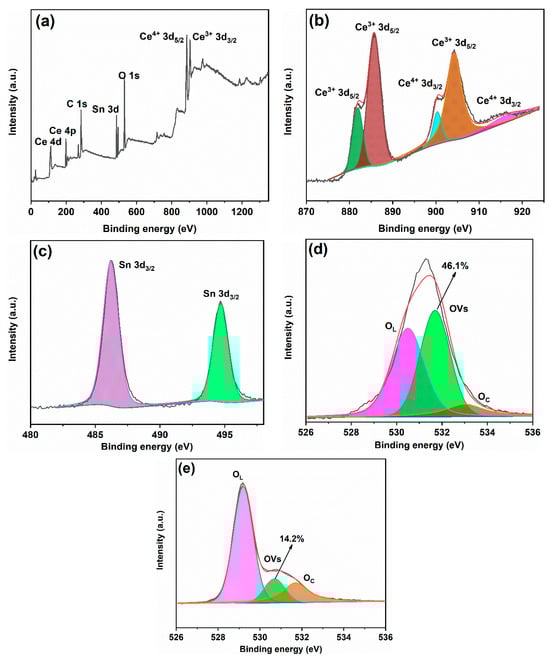
Figure 6.
XPS spectra of 50% SC (a–d) and 30% SC (e).
Figure 7 depicts the UV–Visible absorption spectra (a) and bandgap width (b) of the samples. PC exhibits strong absorption in the ultraviolet region, with a decrease in light absorption when the wavelength exceeds 400 nm, resulting in less visible light absorption. After the addition of SnO2, there was a reduction in UV absorption in the samples. Notably, 50% SC shows the lowest level of UV absorption but a significant increase in visible light absorption. This may be because the SnO2 covering the surface of CeO2 reduces UV light absorption, while the formation of a heterojunction between the two materials when they come into contact reduces their bandgap width, leading to increased visible light absorption [23]. The bandgap width of PC was calculated to be 2.93 eV.
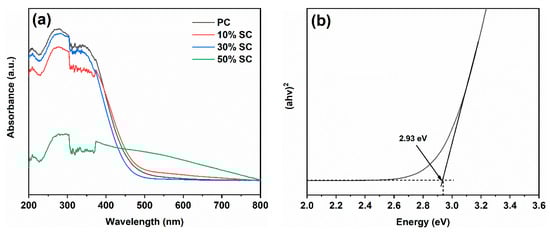
Figure 7.
UV–visible absorption spectra (a) and band gap of PC (b).
The recombination of photogenerated electrons and holes has a significant impact on the performance of photocatalytic materials. The smaller the number of recombination instances, the greater the number of available carriers available, and this state is advantageous for generating more free radicals. When photo-generated electrons and holes recombine, photons are emitted, giving rise to a peak in photoluminescence (PL). The higher the intensity of the peak, the greater the amount of recombination that occurs. Figure 8 shows the photoluminescence spectra of the samples. PC exhibits the highest peak intensity, and after the addition of SnO2, the recombination rate of photogenerated electrons and holes in the samples decreases, indicating that SnO2 coupling is beneficial for suppressing the recombination of photogenerated electrons and holes and enhancing quantum efficiency. This may be because the conduction and valence band positions of SnO2 and CeO2 are different. Photogenerated electrons transfer from the conduction band position of one semiconductor (closer to the top) to that of another semiconductor, while photogenerated holes transfer from the valence band position of one semiconductor (closer to the bottom) to that of another semiconductor, thus suppressing the recombination of photogenerated electrons and holes. Noticeable diffraction peaks appear in the 450–470 nm region, possibly due to photoluminescence resulting from the recombination of photogenerated electrons in oxygen vacancies or crystal defects. It is worth noting that 50% SC has the lowest peak intensity in this region, indicating that the material’s surface has more uncombined oxygen vacancies, a finding that is consistent with the XPS results [42,43,44].
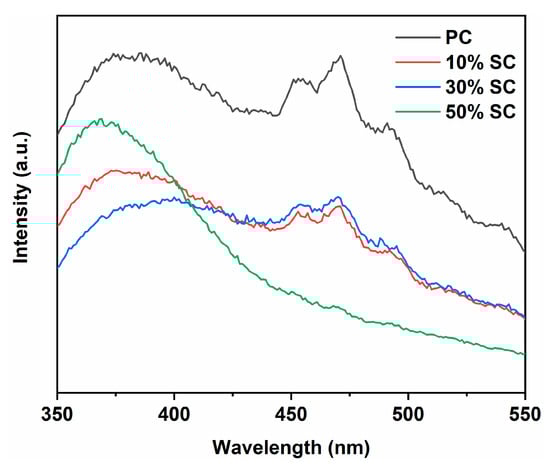
Figure 8.
Photoluminescence spectra of samples.
The photocatalytic performance of the samples was evaluated based on the degradation degree of MB, and the degradation degrees of MB as well as the first-order reaction kinetic curves are shown in Figure 9. In Figure 9a, it is evident that after 120 min of illumination, PC achieved a degradation degree of 28.8% with respect to MB, while 10% SC, 30% SC, and 50% SC achieved degradation degrees of 36.8%, 48.7%, and 90.8%, respectively. The coupling of SnO2 with CeO2 resulted in improved degradation degrees of MB, indicating that SnO2 coupling can enhance the photocatalytic performance of CeO2. Moreover, the higher the Sn/Ce molar ratio, the more significant the improvement.
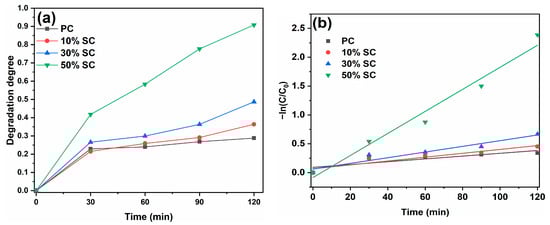
Figure 9.
Photodegradation curves (a) and kinetics fitting curves (b) of samples.
The degradation of organic pollutants on the surface of a photocatalyst follows a first-order reaction model: ln(C0/Ct) = kKt = kapp × t. Here, C0 is the initial absorbance of the pollutant, Ct is the absorbance at time t, k is the physical constant of the reaction system, K is the photodegradation degree constant of the reactant, t is the reaction time, and kapp is the first-order reaction rate constant [2]. The first-order reaction rate constants (kapp) for PC, 10% SC, 30% SC, and 50% SC are 0.002 min−1, 0.003 min−1, 0.005 min−1, and 0.019 min−1, respectively, which are consistent with the photocatalytic degradation curves. The highest first-order reaction rate constant was observed for 50% SC, which could be attributed to its lower recombination rate of photogenerated charges, with defects like oxygen vacancies, and its higher oxygen vacancy content, resulting in its optimal photocatalytic performance.
To investigate the stability of the 50% SC sample, cyclic experiments were performed, and the results are shown in Figure 10. According to the figure, even after four cycles of degradation, the degradation efficiency towards MB remained 83.7%. This indicates that the photocatalytic stability of the sample was relatively high.
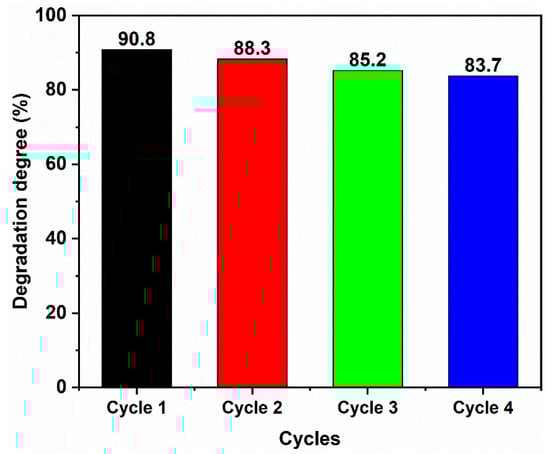
Figure 10.
The cyclic experiment of 50% SC photocatalyst for MB degradation.
Table 1 summarizes the degradation degrees of the CeO2-based photocatalytic materials towards MB as shown in the literature, from which it can be seen that the 50% SC obtained in the present work demonstrates considerable photocatalytic activity.

Table 1.
Summary of MB degradation degrees of CeO2 reported in the literature.
The results of the active species experiment for 50% SC are presented in Figure 11. Upon adding BQ, IPA, and AO, the degradation degree of MB in the sample decreased, with the most significant decrease observed when AO was added, reducing the degradation degree from 90.8% to 51.8%. This suggests that h+ is the main active species in the photocatalytic process. Additionally, the degradation degrees of the sample decreased from 90.8% to 82.2% and 78.2% when BQ and IPA were added, respectively, indicating the participation of superoxide radicals ·O2− and hydroxyl radicals ·OH in the photocatalytic degradation.
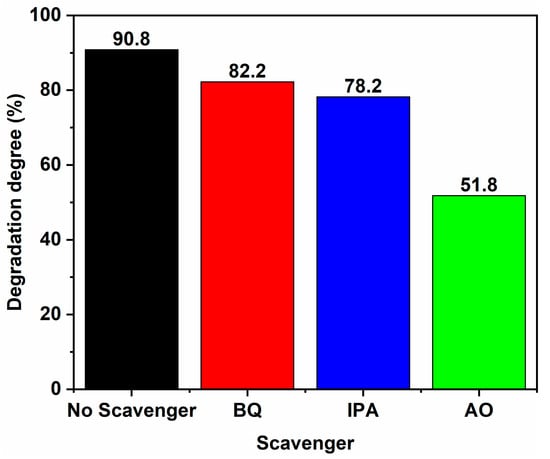
Figure 11.
Degradation degrees of 50% SC in the presence of different trapping agents.
Electrochemical tests were conducted on PC and 50% SC, and the results are shown in Figure 12. When light shines on the surface of a material, photons interact with electrons in the corresponding sample. The free electrons in the sample can be excited to higher energy levels by photons, forming excited-state electrons. These excited-state electrons can move inside the material and generate a current due to the electric field within the material or an externally applied voltage. By introducing electrodes and an external circuit, it is possible to collect and measure the current generated by the excited-state electrons. The photocurrent density of 50% SC is higher than that of PC, indicating that 50% SC has a higher charge separation efficiency for photogenerated electrons and holes. The Nyquist diameter of 50% SC is smaller than that of PC, suggesting lower resistance to charge transfer during photogenerated charge transfer in 50% SC, resulting in higher charge transfer efficiency [51,52,53]. The electrochemical test results indicate that SnO2 coupling can promote the separation and transfer of photogenerated electrons and holes in CeO2, improving quantum efficiency. Additionally, the PL results indicate that SnO2 coupling can inhibit the recombination of photogenerated electrons and holes in CeO2, further enhancing photocatalytic performance.
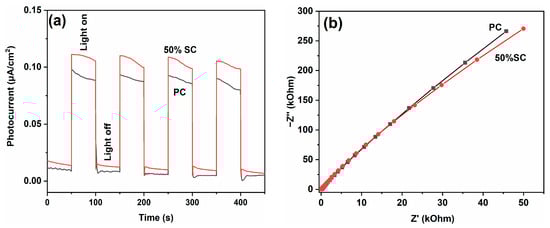
Figure 12.
Photocurrents (a) and EIS spectra (b) of PC and 50% SC.
To determine the valence band position of PC, XPS valence band spectra were obtained, as shown in Figure 13. The valence band position of PC was found to be 2.75 eV. Using the formula ENEH = Φ + EVL/eV − 4.44 to calculate the valence band position under standard hydrogen electrode (SHE) conditions, where ENEH is the SHE potential, Φ is the work function of the instrument (4.30 eV), and EVL is the valence band position measured under vacuum conditions [53,54,55], the valence band position of PC under SHE conditions was obtained, amounting to 2.61 eV. Combined with the bandgap width of 2.93 eV for PC, its conduction band position was determined to be −0.32 eV. For PS, the valence band position was 3.66 eV, and the bandgap width was 3.80 eV, so its conduction band position was −0.14 eV [56].
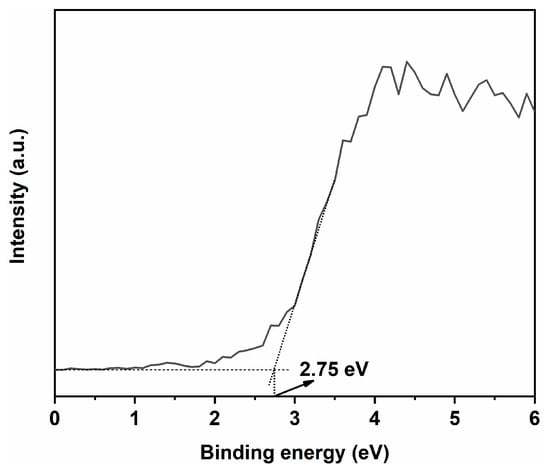
Figure 13.
XPS valence band spectrum of CeO2.
Based on the valence band and conduction band potentials of PC and PS, as well as the results of active free radical detection, a schematic diagram of photoinduced charge transfer and free radical generation for 50% SC is presented in Figure 14. Both semiconductor composites could be either Type II or Z-scheme semiconductors. We believe that if charge transfer in 50% SC occurred via a Z-scheme semiconductor mechanism, the electrons in the SnO2 conduction band would directly recombine with the holes in the CeO2 valence band, leading to a significant consumption of photogenerated holes in the CeO2 sample. According to experiments on active species, h+ is the primary active species, suggesting that charge transfer in the sample is unlikely to occur via the Z-scheme semiconductor mechanism. On the other hand, when charge transfer occurs via a Type II semiconductor mechanism, several phenomena take place. First, band alignment between the two semiconductors occurs. The bottom energy level of the CeO2 conduction band is higher than that of the SnO2 conduction band, while the top energy level of the valence band is relatively lower. This band alignment results in the formation of a positive charge in CeO2’s conduction band and a negative charge in SnO2’s valence band, creating an internal electric field pointing from CeO2 to SnO2. When 50% SC is exposed to light with an energy greater than 2.93 eV, electrons are excited and thus move from the valence band (VB) of CeO2 to the conduction band (CB) of CeO2, producing photogenerated electrons (e−) with higher activity. Concurrently, photogenerated holes (h+) are created in the valence band, and under the influence of the internal electric field, photogenerated electrons and holes move separately towards CeO2 and SnO2, respectively. The conduction band potential (ECB) of 50% SC (−0.14 eV) is lower (more negative) than the electrode potential for the reaction of O2 with electrons that leads to the formation of ·O2− (O2/·O2− −0.046 eV), indicating that the conduction band electrons have sufficient reducing power to reduce O2 to ·O2−: O2 + e− → ·O2−. Additionally, the valence band potential (EVB) of 50% SC (2.61 eV) is higher (more positive) than the potential for the reaction of valence band holes (h+) with OH− that leads to the formation of ·OH (OH−/·OH 1.99 eV) [57,58,59,60], suggesting that some valence band holes have sufficient oxidative power to oxidize OH− to ·OH radicals, following the reaction OH− + h+ → ·OH. From experiments with active species, it is evident that ·O2− and ·OH play a secondary role in the photodegradation of MB, indicating that there are more unreacted h+ species. This is because some valence band holes in SnO2 transfer to the valence band of CeO2, resulting in only a portion of the holes reacting with OH− and thus generating ·OH, while the remaining h+ species participate in the photodegradation reaction. In photocatalytic reactions, photogenerated electrons and holes are key intermediates. When photogenerated electrons are excited and thus move to the conduction band, oxygen vacancies can capture these electrons, preventing them from recombining with holes, thus promoting the separation of photogenerated electrons and holes [16,17]. More photo-generated charges can migrate to the surface of the material, and photogenerated charges on the material surface have more opportunities to interact with oxygen and hydroxyl groups, participating in photocatalytic reactions.
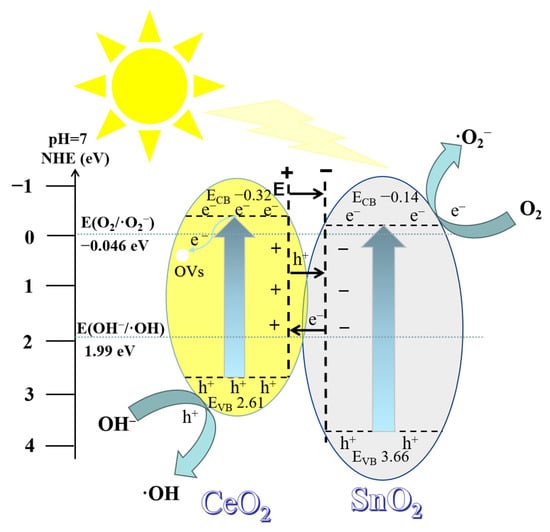
Figure 14.
Schematic diagram of charge transfer and free radical formation via light in 50% SC.
3. Materials and Methods
First, 10.85 g of cerium nitrate was dissolved in a certain amount of deionized water to prepare 100 mL of solution A. Subsequently, 7.21 g of citric acid was weighed, and while stirring solution A, citric acid was slowly added to it to prepare a mixed solution B. Solution B was placed on a magnetic stirrer and stirred for one hour to ensure complete dissolution. After aging and gelling, solution B was then placed in a drying oven at 100 °C for 10 h to obtain pure CeO2, labeled as PC. Additionally, according to Sn/Ce molar ratios of 10%, 30%, and 50%, precisely measured amounts of 0.88 g, 2.63 g, and 4.38 g of SnCl4·5H2O, respectively, were weighed and slowly added to solution A while stirring. The subsequent steps were the same as above, resulting in SnO2 coupled with CeO2 samples. The samples with 10%, 30%, and 50% SnO2 content were labeled as 10% SC, 30% SC, and 50% SC. To prepare pure tin dioxide, labeled as PS, 3.50 g of SnCl4·5H2O was dissolved in deionized water to make up 100 mL of solution C. Subsequently, 7.21 g of citric acid was added, and after thorough stirring, solution D was prepared. After aging and gelling, solution D was placed in a drying oven at 100 °C for 10 h.
The crystal structures and compositions of the samples were analyzed using an X-ray diffractometer (XRD), specifically a DX-2700. Additionally, a Hitachi SU8220 scanning electron microscope (SEM) was used for further characterization. A specific surface area measurement was performed using an ASAP2460 analyzer based on the Brunauer–Emmett–Teller (BET) method. The samples’ microscopic morphologies were examined using a JEM-F200 transmission electron microscope (TEM) and a high-resolution transmission electron microscope (HRTEM). The samples’ elemental compositions and chemical states were analyzed using the XSAM800 multifunctional surface analysis system (XPS). Photoluminescence (PL) spectra were measured using an F-4600 fluorescence spectrophotometer equipped with a 320 nm laser wavelength Xenon lamp. For the analysis of light absorption properties, a UV-3600 UV–Visible spectrophotometer was used. Electrochemical performance was assessed using a Chinese DH7000 electrochemical workstation.
The photocatalytic performance of the samples was evaluated based on the degradation degree of the MB solution. In total, 0.1 g of the sample was added to 100 mL of an MB solution and stirred. A Xe lamp was used as the light source, and samples were taken every 30 min. The centrifuged samples were then tested for absorbance at a wavelength of 664 nm, and the degradation degree was calculated using the following formula: (A0 − At)/A0 × 100%. In addition to the MB degradation system, 2 mL portions of 0.1 mol/L solutions of p-benzoquinone (BQ, ·O2− scavenger), isopropanol (IPA, ·OH scavenger), and ammonium oxalate (AO, h+ scavenger) were separately added to investigate the active functional groups.
4. Conclusions
Pure CeO2 was prepared using the sol–gel method, and on this basis, SnO2 was successfully coupled to synthesize a SnO2-CeO2 composite material rich in oxygen vacancies. The results indicate that the specific surface area of the SnO2-coupled sample is larger than that of pure CeO2, suggesting that the addition of SnO2 can enhance the separation and transfer of photogenerated charges while also suppressing their recombination. The presence of oxygen vacancies further promoted the separation of photogenerated charges. The photocatalytic performance of the samples was evaluated using MB as a test pollutant. All the composite samples exhibited improved photocatalytic performance compared to pure CeO2, with 50% SC showing the best performance. After 120 min of illumination, 50% SC achieved a degradation degree of 90.8% for MB, demonstrating its excellent photocatalytic activity. In this study, by introducing oxygen vacancies through high-temperature calcination on the foundation of semiconductor-coupled cerium dioxide’s conduction band, the sample material’s photocatalytic performance was significantly enhanced. The introduction of oxygen vacancies altered the material’s microstructure, strengthening its ability to separate photogenerated charge carriers. This improvement in charge separation efficiency led to increased photocatalytic reaction efficiency. This study provides a reference for the preparation of oxygen-deficient type II semiconductor structures. Photocatalytic materials based on cerium dioxide hold promise as highly efficient and environmentally friendly solutions. They have the potential to make significant contributions to controlling water pollution and achieving the sustainable utilization of clean water resources.
Author Contributions
Conceptualization, D.Y., X.Z. and W.F.; methodology, X.Z.; data analysis, L.Z. and Y.X.; investigation, Y.X. and W.F.; writing—original draft preparation, D.Y. and Y.X.; writing—review and editing, W.F. and X.Z.; performance of experiments, J.L.; supervision, X.Z. and W.F.; project administration, X.Z. All authors have read and agreed to the published version of the manuscript.
Funding
This study was supported by the Opening Project of Material Corrosion and Protection Key Laboratory of Sichuan Province (2023CL20, 2023CL01), the Higher Education Talent Quality and Teaching Reform Project of Sichuan Province (JG2021-1104), and the Talent Training Quality and Teaching Reform Project of Chengdu University (cdjgb2022033).
Institutional Review Board Statement
Not applicable.
Informed Consent Statement
Not applicable.
Data Availability Statement
Not applicable.
Conflicts of Interest
The authors declare no conflict of interest.
References
- Huo, Q.; Liu, G.; Sun, H.; Fu, Y.; Ning, Y.; Zhang, B.; Zhang, X.; Gao, J.; Miao, J.; Zhang, X. CeO2-Modified MIL-101(Fe) for photocatalysis extraction oxidation desulfurization of model oil under visible light irradiation. Chem. Eng. J. 2021, 422, 130036. [Google Scholar] [CrossRef]
- Cui, Z.; Zhang, L.; Xue, Y.; Xue, Y.; Feng, Y.; Wang, M.; Chen, J.; Ji, B.; Wang, C.; Xue, Y. Effects of shape and particle size on the photocatalytic kinetics and mechanism of nano-CeO2. Int. J. Min. Met. Mater. 2022, 29, 2221–2231. [Google Scholar] [CrossRef]
- Hu, C.; Jing, K.-Q.; Lin, X.-Q.; Sun, J.; Xu, Z.-N.; Guo, G.-C. Oxygen vacancy in CeO2 facilitate the catalytic activity of Pd/CeO2 for CO direct esterification to dimethyl oxalate. Catal. Lett. 2022, 152, 503–512. [Google Scholar] [CrossRef]
- Usharani, S.; Rajendran, V. Morphologically Controlled Synthesis, Structural and optical properties of CeO2/SnO2 nanocomposites. J. Sci-Adv. Mater. Dev. 2017, 2, 333–339. [Google Scholar]
- Matussin, S.N.; Harunsani, M.H.; Khan, M.M. CeO2 and CeO2-Based nanomaterials for photocatalytic, antioxidant and antimicrobial activities. J. Rare Earth. 2023, 41, 167–181. [Google Scholar] [CrossRef]
- Zhao, W.; Rong, J.; Luo, W.; Long, L.; Yao, X. Enhancing the K-Poisoning resistance of CeO2-SnO2 catalyst by hydrothermal method for NH3-SCR reaction. Appl. Surf. Sci. 2022, 579, 152176. [Google Scholar] [CrossRef]
- Zou, W.; Deng, B.; Hu, X.; Zhou, Y.; Pu, Y.; Yu, S.; Ma, K.; Sun, J.; Wan, H.; Dong, L. Crystal-Plane-Dependent metal oxide-support interaction in CeO2/g-C3N4 for photocatalytic hydrogen evolution. Appl. Catal. B-Environ. 2018, 238, 111–118. [Google Scholar] [CrossRef]
- Wen, X.-J.; Niu, C.-G.; Zhang, L.; Liang, C.; Zeng, G.-M. A Novel Ag2O/CeO2 heterojunction photocatalysts for photocatalytic degradation of enrofloxacin: Possible degradation pathways, mineralization activity and an in depth mechanism insight. Appl. Catal. B-Environ. 2018, 221, 701–714. [Google Scholar] [CrossRef]
- Liu, Y.; Luo, L.; Gao, Y.; Huang, W. CeO2 morphology-dependent NbOx–CeO2 interaction, structure and catalytic performance of NbOx/CeO2 catalysts in oxidative dehydrogenation of propane. Appl. Catal. B-Environ. 2016, 197, 214–221. [Google Scholar] [CrossRef]
- Ma, H.; Yang, W.; Tang, H.; Pan, Y.; Li, W.; Fang, R.; Shen, Y.; Dong, F. Enhance the stability of oxygen vacancies in SrTiO3 via metallic Ag modification for efficient and durable photocatalytic NO abatement. J, Hazard, Mater. 2023, 452, 131269. [Google Scholar] [CrossRef]
- Zheng, Y.; Mao, D.; Sun, S.; Fu, G. CO oxidation on CuO/CeO2 catalyst prepared by solvothermal synthesis: Influence of catalyst activation temperature. J. Nanopart. Res. 2015, 17, 471. [Google Scholar] [CrossRef]
- Bai, J.; Zhang, B.; Xiong, T.; Jiang, D.; Ren, X.; Lu, P.; Fu, M. Enhanced visible light driven photocatalytic performance of Bi2WO6 nano-catalysts by introducing oxygen vacancy. J. Alloys Compd. 2021, 887, 161297. [Google Scholar] [CrossRef]
- Zhang, X.; Wang, H.; Jiang, X.; Sun, H.; Qu, Z. Study of synergistic effect between CuO and CeO2 over CuO@CeO2 core–shell nanocomposites for NH3-SCO. Catal. Sci. Technol. 2019, 9, 2968–2981. [Google Scholar] [CrossRef]
- Zhao, W.; She, T.; Zhang, J.; Wang, G.; Zhang, S.; Wei, W.; Yang, G.; Zhang, L.; Xia, D.; Cheng, Z.; et al. A novel Z-scheme CeO2/g-C3N4 heterojunction photocatalyst for degradation of Bisphenol A and hydrogen evolution and insight of the photocatalysis mechanism. J. Mater. Sci. Technol. 2021, 85, 18–29. [Google Scholar] [CrossRef]
- Liotta, L.F.; Di Carlo, G.; Pantaleo, G.; Venezia, A.M.; Deganello, G. Co3O4/CeO2 composite oxides for methane emissions abatement: Relationship between Co3O4–CeO2 interaction and catalytic activity. Appl. Catal. B-Environ. 2006, 66, 217–227. [Google Scholar] [CrossRef]
- Hao, L.; Huang, H.; Zhang, Y.; Ma, T. Oxygen vacant semiconductor photocatalysts. Adv. Funct. Mater. 2021, 31, 2100919. [Google Scholar] [CrossRef]
- Zhang, Y.; Xiao, R.; Wang, S.; Zhu, H.; Xiong, J. Oxygen vacancy enhancing Fenton-like catalytic oxidation of norfloxacin over prussian blue modified CeO2: Performance and mechanism. J. Haz. Mat. 2020, 398, 122863. [Google Scholar] [CrossRef]
- Kong, J.; Xiang, Z.; Li, G.; An, T. Introduce oxygen vacancies into CeO2 catalyst for enhanced coke resistance during photothermocatalytic oxidation of typical VOCs. Appl. Catal. B-Environ. 2020, 269, 118755. [Google Scholar] [CrossRef]
- Motaung, D.E.; Tshabalala, Z.P.; Makgwane, P.R.; Mahmoud, F.A.; Oosthuizen, D.N.; Cummings, F.R.; Leshabane, N.; Hintsho-Mbita, N.; Li, X.; Ray, S.S.; et al. Multi-functioning of CeO2-SnO2 heterostructure as room temperature ferromagnetism and chemiresistive sensors. J. Alloys Compd. 2022, 906, 164317. [Google Scholar] [CrossRef]
- Liu, G.; Cui, Z.; Han, M.; Zhang, S.; Zhao, C.; Chen, C.; Wang, G.; Zhang, H. Ambient electrosynthesis of ammonia on core–shell structure Au@CeO2 catalyst: Contribution of oxygen vacancies in CeO2. Chemistry 2019, 25, 23. [Google Scholar]
- Matussin, S.N.; Khan, M.M. Phytogenic fabrication of CeO2@SnO2 heterojunction nanostructures for antioxidant studies. Chem. Pap. 2022, 76, 2071–2084. [Google Scholar] [CrossRef]
- Asaithambi, S.; Sakthivel, P.; Karuppaiah, M.; Yuvakkumar, R.; Balamurugan, K.; Ahamad, T.; Khan, M.A.M.; Ramalingam, G.; Mohammed, M.K.A.; Ravi, G. Preparation of Fe-SnO2@CeO2 nanocomposite electrode for asymmetric supercapacitor device performance analysis. J. Energy Storage 2021, 36, 102402. [Google Scholar] [CrossRef]
- Tang, M.; Yang, D.; Wang, J.; Zhou, Q.; Zhu, X.; Jiao, Y. Effects of Cu doping on the phase transition and photocatalytic activity of anatase/rutile mixed crystal TiO2 nanocomposites. Mater. Res. Express. 2021, 8, 085007. [Google Scholar] [CrossRef]
- Li, X.; Zhu, W.; Lu, X.; Zuo, S.; Yao, C.; Ni, C. Integrated nanostructures of CeO2/Attapulgite/g-C3N4 as efficient catalyst for photocatalytic desulfurization: Mechanism, kinetics and influencing factors. Chem. Eng. J. 2017, 326, 87–98. [Google Scholar] [CrossRef]
- Manibalan, G.; Murugadoss, G.; Thangamuthu, R.; Kumar, M.R.; Kumar, R.M. Facile synthesis of CeO2-SnO2 nanocomposite for electrochemical determination of L-cysteine. J. Alloys Compd. 2019, 792, 1150–1161. [Google Scholar] [CrossRef]
- Ema, T.; Choi, P.G.; Takami, S.; Masuda, Y. Facet-controlled synthesis of CeO2 nanoparticles for high-performance CeO2 nanoparticle/SnO2 nanosheet hybrid gas sensors. ACS Appl. Mater. Interfaces 2022, 14, 56998–57007. [Google Scholar] [CrossRef] [PubMed]
- Mohammad, A.; Ehtisham Khan, M.; Alarifi, I.M.; Hwan Cho, M.; Yoon, T. A sensitive electrochemical detection of hydrazine based on SnO2/CeO2 nanostructured oxide. Microchem. J. 2021, 171, 106784. [Google Scholar] [CrossRef]
- Jawaher, K.R.; Indirajith, R.; Krishnan, S.; Robert, R.; Pasha, S.K.K.; Deshmukh, K.; Das, S.J. Hydrothermal synthesis of CeO2/SnO2 nanocomposites with highly enhanced gas sensing performance towards N-butanol. J. Sci-Adv. Mater. Dev. 2018, 3, 139–144. [Google Scholar]
- Seong, G.; Dejhosseini, M.; Adschiri, T. A kinetic study of catalytic hydrothermal reactions of acetaldehyde with cubic CeO2 nanoparticles. Appl. Catal. A-Gen. 2018, 550, 284–296. [Google Scholar] [CrossRef]
- Zhang, S.; Wang, H.; Si, H.; Jia, X.; Wang, Z.; Li, Q.; Kong, J.; Zhang, J. Novel core−shell (ε-MnO2/CeO2)@CeO2 composite catalyst with a synergistic effect for efficient formaldehyde oxidation. ACS Appl. Mater. Interfaces. 2020, 12, 40285–40295. [Google Scholar] [CrossRef]
- Mohanta, D.; Gupta, S.V.; Gadore, V.; Paul, S.; Ahmaruzzaman, M. SnO2 nanoparticles–CeO2 nanorods enriched with oxygen vacancies for bifunctional sensing performances toward toxic CO gas and arsenate ions. ACS Omega 2022, 7, 20357–20368. [Google Scholar] [CrossRef]
- Park, J.; Zhao, X.; Gu, H. Synthesis and characterization of SnO2 nanostructure using Bombyx mori (L.) silkworm cocoon as biomass template for photocatalytic reaction. Mater. Lett. 2015, 141, 187–190. [Google Scholar] [CrossRef]
- Sukanya, R.; Ramki, S.; Chen, S.-M.; Karthik, R. Ultrasound treated cerium oxide/tin oxide (CeO2/SnO2) nanocatalyst: A feasible approach and enhanced electrode material for sensing of anti-inflammatory drug 5-aminosalicylic acid in biological aamples. Anal. Chim. Acta 2020, 1096, 76–88. [Google Scholar] [CrossRef] [PubMed]
- Zhao, M.; Yang, Y.; Zha, Z.; Cui, S.; Li, Y.; Yang, J. Enhanced photocatalytic performance of layered carbon microsphere/BiOCl composite with oxygen vacancies. J. Alloys Compd. 2022, 928, 167068. [Google Scholar] [CrossRef]
- Liu, C.; Bi, Y.; Wang, H.; Zhang, Z.; Wang, J.; Guo, M.; Liu, Q. Promotional effects on NH3-SCR performance of CeO2–SnO2 catalysts doped by TiO2: A mechanism study. Catal. Surv. Asia 2021, 25, 48–57. [Google Scholar] [CrossRef]
- Li, W.; Liu, H.; Chen, Y. Promotion of transition metal oxides on the NH3-SCR performance of ZrO2-CeO2 Catalyst. Front. Environ. Sci. Eng. 2017, 11, 6. [Google Scholar] [CrossRef]
- Wang, Y.; Deng, K.; Zhang, L. Visible light photocatalysis of BiOI and its photocatalytic activity enhancement by in situ ionic liquid modification. J. Phys. Chem. C 2011, 115, 14300–14308. [Google Scholar] [CrossRef]
- Xiong, J.; Huang, H.; Lin, B.; Xia, J.; Di, J. Lower oxygen vacancy concentration in BiPO4 with unexpected higher photocatalytic activity. Chinese Chem. Lett. 2023, 34, 107844. [Google Scholar] [CrossRef]
- Aggelopoulos, C.A.; Dimitropoulos, M.; Govatsi, A.; Sygellou, L.; Tsakiroglou, C.D.; Yannopoulos, S.N. Influence of the surface-to-bulk defects ratio of ZnO and TiO2 on their UV-mediated photocatalytic activity. Appl. Catal. B-Environ. 2017, 205, 292–301. [Google Scholar] [CrossRef]
- Sun, Y.; Wu, J.; Li, X.; Shi, W.; Xie, Y. Efficient visible-light-driven CO2 reduction realized by defect-mediated BiOBr atomic layers. Angew. Chem. Int. Edit. 2018, 130, 28. [Google Scholar]
- Grabchenko, M.V.; Mamontov, G.V.; Zaikovskii, V.I.; Parola, V.L.; Vodyankina, O.V. The role of metal–support interaction in Ag/CeO2 catalysts for co and soot oxidation. Appl. Catal. B-Environ. 2019, 260, 118148. [Google Scholar] [CrossRef]
- Malleshappa, J.; Nagabhushana, H.; Prasad, B.D.; Sharma, S.C.; Vidya, Y.S.; Anantharaju, K.S. Structural, photoluminescence and thermoluminescence properties of CeO2 nanoparticles. Optik 2016, 127, 855–861. [Google Scholar] [CrossRef]
- Zhu, X.D.; Wang, J.; Yang, D.X.; Liu, J.W.; He, L.L.; Tang, M.; Feng, W.; Wu, X.Q. Fabrication, characterization and high photocatalytic activity of Ag–ZnO heterojunctions under UV-visible light. RSC Adv. 2021, 11, 27257. [Google Scholar] [CrossRef]
- Usharani, S.; Rajendran, V. Optical, magnetic properties and visible light photocatalytic activity of CeO2/SnO2 nanocomposites. Eng. Sci. Technol. 2016, 19, 2088–2093. [Google Scholar] [CrossRef]
- Killivalavan, G.; Sathyaseelan, B.; Kavitha, G.; Baskarann, I.; Senthilnathan, K.; Sivakumar, D.; Karthikeyan, N.; Manikandan, E.; Maaza, M. Cobalt metal ion doped gerium oxide (Co-CeO2) nanoparticles effect enhanced photocatalytic activity. MRS Adv. 2020, 5, 2503–2515. [Google Scholar] [CrossRef]
- Keshvadi, N.; Haghighatzadeh, A.; Mazinani, B. Improvement in visible-light-induced photocatalytic activity of Ag–CeO2 Schottky-type contact heterostructures. Appl. Phys. A 2020, 126, 256. [Google Scholar] [CrossRef]
- Ramanathan, G.; Rathan, S.V.; Murali, K.R. Photocatalytic activity of biosynthesized CeO2 nano particles. SN Appl. Sci. 2019, 1, 116. [Google Scholar] [CrossRef]
- Vatanparast, M.; Saedi, L. Sonochemical-assisted synthesis and characterization of CeO2 nanoparticles and its photocatalytic properties. J. Mater. Sci. Mater. Electron. 2018, 29, 7107–7113. [Google Scholar] [CrossRef]
- Farhang-Sahlevani, S.; Pandiyarajan, T.; Sanhueza, F.; Akbari-Fakhrabadi, A.; Mansilla, H.D.; Contreras, D.; Mangalaraja, R.V.; Gracia-Pinilla, M.A. A facile hydrothermal synthesis of CeO2 nanocubes decorated ZnO nanostructures: Optical and enhanced photocatalytic properties. J. Mater. Sci. Mater. Electron. 2019, 30, 11643–11651. [Google Scholar] [CrossRef]
- Chanu, W.C.; Gupta, A.; Singh, M.K.; Pandey, O.P. Group V elements (V, Nb and Ta) doped CeO2 particles for efficient photo-oxidation of methylene blue dye. J. Inorg. Organomet. Polym. 2021, 31, 636–647. [Google Scholar] [CrossRef]
- Chen, P.; Chen, L.; Ge, S.; Zhang, W.; Wu, M.; Xing, P.; Rotamond, T.B.; Lin, H.; Wu, Y.; He, Y. Microwave heating preparation of phosphorus doped g-C3N4 and its enhanced performance for photocatalytic H2 evolution in the help of Ag3PO4 nanoparticles. Int. J. Hydrogen Energ. 2020, 45, 14354–14367. [Google Scholar] [CrossRef]
- Liang, Q.; Chen, X.; Liu, R.; Xu, K.; Luo, H. Efficient Removal of Cr(VI) by a 3D Z-Scheme TiO2-Zn Cd1-S graphene aerogel via synergy of adsorption and photocatalysis under visible light. J. Environ. Sci. 2023, 124, 360–370. [Google Scholar] [CrossRef]
- Zhu, X.; Qin, F.; Luo, Y.; Zhang, L.; Yang, D.; Feng, W.; Chen, S. Enhanced photocatalytic activity of p(BaSnO3)-n(anatase/rutile/brookite TiO2) heterojunction composites by efficient interfacial charge transfer. J. Mol. Struct. 2023, 1294, 136440. [Google Scholar] [CrossRef]
- Wang, L.; Zhou, G.; Tian, Y.; Yan, L.; Deng, M.; Yang, B.; Kang, Z.; Sun, H. Hydroxyl decorated g-C3N4 nanoparticles with narrowed bandgap for high efficient photocatalyst design. Appl. Catal. B-Environ. 2019, 244, 262–271. [Google Scholar] [CrossRef]
- Hong, Z.; Shen, B.; Chen, Y.; Lin, B.; Gao, B. Enhancement of photocatalytic H2 evolution over nitrogen-deficient graphitic carbon nitride. J. Mater. Chem. A 2013, 1, 11754. [Google Scholar] [CrossRef]
- Peng, F.; Ni, Y.; Zhou, Q.; Kou, J.; Lu, C.; Xu, Z. New g-C3N4 based photocatalytic cement with enhanced visible-light photocatalytic activity by constructing muscovite sheet/SnO2 structures. Constr. Build. Mater. 2018, 179, 315–325. [Google Scholar] [CrossRef]
- Al Farraj, D.A.; Al-Mohaimeed, A.M.; Alkufeidy, R.M.; Alkubaisi, N.A. Facile synthesis and characterization of CeO2-Al2O3 nano-heterostructure for enhanced visible-light photocatalysis and bactericidal applications. Colloid Interfac Sci. 2021, 41, 100375. [Google Scholar] [CrossRef]
- Algethami, J.S.; Hassan, M.S.; Amna, T.; Sheikh, F.A.; Alhamami, M.A.M.; Seliem, A.F.; Faisal, M.; Kim, H.Y. Nanotextured CeO2−SnO2 composite: Efficient photocatalytic, antibacterial, and energy storage fibers. Nanomaterials 2023, 13, 1001. [Google Scholar] [CrossRef]
- Zhu, X.; Qin, F.; He, L.; Jiao, Y.; Feng, W. Enhanced photocatalytic activity of anatase/rutile heterojunctions by lanthanum and tin co-doping. Int. J. Mol. Sci. 2022, 23, 11339. [Google Scholar] [CrossRef]
- Zhu, X.; Qin, F.; Xia, Y.; Yang, D.; Feng, W.; Jiao, Y. Three-phase mixed titania powder modified by silver and silver chloride with enhanced photocatalytic activity under UV–visible light. Nanomaterials 2022, 12, 1599. [Google Scholar] [CrossRef]
Disclaimer/Publisher’s Note: The statements, opinions and data contained in all publications are solely those of the individual author(s) and contributor(s) and not of MDPI and/or the editor(s). MDPI and/or the editor(s) disclaim responsibility for any injury to people or property resulting from any ideas, methods, instructions or products referred to in the content. |
© 2023 by the authors. Licensee MDPI, Basel, Switzerland. This article is an open access article distributed under the terms and conditions of the Creative Commons Attribution (CC BY) license (https://creativecommons.org/licenses/by/4.0/).