
Multi-Omic Profiling of Macrophages Treated with Phospholipids Containing Omega-3 and Omega-6 Fatty Acids Reveals Complex Immunomodulatory Adaptations at Protein, Lipid and Metabolic Levels

 ,
, 
 , and
, and
Abstract
:1. Introduction
2. Results
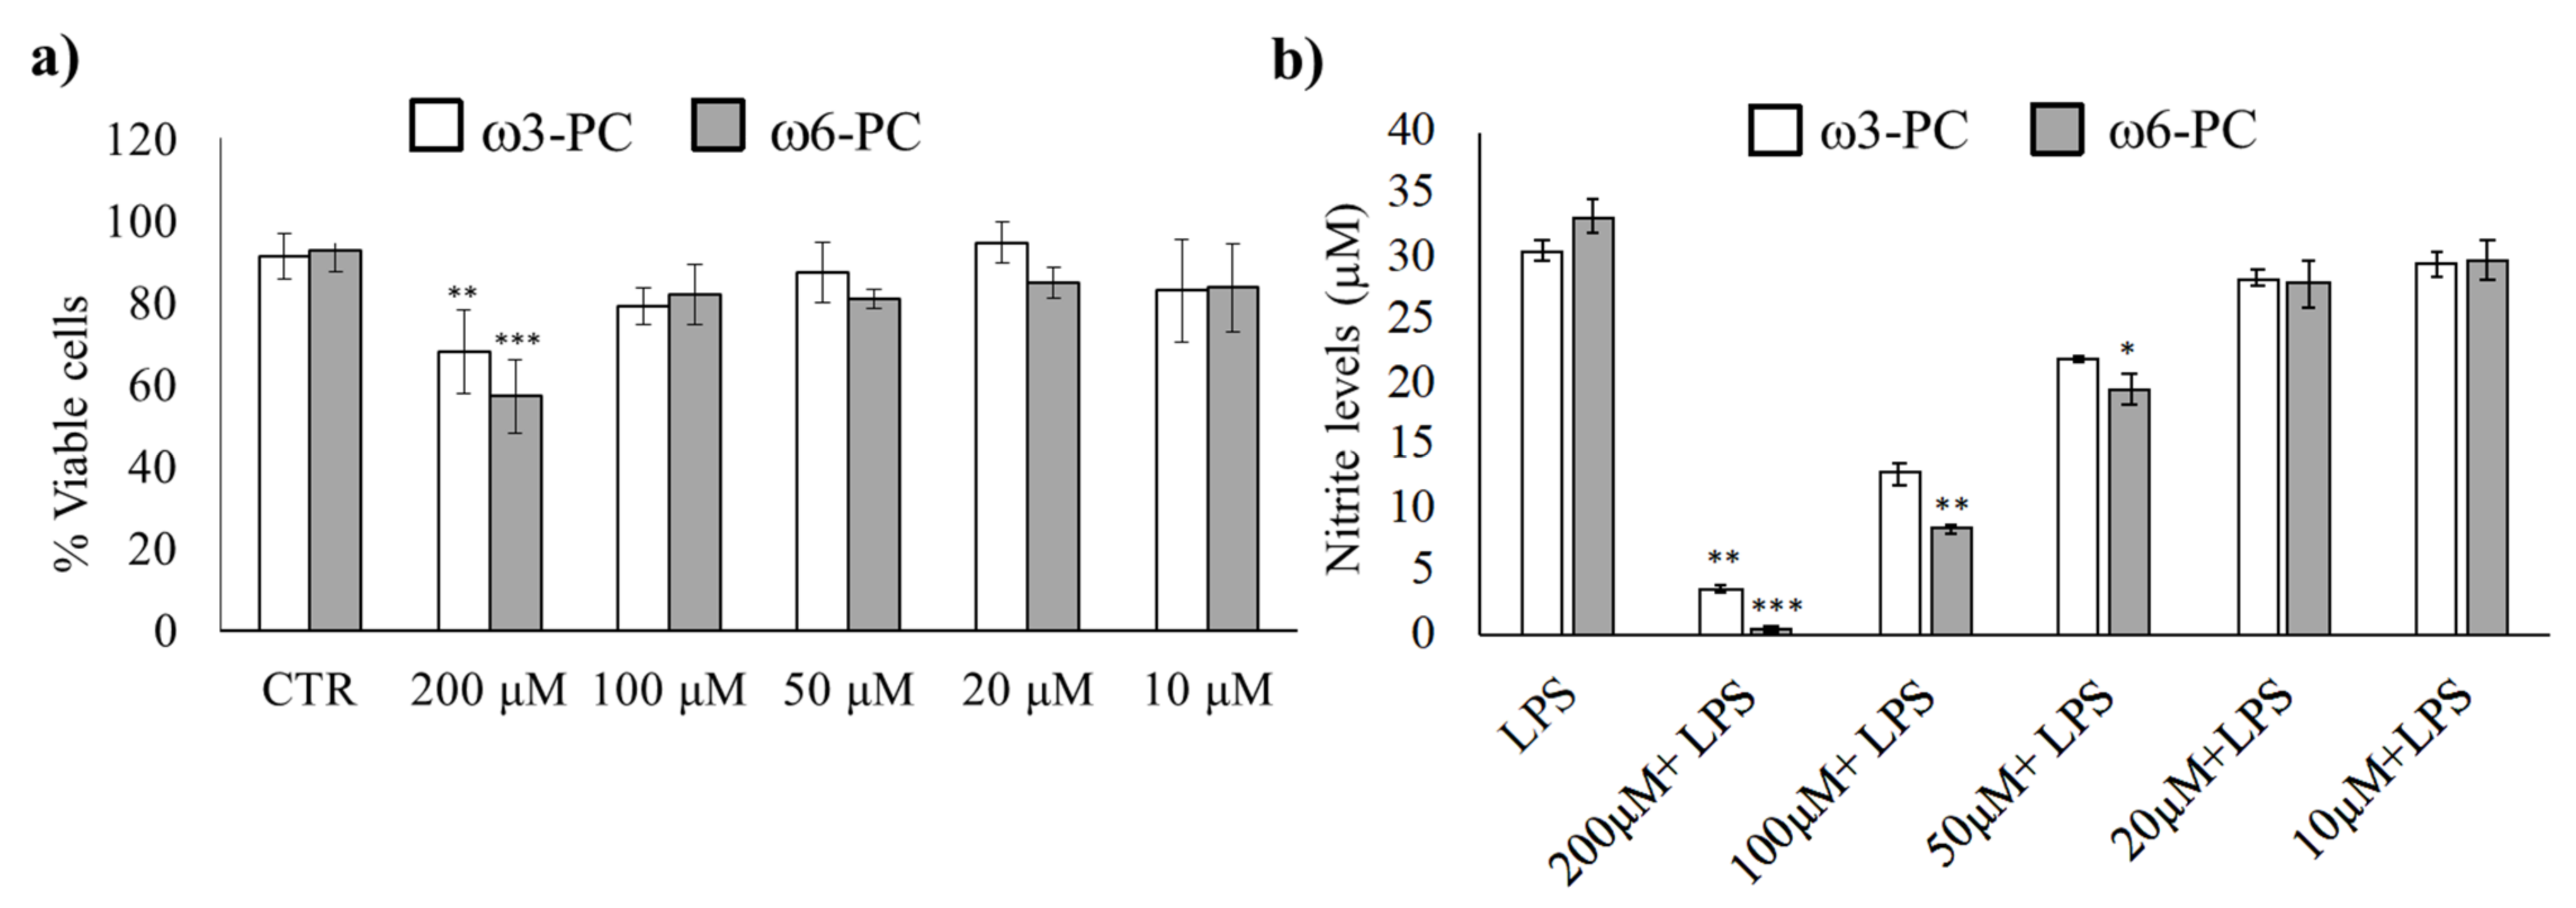
2.1. Impact of Omega-3 and Omega-6 PCs on Macrophage Viability and LPS-Triggered Nitric Oxide Production
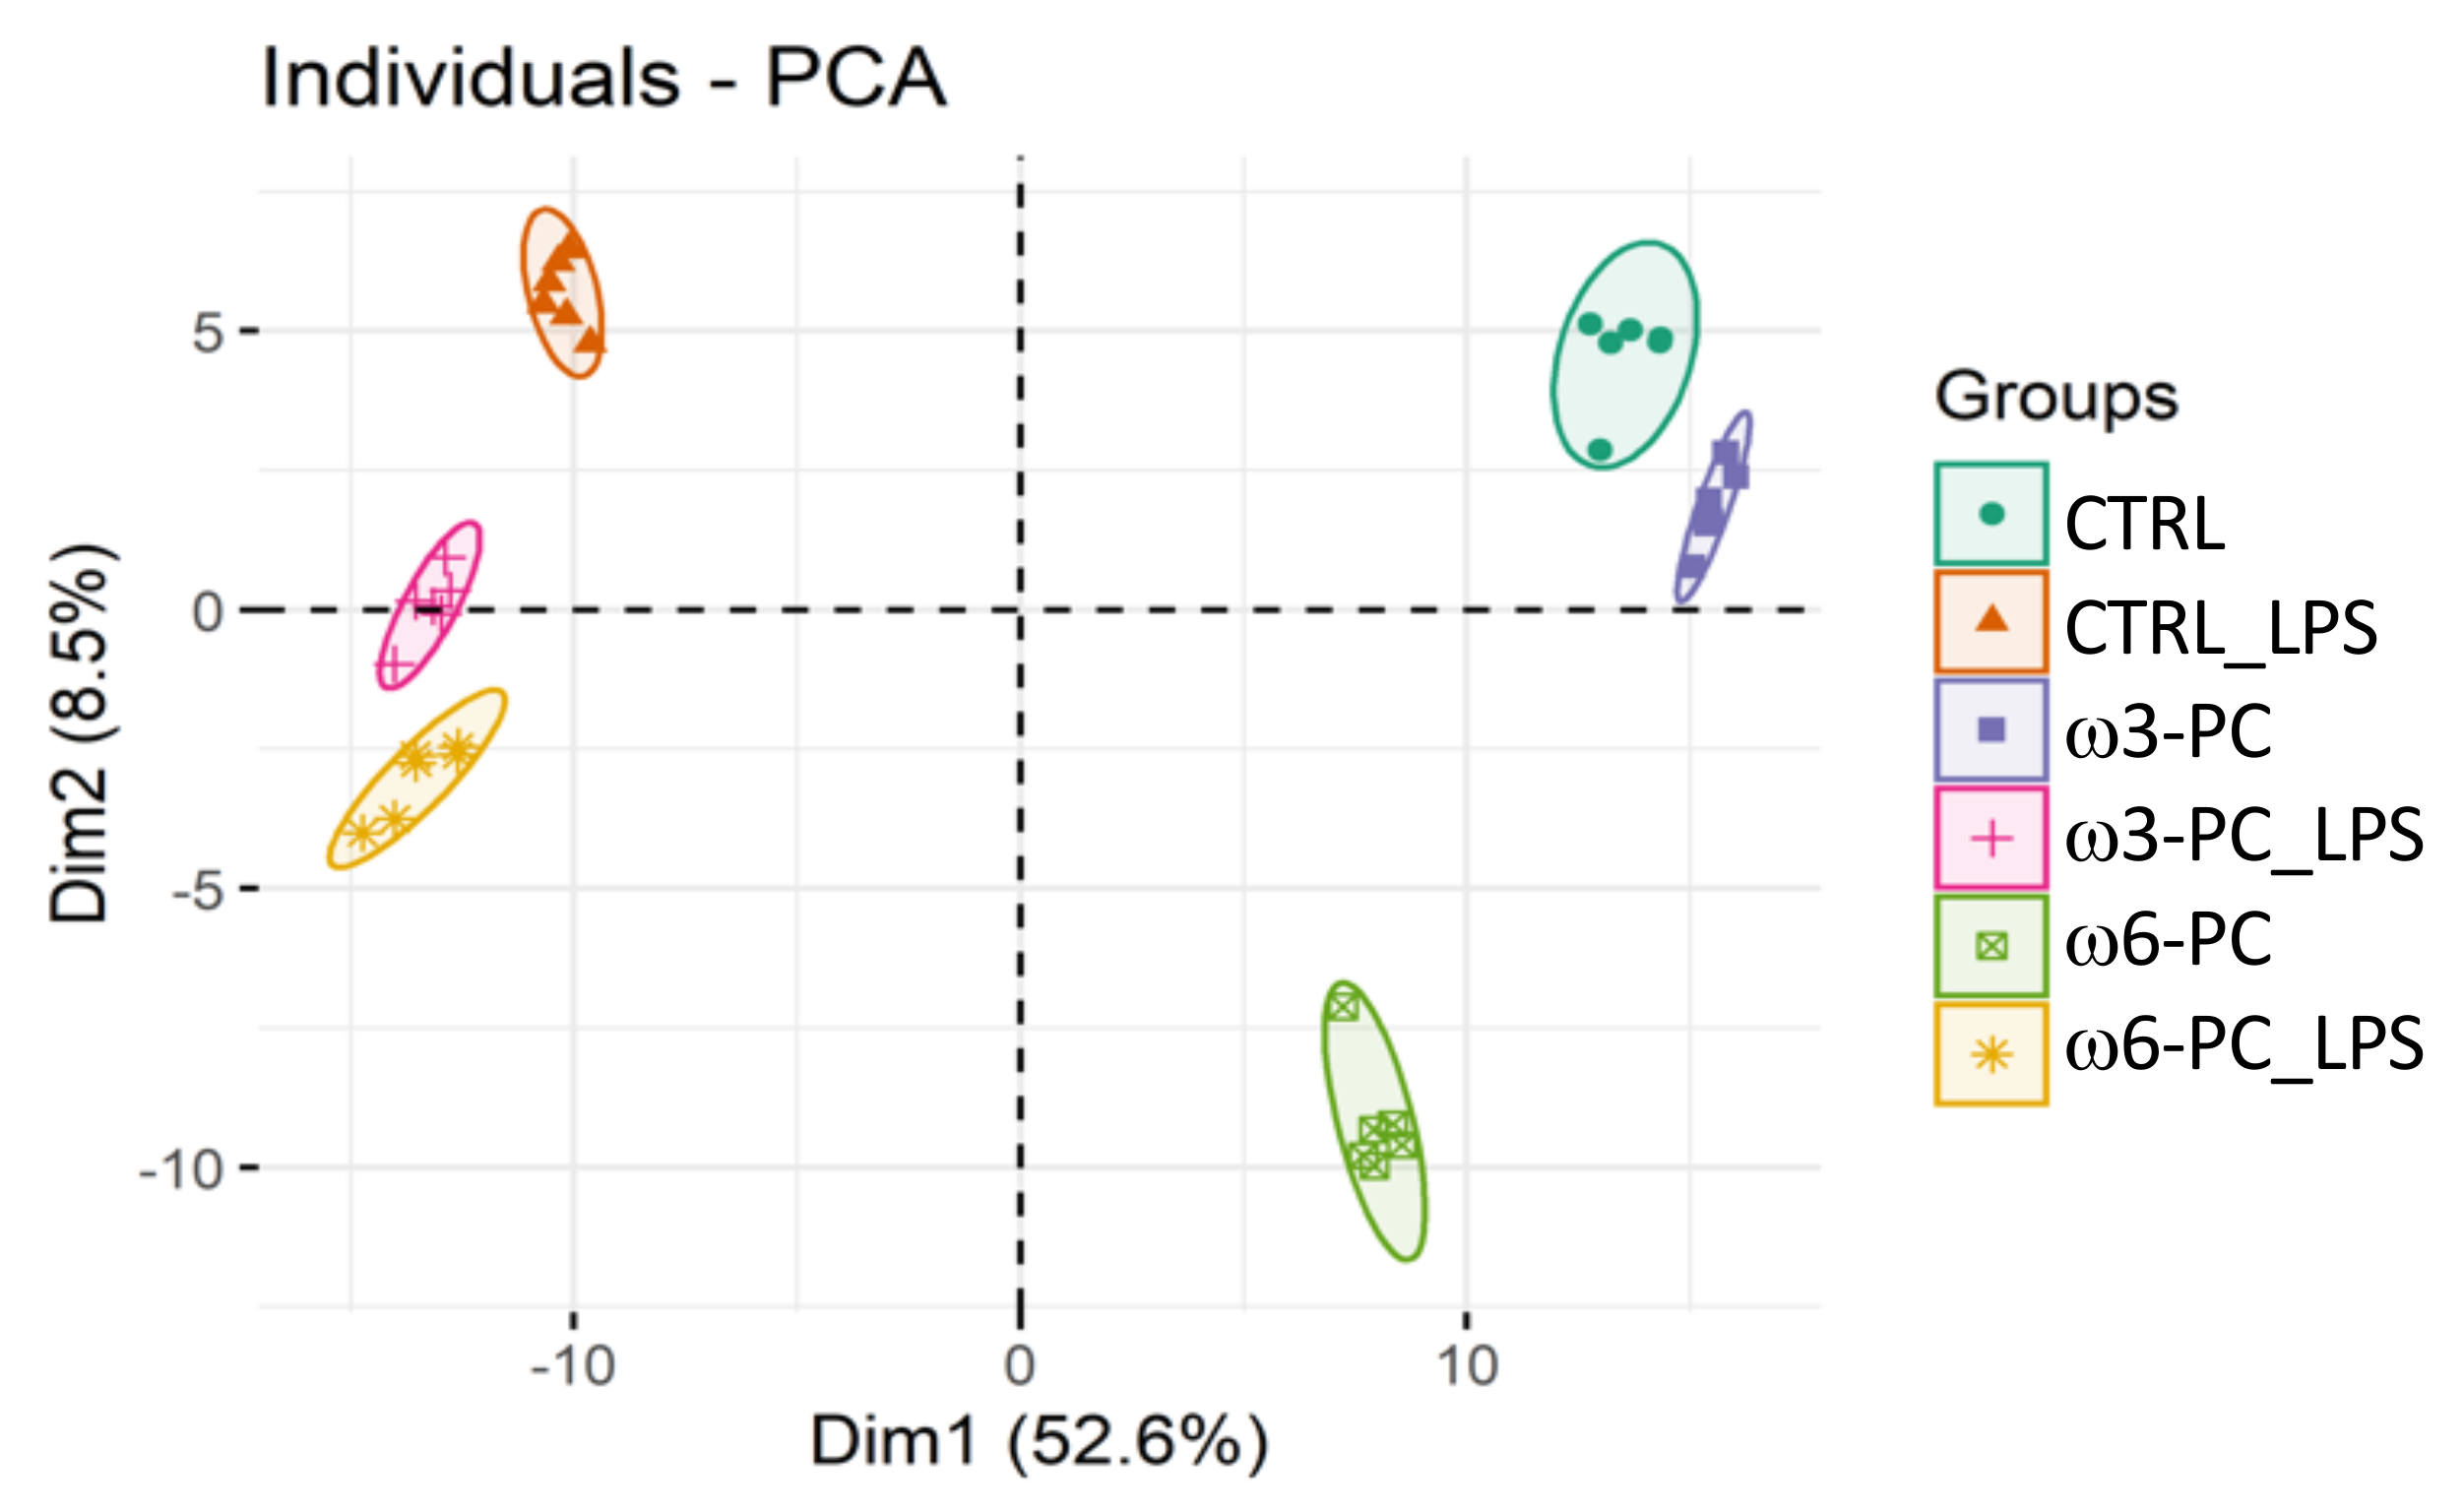
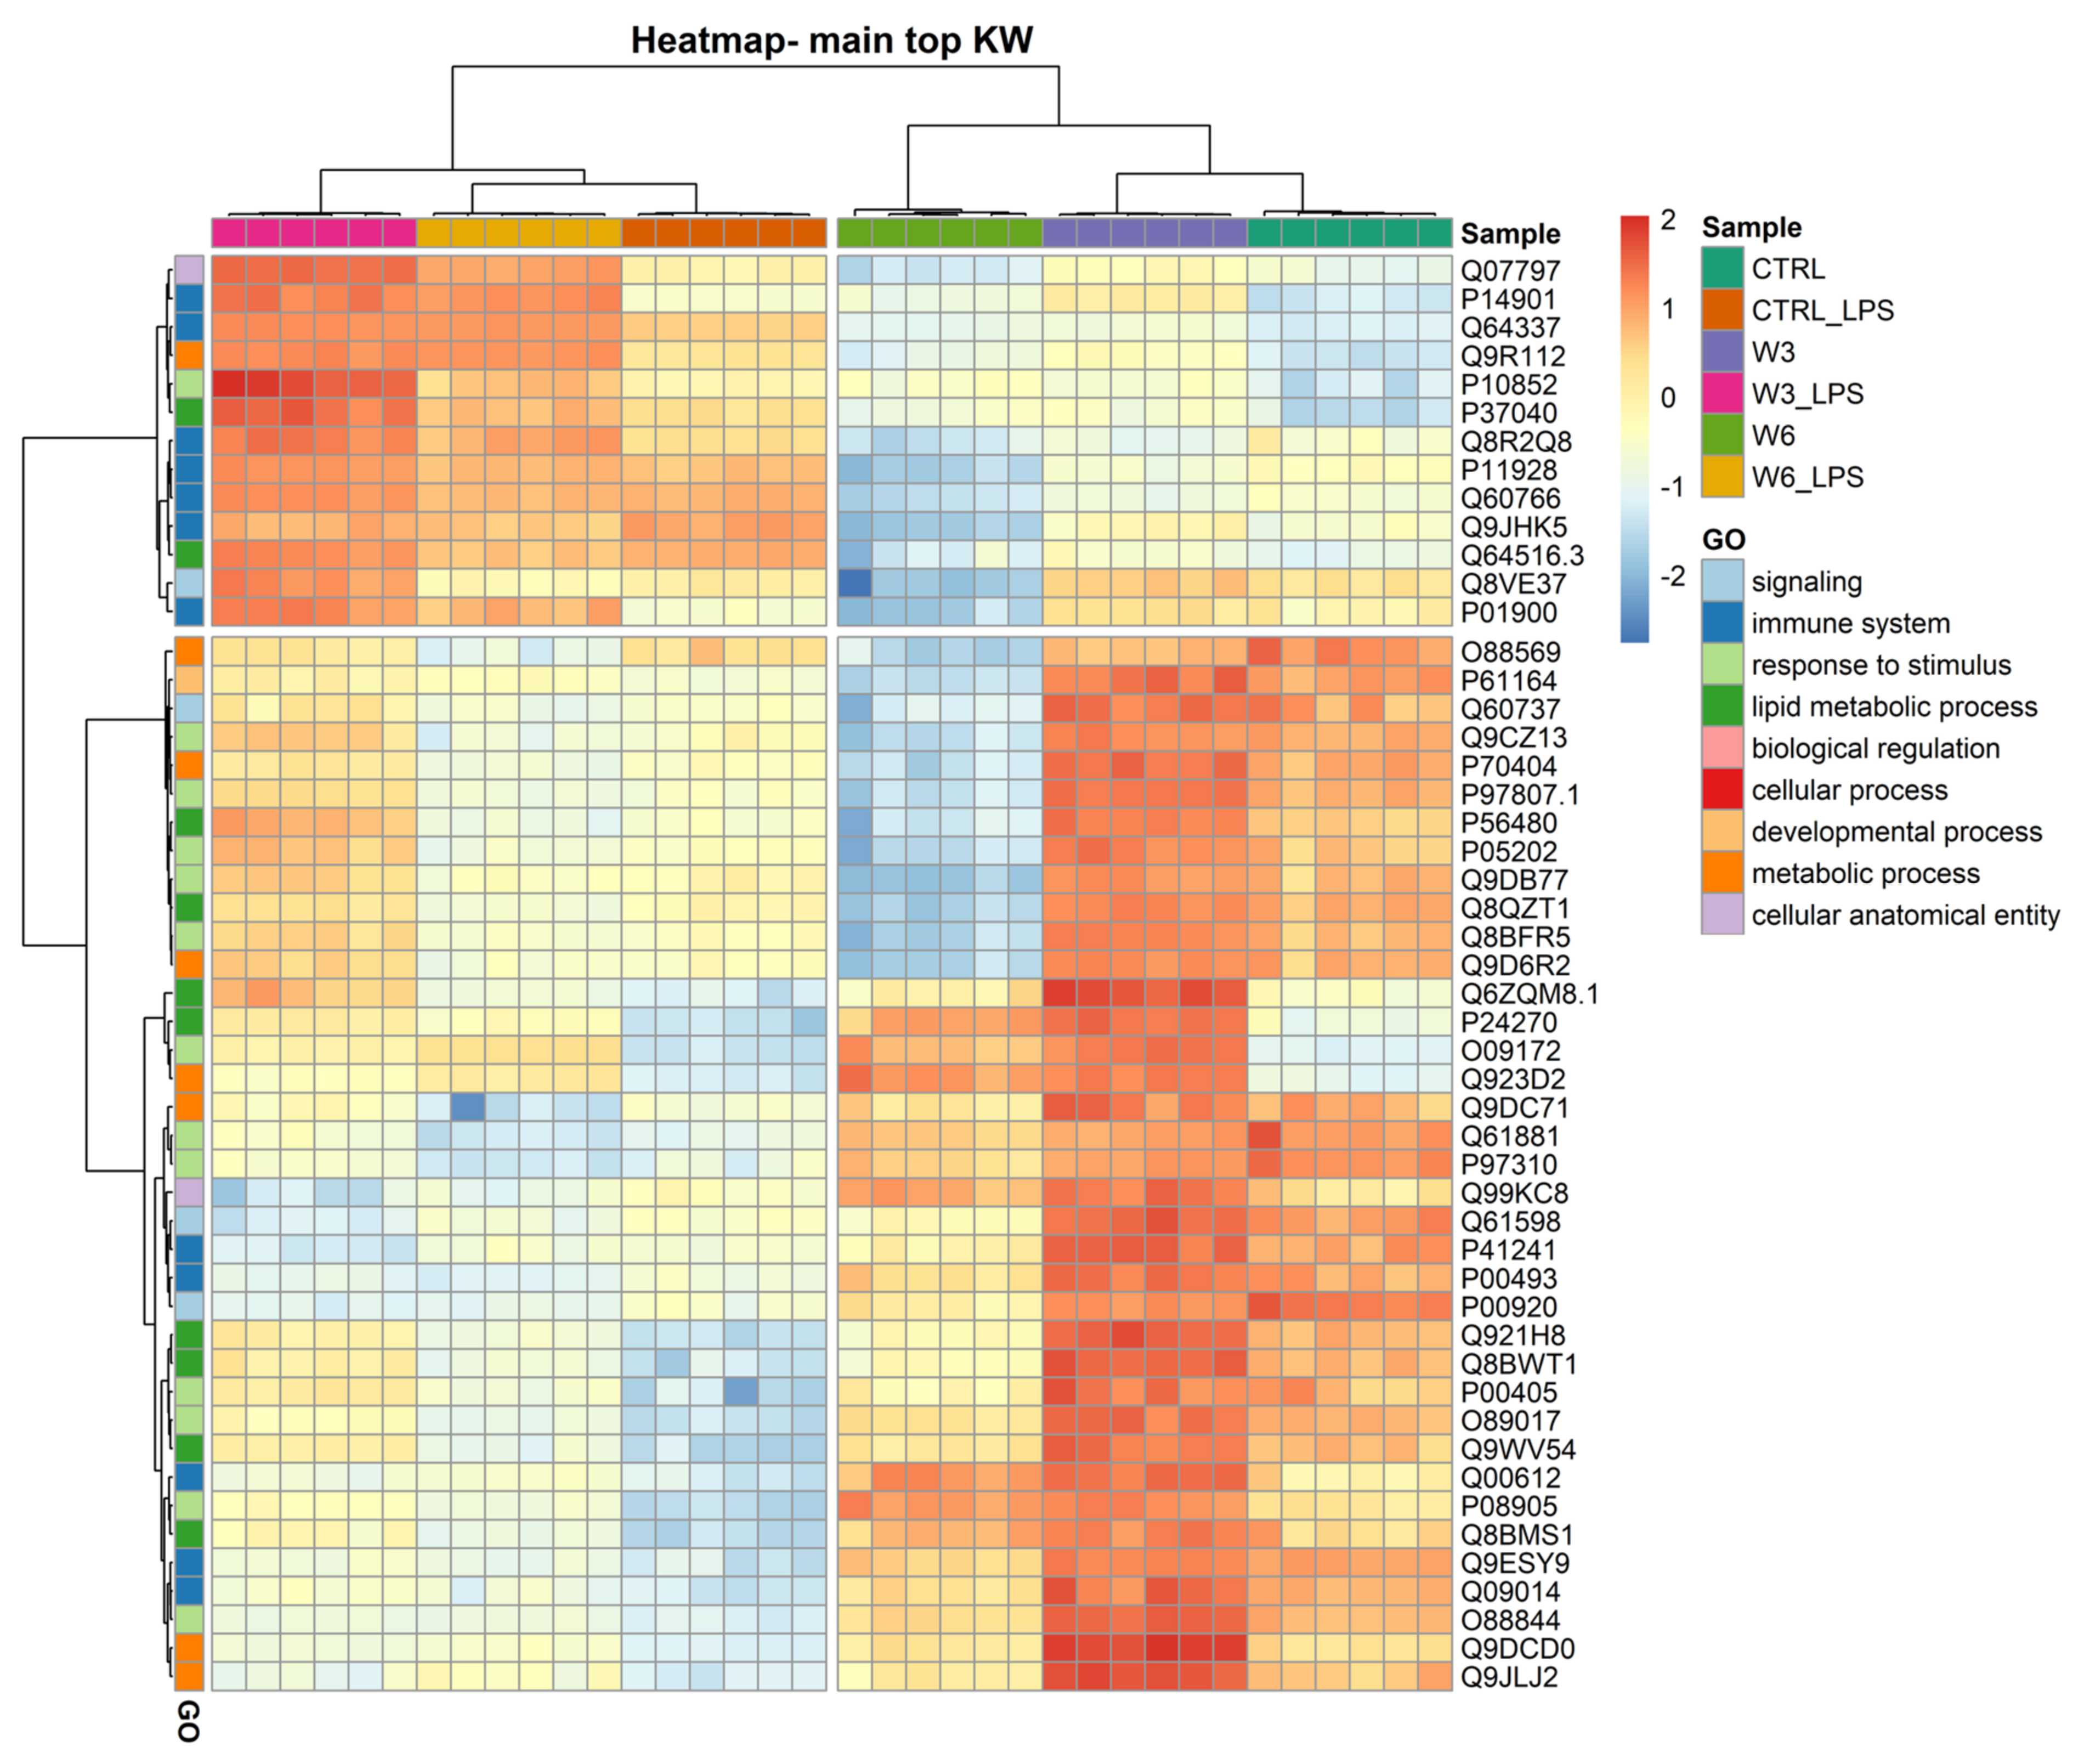
2.2. Supplementation with Omega-3 and Omega-6 PCs Promotes Macrophage Proteome Noticeable Remodelling
2.3. Lipidomics
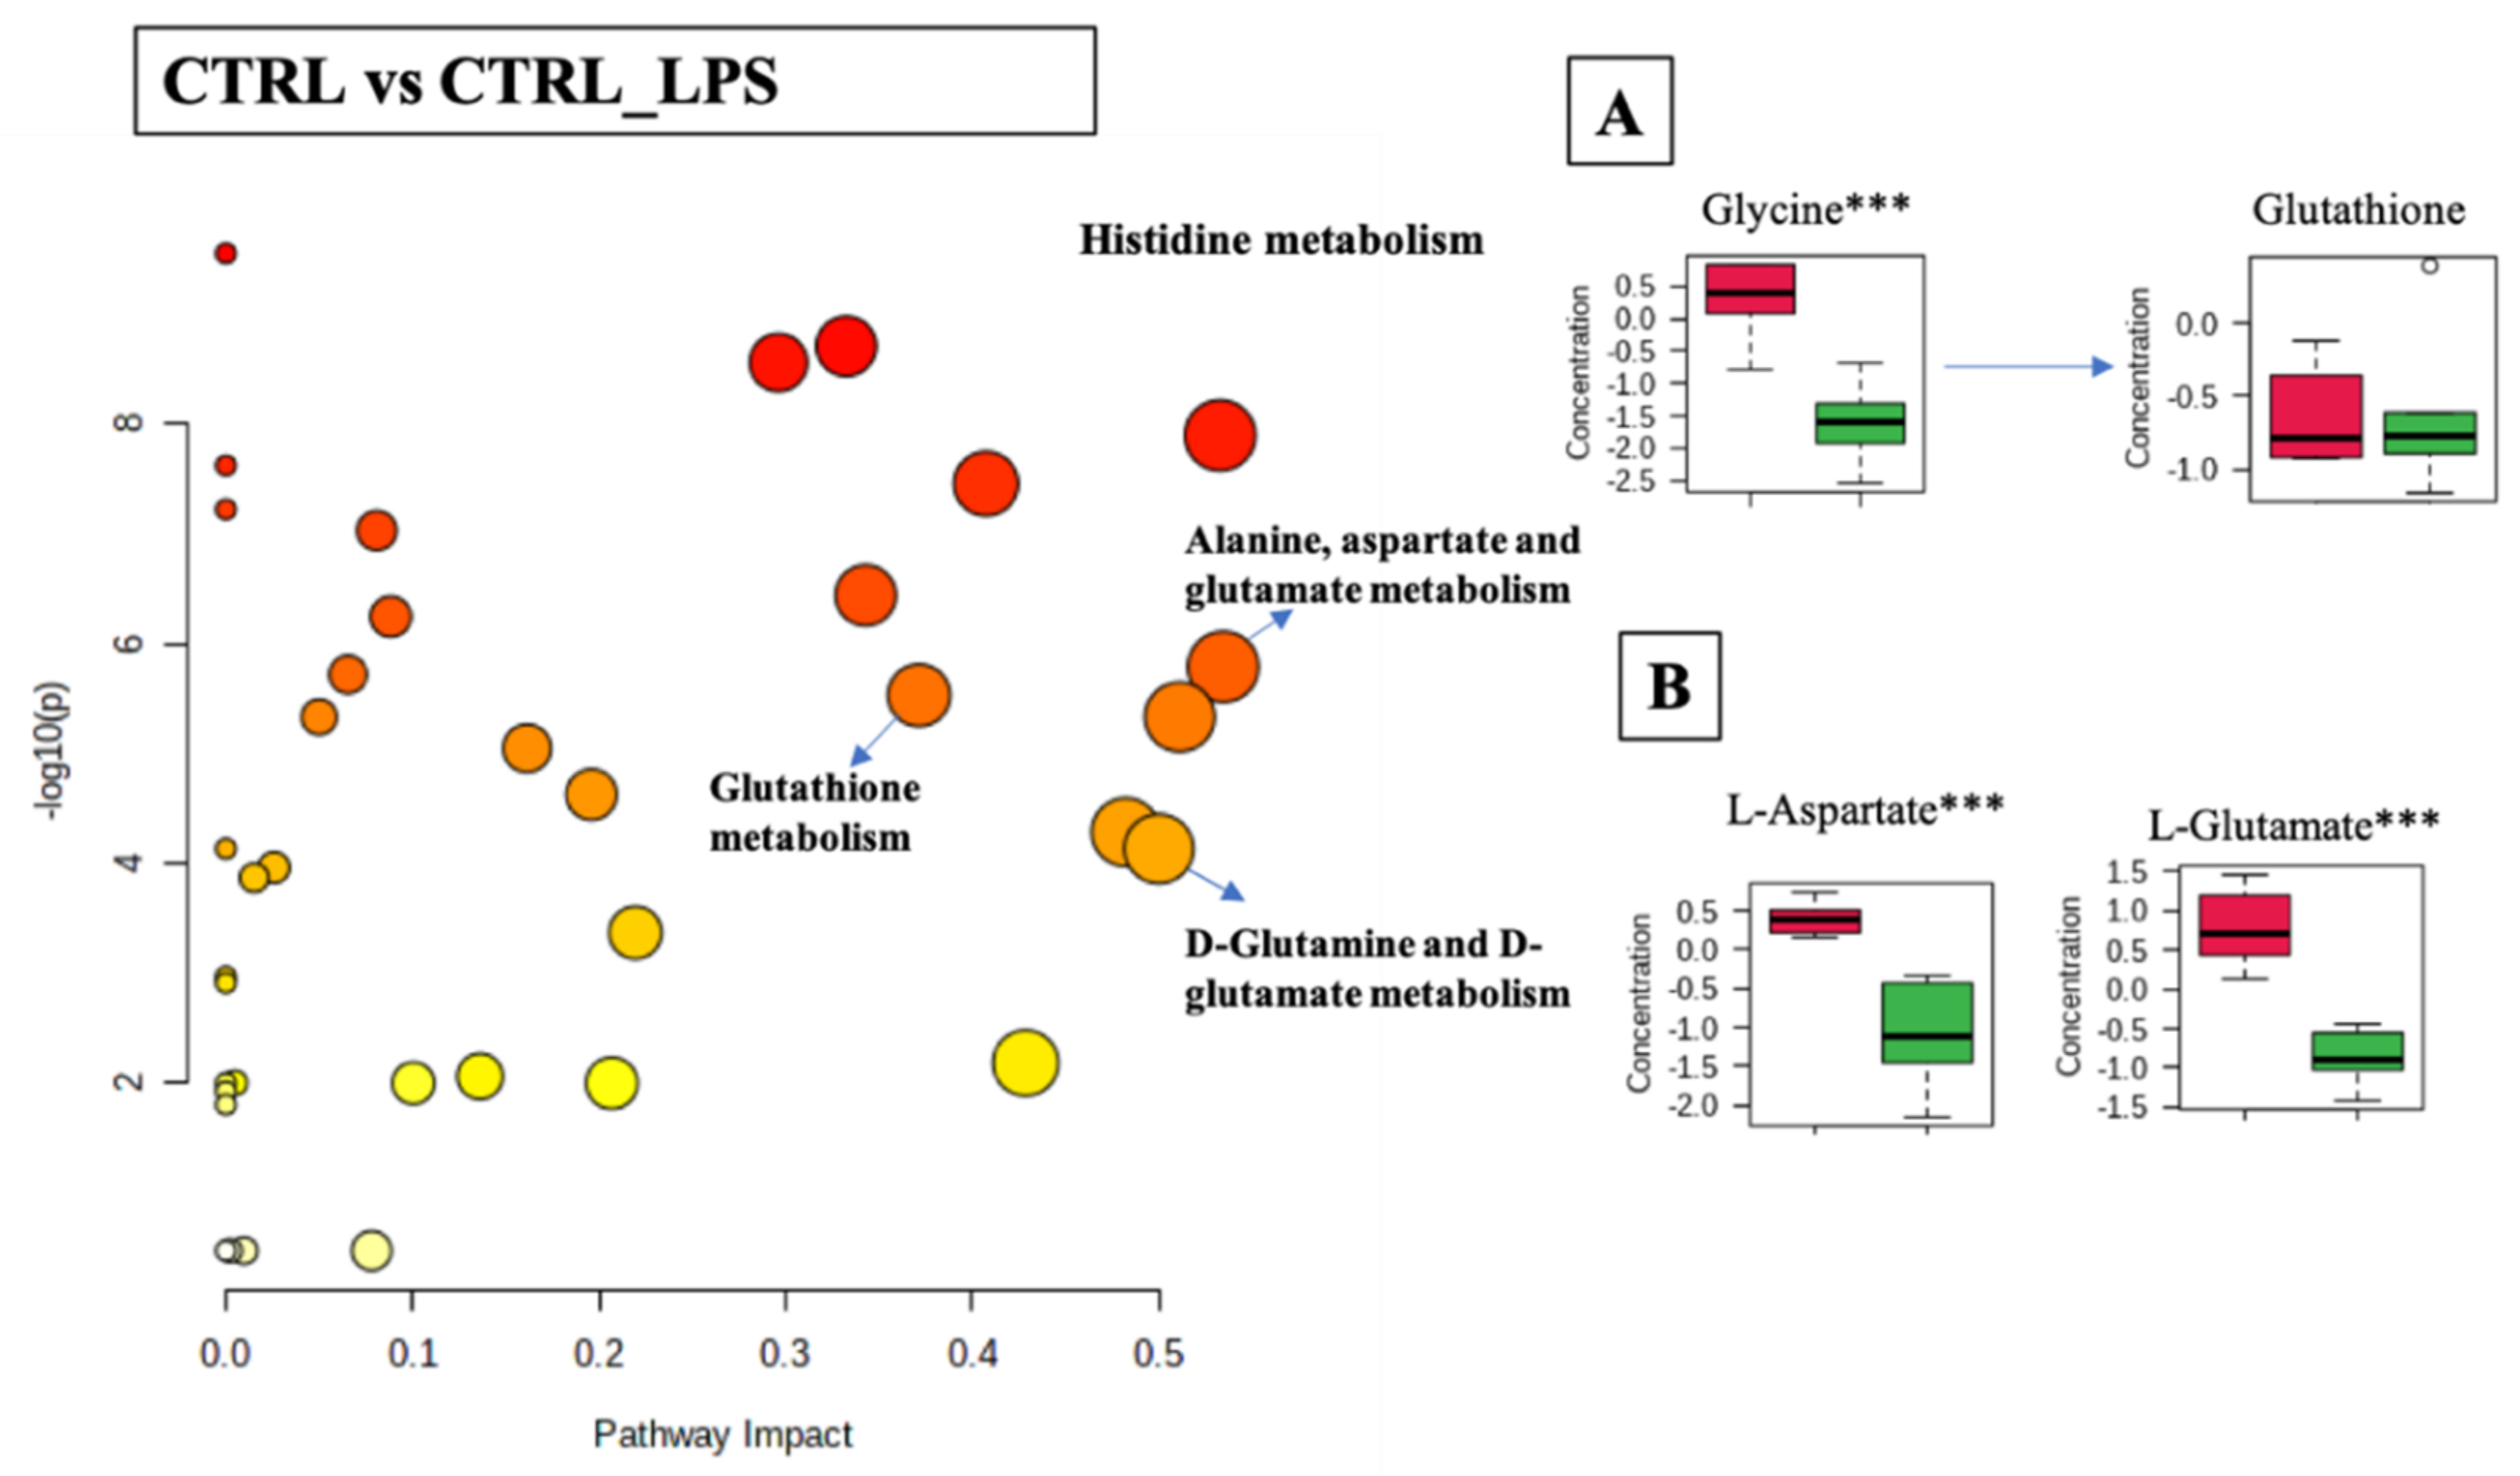
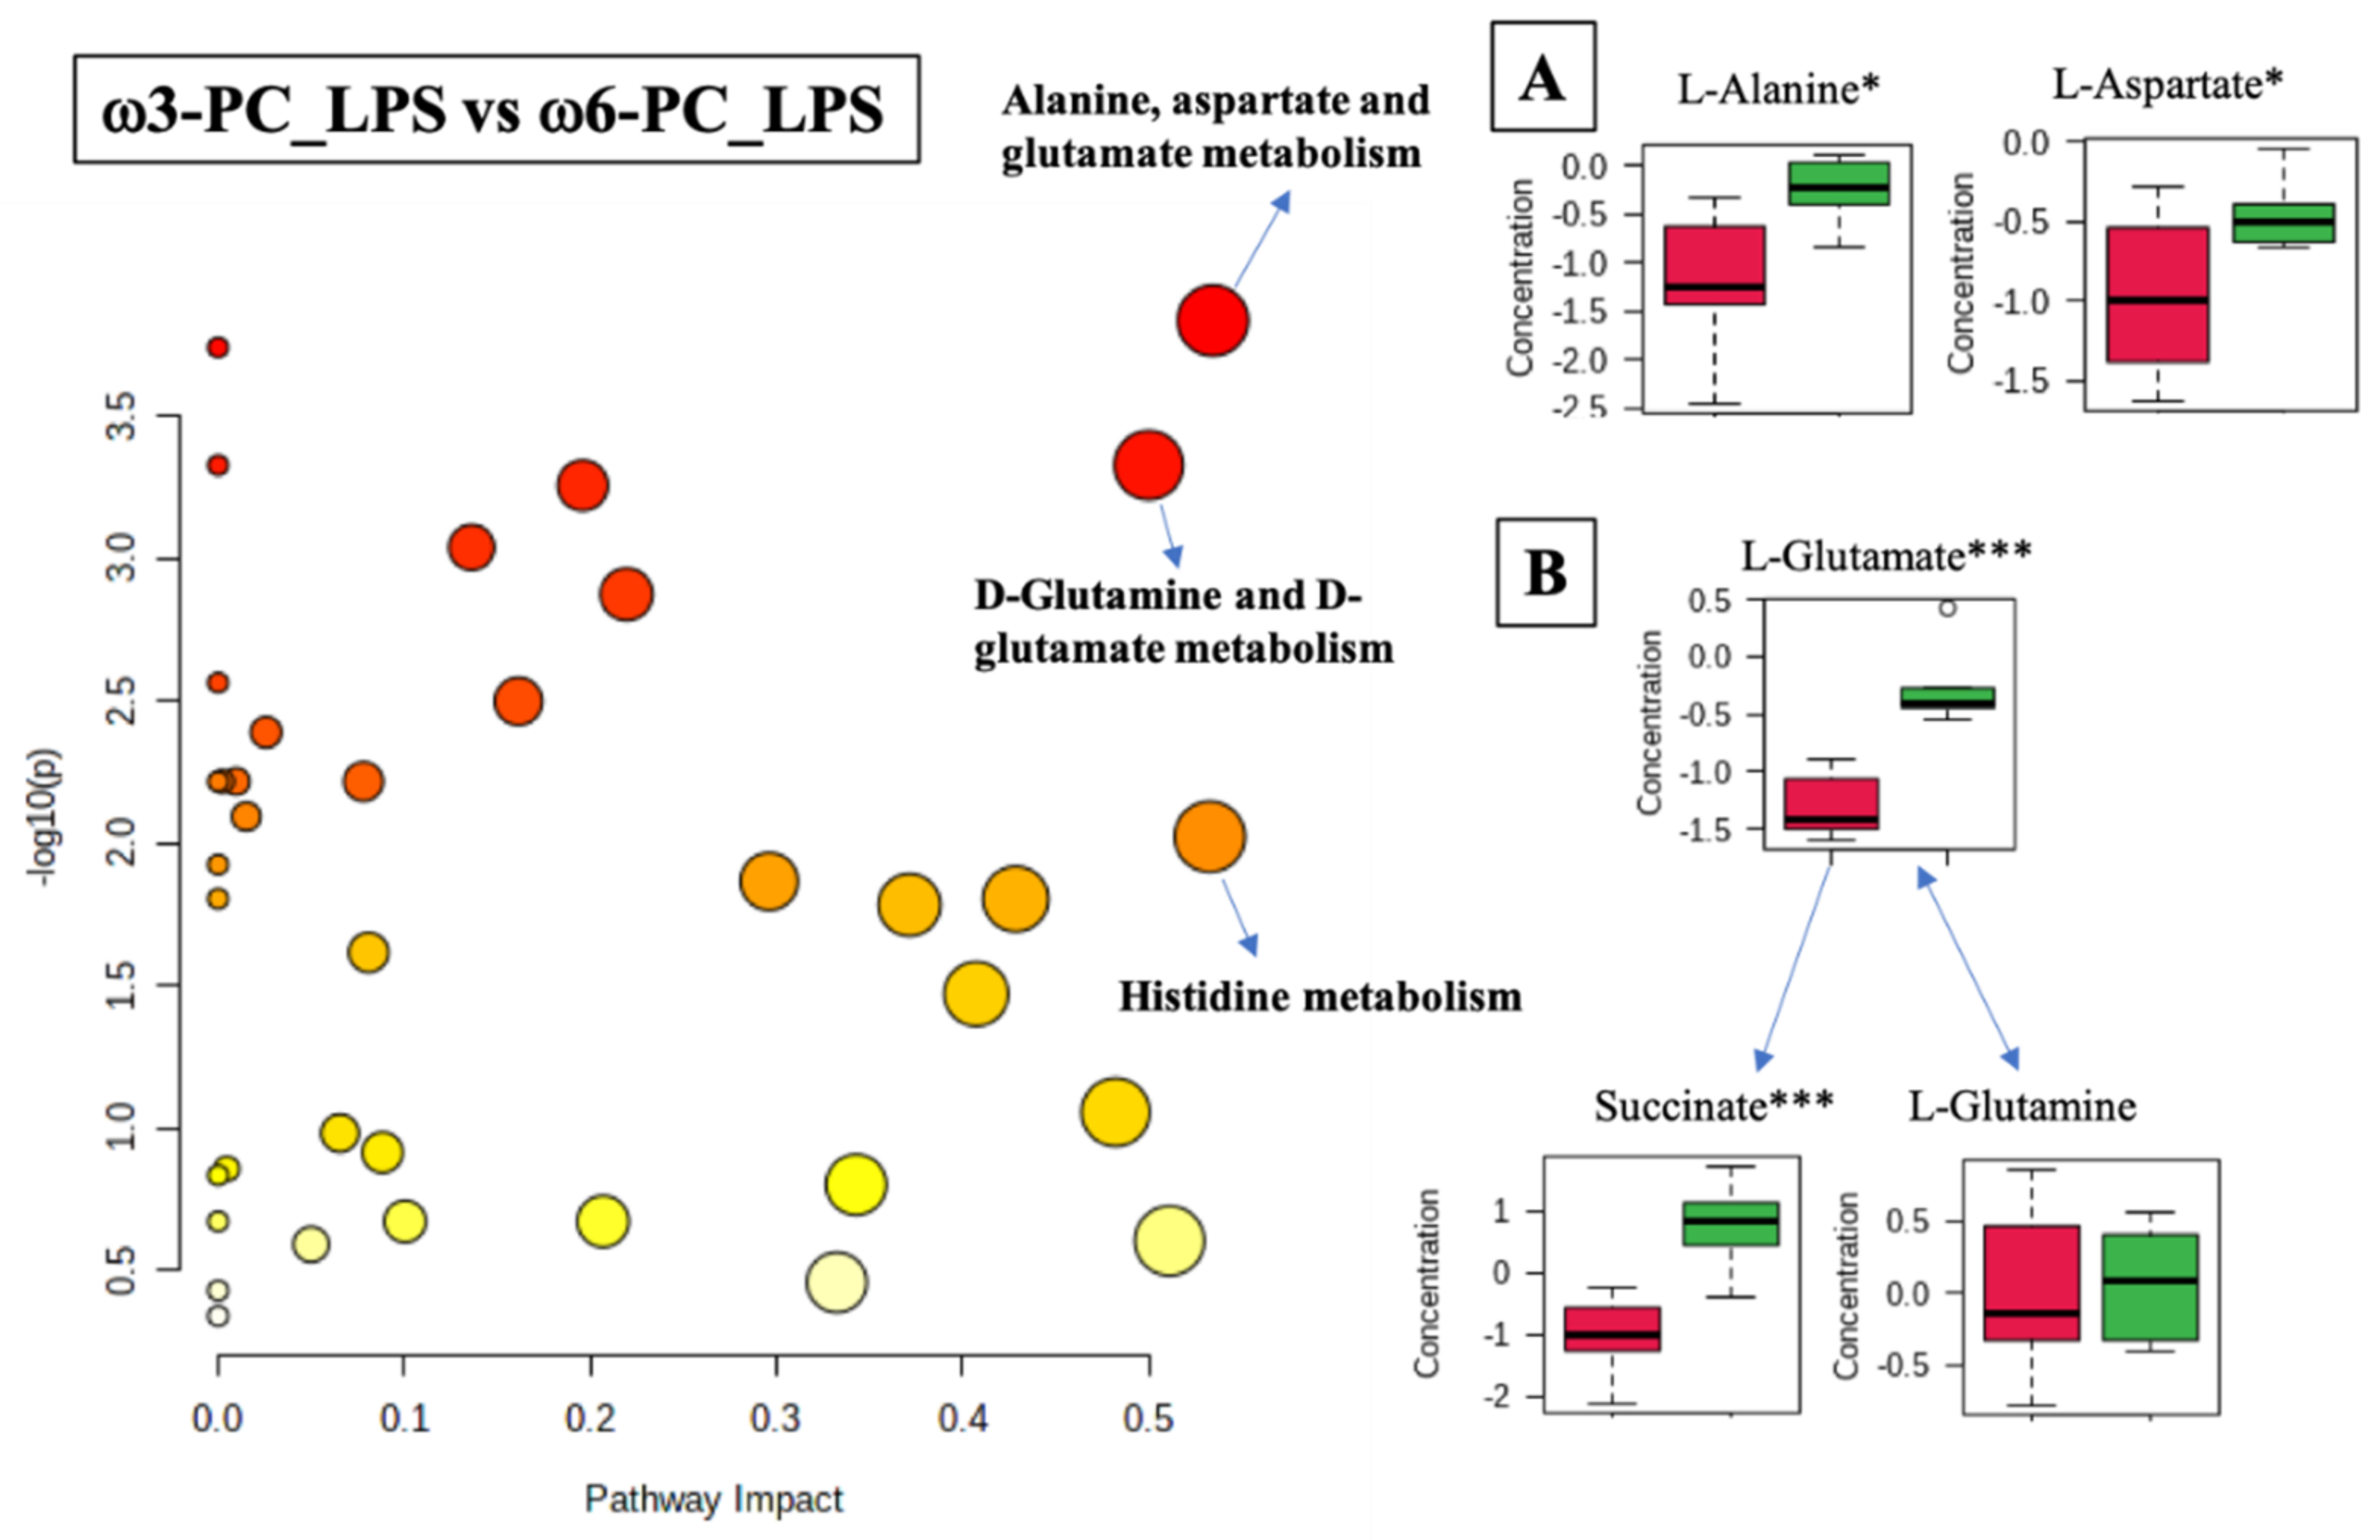
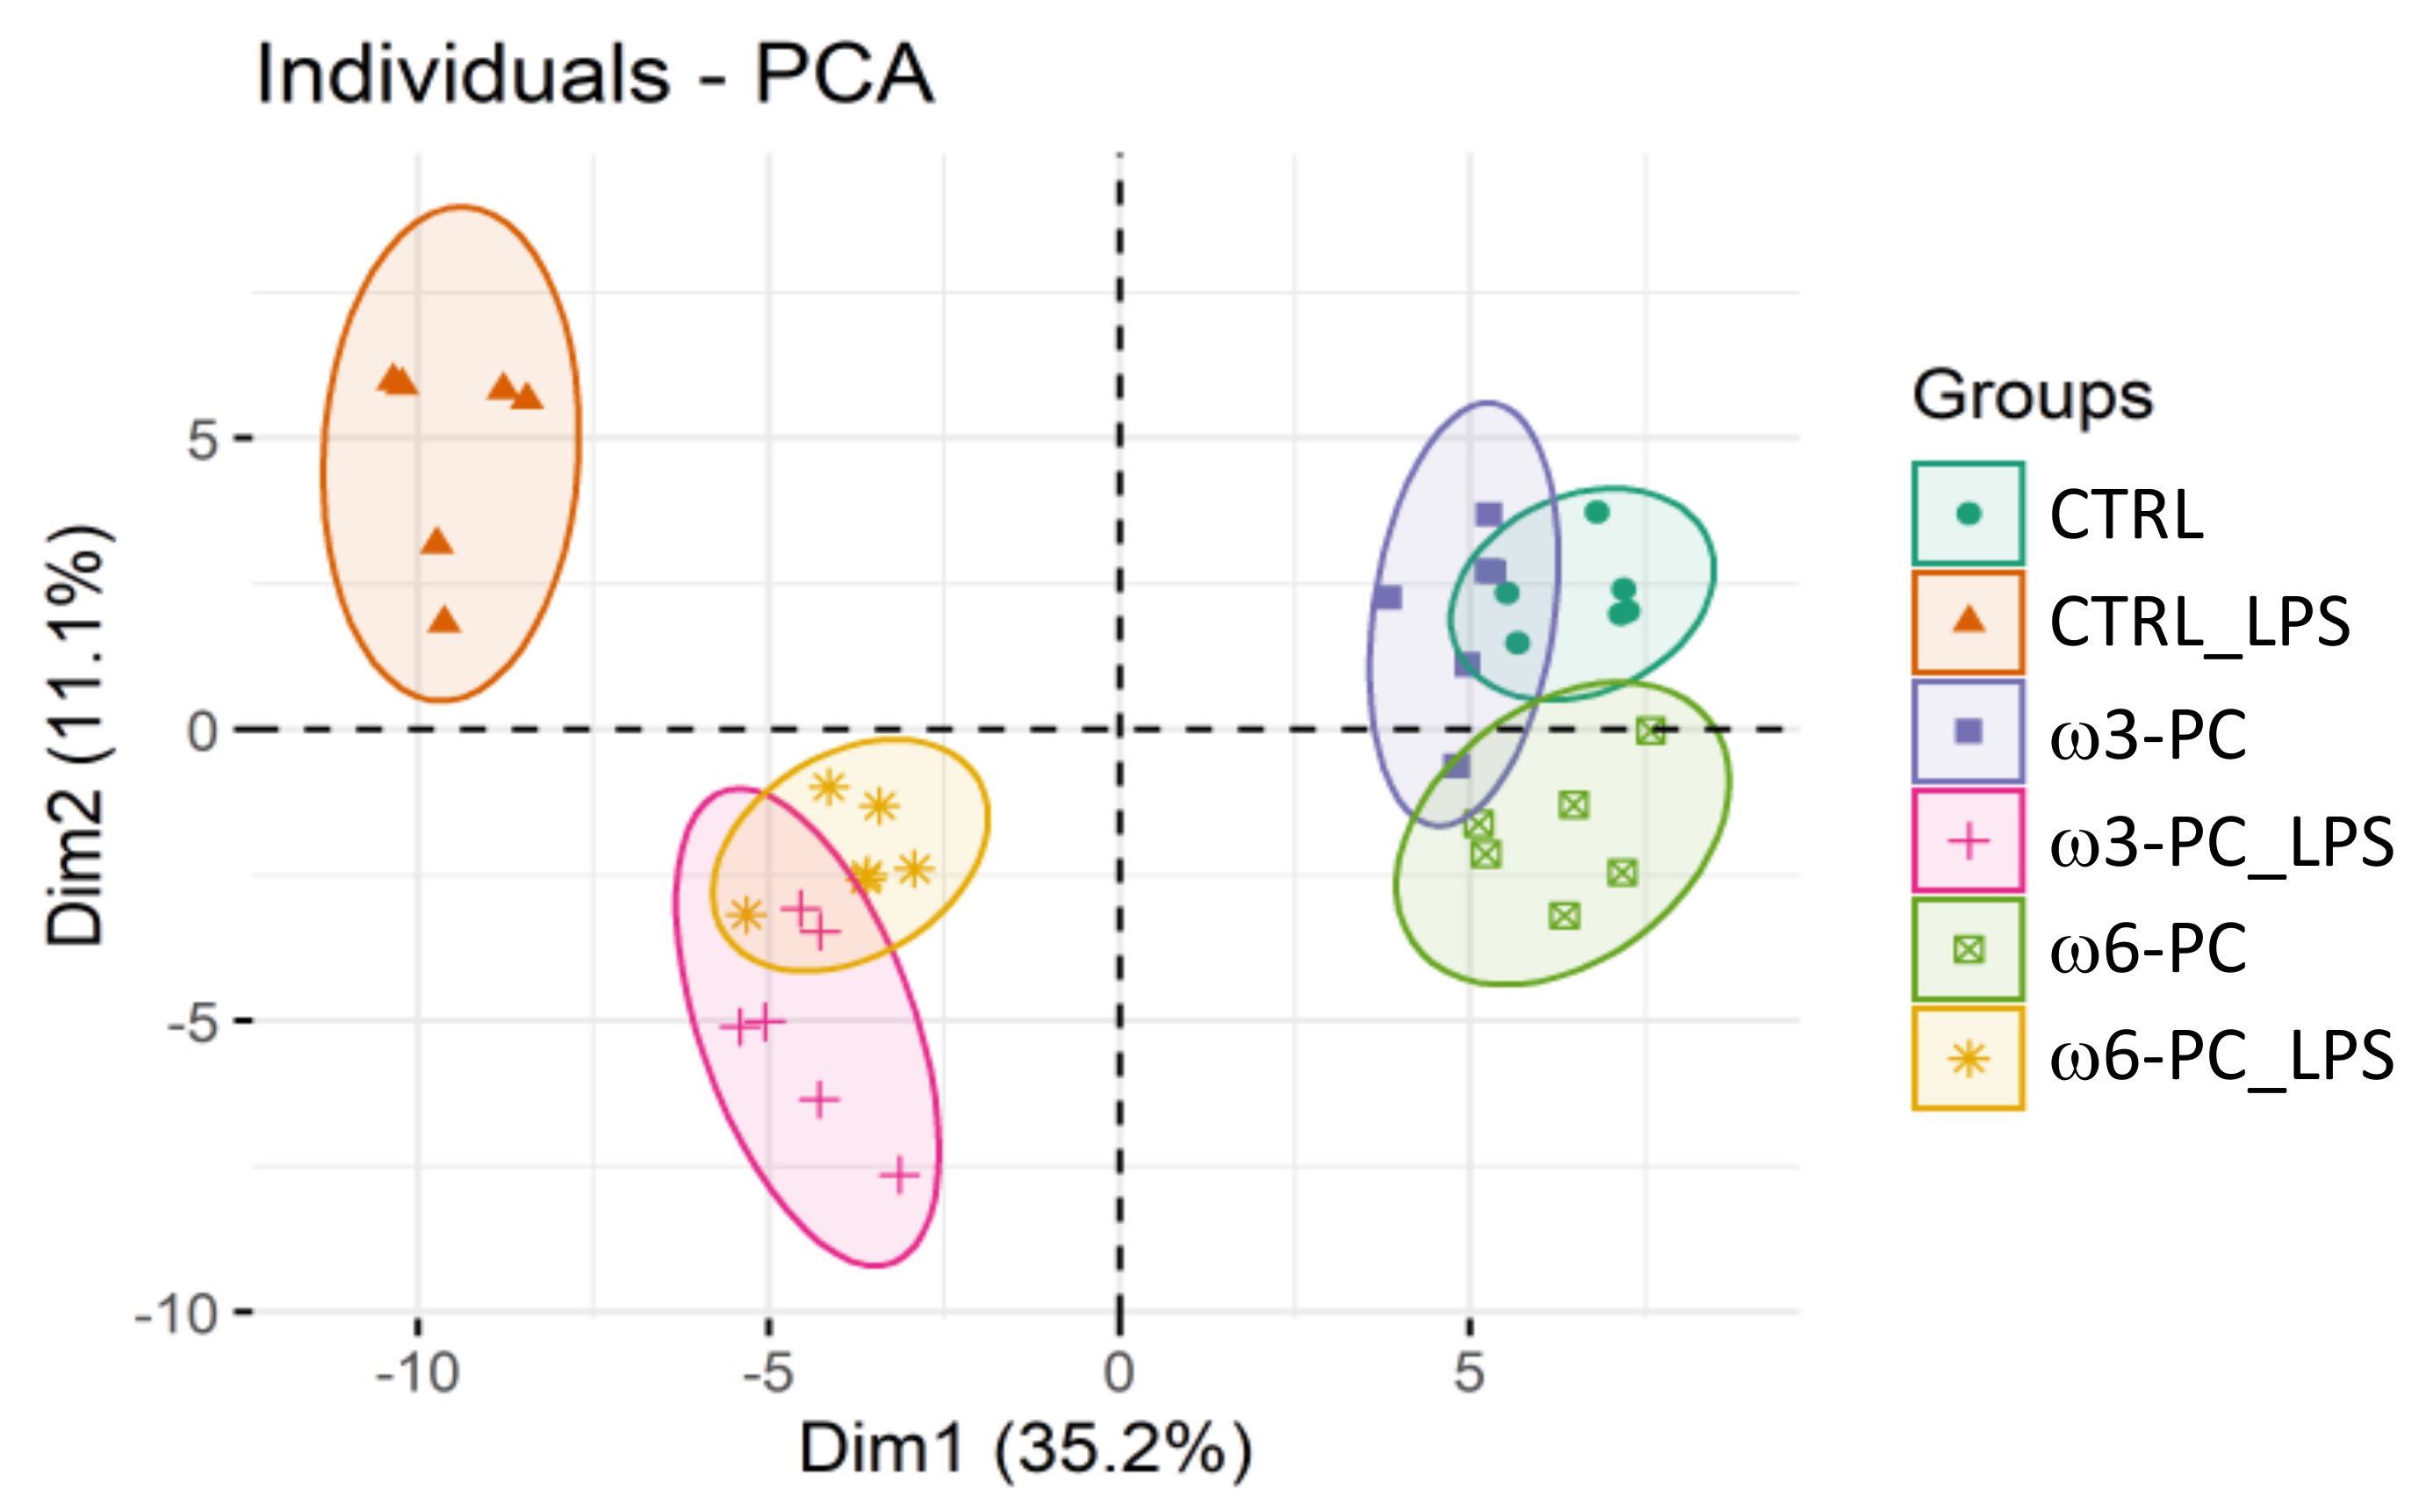
2.4. Metabolomics
3. Discussion
4. Materials and Methods
4.1. Chemicals and Reagents
4.2. Cell Culture
4.3. Cell Viability Assay
4.4. Quantitative Analysis of Nitrites by Griess Reaction
4.5. Incubation with Phospholipids
4.6. Proteomics
4.7. Lipidomics
4.8. Metabolomics
4.9. Statistical Analysis
Supplementary Materials
Author Contributions
Funding
Data Availability Statement
Conflicts of Interest
References
- Fujiwara, N.; Kobayashi, K. Macrophages in Inflammation. Curr. Drug Target-Inflamm. Allergy 2005, 4, 281–286. [Google Scholar] [CrossRef] [PubMed]
- Zhang, X.; Mosser, D. Macrophage Activation by Endogenous Danger Signals. J. Pathol. 2008, 214, 161–178. [Google Scholar] [CrossRef] [PubMed]
- Gutiérrez, S.; Svahn, S.L.; Johansson, M.E. Effects of Omega-3 Fatty Acids on Immune Cells. Int. J. Mol. Sci. 2019, 20, 5028. [Google Scholar] [CrossRef] [PubMed] [Green Version]
- Laskin, D.L.; Sunil, V.R.; Gardner, C.R.; Laskin, J.D. Macrophages and Tissue Injury: Agents of Defense or Destruction? Annu. Rev. Pharmacol. Toxicol. 2011, 51, 267–288. [Google Scholar] [CrossRef] [PubMed] [Green Version]
- Funes, S.C.; Rios, M.; Escobar-Vera, J.; Kalergis, A.M. Implications of Macrophage Polarization in Autoimmunity. Immunology 2018, 154, 186–195. [Google Scholar] [CrossRef] [PubMed] [Green Version]
- Curren Smith, E.W. Macrophage Polarization and Its Role in Cancer. J. Clin. Cell. Immunol. 2015, 6, 338. [Google Scholar] [CrossRef]
- Schett, G.; Neurath, M.F. Resolution of Chronic Inflammatory Disease: Universal and Tissue-Specific Concepts. Nat. Commun. 2018, 9, 3261. [Google Scholar] [CrossRef]
- Radzikowska, U.; Rinaldi, A.O.; Çelebi Sözener, Z.; Karaguzel, D.; Wojcik, M.; Cypryk, K.; Akdis, M.; Akdis, C.A.; Sokolowska, M. The Influence of Dietary Fatty Acids on Immune Responses. Nutrients 2019, 11, 2990. [Google Scholar] [CrossRef] [Green Version]
- Venter, C.; Meyer, R.W.; Nwaru, B.I.; Roduit, C.; Untersmayr, E.; Adel-Patient, K.; Agache, I.; Agostoni, C.; Akdis, C.A.; Bischoff, S.; et al. EAACI Position Paper: Influence of Dietary Fatty Acids on Asthma, Food Allergy, and Atopic Dermatitis. Allergy 2019, 74, 1429–1444. [Google Scholar] [CrossRef] [Green Version]
- Yan, Z.; Gibson, S.A.; Buckley, J.A.; Qin, H.; Benveniste, E.N. Role of the JAK/STAT Signaling Pathway in Regulation of Innate Immunity in Neuroinflammatory Diseases. Clin. Immunol. 2018, 189, 4–13. [Google Scholar] [CrossRef]
- Calder, P.C. Fatty Acids and Inflammation: The Cutting Edge between Food and Pharma. Eur. J. Pharmacol. 2011, 668, S50–S58. [Google Scholar] [CrossRef] [PubMed]
- D’Angelo, S.; Motti, M.L.; Meccariello, R. ω-3 and ω-6 Polyunsaturated Fatty Acids, Obesity and Cancer. Nutrients 2020, 12, 2751. [Google Scholar] [CrossRef] [PubMed]
- Chang, H.Y.; Lee, H.-N.; Kim, W.; Surh, Y.-J. Docosahexaenoic Acid Induces M2 Macrophage Polarization through Peroxisome Proliferator-Activated Receptor γ Activation. Life Sci. 2015, 120, 39–47. [Google Scholar] [CrossRef] [PubMed]
- Kumar, N. 15-Lipoxygenase Metabolites of α-Linolenic Acid, [13-(S)-HPOTrE and 13-(S)-HOTrE], Mediate Anti-Inflammatory Effects by Inactivating NLRP3 Inflammasome. Sci. Rep. 2015, 14, 1–14. [Google Scholar] [CrossRef]
- Yan, Y.; Jiang, W.; Spinetti, T.; Tardivel, A.; Castillo, R.; Bourquin, C.; Guarda, G.; Tian, Z.; Tschopp, J.; Zhou, R. Omega-3 Fatty Acids Prevent Inflammation and Metabolic Disorder through Inhibition of NLRP3 Inflammasome Activation. Immunity 2013, 38, 1154–1163. [Google Scholar] [CrossRef] [Green Version]
- Kawano, A.; Ariyoshi, W.; Yoshioka, Y.; Hikiji, H.; Nishihara, T.; Okinaga, T. Docosahexaenoic Acid Enhances M2 Macrophage Polarization via the P38 Signaling Pathway and Autophagy. J. Cell. Biochem. 2019, 120, 12604–12617. [Google Scholar] [CrossRef]
- Mullen, A.; Loscher, C.E.; Roche, H.M. Anti-Inflammatory Effects of EPA and DHA Are Dependent upon Time and Dose-Response Elements Associated with LPS Stimulation in THP-1-Derived Macrophages. J. Nutr. Biochem. 2010, 7, 444–450. [Google Scholar] [CrossRef]
- Zhao, Y.; Joshi-Barve, S.; Barve, S.; Chen, L.H. Eicosapentaenoic Acid Prevents LPS-Induced TNF-α Expression by Preventing NF-ΚB Activation. J. Am. Coll. Nutr. 2004, 23, 71–78. [Google Scholar] [CrossRef]
- Luo, W.; Xu, Q.; Wang, Q.; Wu, H.; Hua, J. Effect of Modulation of PPAR-γ Activity on Kupffer Cells M1/M2 Polarization in the Development of Non-Alcoholic Fatty Liver Disease. Sci. Rep. 2017, 7, 44612. [Google Scholar] [CrossRef] [Green Version]
- Oh, D.Y.; Talukdar, S.; Bae, E.J.; Imamura, T.; Morinaga, H.; Fan, W.; Li, P.; Lu, W.J.; Watkins, S.M.; Olefsky, J.M. GPR120 Is an Omega-3 Fatty Acid Receptor Mediating Potent Anti-Inflammatory and Insulin-Sensitizing Effects. Cell 2010, 142, 687–698. [Google Scholar] [CrossRef] [Green Version]
- Kelley, D.S. Modulation of Human Immune and Inflammatory Responses by Dietary Fatty Acids. Nutrition 2001, 17, 669–673. [Google Scholar] [CrossRef]
- Su, N.; Li, Y.; Wang, J.; Fan, J.; Li, X.; Peng, W.; Yu, X.; Zhou, T.-B.; Jiang, Z. Role of MAPK Signal Pathways in Differentiation Process of M2 Macrophages Induced by High-Ambient Glucose and TGF-Β1. J. Recept. Signal Transduct. 2015, 35, 396–401. [Google Scholar] [CrossRef] [PubMed]
- Chang, C.-S.; Sun, H.-L.; Lii, C.-K.; Chen, H.-W.; Chen, P.-Y.; Liu, K.-L. Gamma-Linolenic Acid Inhibits Inflammatory Responses by Regulating NF-ΚB and AP-1 Activation in Lipopolysaccharide-Induced RAW 264.7 Macrophages. Inflammation 2010, 33, 46–57. [Google Scholar] [CrossRef] [PubMed]
- Walloschke, B.; Fuhrmann, H.; Schumann, J. Enrichment of RAW264.7 Macrophages with Essential 18-Carbon Fatty Acids Affects Both Respiratory Burst and Production of Immune Modulating Cytokines. J. Nutr. Biochem. 2010, 21, 556–560. [Google Scholar] [CrossRef]
- Schoeniger, A.; Adolph, S.; Fuhrmann, H.; Schumann, J. The Impact of Membrane Lipid Composition on Macrophage Activation in the Immune Defense against Rhodococcus Equi and Pseudomonas Aeruginosa. Int. J. Mol. Sci. 2011, 12, 7510–7528. [Google Scholar] [CrossRef]
- De Lima, T.M.; de Sa Lima, L.; Scavone, C.; Curi, R. Fatty Acid Control of Nitric Oxide Production by Macrophages. FEBS Lett. 2006, 580, 3287–3295. [Google Scholar] [CrossRef] [Green Version]
- Machado, R.M.; Nakandakare, E.R.; Quintão, E.C.R.; Cazita, P.M.; Koike, M.K.; Nunes, V.S.; Ferreira, F.D.; Afonso, M.S.; Bombo, R.P.A.; Machado-Lima, A.; et al. Omega-6 Polyunsaturated Fatty Acids Prevent Atherosclerosis Development in LDLr-KO Mice, in Spite of Displaying a pro-Inflammatory Profile Similar to Trans Fatty Acids. Atherosclerosis 2012, 224, 66–74. [Google Scholar] [CrossRef]
- Gilroy, D.W.; Edin, M.L.; De Maeyer, R.P.H.; Bystrom, J.; Newson, J.; Lih, F.B.; Stables, M.; Zeldin, D.C.; Bishop-Bailey, D. CYP450-Derived Oxylipins Mediate Inflammatory Resolution. Proc. Natl. Acad. Sci. USA 2016, 113, E3240. [Google Scholar] [CrossRef] [Green Version]
- Brouwers, H.; Jónasdóttir, H.S.; Kuipers, M.E.; Kwekkeboom, J.C.; Auger, J.L.; Gonzalez-Torres, M.; López-Vicario, C.; Clària, J.; Freysdottir, J.; Hardardottir, I.; et al. Anti-Inflammatory and Proresolving Effects of the Omega-6 Polyunsaturated Fatty Acid Adrenic Acid. J. Immunol. 2020, 205, 2840–2849. [Google Scholar] [CrossRef]
- Farvid, M.S.; Ding, M.; Pan, A.; Sun, Q.; Chiuve, S.E.; Steffen, L.M.; Willett, W.C.; Hu, F.B. Dietary Linoleic Acid and Risk of Coronary Heart Disease: A Systematic Review and Meta-Analysis of Prospective Cohort Studies. Circulation 2014, 130, 1568–1578. [Google Scholar] [CrossRef]
- Wu, J.H.Y.; Marklund, M.; Imamura, F.; Tintle, N.; Ardisson Korat, A.V.; de Goede, J.; Zhou, X.; Yang, W.-S.; de Oliveira Otto, M.C.; Kröger, J.; et al. Omega-6 Fatty Acid Biomarkers and Incident Type 2 Diabetes: Pooled Analysis of Individual-Level Data for 39,740 Adults from 20 Prospective Cohort Studies. Lancet Diabetes Endocrinol. 2017, 5, 965–974. [Google Scholar] [CrossRef] [Green Version]
- Bryan, N.S.; Grisham, M.B. Methods to Detect Nitric Oxide and Its Metabolites in Biological Samples. Free Radic. Biol. Med. 2007, 43, 645–657. [Google Scholar] [CrossRef] [PubMed] [Green Version]
- Pinto, R.V.; Antunes, F.; Pires, J.; Silva-Herdade, A.; Pinto, M.L. A Comparison of Different Approaches to Quantify Nitric Oxide Release from NO-Releasing Materials in Relevant Biological Media. Molecules 2020, 25, 2580. [Google Scholar] [CrossRef] [PubMed]
- Aki, D.; Mashima, R.; Saeki, K.; Minoda, Y.; Yamauchi, M.; Yoshimura, A. Modulation of TLR Signalling by the C-Terminal Src Kinase (Csk) in Macrophages. Genes Cells 2005, 10, 357–368. [Google Scholar] [CrossRef]
- Pizzolla, A.; Hultqvist, M.; Nilson, B.; Grimm, M.J.; Eneljung, T.; Jonsson, I.-M.; Verdrengh, M.; Kelkka, T.; Gjertsson, I.; Segal, B.H.; et al. Reactive Oxygen Species Produced by the NADPH Oxidase 2 Complex in Monocytes Protect Mice from Bacterial Infections. J. Immunol. Baltim. Md 1950 2012, 188, 5003–5011. [Google Scholar] [CrossRef] [Green Version]
- Mortimer, P.M.; Mc Intyre, S.A.; Thomas, D.C. Beyond the Extra Respiration of Phagocytosis: NADPH Oxidase 2 in Adaptive Immunity and Inflammation. Front. Immunol. 2021, 12, 3558. [Google Scholar] [CrossRef]
- Glorieux, C.; Calderon, P.B. Catalase, a Remarkable Enzyme: Targeting the Oldest Antioxidant Enzyme to Find a New Cancer Treatment Approach. Biol. Chem. 2017, 398, 1095–1108. [Google Scholar] [CrossRef] [Green Version]
- Jang, B.-C.; Kim, D.-H.; Park, J.-W.; Kwon, T.K.; Kim, S.-P.; Song, D.-K.; Park, J.-G.; Bae, J.-H.; Mun, K.-C.; Baek, W.-K.; et al. Induction of Cyclooxygenase-2 in Macrophages by Catalase: Role of NF-ΚB and PI3K Signaling Pathways. Biochem. Biophys. Res. Commun. 2004, 316, 398–406. [Google Scholar] [CrossRef]
- Kaul, N.; Forman, H.J. Activation of NFκB by the Respiratory Burst of Macrophages. Free Radic. Biol. Med. 1996, 21, 401–405. [Google Scholar] [CrossRef]
- Guha, M.; Mackman, N. The Phosphatidylinositol 3-Kinase-Akt Pathway Limits Lipopolysaccharide Activation of Signaling Pathways and Expression of Inflammatory Mediators in Human Monocytic Cells *. J. Biol. Chem. 2002, 277, 32124–32132. [Google Scholar] [CrossRef] [Green Version]
- Günzl, P.; Bauer, K.; Hainzl, E.; Matt, U.; Dillinger, B.; Mahr, B.; Knapp, S.; Binder, B.R.; Schabbauer, G. Anti-Inflammatory Properties of the PI3K Pathway Are Mediated by IL-10/DUSP Regulation. J. Leukoc. Biol. 2010, 88, 1259–1269. [Google Scholar] [CrossRef] [PubMed]
- Vergadi, E.; Ieronymaki, E.; Lyroni, K.; Vaporidi, K.; Tsatsanis, C. Akt Signaling Pathway in Macrophage Activation and M1/M2 Polarization. J. Immunol. 2017, 198, 1006. [Google Scholar] [CrossRef] [PubMed] [Green Version]
- Schulz, H. Beta Oxidation of Fatty Acids. Biochim. Biophys. Acta BBA—Lipids Lipid Metab. 1991, 1081, 109–120. [Google Scholar] [CrossRef]
- Batista-Gonzalez, A.; Vidal, R.; Criollo, A.; Carreño, L.J. New Insights on the Role of Lipid Metabolism in the Metabolic Reprogramming of Macrophages. Front. Immunol. 2020, 10, 2993. [Google Scholar] [CrossRef]
- Moon, J.-S.; Nakahira, K.; Chung, K.-P.; DeNicola, G.M.; Koo, M.J.; Pabón, M.A.; Rooney, K.T.; Yoon, J.-H.; Ryter, S.W.; Stout-Delgado, H.; et al. NOX4-Dependent Fatty Acid Oxidation Promotes NLRP3 Inflammasome Activation in Macrophages. Nat. Med. 2016, 22, 1002–1012. [Google Scholar] [CrossRef]
- Ellinger, J.J.; Lewis, I.A.; Markley, J.L. Role of Aminotransferases in Glutamate Metabolism of Human Erythrocytes. J. Biomol. NMR 2011, 49, 221–229. [Google Scholar] [CrossRef] [Green Version]
- Liu, P.-S.; Wang, H.; Li, X.; Chao, T.; Teav, T.; Christen, S.; Di Conza, G.; Cheng, W.-C.; Chou, C.-H.; Vavakova, M.; et al. α-Ketoglutarate Orchestrates Macrophage Activation through Metabolic and Epigenetic Reprogramming. Nat. Immunol. 2017, 18, 985–994. [Google Scholar] [CrossRef]
- Woods, S.A.; Schwartzbach, S.D.; Guest, J.R. Two biochemically distinct classes of fumarase in Escherichia coli. Biochimica Biophysica Acta 1988, 954, 14–26. [Google Scholar] [CrossRef]
- Tyrakis, P.A.; Yurkovich, M.E.; Sciacovelli, M.; Papachristou, E.K.; Bridges, H.R.; Gaude, E.; Schreiner, A.; D’Santos, C.; Hirst, J.; Hernandez-Fernaud, J.; et al. Fumarate Hydratase Loss Causes Combined Respiratory Chain Defects. Cell Rep. 2017, 21, 1036–1047. [Google Scholar] [CrossRef] [Green Version]
- Pollard, P.; Wortham, N.; Tomlinson, I. The TCA Cycle and Tumorigenesis: The Examples of Fumarate Hydratase and Succinate Dehydrogenase. Ann. Med. 2003, 35, 634–635. [Google Scholar] [CrossRef]
- McGettrick, A.F.; O’Neill, L.A.J. The Role of HIF in Immunity and Inflammation. Cell Metab. 2020, 32, 524–536. [Google Scholar] [CrossRef] [PubMed]
- Takeda, N.; O’Dea, E.L.; Doedens, A.; Kim, J.; Weidemann, A.; Stockmann, C.; Asagiri, M.; Simon, M.C.; Hoffmann, A.; Johnson, R.S. Differential Activation and Antagonistic Function of HIF-{alpha} Isoforms in Macrophages Are Essential for NO Homeostasis. Genes Dev. 2010, 24, 491–501. [Google Scholar] [CrossRef] [PubMed] [Green Version]
- Wang, T.; Liu, H.; Lian, G.; Zhang, S.-Y.; Wang, X.; Jiang, C. HIF1α-Induced Glycolysis Metabolism Is Essential to the Activation of Inflammatory Macrophages. Mediators Inflamm. 2017, 2017, 9029327. [Google Scholar] [CrossRef] [PubMed] [Green Version]
- Adam, J.; Hatipoglu, E.; O’Flaherty, L.; Ternette, N.; Sahgal, N.; Lockstone, H.; Baban, D.; Nye, E.; Stamp, G.W.; Wolhuter, K.; et al. Renal Cyst Formation in Fh1-Deficient Mice Is Independent of the Hif/Phd Pathway: Roles for Fumarate in KEAP1 Succination and Nrf2 Signaling. Cancer Cell 2011, 20, 524–537. [Google Scholar] [CrossRef] [PubMed] [Green Version]
- Tannahill, G.M.; Curtis, A.M.; Adamik, J.; Palsson-McDermott, E.M.; McGettrick, A.F.; Goel, G.; Frezza, C.; Bernard, N.J.; Kelly, B.; Foley, N.H.; et al. Succinate Is an Inflammatory Signal That Induces IL-1β through HIF-1α. Nature 2013, 496, 238–242. [Google Scholar] [CrossRef] [PubMed]
- Harber, K.J.; de Goede, K.E.; Verberk, S.G.S.; Meinster, E.; de Vries, H.E.; van Weeghel, M.; de Winther, M.P.J.; van den Bossche, J. Succinate Is an Inflammation-Induced Immunoregulatory Metabolite in Macrophages. Metabolites 2020, 10, 372. [Google Scholar] [CrossRef]
- Keiran, N.; Ceperuelo-Mallafré, V.; Calvo, E.; Hernández-Alvarez, M.I.; Ejarque, M.; Núñez-Roa, C.; Horrillo, D.; Maymó-Masip, E.; Rodríguez, M.M.; Fradera, R.; et al. SUCNR1 Controls an Anti-Inflammatory Program in Macrophages to Regulate the Metabolic Response to Obesity. Nat. Immunol. 2019, 20, 581–592. [Google Scholar] [CrossRef]
- Ward, S. Heme Oxygenase-1: A Novel Anti-Inflammatory Mediator. Trends Immunol. 2002, 23, 430. [Google Scholar] [CrossRef]
- Schmidt, E.A.; Fee, B.E.; Henry, S.C.; Nichols, A.G.; Shinohara, M.L.; Rathmell, J.C.; MacIver, N.J.; Coers, J.; Ilkayeva, O.R.; Koves, T.R.; et al. Metabolic Alterations Contribute to Enhanced Inflammatory Cytokine Production in Irgm1-Deficient Macrophages. J. Biol. Chem. 2017, 292, 4651–4662. [Google Scholar] [CrossRef] [Green Version]
- Bafica, A.; Feng, C.G.; Santiago, H.C.; Aliberti, J.; Cheever, A.; Thomas, K.E.; Taylor, G.A.; Vogel, S.N.; Sher, A. The IFN-Inducible GTPase LRG47 (Irgm1) Negatively Regulates TLR4-Triggered Proinflammatory Cytokine Production and Prevents Endotoxemia. J. Immunol. 2007, 179, 5514. [Google Scholar] [CrossRef]
- Kim, J.Y.; Ozato, K. The Sequestosome 1/P62 Attenuates Cytokine Gene Expression in Activated Macrophages by Inhibiting IFN Regulatory Factor 8 and TNF Receptor-Associated Factor 6/NF-ΚB Activity. J. Immunol. 2009, 182, 2131. [Google Scholar] [CrossRef] [PubMed]
- Abrams, C.S.; Wu, H.; Zhao, W.; Belmonte, E.; White, D.; Brass, L.F. Pleckstrin Inhibits Phosphoinositide Hydrolysis Initiated by G-Protein-Coupled and Growth Factor Receptors. A ROLE FOR PLECKSTRIN’S PH DOMAINS ∗. J. Biol. Chem. 1995, 270, 14485–14492. [Google Scholar] [CrossRef] [PubMed] [Green Version]
- Abrams, C.S.; Zhao, W.; Belmonte, E.; Brass, L.F. Protein Kinase C Regulates Pleckstrin by Phosphorylation of Sites Adjacent to the N-Terminal Pleckstrin Homology Domain (∗). J. Biol. Chem. 1995, 270, 23317–23321. [Google Scholar] [CrossRef] [PubMed] [Green Version]
- Dennis, E.A.; Deems, R.A.; Harkewicz, R.; Quehenberger, O.; Brown, H.A.; Milne, S.B.; Myers, D.S.; Glass, C.K.; Hardiman, G.; Reichart, D.; et al. A Mouse Macrophage Lipidome. J. Biol. Chem. 2010, 285, 39976–39985. [Google Scholar] [CrossRef] [PubMed] [Green Version]
- Koganesawa, M.; Yamaguchi, M.; Samuchiwal, S.K.; Balestrieri, B. Lipid Profile of Activated Macrophages and Contribution of Group V Phospholipase A (2). Biomolecules 2020, 11, 25. [Google Scholar] [CrossRef] [PubMed]
- Snider, S.A.; Margison, K.D.; Ghorbani, P.; LeBlond, N.D.; O’Dwyer, C.; Nunes, J.R.C.; Nguyen, T.; Xu, H.; Bennett, S.A.L.; Fullerton, M.D. Choline Transport Links Macrophage Phospholipid Metabolism and Inflammation. J. Biol. Chem. 2018, 293, 11600–11611. [Google Scholar] [CrossRef] [Green Version]
- Schober, C.; Schiller, J.; Pinker, F.; Hengstler, J.G.; Fuchs, B. Lysophosphatidylethanolamine Is—in Contrast to—Choline—Generated under in Vivo Conditions Exclusively by Phospholipase A2 but Not by Hypochlorous Acid. Bioorganic Chem. 2009, 37, 202–210. [Google Scholar] [CrossRef]
- Park, K.S.; Lee, H.Y.; Lee, S.Y.; Kim, M.-K.; Kim, S.D.; Kim, J.M.; Yun, J.; Im, D.-S.; Bae, Y.-S. Lysophosphatidylethanolamine Stimulates Chemotactic Migration and Cellular Invasion in SK-OV3 Human Ovarian Cancer Cells: Involvement of Pertussis Toxin-Sensitive G-Protein Coupled Receptor. FEBS Lett. 2007, 581, 4411–4416. [Google Scholar] [CrossRef] [Green Version]
- Martinon, F.; Mayor, A.; Tschopp, J. The Inflammasomes: Guardians of the Body. Annu. Rev. Immunol. 2009, 27, 229–265. [Google Scholar] [CrossRef] [Green Version]
- Lamkanfi, M.; Kanneganti, T.-D.; Franchi, L.; Núñez, G. Caspase-1 Inflammasomes in Infection and Inflammation. J. Leukoc. Biol. 2007, 82, 220–225. [Google Scholar] [CrossRef] [Green Version]
- Carneiro, A.B.; Iaciura, B.M.F.; Nohara, L.L.; Lopes, C.D.; Veas, E.M.C.; Mariano, V.S.; Bozza, P.T.; Lopes, U.G.; Atella, G.C.; Almeida, I.C.; et al. Lysophosphatidylcholine Triggers TLR2- and TLR4-Mediated Signaling Pathways but Counteracts LPS-Induced NO Synthesis in Peritoneal Macrophages by Inhibiting NF-ΚB Translocation and MAPK/ERK Phosphorylation. PLoS ONE 2013, 8, e76233. [Google Scholar] [CrossRef] [PubMed] [Green Version]
- Quan, H.; Hur, Y.-H.; Xin, C.; Kim, J.-M.; Choi, J.-I.; Kim, M.-Y.; Bae, H.-B. Stearoyl Lysophosphatidylcholine Enhances the Phagocytic Ability of Macrophages through the AMP-Activated Protein Kinase/P38 Mitogen Activated Protein Kinase Pathway. Int. Immunopharmacol. 2016, 39, 328–334. [Google Scholar] [CrossRef] [PubMed]
- Jing, Q.; Xin, S.-M.; Zhang, W.-B.; Wang, P.; Qin, Y.-W.; Pei, G. Lysophosphatidylcholine Activates P38 and P42/44 Mitogen-Activated Protein Kinases in Monocytic THP-1 Cells, but Only P38 Activation Is Involved in Its Stimulated Chemotaxis. Circ. Res. 2000, 87, 52–59. [Google Scholar] [CrossRef] [PubMed]
- Rodríguez-Prados, J.-C.; Través, P.G.; Cuenca, J.; Rico, D.; Aragonés, J.; Martín-Sanz, P.; Cascante, M.; Boscá, L. Substrate Fate in Activated Macrophages: A Comparison between Innate, Classic, and Alternative Activation. J. Immunol. 2010, 185, 605. [Google Scholar] [CrossRef] [Green Version]
- Mills, E.L.; Kelly, B.; Logan, A.; Costa, A.S.H.; Varma, M.; Bryant, C.E.; Tourlomousis, P.; Däbritz, J.H.M.; Gottlieb, E.; Latorre, I.; et al. Succinate Dehydrogenase Supports Metabolic Repurposing of Mitochondria to Drive Inflammatory Macrophages. Cell 2016, 167, 457–470.e13. [Google Scholar] [CrossRef] [Green Version]
- Nakayama, G.R.; Caton, M.C.; Nova, M.P.; Parandoosh, Z. Assessment of the Alamar Blue Assay for Cellular Growth and Viability in Vitro. J. Immunol. Methods 1997, 204, 205–208. [Google Scholar] [CrossRef]
- Spickett, C.M.; Pitt, A.R.; Brown, A.J. Direct Observation of Lipid Hydroperoxides in Phospholipid Vesicles by Electrospray Mass Spectrometry. Free Radic. Biol. Med. 1998, 25, 613–620. [Google Scholar] [CrossRef]
- Green, L.C.; Wagner, D.A.; Glogowski, J.; Skipper, P.L.; Wishnok, J.S.; Tannenbaum, S.R. Analysis of Nitrate, Nitrite, and [15N] Nitrate in Biological Fluids. Anal. Biochem. 1982, 126, 131–138. [Google Scholar] [CrossRef]
- Amado, F.; Domingues, M.R.; Domingues, P.; Ferreira, R.; Vitorino, R. Análise de Proteínas—Guia do Laboratório, 1st ed.; 100Luz: Lisboa, Portugal, 2013; pp. 44–81. [Google Scholar]
- Bligh, E.G.; Dyer, W.J. A rapid method of total lipid extraction and purification. Can. J. Biochem. Physiology 1959, 37, 911–917. [Google Scholar] [CrossRef]
- Bartlett, E.M.; Lewis, D.H. Spectrophotometric Determination of Phosphate Esters in the Presence and Absence of Orthophosphate. Anal. Biochem. 1970, 36, 159–167. [Google Scholar] [CrossRef]
- Guerra, I.M.S.; Diogo, L.; Pinho, M.; Melo, T.; Domingues, P.; Domingues, M.R.; Moreira, A.S.P. Plasma Phospholipidomic Profile Differs between Children with Phenylketonuria and Healthy Children. J. Proteome Res. 2021, 20, 2651–2661. [Google Scholar] [CrossRef] [PubMed]
- Mass Spectrometry-Data Independent Analysis (MS-DIAL). Available online: http://prime.psc.riken.jp/compms/msdial/main.html (accessed on 5 July 2021).
- Pluskal, T.; Castillo, S.; Villar-Briones, A.; Orešič, M. MZmine 2: Modular Framework for Processing, Visualizing, and Analyzing Mass Spectrometry-Based Molecular Profile Data. BMC Bioinformatics 2010, 11, 395. [Google Scholar] [CrossRef] [PubMed] [Green Version]
- Yuan, M.; Breitkopf, S.B.; Yang, X.; Asara, J.M. A Positive/Negative Ion–Switching, Targeted Mass Spectrometry–Based Metabolomics Platform for Bodily Fluids, Cells, and Fresh and Fixed Tissue. Nat. Protoc. 2012, 7, 872–881. [Google Scholar] [CrossRef] [PubMed] [Green Version]
- R: The R Project for Statistical Computing. Available online: https://www.r-project.org/ (accessed on 8 July 2021).
- RStudio: Integrated Development Environment for R. Available online: http://www.rstudio.com/ (accessed on 8 July 2021).
- Karpievitch, Y.V.; Polpitiya, A.D.; Anderson, G.A.; Smith, R.D.; Dabney, A.R. Liquid Chromatography Mass Spectrometry-Based Proteomics: Biological and Technological Aspects. Ann. Appl. Stat. 2010, 4, 1797. [Google Scholar] [CrossRef] [PubMed]
- Stacklies, W.; Redestig, H.; Scholz, M.; Walther, D.; Selbig, J. PcaMethods—A Bioconductor Package Providing PCA Methods for Incomplete Data. Bioinformatics 2007, 23, 1164–1167. [Google Scholar] [CrossRef]
- Wickham, H. Ggplot2: Elegant Graphics for Data Analysis., 2nd ed.; Springer: New York, NY, USA, 2009. [Google Scholar]
- pheatmap: Pretty Heatmaps. Available online: https://CRAN.R-project.org/package=pheatmap (accessed on 12 July 2021).
- Xia, J.; Wishart, D.S. Using MetaboAnalyst 3.0 for Comprehensive Metabolomics Data Analysis. Curr. Protoc. Bioinforma. 2016, 55, 14.10.1–14.10.91. [Google Scholar] [CrossRef]


| CTRL | ω3-PC | ω6-PC | CTRL_LPS | ω3-PC_LPS | |
|---|---|---|---|---|---|
| CTRL | - | ||||
| ω3-PC | 215 | - | |||
| ω6-PC | 726 | 887 | - | ||
| CTRL_LPS | 1346 | 2173 | 993 | - | |
| ω3-PC_LPS | 1498 | 1854 | 1182 | 480 | - |
| ω6-PC_LPS | 2008 | 2541 | 1256 | 225 | 526 |
| CTRL | ω3-PC | ω6-PC | CTRL_LPS | ω3-PC_LPS | |
|---|---|---|---|---|---|
| ω3 | 3 (1CL; 1LPC; 1PC) | - | |||
| ω6 | 14 (2CAR; 5DG; 3LPE; 2PE; 2 PI) | 0 | - | ||
| CTRL-LPS | 44 (2CER;8CL; 10DG;1 HEXCER; 9LPE; 1PE; 5PG; 8PI) | 25 (1CAR;1CER;5CL; 7DG; 4LPE; 3PC; 3PG; 1PI) | 19 (3CAR;2CER;3CL; 1DG;5PC;1PE; 3PG; 1PI) | - | |
| ω3-PC_LPS | 53 (5CER;5CL; 7DG;7LPC;9LPE; 2PC; 3PG; 12PI; 2SM) | 34 (2CAR; 2CER; 2CL; 2DG;7LPC;4LPE; 1PC; 2PG; 11PI) | 16 (2CAR;3CER;2CL; 2LPC;1PE; 2PG; 4PI) | 5 (1DG;3LPC;1PC) | - |
| ω6-PC_LPS | 66 (1CAR;4CER;5CL; 8DG;11LPC; 14LPE; 4PC; 1PE; 4PG; 12PI; 1SM) | 49 (2CER;4CL; 6DG;10LPC; 9LPE; 2PC; 1PE; 2PG; 12PI; 1SM) | 31 (1CAR; 2CER;3CL;5LPC;3LPE; 3PC; 4PG; 9PI; 1SM) | 23 (1CAR; 1CL; 3DG; 8LPC;2LP; 6PC;2SM) | 3 (2LPE; 1PC) |
Publisher’s Note: MDPI stays neutral with regard to jurisdictional claims in published maps and institutional affiliations. |
© 2022 by the authors. Licensee MDPI, Basel, Switzerland. This article is an open access article distributed under the terms and conditions of the Creative Commons Attribution (CC BY) license (https://creativecommons.org/licenses/by/4.0/).
Share and Cite
Maurício, T.; Aveiro, S.; Guedes, S.; Lopes, D.; Melo, T.; Neves, B.M.; Domingues, R.; Domingues, P. Multi-Omic Profiling of Macrophages Treated with Phospholipids Containing Omega-3 and Omega-6 Fatty Acids Reveals Complex Immunomodulatory Adaptations at Protein, Lipid and Metabolic Levels. Int. J. Mol. Sci. 2022, 23, 2139. https://doi.org/10.3390/ijms23042139
Maurício T, Aveiro S, Guedes S, Lopes D, Melo T, Neves BM, Domingues R, Domingues P. Multi-Omic Profiling of Macrophages Treated with Phospholipids Containing Omega-3 and Omega-6 Fatty Acids Reveals Complex Immunomodulatory Adaptations at Protein, Lipid and Metabolic Levels. International Journal of Molecular Sciences. 2022; 23(4):2139. https://doi.org/10.3390/ijms23042139
Chicago/Turabian StyleMaurício, Tatiana, Susana Aveiro, Sofia Guedes, Diana Lopes, Tânia Melo, Bruno M. Neves, Rosário Domingues, and Pedro Domingues. 2022. "Multi-Omic Profiling of Macrophages Treated with Phospholipids Containing Omega-3 and Omega-6 Fatty Acids Reveals Complex Immunomodulatory Adaptations at Protein, Lipid and Metabolic Levels" International Journal of Molecular Sciences 23, no. 4: 2139. https://doi.org/10.3390/ijms23042139
APA StyleMaurício, T., Aveiro, S., Guedes, S., Lopes, D., Melo, T., Neves, B. M., Domingues, R., & Domingues, P. (2022). Multi-Omic Profiling of Macrophages Treated with Phospholipids Containing Omega-3 and Omega-6 Fatty Acids Reveals Complex Immunomodulatory Adaptations at Protein, Lipid and Metabolic Levels. International Journal of Molecular Sciences, 23(4), 2139. https://doi.org/10.3390/ijms23042139