
TRIAC Treatment Improves Impaired Brain Network Function and White Matter Loss in Thyroid Hormone Transporter Mct8/Oatp1c1 Deficient Mice

 , , and
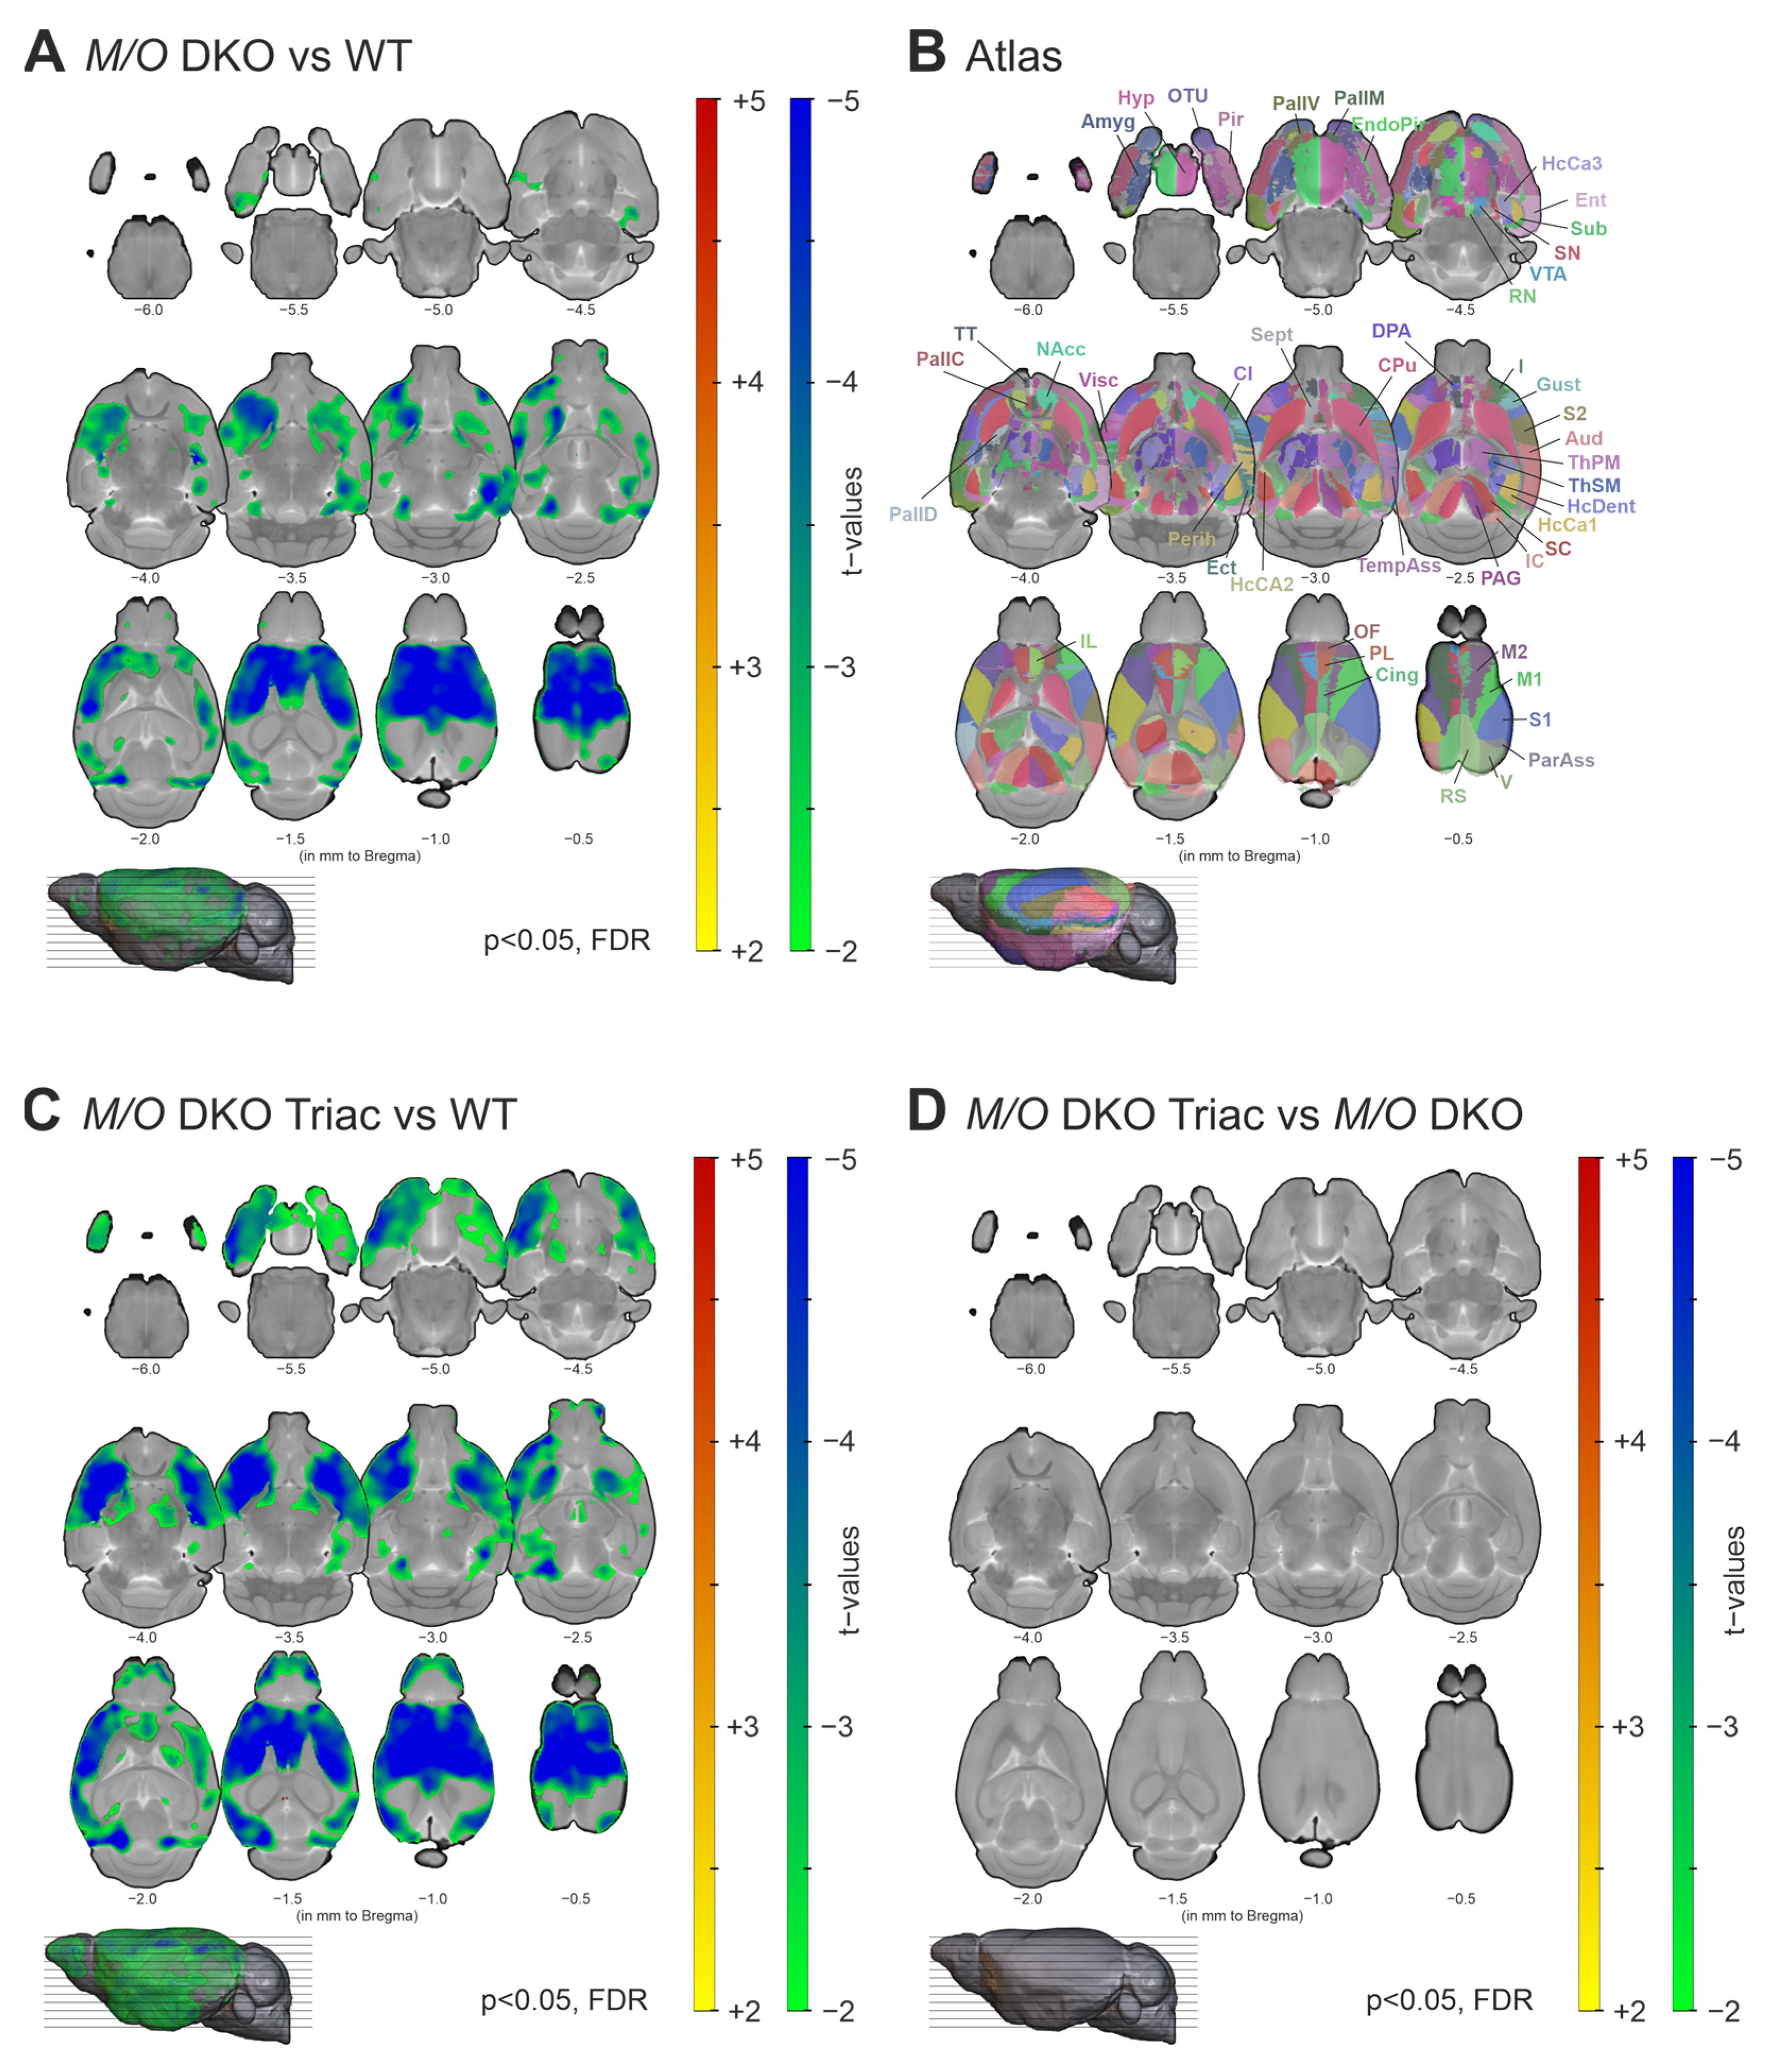
Abstract
1. Introduction
2. Results
2.1. Grey Matter Volume Is Prominently Reduced in Mct8/Oatp1c1 DKO Mice and Cannot Be Rescued by Early-Life Treatment with TRIAC
2.2. Mct8/Oatp1c1 DKO Mice Show White Matter Thinning in the Corpus Callosum, Which Can Be Significantly Improved by Early-Life Treatment with TRIAC
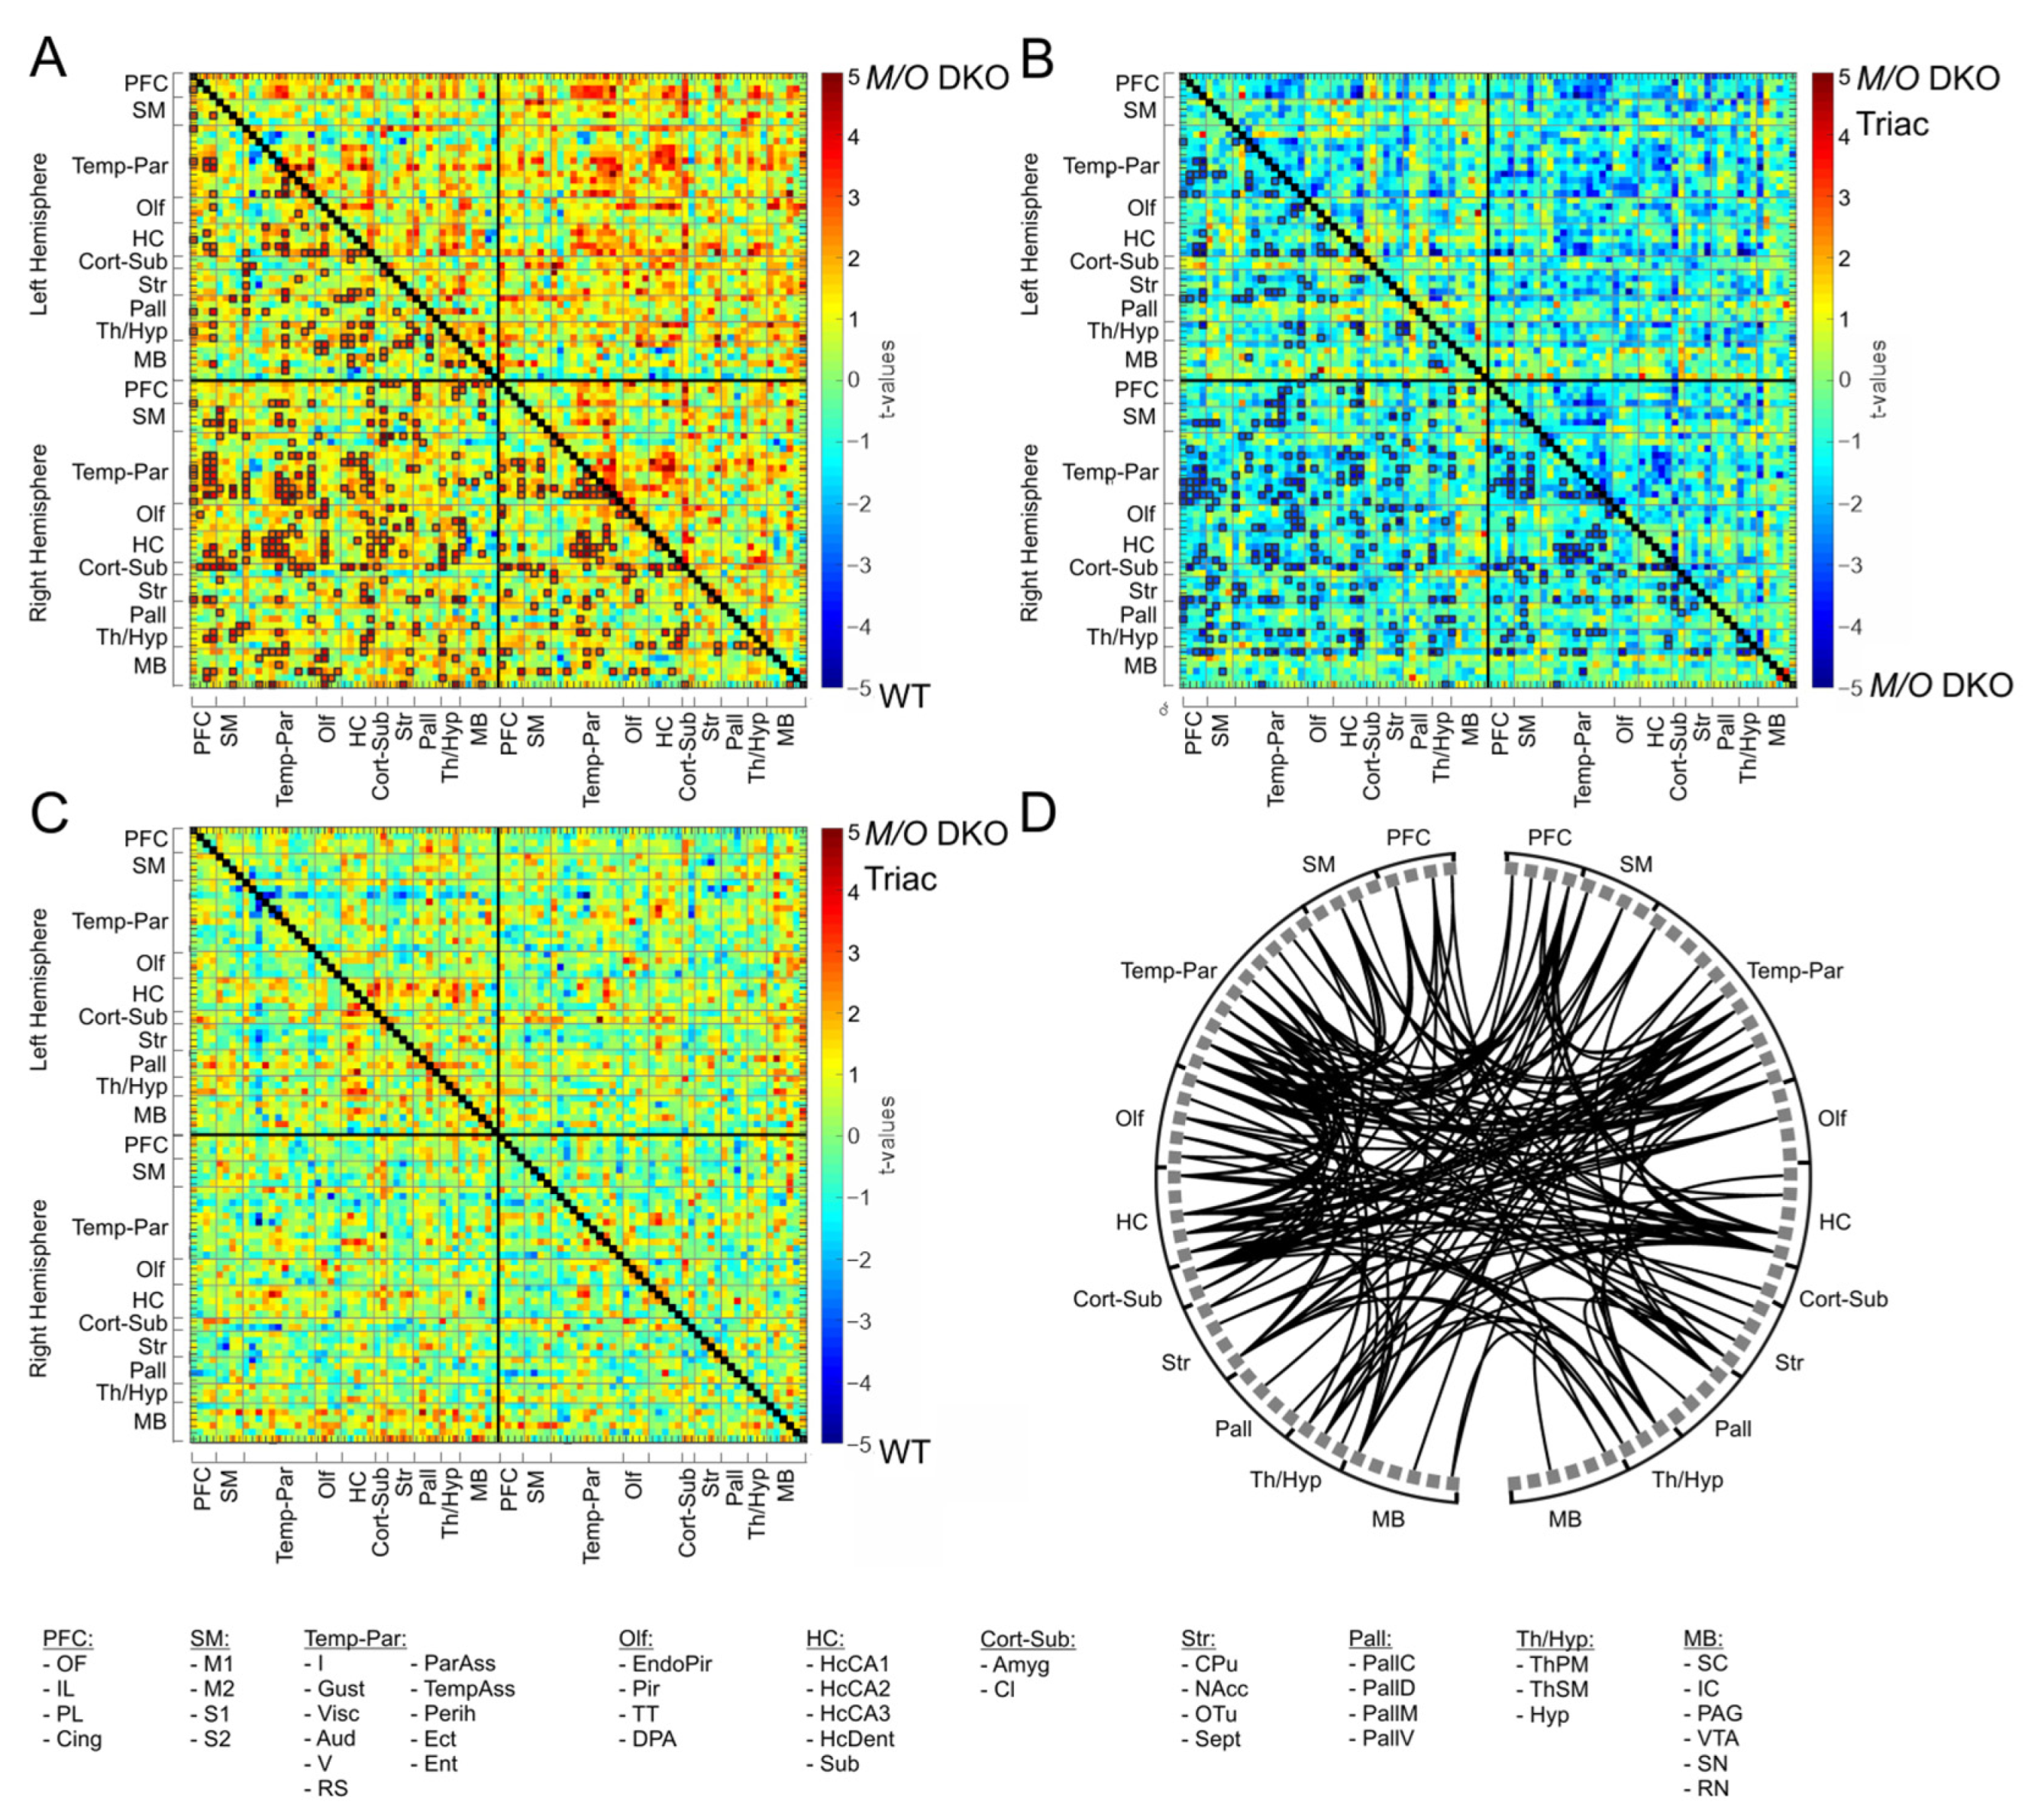
2.3. Functional Connectivity Is Strongly Increased within a Broad Cortico-Subcortical Network in Mct8/Oatp1c1 DKO Mice and Can Partially Be Normalized by TRIAC Treatment
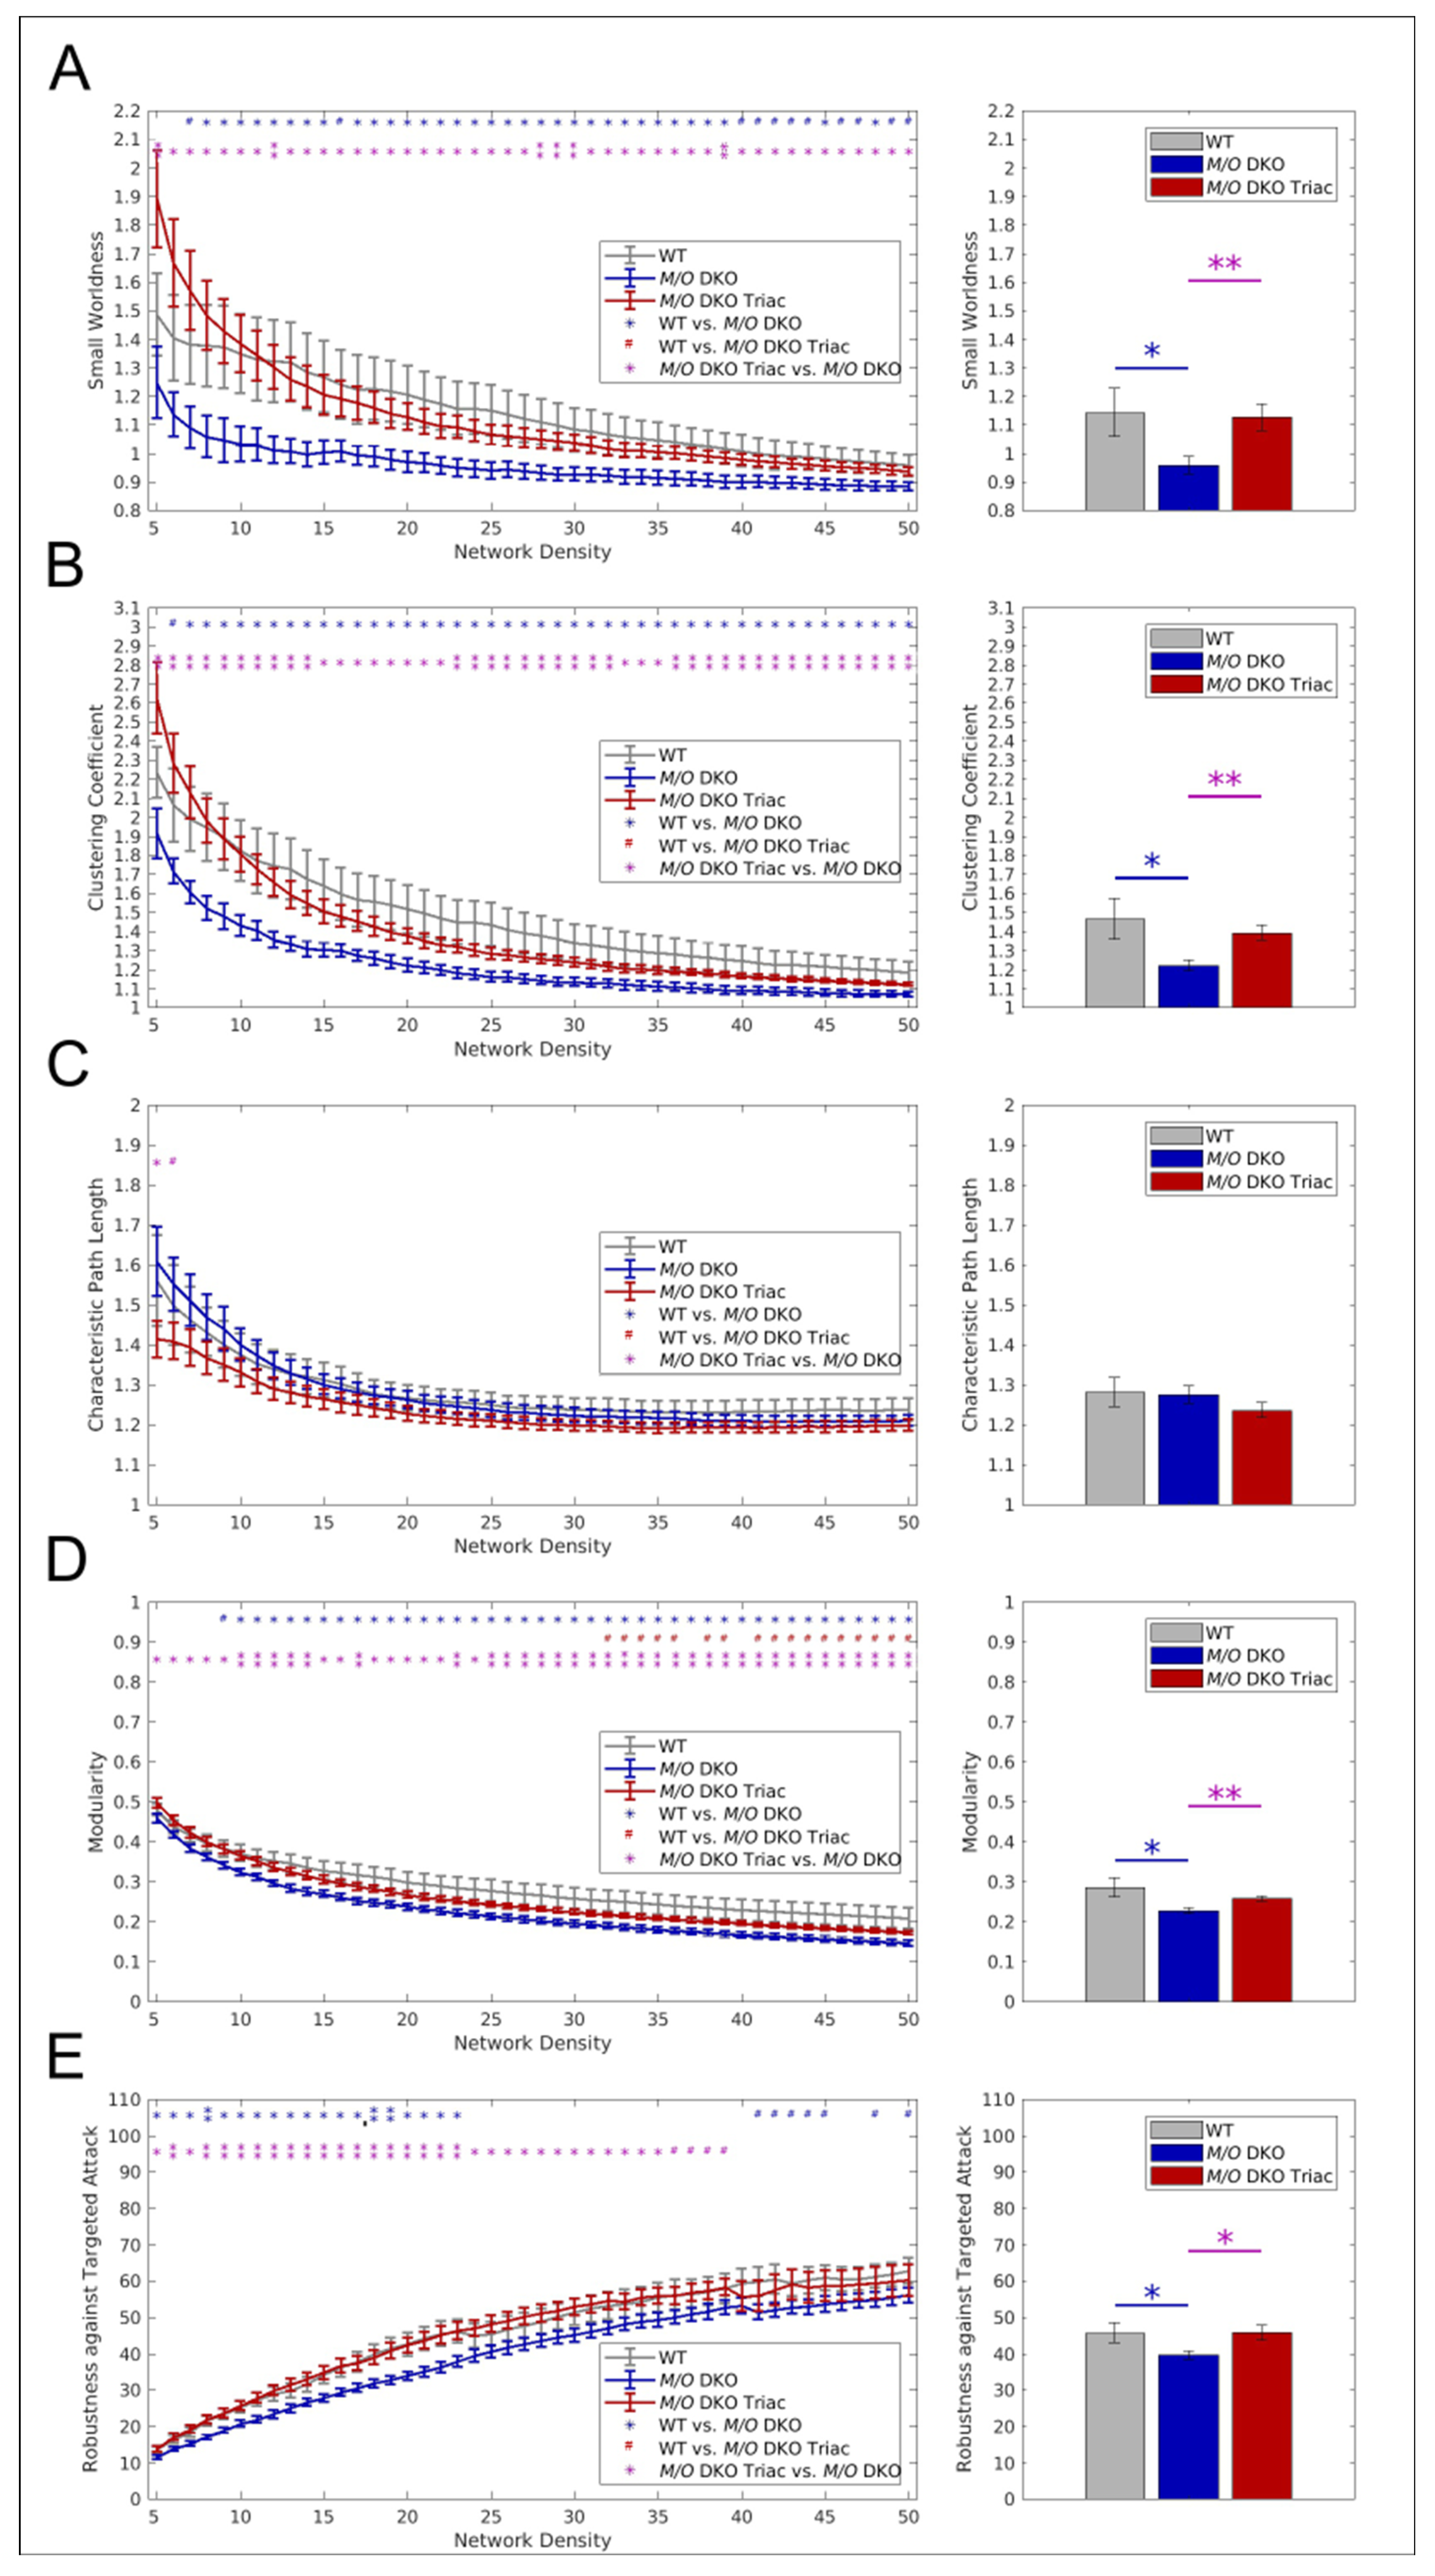
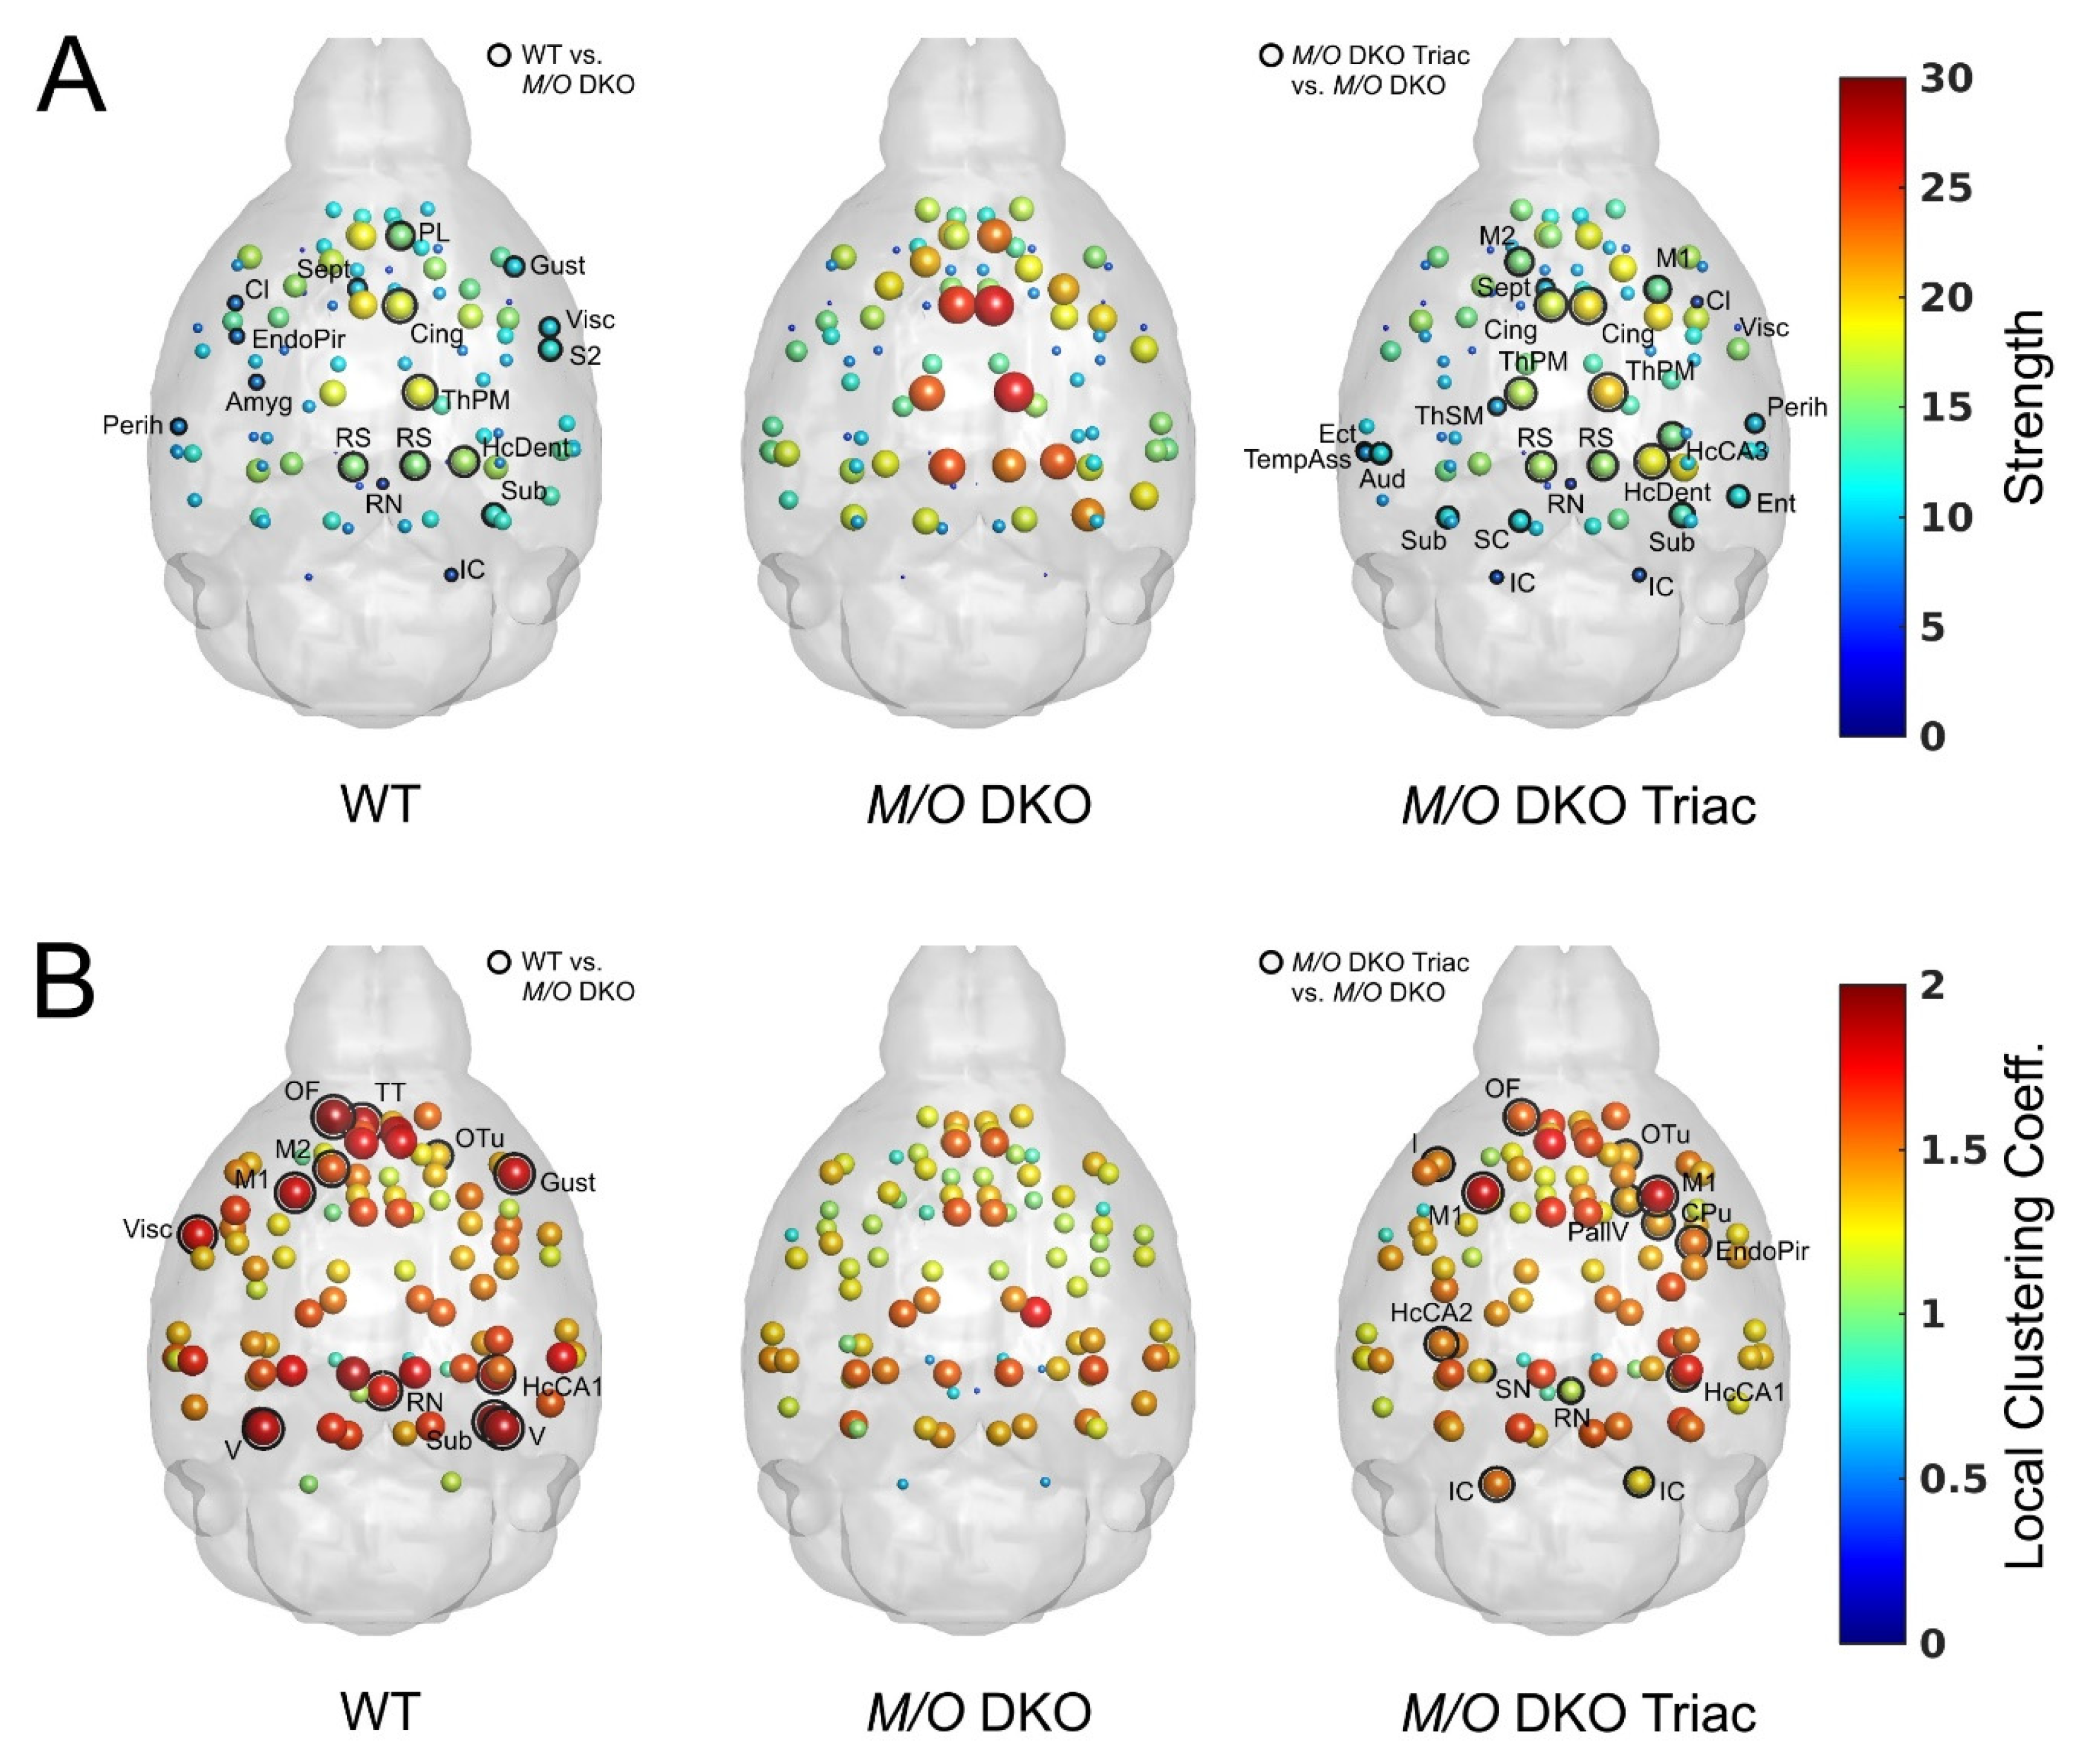
2.4. Global and Local Brain Network Function Is Strongly Impaired in Mct8/Oatp1c1 DKO Mice and Can Be Restored by Early-Life Treatment with TRIAC
3. Discussion
Limitations
4. Materials and Methods
4.1. Animals
4.2. Study Approval
4.3. MRI Acquisition
4.4. Voxel-Based Morphometry (VBM)
4.5. Preprocessing of rs-fMRI Data
4.6. Network-Based Statistic
4.7. Graph-Theoretical Analyses
4.7.1. Network Construction and Density
4.7.2. Graph Metrics for Assessing Regional and Global Architecture
5. Conclusions
Supplementary Materials
Author Contributions
Funding
Institutional Review Board Statement
Informed Consent Statement
Data Availability Statement
Acknowledgments
Conflicts of Interest
References
- Friesema, E.C.; Ganguly, S.; Abdalla, A.; Fox, J.E.M.; Halestrap, A.P.; Visser, T.J. Identification of monocarboxylate transporter 8 as a specific thyroid hormone transporter. J. Biol. Chem. 2003, 278, 40128–40135. [Google Scholar] [CrossRef] [PubMed]
- Groeneweg, S.; van Geest, F.S.; Abacı, A.; Alcantud, A.; Ambegaonkar, G.P.; Armour, C.M.; Bakhtiani, P.; Barca, D.; Bertini, E.S.; van Beynum, I.M.; et al. Disease characteristics of MCT8 deficiency: An international, retrospective, multicentre cohort study. Lancet Diabetes Endocrinol. 2020, 8, 594–605. [Google Scholar] [CrossRef] [PubMed]
- López-Espíndola, D.; García-Aldea, Á.; Gómez de la Riva, I.; Rodríguez-García, A.M.; Salvatore, D.; Visser, T.J.; Bernal, J.; Guadaño-Ferraz, A. Thyroid hormone availability in the human fetal brain: Novel entry pathways and role of radial glia. Brain Struct. Funct. 2019, 224, 2103–2119. [Google Scholar] [CrossRef] [PubMed]
- Ito, K.; Uchida, Y.; Ohtsuki, S.; Aizawa, S.; Kawakami, H.; Katsukura, Y.; Kamiie, J.; Terasaki, T. Quantitative membrane protein expression at the blood-brain barrier of adult and younger cynomolgus monkeys. J. Pharm. Sci. 2011, 100, 3939–3950. [Google Scholar] [CrossRef]
- Roberts, L.M.; Woodford, K.; Zhou, M.; Black, D.S.; Haggerty, J.E.; Tate, E.H.; Grindstaff, K.K.; Mengesha, W.; Raman, C.; Zerangue, N. Expression of the thyroid hormone transporters monocarboxylate transporter-8 (SLC16A2) and organic ion transporter-14 (SLCO1C1) at the blood-brain barrier. Endocrinology 2008, 149, 6251–6261. [Google Scholar] [CrossRef]
- Mayerl, S.; Muller, J.; Bauer, R.; Richert, S.; Kassmann, C.M.; Darras, V.M.; Buder, K.; Boelen, A.; Visser, T.J.; Heuer, H. Transporters MCT8 and OATP1C1 maintain murine brain thyroid hormone homeostasis. J. Clin. Investig. 2014, 124, 1987–1999. [Google Scholar] [CrossRef]
- Groeneweg, S.; Peeters, R.P.; Visser, T.J.; Visser, W.E. Triiodothyroacetic acid in health and disease. J. Endocrinol. 2017, 234, R99–R121. [Google Scholar] [CrossRef]
- Groeneweg, S.; Peeters, R.P.; Moran, C.; Stoupa, A.; Auriol, F.; Tonduti, D.; Dica, A.; Paone, L.; Rozenkova, K.; Malikova, J.; et al. Effectiveness and safety of the tri-iodothyronine analogue Triac in children and adults with MCT8 deficiency: An international, single-arm, open-label, phase 2 trial. Lancet Diabetes Endocrinol. 2019, 7, 695–706. [Google Scholar] [CrossRef]
- Groeneweg, S.; Peeters, R.P.; Visser, T.J.; Visser, W.E. Therapeutic applications of thyroid hormone analogues in resistance to thyroid hormone (RTH) syndromes. Mol. Cell. Endocrinol. 2017, 458, 82–90. [Google Scholar] [CrossRef]
- Kersseboom, S.; Horn, S.; Visser, W.E.; Chen, J.; Friesema, E.C.; Vaurs-Barriere, C.; Peeters, R.P.; Heuer, H.; Visser, T.J. In vitro and mouse studies supporting therapeutic utility of triiodothyroacetic acid in MCT8 deficiency. Mol. Endocrinol. 2014, 28, 1961–1970. [Google Scholar] [CrossRef]
- van Geest, F.S.; Groeneweg, S.; van den Akker, E.L.T.; Bacos, I.; Barca, D.; van den Berg, S.A.A.; Bertini, E.; Brunner, D.; Brunetti-Pierri, N.; Cappa, M.; et al. Long-Term Efficacy of T3 Analogue Triac in Children and Adults With MCT8 Deficiency: A Real-Life Retrospective Cohort Study. J. Clin. Endocrinol. Metab. 2021, 107, e1136–e1147. [Google Scholar] [CrossRef]
- McIntosh, A.L.; Gormley, S.; Tozzi, L.; Frodl, T.; Harkin, A. Recent Advances in Translational Magnetic Resonance Imaging in Animal Models of Stress and Depression. Front. Cell. Neurosci. 2017, 11, 150. [Google Scholar] [CrossRef] [PubMed]
- Ashburner, J.; Friston, K.J. Voxel-based morphometry—The methods. NeuroImage 2000, 11, 805–821. [Google Scholar] [CrossRef] [PubMed]
- Biswal, B.B. Resting state fMRI: A personal history. NeuroImage 2012, 62, 938–944. [Google Scholar] [CrossRef] [PubMed]
- Poldrack, R.A.; Farah, M.J. Progress and challenges in probing the human brain. Nature 2015, 526, 371–379. [Google Scholar] [CrossRef]
- Artigas, F.; Schenker, E.; Celada, P.; Spedding, M.; Llado-Pelfort, L.; Jurado, N.; Nunez, M.; Santana, N.; Troyano-Rodriguez, E.; Riga, M.S.; et al. Defining the brain circuits involved in psychiatric disorders: IMI-NEWMEDS. Nat. Reviews. Drug Discov. 2017, 16, 1–2. [Google Scholar] [CrossRef]
- Bogdan, R.; Salmeron, B.J.; Carey, C.E.; Agrawal, A.; Calhoun, V.D.; Garavan, H.; Hariri, A.R.; Heinz, A.; Hill, M.N.; Holmes, A.; et al. Imaging Genetics and Genomics in Psychiatry: A Critical Review of Progress and Potential. Biol. Psychiatry 2017, 82, 165–175. [Google Scholar] [CrossRef]
- Gass, N.; Weber-Fahr, W.; Sartorius, A.; Becker, R.; Didriksen, M.; Stensbol, T.B.; Bastlund, J.F.; Meyer-Lindenberg, A.; Schwarz, A.J. An acetylcholine alpha7 positive allosteric modulator rescues a schizophrenia-associated brain endophenotype in the 15q13.3 microdeletion, encompassing CHRNA7. Eur. Neuropsychopharmacol. 2016, 26, 1150–1160. [Google Scholar] [CrossRef]
- Reinwald, J.; Becker, R.; Mallien, A.; Falfan-Melgoza, C.; Sack, M.; Clemm von Hohenberg, C.; Braun, U.; Cosa Linan, A.; Gass, N.; Vasilescu, A.; et al. Neural Mechanisms of Early-Life Social Stress as a Developmental Risk Factor for Severe Psychiatric Disorders. Biol. Psychiatry 2018, 84, 116–128. [Google Scholar] [CrossRef]
- Reinwald, J.; Sartorius, A.; Weber-Fahr, W.; Sack, M.; Becker, R.; Didriksen, M.; Stensbøl, T.; Schwarz, A.; Meyer-Lindenberg, A.; Gass, N. Separable neural mechanisms for the pleiotropic association of copy number variants with neuropsychiatric traits. Transl. Psychiatry 2020, 10, 93. [Google Scholar] [CrossRef]
- Reinwald, J.R.; Gass, N.; Mallien, A.S.; Sartorius, A.; Becker, R.; Sack, M.; Falfan-Melgoza, C.; Clemm von Hohenberg, C.; Leo, D.; Pfeiffer, N.; et al. Dopamine transporter silencing in the rat: Systems-level alterations in striato-cerebellar and prefrontal-midbrain circuits. Mol. Psychiatry 2022, 27, 2329–2339. [Google Scholar] [CrossRef]
- López-Espíndola, D.; Morales-Bastos, C.; Grijota-Martínez, C.; Liao, X.H.; Lev, D.; Sugo, E.; Verge, C.F.; Refetoff, S.; Bernal, J.; Guadaño-Ferraz, A. Mutations of the thyroid hormone transporter MCT8 cause prenatal brain damage and persistent hypomyelination. J. Clin. Endocrinol. Metab. 2014, 99, E2799–E2804. [Google Scholar] [CrossRef] [PubMed]
- Valcárcel-Hernández, V.; López-Espíndola, D.; Guillén-Yunta, M.; García-Aldea, Á.; López de Toledo Soler, I.; Bárez-López, S.; Guadaño-Ferraz, A. Deficient thyroid hormone transport to the brain leads to impairments in axonal caliber and oligodendroglial development. Neurobiol. Dis. 2022, 162, 105567. [Google Scholar] [CrossRef]
- Farahani, F.V.; Karwowski, W.; Lighthall, N.R. Application of Graph Theory for Identifying Connectivity Patterns in Human Brain Networks: A Systematic Review. Front. Neurosci. 2019, 13, 585. [Google Scholar] [CrossRef] [PubMed]
- Braun, U.; Schaefer, A.; Betzel, R.F.; Tost, H.; Meyer-Lindenberg, A.; Bassett, D.S. From Maps to Multi-dimensional Network Mechanisms of Mental Disorders. Neuron 2018, 97, 14–31. [Google Scholar] [CrossRef] [PubMed]
- Bassett, D.S.; Brown, J.A.; Deshpande, V.; Carlson, J.M.; Grafton, S.T. Conserved and variable architecture of human white matter connectivity. NeuroImage 2011, 54, 1262–1279. [Google Scholar] [CrossRef]
- Vancamp, P.; Demeneix, B.A.; Remaud, S. Monocarboxylate transporter 8 deficiency: Delayed or permanent hypomyelination? Front. Endocrinol. 2020, 11, 283. [Google Scholar] [CrossRef]
- Perri, K.; De Mori, L.; Tortora, D.; Calevo, M.G.; Allegri, A.E.M.; Napoli, F.; Patti, G.; Fava, D.; Crocco, M.; Schiavone, M.; et al. Cognitive and White Matter Microstructure Development in Congenital Hypothyroidism and Familial Thyroid Disorders. J. Clin. Endocrinol. Metab. 2021, 106, e3990–e4006. [Google Scholar] [CrossRef]
- Masnada, S.; Sarret, C.; Antonello, C.E.; Fadilah, A.; Krude, H.; Mura, E.; Mordekar, S.; Nicita, F.; Olivotto, S.; Orcesi, S.; et al. Movement disorders in MCT8 deficiency/Allan-Herndon-Dudley Syndrome. Mol. Genet. Metab. 2022, 135, 109–113. [Google Scholar] [CrossRef]
- Tonduti, D.; Vanderver, A.; Berardinelli, A.; Schmidt, J.L.; Collins, C.D.; Novara, F.; Genni, A.D.; Mita, A.; Triulzi, F.; Brunstrom-Hernandez, J.E.; et al. MCT8 deficiency: Extrapyramidal symptoms and delayed myelination as prominent features. J. Child Neurol. 2013, 28, 795–800. [Google Scholar] [CrossRef]
- Liao, X.; Vasilakos, A.V.; He, Y. Small-world human brain networks: Perspectives and challenges. Neurosci. Biobehav. Rev. 2017, 77, 286–300. [Google Scholar] [CrossRef] [PubMed]
- Kana, R.K.; Uddin, L.Q.; Kenet, T.; Chugani, D.; Müller, R.A. Brain connectivity in autism. Front. Hum. Neurosci. 2014, 8, 349. [Google Scholar] [CrossRef] [PubMed]
- Alexander-Bloch, A.F.; Gogtay, N.; Meunier, D.; Birn, R.; Clasen, L.; Lalonde, F.; Lenroot, R.; Giedd, J.; Bullmore, E.T. Disrupted modularity and local connectivity of brain functional networks in childhood-onset schizophrenia. Front. Syst. Neurosci. 2010, 4, 147. [Google Scholar] [CrossRef] [PubMed]
- Alexander-Bloch, A.F.; Vertes, P.E.; Stidd, R.; Lalonde, F.; Clasen, L.; Rapoport, J.; Giedd, J.; Bullmore, E.T.; Gogtay, N. The anatomical distance of functional connections predicts brain network topology in health and schizophrenia. Cereb. Cortex 2013, 23, 127–138. [Google Scholar] [CrossRef]
- Fornito, A.; Zalesky, A.; Breakspear, M. The connectomics of brain disorders. Nat. Reviews. Neurosci. 2015, 16, 159–172. [Google Scholar] [CrossRef]
- Fornito, A.; Zalesky, A.; Pantelis, C.; Bullmore, E.T. Schizophrenia, neuroimaging and connectomics. NeuroImage 2012, 62, 2296–2314. [Google Scholar] [CrossRef]
- Bruno, J.L.; Hosseini, S.M.H.; Saggar, M.; Quintin, E.M.; Raman, M.M.; Reiss, A.L. Altered Brain Network Segregation in Fragile X Syndrome Revealed by Structural Connectomics. Cereb. Cortex 2017, 27, 2249–2259. [Google Scholar] [CrossRef]
- Millan, M.J.; Agid, Y.; Brune, M.; Bullmore, E.T.; Carter, C.S.; Clayton, N.S.; Connor, R.; Davis, S.; Deakin, B.; DeRubeis, R.J.; et al. Cognitive dysfunction in psychiatric disorders: Characteristics, causes and the quest for improved therapy. Nat. Rev. Drug Discov. 2012, 11, 141–168. [Google Scholar] [CrossRef]
- Friesema, E.C.; Grueters, A.; Biebermann, H.; Krude, H.; von Moers, A.; Reeser, M.; Barrett, T.G.; Mancilla, E.E.; Svensson, J.; Kester, M.H.; et al. Association between mutations in a thyroid hormone transporter and severe X-linked psychomotor retardation. Lancet 2004, 364, 1435–1437. [Google Scholar] [CrossRef]
- Dumitrescu, A.M.; Liao, X.H.; Best, T.B.; Brockmann, K.; Refetoff, S. A novel syndrome combining thyroid and neurological abnormalities is associated with mutations in a monocarboxylate transporter gene. Am. J. Hum. Genet. 2004, 74, 168–175. [Google Scholar] [CrossRef]
- Richard, S.; Guyot, R.; Rey-Millet, M.; Prieux, M.; Markossian, S.; Aubert, D.; Flamant, F. A Pivotal Genetic Program Controlled by Thyroid Hormone during the Maturation of GABAergic Neurons. iScience 2020, 23, 100899. [Google Scholar] [CrossRef]
- Mayerl, S.; Chen, J.; Salveridou, E.; Boelen, A.; Darras, V.M.; Heuer, H. Thyroid Hormone Transporter Deficiency in Mice Impacts Multiple Stages of GABAergic Interneuron Development. Cereb. Cortex 2021, 32, 329–341. [Google Scholar] [CrossRef] [PubMed]
- Chen, J.; Salveridou, E.; Liebmann, L.; Sundaram, S.M.; Doycheva, D.; Markova, B.; Hübner, C.A.; Boelen, A.; Visser, W.E.; Heuer, H.; et al. Triac treatment prevents neurodevelopmental and locomotor impairments in Mct8/Oatp1c1 double knockout mice. bioRxiv 2022. [Google Scholar] [CrossRef]
- Pagani, M.; Barsotti, N.; Bertero, A.; Trakoshis, S.; Ulysse, L.; Locarno, A.; Miseviciute, I.; De Felice, A.; Canella, C.; Supekar, K. mTOR-related synaptic pathology causes autism spectrum disorder-associated functional hyperconnectivity. Nat. Commun. 2021, 12, 6084. [Google Scholar] [CrossRef] [PubMed]
- Mayerl, S.; Alcaide Martin, A.; Bauer, R.; Schwaninger, M.; Heuer, H.; ffrench-Constant, C. Distinct Actions of the Thyroid Hormone Transporters Mct8 and Oatp1c1 in Murine Adult Hippocampal Neurogenesis. Cells 2022, 11, 524. [Google Scholar] [CrossRef]
- Asan, L.; Falfán-Melgoza, C.; Beretta, C.A.; Sack, M.; Zheng, L.; Weber-Fahr, W.; Kuner, T.; Knabbe, J. Cellular correlates of gray matter volume changes in magnetic resonance morphometry identified by two-photon microscopy. Sci. Rep. 2021, 11, 4234. [Google Scholar] [CrossRef]
- Sundaram, S.M.; Arrulo Pereira, A.; Müller-Fielitz, H.; Köpke, H.; De Angelis, M.; Müller, T.D.; Heuer, H.; Körbelin, J.; Krohn, M.; Mittag, J.; et al. Gene therapy targeting the blood-brain barrier improves neurological symptoms in a model of genetic MCT8 deficiency. Brain 2022. Online ahead of print. [Google Scholar] [CrossRef]
- Liao, X.H.; Avalos, P.; Shelest, O.; Ofan, R.; Shilo, M.; Bresee, C.; Likhite, S.; Vit, J.P.; Heuer, H.; Kaspar, B.; et al. AAV9-MCT8 Delivery at Juvenile Stage Ameliorates Neurological and Behavioral Deficits in a Mouse Model of MCT8-Deficiency. Thyroid 2022, 32, 849–859. [Google Scholar] [CrossRef]
- Mayerl, S.; Visser, T.J.; Veerle, M.D.; Horn, S.; Heuer, H. Impact of Oatp1c1 Deficiency on Thyroid Hormone Metabolism and Action in the Mouse Brain. Endocrinology 2012, 153, 1528–1537. [Google Scholar] [CrossRef]
- Trajkovic, M.; Visser, T.J.; Mittag, J.; Horn, S.; Lukas, J.; Darras, V.M.; Raivich, G.; Bauer, K.; Heuer, H. Abnormal thyroid hormone metabolism in mice lacking the monocarboxylate transporter 8. J. Clin. Investig. 2007, 117, 627–635. [Google Scholar] [CrossRef]
- Bilbao, A.; Falfan-Melgoza, C.; Leixner, S.; Becker, R.; Singaravelu, S.K.; Sack, M.; Sartorius, A.; Spanagel, R.; Weber-Fahr, W. Longitudinal Structural and Functional Brain Network Alterations in a Mouse Model of Neuropathic Pain. Neuroscience 2018, 387, 104–115. [Google Scholar] [CrossRef] [PubMed]
- Chou, N.; Wu, J.; Bai Bingren, J.; Qiu, A.; Chuang, K.H. Robust automatic rodent brain extraction using 3-D pulse-coupled neural networks (PCNN). IEEE Trans. Image Process. 2011, 20, 2554–2564. [Google Scholar] [CrossRef] [PubMed]
- Biedermann, S.; Fuss, J.; Zheng, L.; Sartorius, A.; Falfan-Melgoza, C.; Demirakca, T.; Gass, P.; Ende, G.; Weber-Fahr, W. In vivo voxel based morphometry: Detection of increased hippocampal volume and decreased glutamate levels in exercising mice. NeuroImage 2012, 61, 1206–1212. [Google Scholar] [CrossRef] [PubMed]
- Ashburner, J. A fast diffeomorphic image registration algorithm. NeuroImage 2007, 38, 95–113. [Google Scholar] [CrossRef] [PubMed]
- van Buuren, M.; Gladwin, T.E.; Zandbelt, B.B.; van den Heuvel, M.; Ramsey, N.F.; Kahn, R.S.; Vink, M. Cardiorespiratory effects on default-mode network activity as measured with fMRI. Hum. Brain Mapp. 2009, 30, 3031–3042. [Google Scholar] [CrossRef]
- Dorr, A.E.; Lerch, J.P.; Spring, S.; Kabani, N.; Henkelman, R.M. High resolution three-dimensional brain atlas using an average magnetic resonance image of 40 adult C57Bl/6J mice. NeuroImage 2008, 42, 60–69. [Google Scholar] [CrossRef]
- Afyouni, S.; Nichols, T.E. Insight and inference for DVARS. NeuroImage 2018, 172, 291–312. [Google Scholar] [CrossRef]
- Power, J.D.; Barnes, K.A.; Snyder, A.Z.; Schlaggar, B.L.; Petersen, S.E. Spurious but systematic correlations in functional connectivity MRI networks arise from subject motion. NeuroImage 2012, 59, 2142–2154. [Google Scholar] [CrossRef]
- Power, J.D.; Mitra, A.; Laumann, T.O.; Snyder, A.Z.; Schlaggar, B.L.; Petersen, S.E. Methods to detect, characterize, and remove motion artifact in resting state fMRI. NeuroImage 2014, 84, 320–341. [Google Scholar] [CrossRef]
- Cox, R.W. AFNI: Software for analysis and visualization of functional magnetic resonance neuroimages. Comput. Biomed. Res. Int. J. 1996, 29, 162–173. [Google Scholar] [CrossRef]
- Lein, E.S.; Hawrylycz, M.J.; Ao, N.; Ayres, M.; Bensinger, A.; Bernard, A.; Boe, A.F.; Boguski, M.S.; Brockway, K.S.; Byrnes, E.J.; et al. Genome-wide atlas of gene expression in the adult mouse brain. Nature 2007, 445, 168–176. [Google Scholar] [CrossRef]
- Zalesky, A.; Fornito, A.; Bullmore, E.T. Network-based statistic: Identifying differences in brain networks. NeuroImage 2010, 53, 1197–1207. [Google Scholar] [CrossRef]
- Clemm von Hohenberg, C.; Weber-Fahr, W.; Lebhardt, P.; Ravi, N.; Braun, U.; Gass, N.; Becker, R.; Sack, M.; Cosa Linan, A.; Gerchen, M.F.; et al. Lateral habenula perturbation reduces default-mode network connectivity in a rat model of depression. Transl. Psychiatry 2018, 8, 68. [Google Scholar] [CrossRef]
- Sack, M.; Zheng, L.; Gass, N.; Ende, G.; Sartorius, A.; Weber-Fahr, W. Interactive tool to create adjustable anatomical atlases for mouse brain imaging. Magn. Reson. Mater. Phys. Biol. Med. 2021, 34, 183–187. [Google Scholar] [CrossRef]
- Rubinov, M.; Sporns, O. Complex network measures of brain connectivity: Uses and interpretations. NeuroImage 2010, 52, 1059–1069. [Google Scholar] [CrossRef]
- Lynall, M.E.; Bassett, D.S.; Kerwin, R.; McKenna, P.J.; Kitzbichler, M.; Muller, U.; Bullmore, E. Functional connectivity and brain networks in schizophrenia. J. Neurosci. 2010, 30, 9477–9487. [Google Scholar] [CrossRef]
- Becker, R.; Braun, U.; Schwarz, A.J.; Gass, N.; Schweiger, J.I.; Weber-Fahr, W.; Schenker, E.; Spedding, M.; Clemm von Hohenberg, C.; Risterucci, C.; et al. Species-conserved reconfigurations of brain network topology induced by ketamine. Transl. Psychiatry 2016, 6, e786. [Google Scholar] [CrossRef]
- Gass, N.; Becker, R.; Schwarz, A.J.; Weber-Fahr, W.; Clemm von Hohenberg, C.; Vollmayr, B.; Sartorius, A. Brain network reorganization differs in response to stress in rats genetically predisposed to depression and stress-resilient rats. Transl. Psychiatry 2016, 6, e970. [Google Scholar] [CrossRef]
- Reichardt, J.; Bornholdt, S. Statistical mechanics of community detection. Phys. Rev. E 2006, 74, 016110. [Google Scholar] [CrossRef]
- Newman, M.E.J. Finding community structure in networks using the eigenvectors of matrices. Phys. Rev. E 2006, 74, 036104. [Google Scholar] [CrossRef]
- Chen, Y.; Paul, G.; Cohen, R.; Havlin, S.; Borgatti, S.P.; Liljeros, F.; Stanley, H.E. Percolation theory applied to measures of fragmentation in social networks. Phys. Review. E Stat. Nonlinear Soft Matter Phys. 2007, 75, 046107. [Google Scholar] [CrossRef]
- Latora, V.; Marchiori, M. Efficient behavior of small-world networks. Phys. Rev. Lett. 2001, 87, 198701. [Google Scholar] [CrossRef]
- Humphries, M.D.; Gurney, K.; Prescott, T.J. The brainstem reticular formation is a small-world, not scale-free, network. Proc. Biol. Sci. 2006, 273, 503–511. [Google Scholar] [CrossRef]
- Watts, D.J.; Strogatz, S.H. Collective dynamics of ‘small-world’ networks. Nature 1998, 393, 440–442. [Google Scholar] [CrossRef]


Publisher’s Note: MDPI stays neutral with regard to jurisdictional claims in published maps and institutional affiliations. |
© 2022 by the authors. Licensee MDPI, Basel, Switzerland. This article is an open access article distributed under the terms and conditions of the Creative Commons Attribution (CC BY) license (https://creativecommons.org/licenses/by/4.0/).
Share and Cite
Reinwald, J.R.; Weber-Fahr, W.; Cosa-Linan, A.; Becker, R.; Sack, M.; Falfan-Melgoza, C.; Gass, N.; Braun, U.; Clemm von Hohenberg, C.; Chen, J.; et al. TRIAC Treatment Improves Impaired Brain Network Function and White Matter Loss in Thyroid Hormone Transporter Mct8/Oatp1c1 Deficient Mice. Int. J. Mol. Sci. 2022, 23, 15547. https://doi.org/10.3390/ijms232415547
Reinwald JR, Weber-Fahr W, Cosa-Linan A, Becker R, Sack M, Falfan-Melgoza C, Gass N, Braun U, Clemm von Hohenberg C, Chen J, et al. TRIAC Treatment Improves Impaired Brain Network Function and White Matter Loss in Thyroid Hormone Transporter Mct8/Oatp1c1 Deficient Mice. International Journal of Molecular Sciences. 2022; 23(24):15547. https://doi.org/10.3390/ijms232415547
Chicago/Turabian StyleReinwald, Jonathan Rochus, Wolfgang Weber-Fahr, Alejandro Cosa-Linan, Robert Becker, Markus Sack, Claudia Falfan-Melgoza, Natalia Gass, Urs Braun, Christian Clemm von Hohenberg, Jiesi Chen, and et al. 2022. "TRIAC Treatment Improves Impaired Brain Network Function and White Matter Loss in Thyroid Hormone Transporter Mct8/Oatp1c1 Deficient Mice" International Journal of Molecular Sciences 23, no. 24: 15547. https://doi.org/10.3390/ijms232415547
APA StyleReinwald, J. R., Weber-Fahr, W., Cosa-Linan, A., Becker, R., Sack, M., Falfan-Melgoza, C., Gass, N., Braun, U., Clemm von Hohenberg, C., Chen, J., Mayerl, S., Muente, T. F., Heuer, H., & Sartorius, A. (2022). TRIAC Treatment Improves Impaired Brain Network Function and White Matter Loss in Thyroid Hormone Transporter Mct8/Oatp1c1 Deficient Mice. International Journal of Molecular Sciences, 23(24), 15547. https://doi.org/10.3390/ijms232415547