Article

BST2, a Novel Inhibitory Receptor, Is Involved in NK Cell Cytotoxicity through Its Cytoplasmic Tail Domain

College of Life Science and Biotechnology, Korea University, 145 Anam-ro, Seongbuk-gu, Seoul 02841, Korea
*
Author to whom correspondence should be addressed.
Int. J. Mol. Sci. 2022, 23(19), 11395; https://doi.org/10.3390/ijms231911395
Submission received: 3 August 2022 / Revised: 16 September 2022 / Accepted: 23 September 2022 / Published: 27 September 2022
(This article belongs to the Section Molecular Immunology)

Abstract

:
Bone Marrow Stromal Cell Antigen 2 (BST2) is a type II transmembrane protein expressed on various cell types that tethers the release of viruses. Natural killer (NK) cells express low levels of BST2 under normal conditions but exhibit increased expression of BST2 upon activation. In this study, we show for the first time that murine BST2 can control the cytotoxicity of NK cells. The cytoplasmic tail of murine BST2 contains an immunoreceptor tyrosine-based inhibitory motif (ITIM). The absence of BST2 on NK cells can enhance their cytotoxicity against tumor cells compared to wild type NK cells. NK cells isolated from NZW mice, which express ITIM-deficient BST2, also showed higher cytotoxicity than wild type NK cells. In addition, we found that galectin-8 and galectin-9 were ligands of BST2, since blocking galectin-8 or -9 with monoclonal antibodies enhanced the cytotoxicity of NK cells. These results suggested that BST2 might be a novel NK cell inhibitory receptor as it was involved in regulating NK cell cytotoxicity through its interaction with galectins.

1. Introduction

Bone Marrow Stromal Cell Antigen 2 (BST2; also known as tetherin, CD317, PDCA-1, and HM1.24) restricts the release of viruses at the plasma membrane. It consists of an N-terminal cytoplasmic tail, a transmembrane region, an extracellular coiled coil domain, and a C-terminal glycosylphosphatidylinositol (GPI) anchored domain [1,2]. BST2 can be translated into a long isoform or alternatively a short isoform, since the Kozak sequence flanking the first ATG (Methionine, M1) is leaky, and the downstream methionine (M13) appears to be an alternative translation start site [3]. Generally, the long isoform and the short isoform of BST2 are alternatively translated at an 1:1 ratio in a variety of cancer cell lines as well as in human CD4 T cells [3]. NZW mouse as a specific murine strain only expresses the short isoform of BST2 because the first ATG codon of Bst2 gene is mutated, while the second one is available [4].
The N-terminal cytoplasmic tail region of BST2 has been reported to contain a putative hemi-immunoreceptor tyrosine-based activation motif (HemITAM) consisting of a single SH2-binding domain with a YXX-hydrophobic residue (YCRV in human, YLPV in mice) [5]. In HIV-1 infection, the ecto-domain of BST2 can restrict virus budding at the plasma membrane, while the hemITAM motif in the cytoplasmic tail of BST2 phosphorylated by Src-family kinases can activate NFκB signaling [5]. Thus, mice with cells expressing the short isoform of BST2 or NZW, which lose the hemiITAM motif, show reduced NFκB signaling with normal virus tethering abilities [4].
In this study, we found that the N-terminal cytoplasmic tail of murine BST2 also contained an immunoreceptor tyrosine-based inhibitory motif (ITIM, SFYHYL). ITIM-motif is a conserved sequence of amino acids (S/I/V/L) xYxx (I/V/L) in cytoplasmic tails of many inhibitory receptors [6]. When these receptors interact with specific ligands, the ITIM motif phosphorylated by Src kinase family proteins can recruit phosphotyrosine phosphatases (SHP-1 and SHP-2) or inositol-phosphatase SHIP [7]. These phosphatases can inhibit activating signals [8].
NK cells have activating and inhibitory receptors that can recognize a variety of ligands. Thus, NK cells play a key role in tumor surveillance and host defenses against viral infections [9]. Inhibitory receptors such as KIRs and CD94/NKG2A heterodimer on NK cells can recognize MHC class I molecules and then inhibit the killing of heathy cells, while NK cells can eliminate tumor cells or infected cells that do not express MHC class I according to the ‘missing self’ hypothesis [10,11]. Activating receptors, such as NKG2D or natural cytotoxicity receptors (NCRs), can recognize a variety of ligands such as MICA for NK2GD [12] and hemagglutinin (HA) of influenza virus for NCR1 [13]. NK cells can then directly eliminate target cells by secreting granules such as granzymes and perforin or by death receptor-mediated apoptosis [14]. They can also secrete various cytokines and chemokines including IFN-γ, MIP1-α, thereby enhancing anti-tumor responses [15]. Thus, NK cell activation and function are regulated by an interplay between inhibitory and activating receptors with a variety of ligands [9,16,17,18]. Cytotoxic T lymphocytes (CTLs) are also known to have an activation-dependent expression of immune checkpoint molecules [19]. Numerous studies have been conducted throughout the years in hopes of increasing the cytotoxicity (level) by blocking inhibitory receptors such as PD-1 and TIGIT on CTLs. Despite these efforts, therapy using CTLs is still incomplete. Thus, discovering new therapy targeting immune checkpoint molecules is being continued.
Galectins are carbohydrate-binding proteins with one or two carbohydrate-recognition domains (CRDs) that can bind to beta-galactoside-containing glycans. They are involved in multiple functions both intracellularly and extracellularly [20]. Galectins have been found in the cytosol, nucleus, extracellular matrix, and in circulation, thereby mediating intracellular signaling and cell adhesion [21]. Galectin-3 (Gal-3) can form oligomer to increase their binding avidity. Galectin-9 (Gal-9) is a tandem repeat-type connected by a flexible linker [20]. In cancer, Gal-3 and Gal-9 can suppress NK cytotoxicity by hindering NK receptor-ligand interaction. Thus, it has been suggested that galectins can regulate NK cell activity [22,23]. Galectin-8 (Gal-8), another tandem-repeat type of galectins, has been suggested to be associated with tumor cell adhesion, tumor cell survival, and metastasis [24]. Despite upregulation of Gal-8 during tumor progression in several cancers including lung cancer and head and neck cancer [25], the possibility of NK cell surveillance with Gal-8 is uncovered yet.
In this study, we found that BST2 of NK cells interacted with Gal-8 and Gal-9 and inhibited NK cell cytotoxicity. The inhibitory effect of Gal-8 and Gal-9 on NK cells was relayed through the ITIM motif on the cytoplasmic tail of BST2. Our findings suggest that BST2 might be a novel inhibitory receptor with an ITIM motif in the cytoplasmic tail that is involved in the suppression of NK cell activity by interacting with Gal-8 and Gal-9.

2. Results

This section may be divided by subheadings. It should provide a concise and precise description of the experimental results, their interpretation, as well as the experimental conclusions that can be drawn.

2.1. The Cytoplasmic Tail of BST2 Has an ITIM Motif

Through sequence comparison, we identified an ITIM motif, SxYxxL, on the cytoplasmic tail domain of murine BST2 and an ITIM-like motif, SxxYxxV, on the cytoplasmic tail of human BST2 (Table 1). Since the I/V/L/SxYxxL/V motif is a known as the ITIM motif [26,27], we hypothesize that BST2 might deliver inhibitory signals to cells which express BST2. The main role of an inhibitory receptor as a regulator is to control immune cells to not work excessively. If a population barely expresses BST2 at its naïve state, but highly induced when activated, it could mean that BST2 might be a regulator of that population. When splenocytes of naïve mice were analyzed by flow cytometry, myeloid cells such as macrophages and dendritic cells, especially plasmacytoid DC, expressed BST2 while lymphoid cells such as NK cells, T cells, and B cells hardly expressed BST2 (Supplementary Figure S1A). Expression of BST2 of lymphoid cells was increased after in vitro IL2 treatment (Supplementary Figure S1B). NK cells are part of an innate immunity. They are not restricted to a specific antigen. Thus, we first focused on NK cells. NK cells could also be activated by polyI:C. In comparison of NK cell ratio of Bst2+/+ and Bst2-/- mice, there was no noticeable difference in splenic NK cell ratio upon polyI:C treatment (Supplementary Figure S2C). Hence, we sorted NK cells from polyI:C injected Bst2+/+ and Bst2-/- mice and analyzed their cytotoxicity against target cells. The expression of BST2 on NK cells was upregulated after polyI:C stimulation (Figure 1A) and the cytotoxicity of Bst2+/+ NK cells was significantly lower than that of Bst2-/- NK cells (Figure 1B).
To prepare killer cells with another method, we cultured splenocytes in vitro with IL-2 as described in Materials and Methods. In line with the results of the polyI:C injection, IL-2 stimulated NK cells showed an increased expression of BST2 (Figure 2A and Figure S2A). Bst2+/+ NK cells also showed a decreased cytotoxicity against target cells compared to Bst2-/- NK cells (Figure 2B and Figure S2B). NK cells usually kill targets by secreting granules, such as granzyme B [30]. The amount of granzyme B in co-cultured medium of NK and target cells was also correlated with cytotoxicity. Bst2+/+ NK cells secreted granzyme B less than Bst2-/- NK cells (Figure 2C). CD107a, a degranulation marker, was increased after the NK cells encountered their target cells [31]. In our analysis, the level of CD107a in Bst2+/+ NK cells was lower than that in Bst2-/- NK cells, which were in direct proportion to their cytotoxicity (Figure 2D). To determine if Bst2 gene knockout affected the status of NK cells and thus increased their cytotoxicity, expression levels of NKp46, NKG2A/C/E, NKG2D, 2B4, KLRG1, and CD25 were analyzed. We also compared the expression level of transcription factor T-bet. There were no significant differences in the expression of all the markers we tested (Supplementary Figure S2D–F). We also examined the intracellular expression of interferon gamma (IFN-γ) in Bst2+/+ and Bst2-/- NK cells. Although IFN-γ expression increased after stimulation, both showed comparable levels of IFN-γ in the naïve state and after polyI:C stimulation (Supplementary Figure S2G).
To further test whether BST2 could act as an inhibitory receptor, we blocked BST2 on NK cells with a monoclonal antibody anti-BST2. Treatment with anti-BST2 antibody increased cytotoxicity of Bst2+/+ NK cells (Figure 2E).

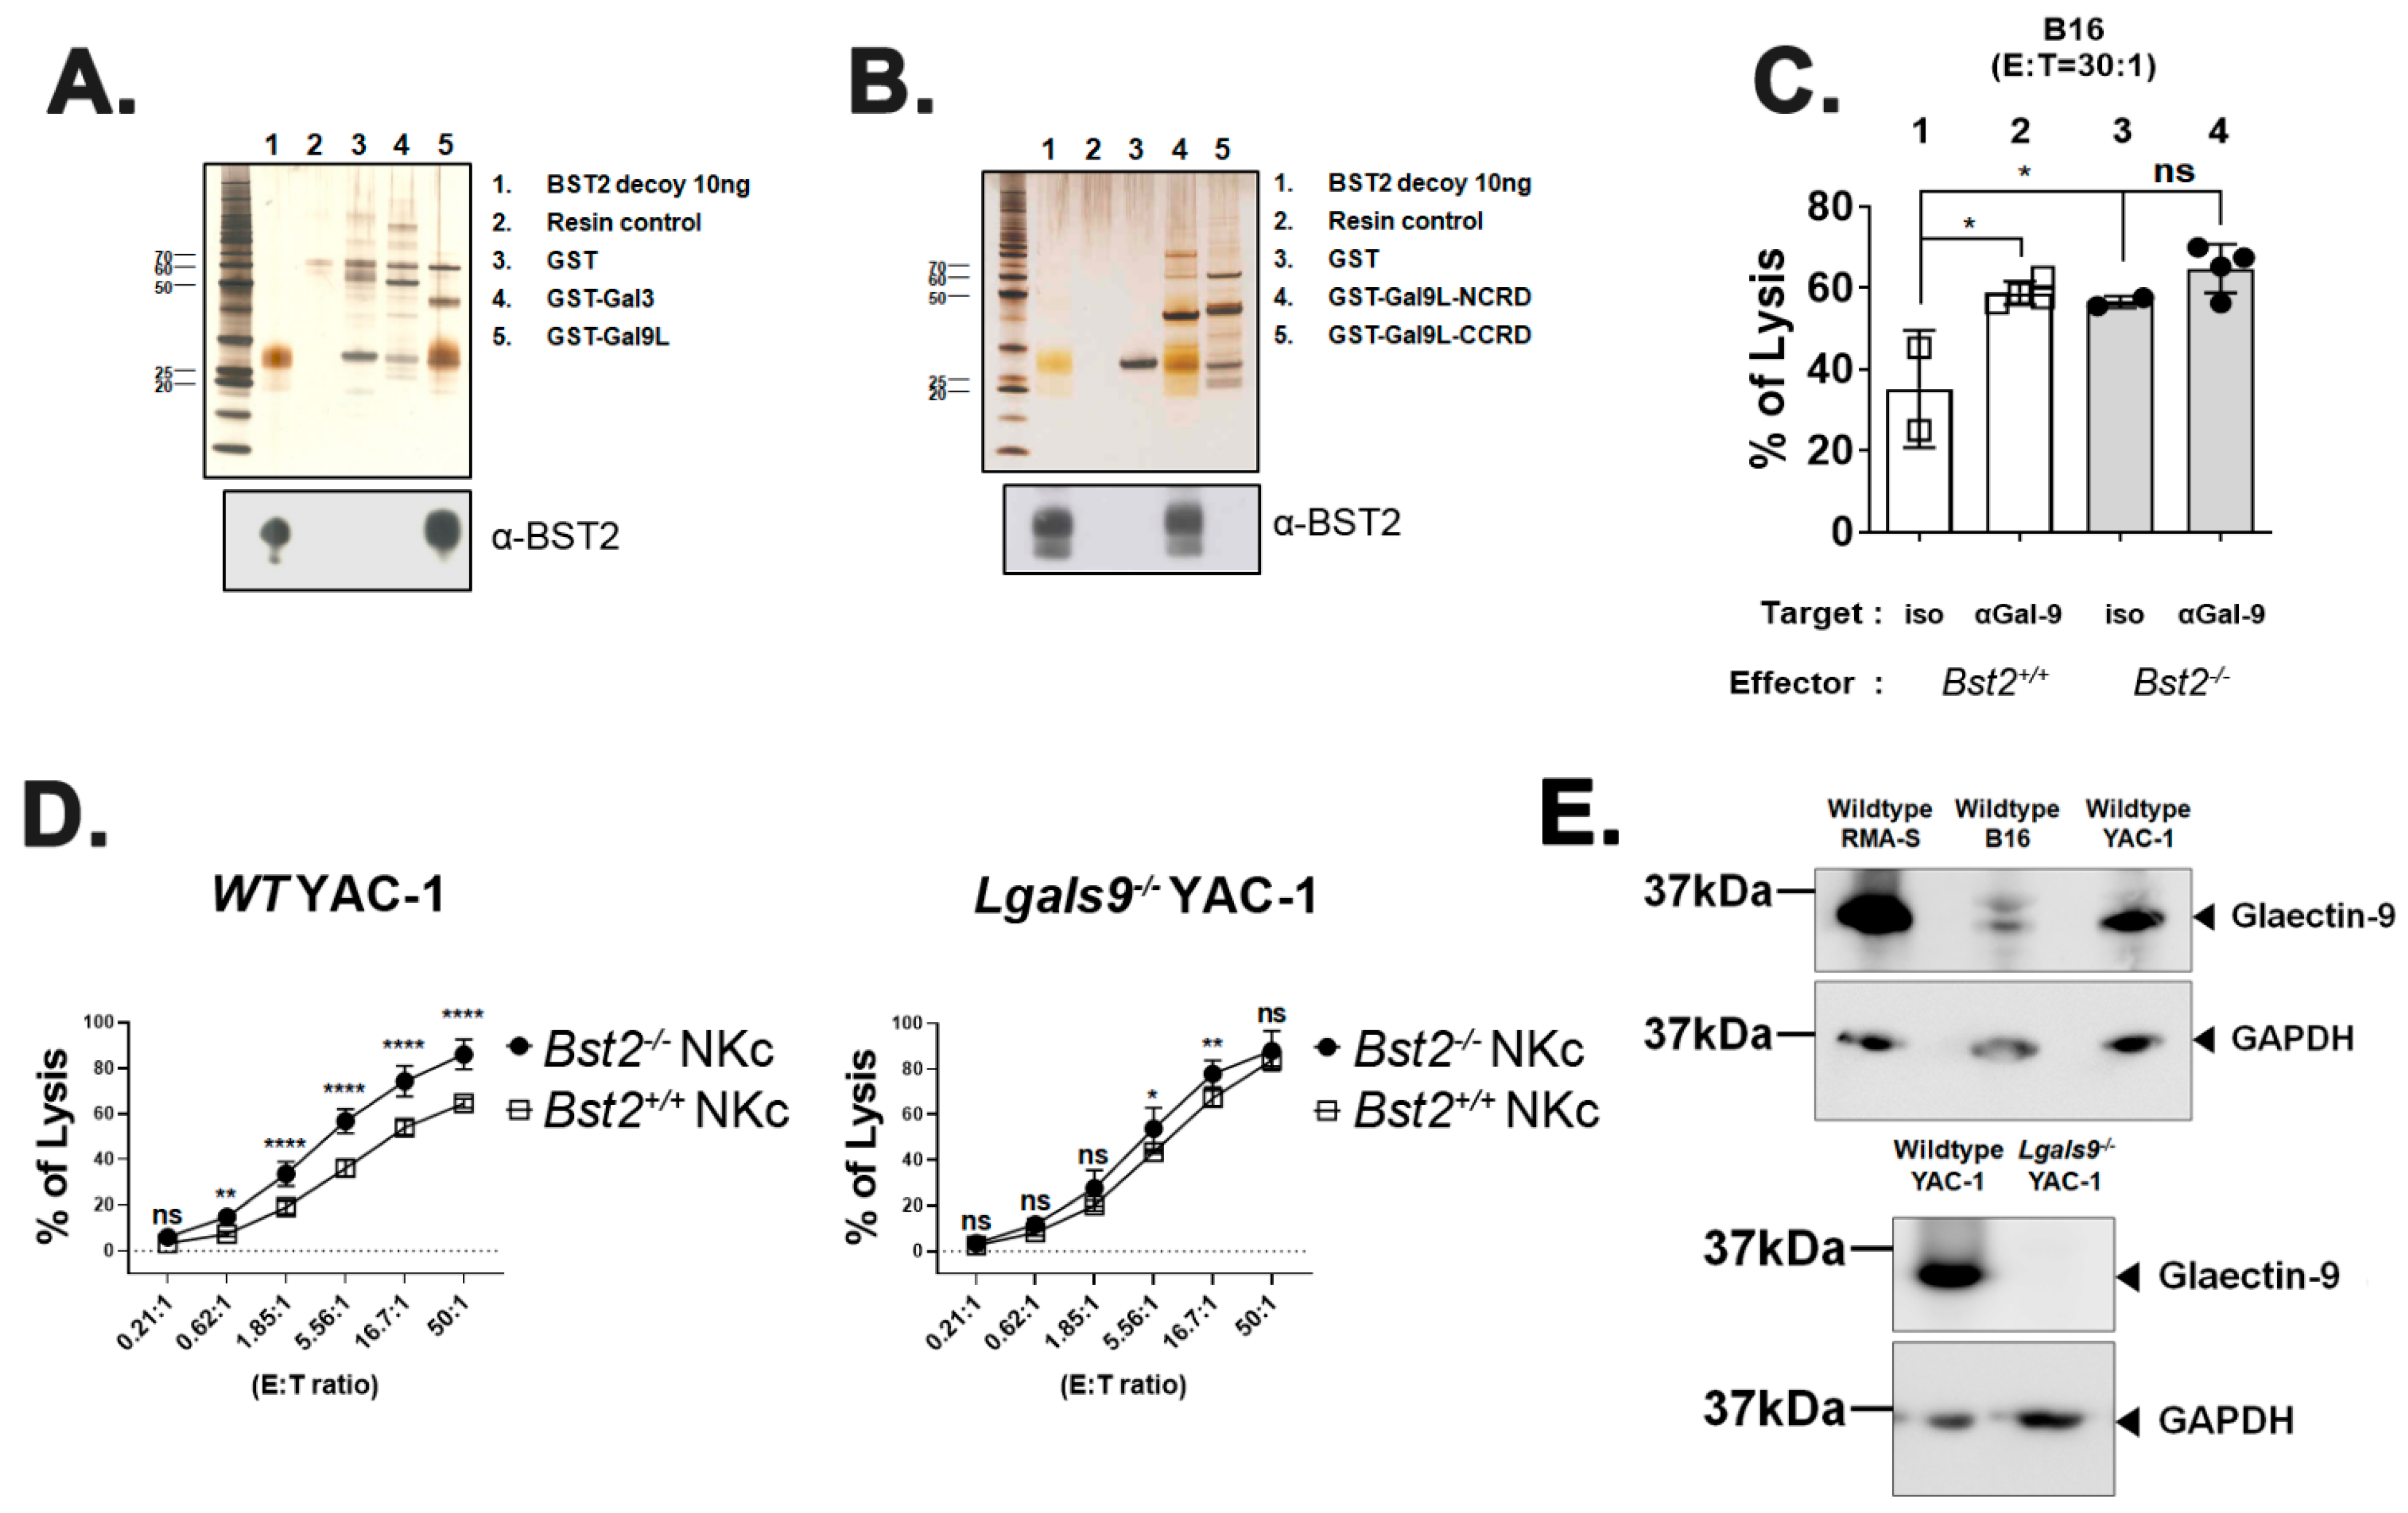
2.2. BST2 Can Bind to Galectin-8 and Galectin-9

Since previous results strongly suggested that BST2 might be a novel molecule related to NK cell cytotoxicity, we performed a pull-down assay to determine ligands of BST2 using human BST2 protein as a bait against human 293T cell lysate. Among several candidates that could be pulled-down, galectins caught our attention since Gal-3 and Gal-9 are known to dampen the activity of cytotoxic cells through interaction with NKp30 and TIM3, respectively [22,23]. To confirm that BST2 could bind to galectins specifically, we performed a reverse direction pull-down assay with alternative forms of GST-fused Gal-9 and Gal-8 molecules as baits against purified BST2 protein. BST2 was found to interact specifically with Gal-9 and Gal-8, but not with Gal-3 (Figure 3A,B). The N-terminal carbohydrate recognition domain (NCRD) of Gal-9 was a main part where BST2 bound (Figure 3B). BST2 also showed specific interaction with the NCRD of Gal-8 (Supplementary Figure S3A,C).
We examined whether Gal-9 was involved in NK cell cytotoxicity by performing NK cell cytotoxicity assay against B16 target cells in the presence of an anti-Gal-9 monoclonal antibody. For comparison, an isotype control antibody was used for treatment. Blocking Gal-9 substantially increased the cytotoxicity of Bst2+/+ NK cells (Figure 3C, lane 1 vs. lane 2). However, the same treatment showed only a slight increase of cytotoxicity of Bst2-/- NK cells (lane 3 vs. lane 4), although they did have a higher basal level of cytotoxicity than Bst2+/+ NK cells (lane 1 vs. lane 3). These slight increases in cytotoxicity might be due to the failure of Gal-9 interaction with other receptor(s) other than BST2. For example, TIM3 might be the receptor because it has been known to down-regulate LPS-triggered inflammatory responses by the interaction with Gal-9 [32]. On the other hand, others also reported that these inhibitory signals were relayed independent of TIM3 [22], which increases the possibility of BST2 participation in Gal-9 signaling. It suggests that TIM3 and BST2 are not single inhibitory factors for Gal-9 interaction, but factors that act in a cumulative way. Blocking Gal-8 also increased the cytotoxicity of Bst2+/+ NK cells, while the cytotoxicity of Bst2-/- NK cells was not changed (Supplementary Figure S3D).
To confirm the interaction between Gal-9 and BST2, we analyzed cytotoxic effects of Bst2+/+ and Bst2-/- NK cells against Gal-9-dificient (Lgals9-/-) YAC-1 cells. If Lgals9-/- target cells are unable to provide NK cells an inhibitory Gal-9 signal through BST2, lysis of Lgals9-/- target cells by Bst2+/+ or Bst2-/- NK would be similar. While wild type YAC-1 cells were more potently killed by Bst2-/- NK cells than by Bst2+/+ NK cells, cytotoxicities against Lgals9-/- YAC-1 cells by Bst2+/+ NK cells and Bst2-/- NK cells were similar (Figure 3D). All three wildtype target tumor cell lines used in this study (RMA-S, B16 and YAC-1) showed an expression of Gal-9 (Figure 3E, upper panel), and Lgals9-/- YAC-1 showed complete loss of Gal-9 expression upon evaluation by western blotting (Figure 3E, lower panel). These results indicated that Gal-9 could deliver inhibitory signal by interacting with BST2 in addition to TIM3, thereby down-regulating NK cell cytotoxicity.

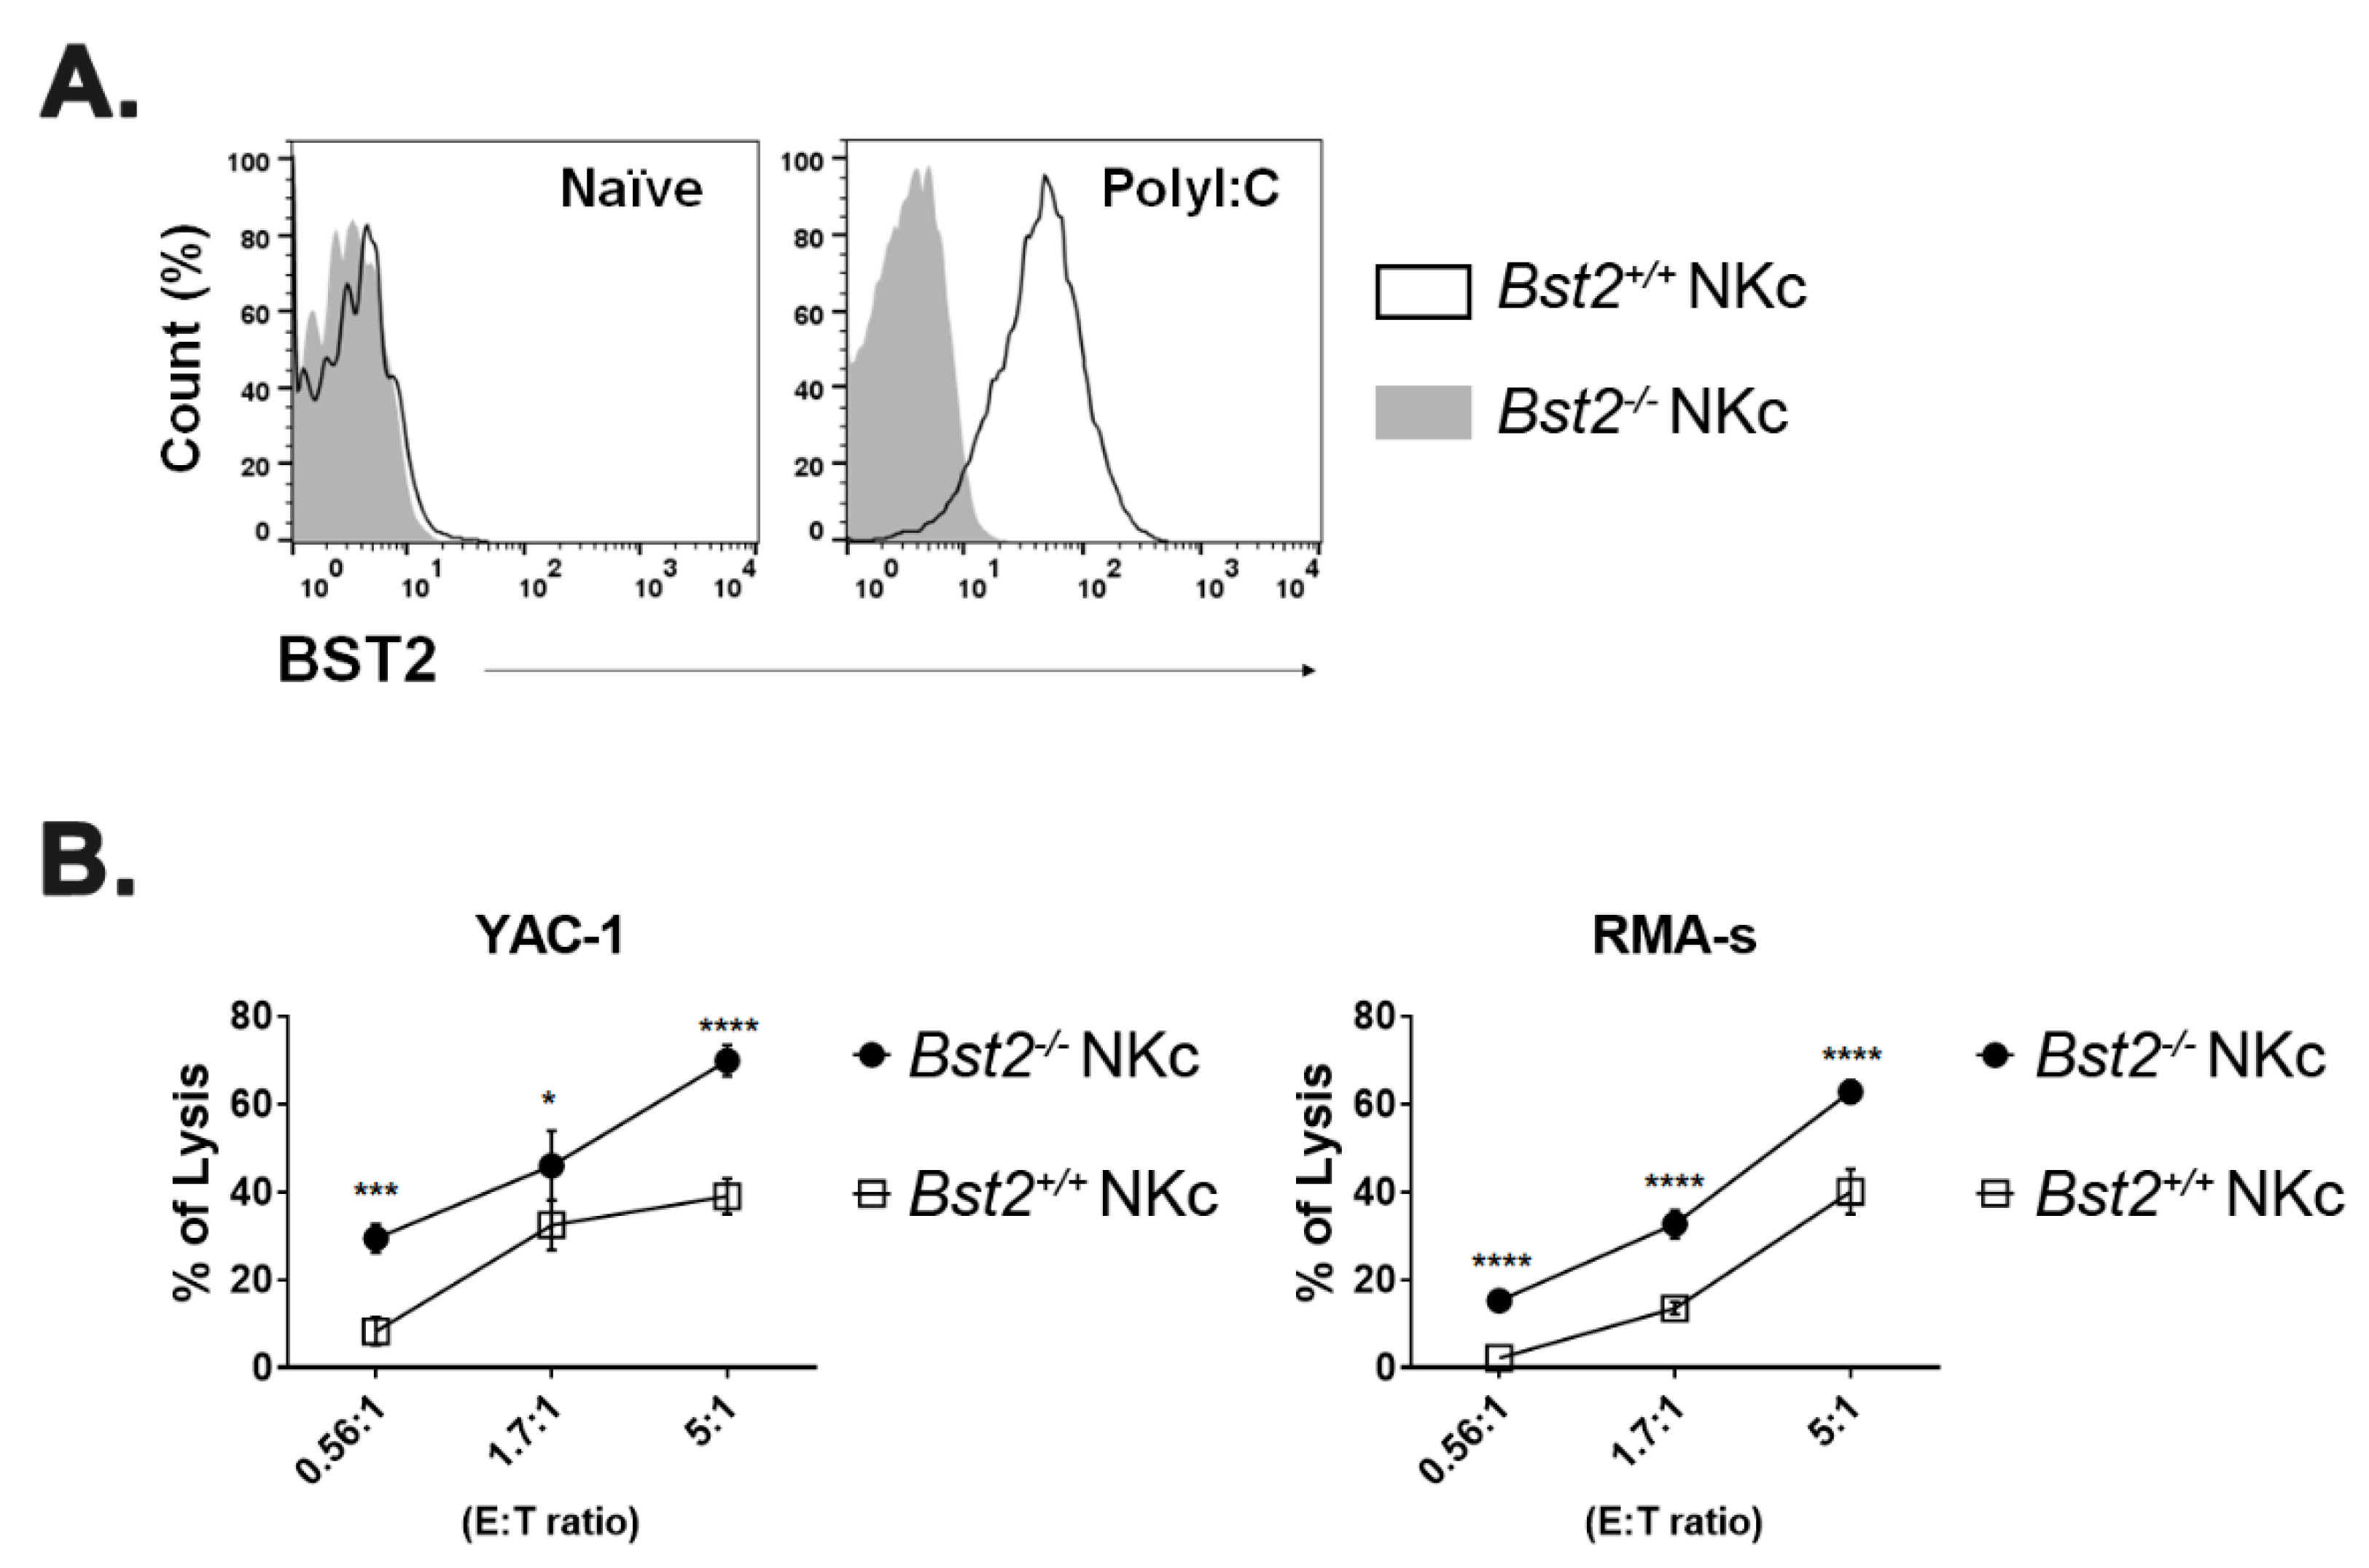
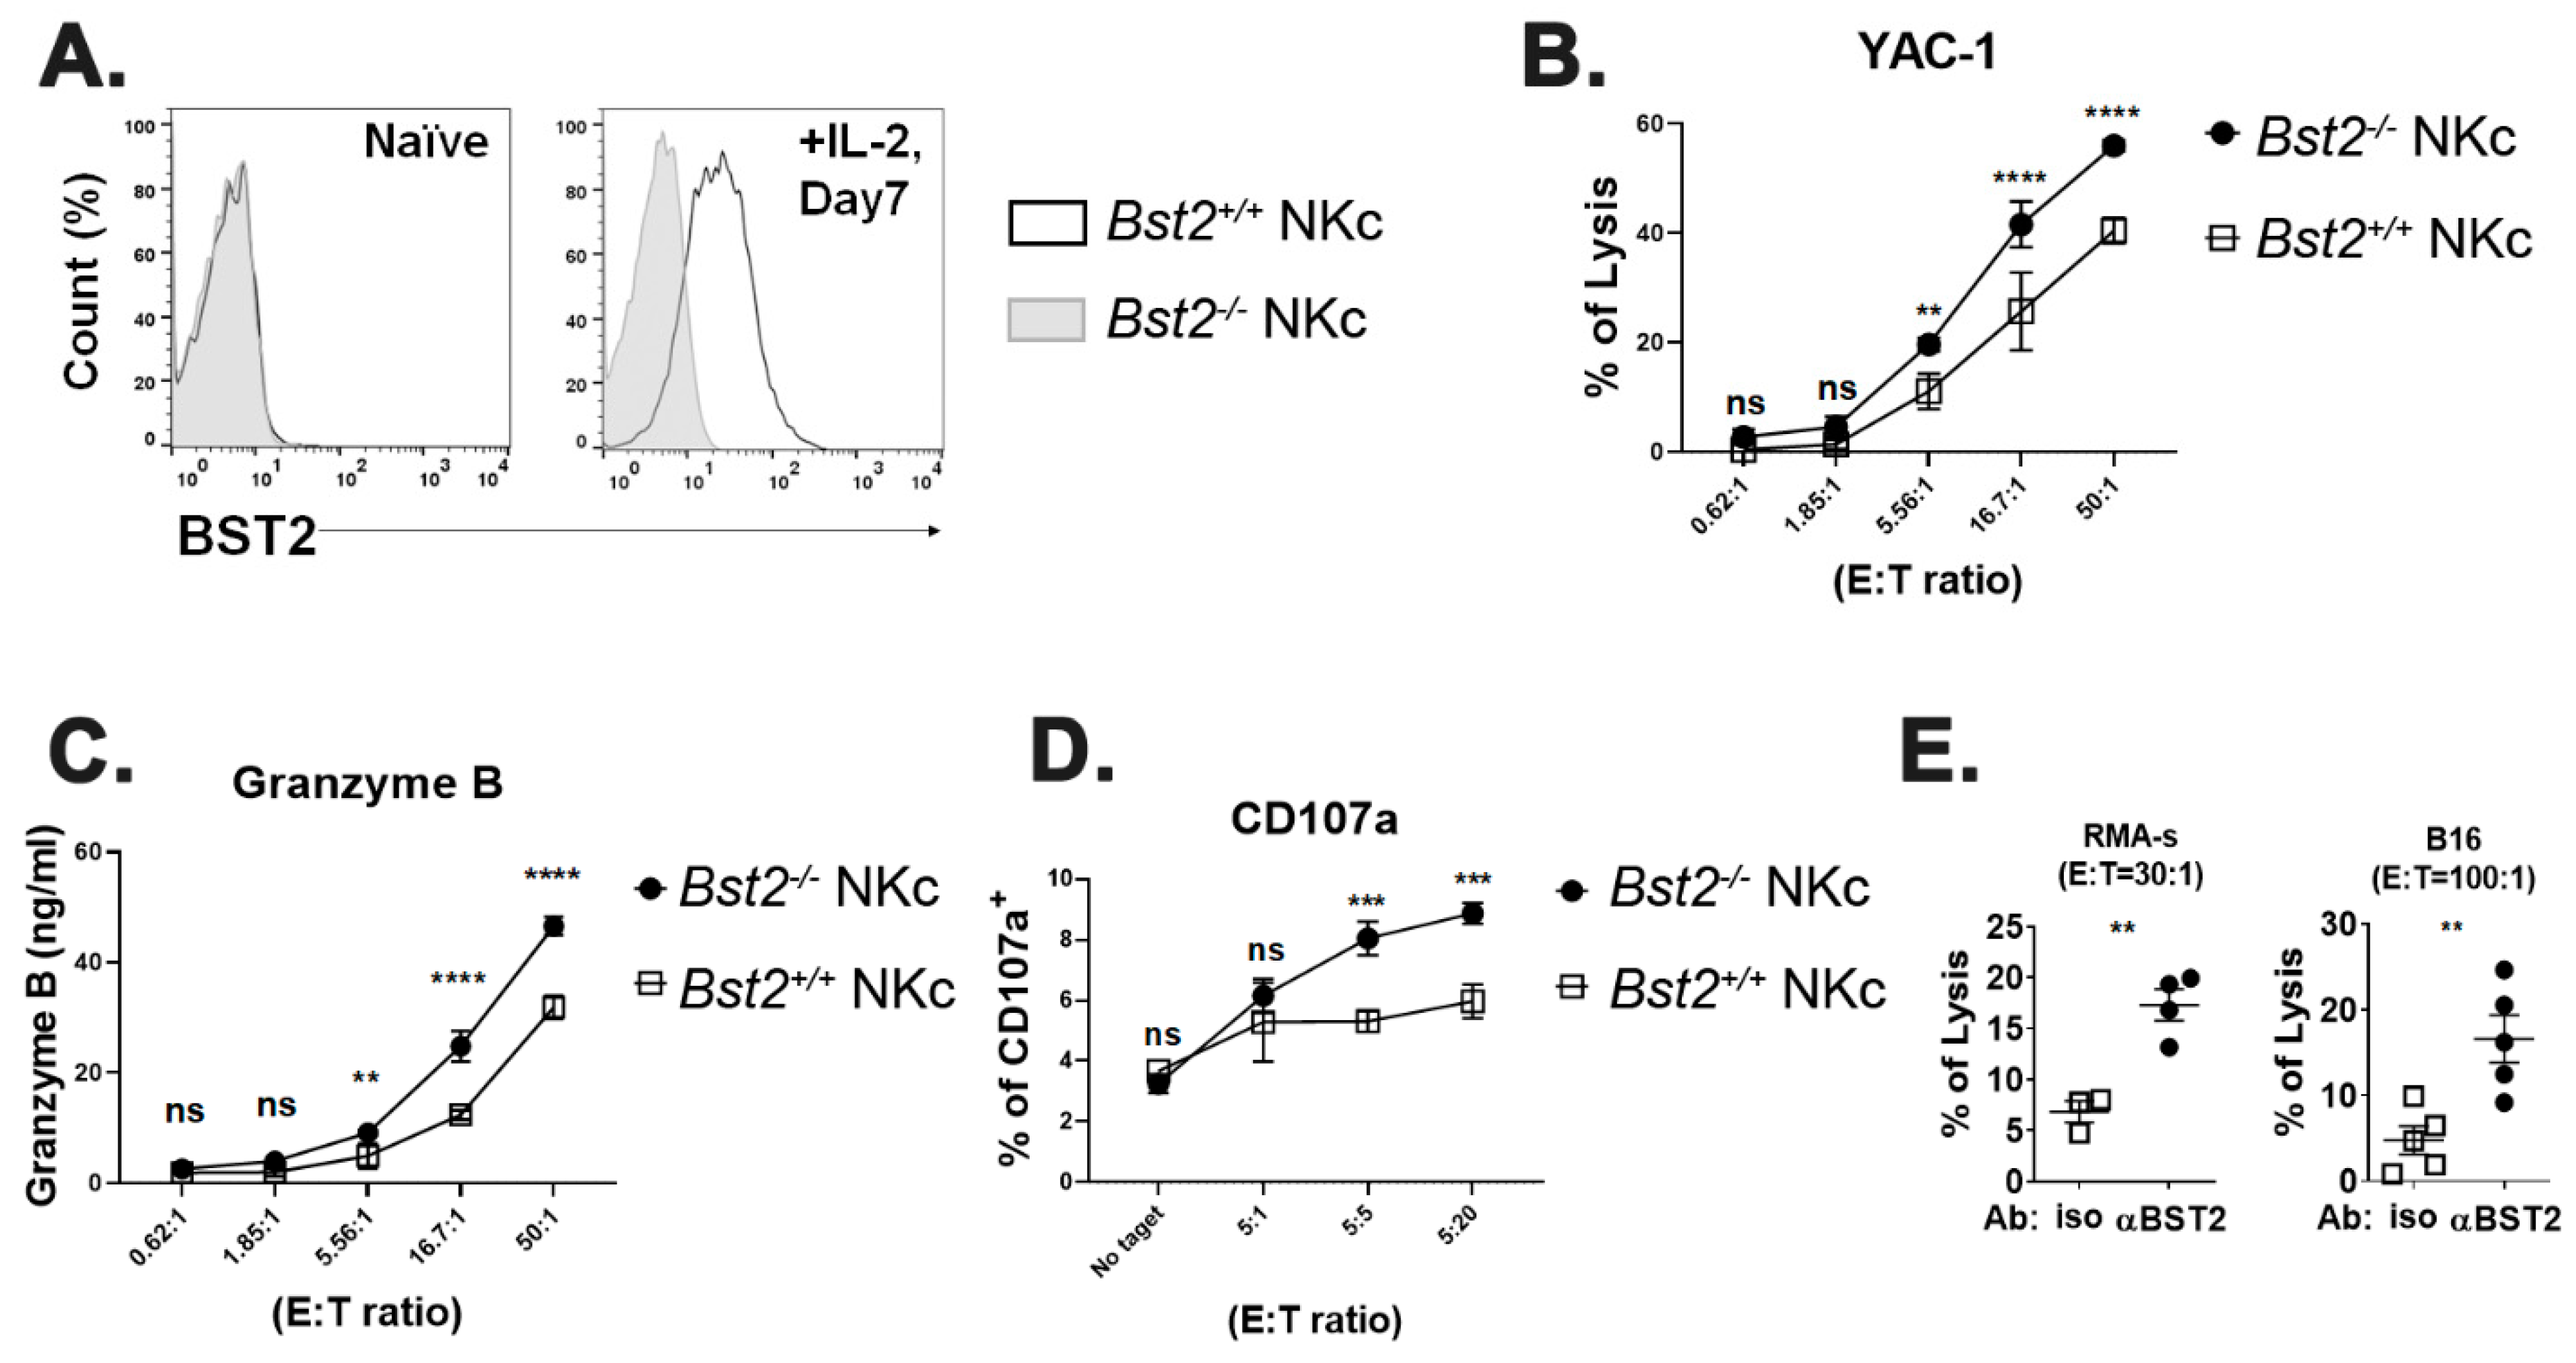
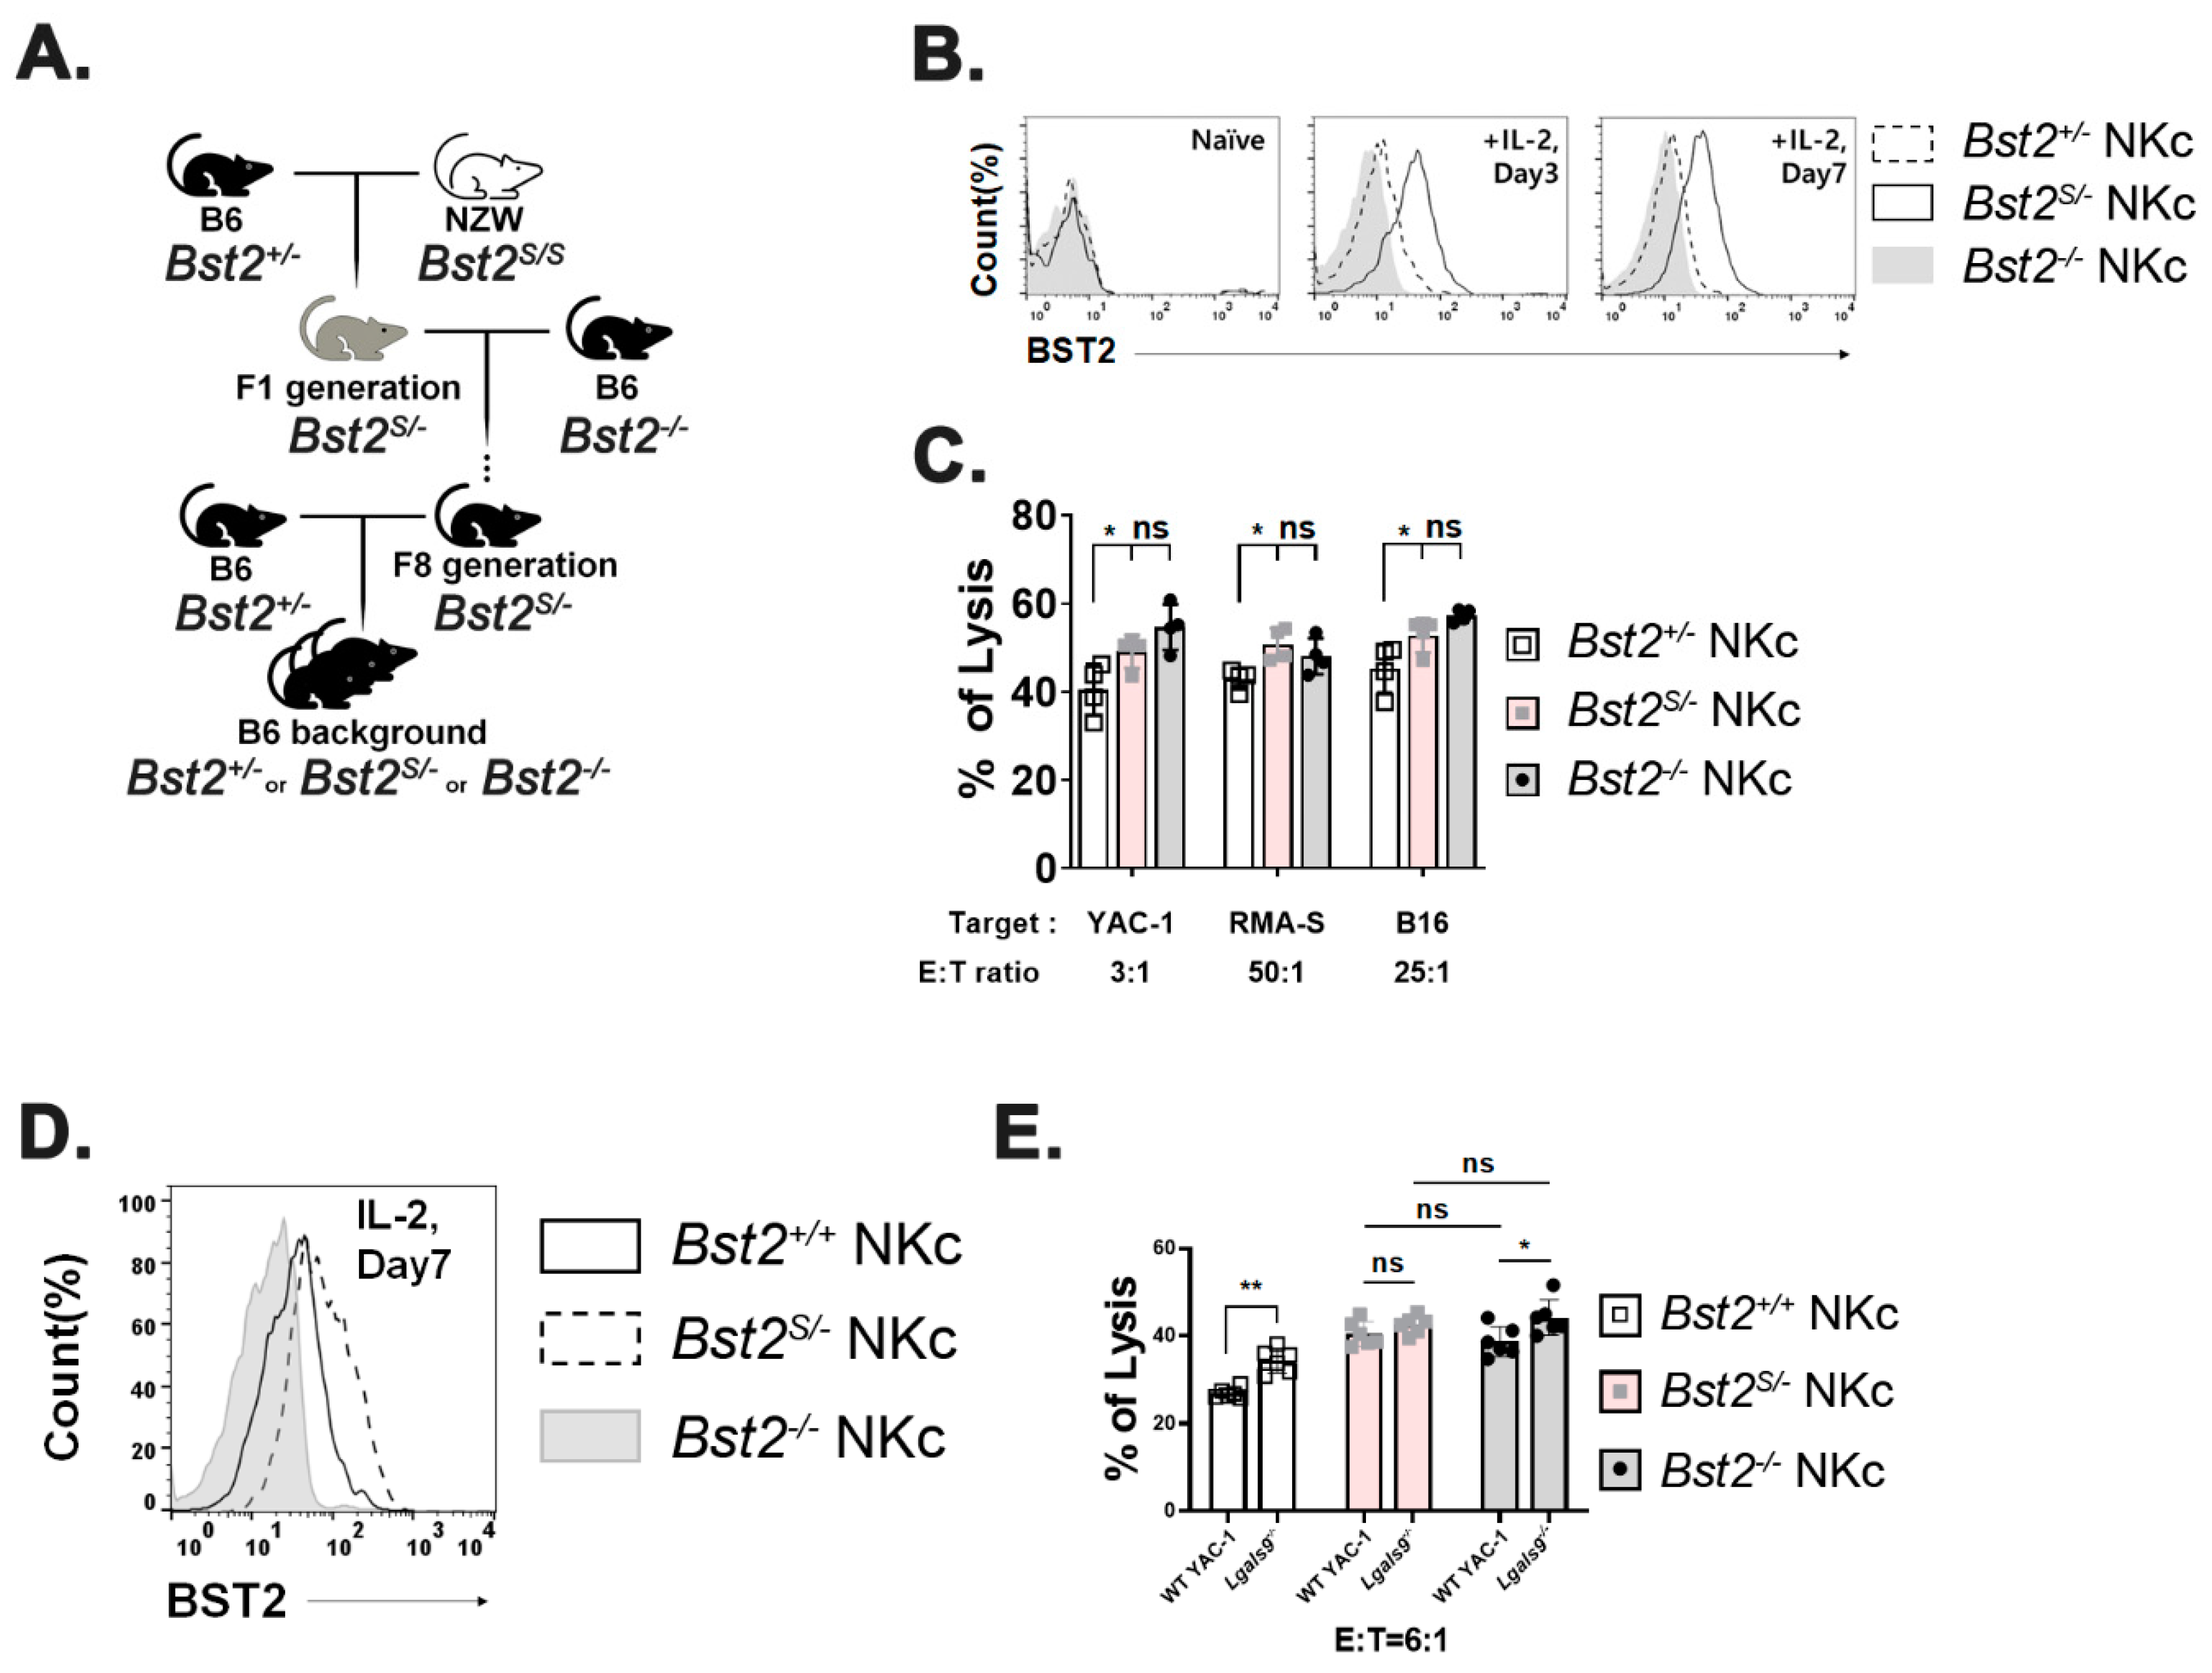
2.3. Long Isoform of BST2 Critically Downregulates the Cytotoxicity of NK Cells

We used NZW mice only expressing BST2 of short isoform (Bst2S/S), which lacked 12-amino acids including the ITIM motif at their N-terminus [4,33] to evaluate whether the inhibitory effect of BST2 in NK cells was delivered through the ITIM motif of its cytoplasmic tail. B6 Bst2+/- mice were mated with NZW mice. F1 hybrids having the same genetic background were used to generate NK cells (Figure 4A). The expression level of BST2 in NK cells was analyzed by flow cytometry staining. Bst2S/+ NK cells were found to have a higher level of BST2 expression than Bst2S/- NK cells when they were stimulated with IL-2 as Bst2S/+ NK cells had two copies of the Bst2 gene (Figure 4B). We compared cytotoxicities of Bst2S/+ NK cells and Bst2S/- NK cells against YAC-1, RMA-S, and B16 tumor cell lines. Bst2S/- NK cells were found to have higher cytotoxicity to all target tumor cells tested than Bst2S/+ NK cells (Figure 4C). This suggests that the expression of the N-terminal cytoplasmic tail region containing ITIM motif in BST2 might be associated with the inhibition of NK cell cytotoxicity.
To verify whether the inhibitory signal was transduced through BST2, we compared cytotoxicities of Bst2S/+ NK cells and Bst2S/- NK cells after treatment with anti-BST2 antibody. While blocking BST2 on Bst2S/+ NK cells significantly enhanced NK cell cytotoxicity, the same blocking on Bst2S/- NK cells showed only a marginally insignificant enhancement of cytotoxicity (Figure 4D). This suggests that the N-terminal cytoplasmic tail of BST2 is critical to NK cell suppression.

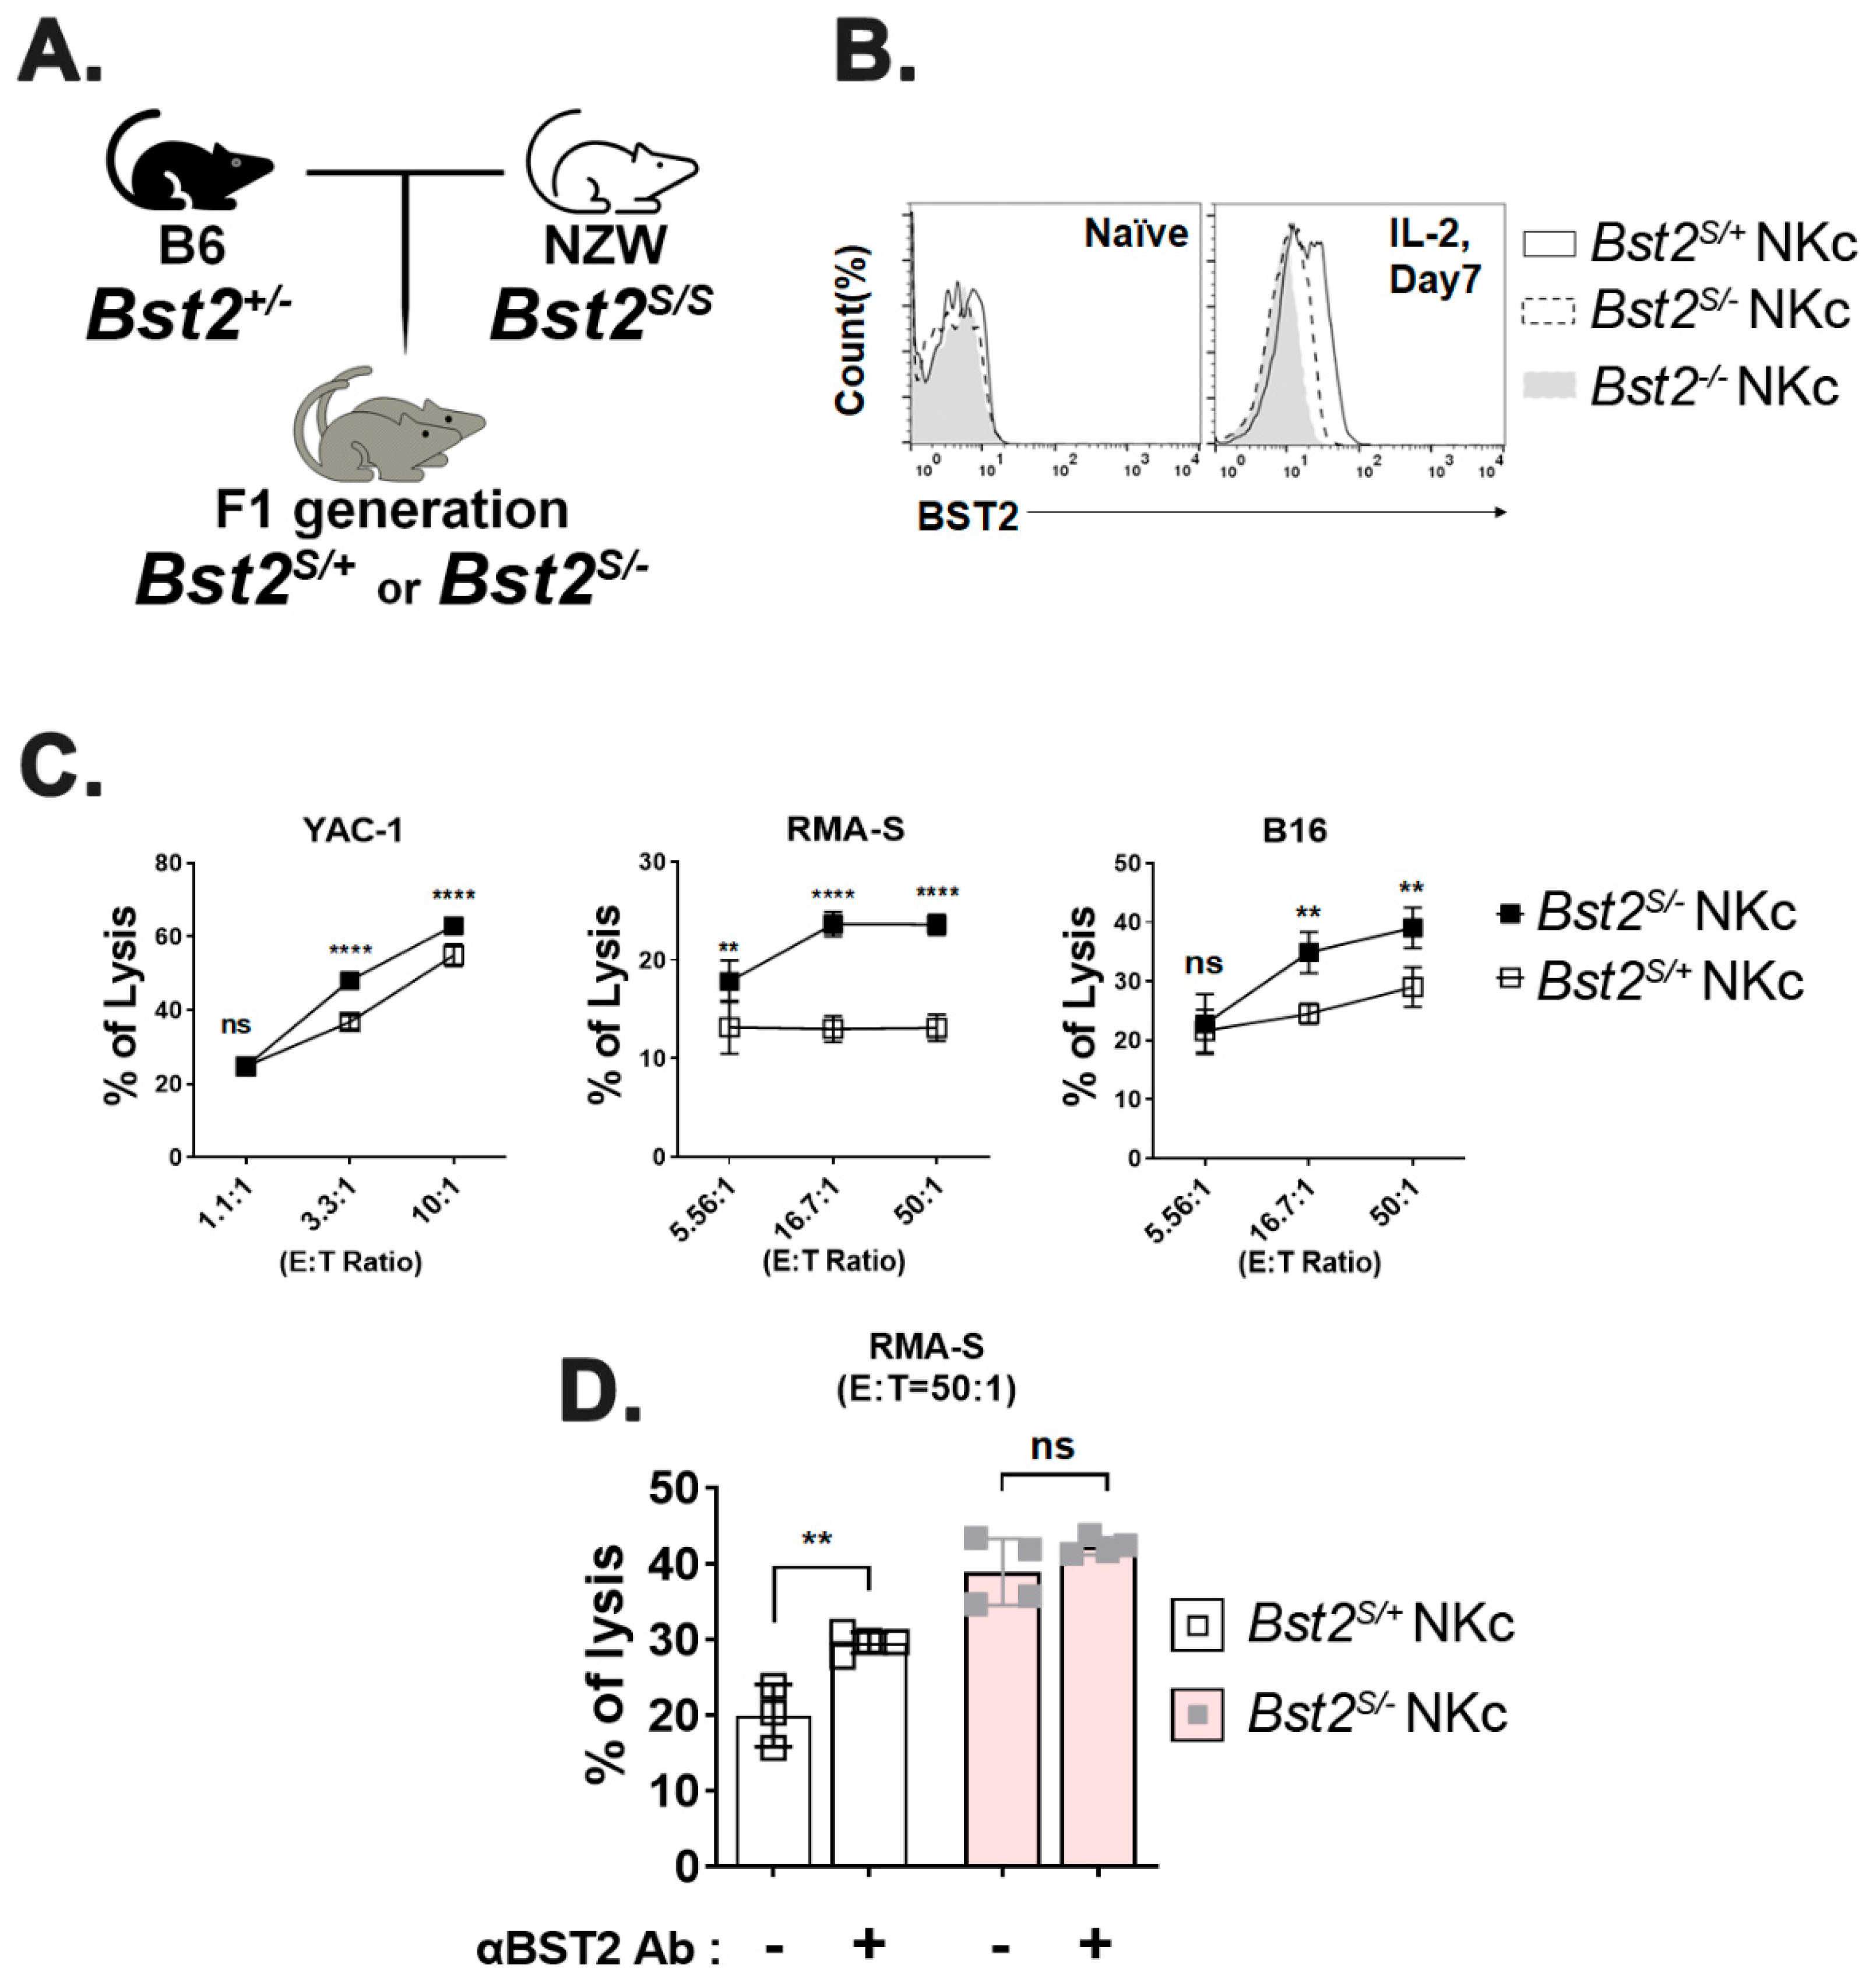
2.4. Cytoplasmic Tail ITIM Motif in BST2 Is Involved in NK Cell Cytotoxicity

Results shown in Figure 4 could be interpreted as a gene dosage effect since Bst2S/+ NK cells have an extra copy of Bst2 gene compared to Bst2S/- NK cells. To rule out gene dosage effects, we produced mice containing only a single copy of either long or short N-tailed-Bst2 gene by backcrossing NZW mice at least eight times with B6 Bst2-/- mice. Resulting Bst2S/- mice were then intercrossed with Bst2+/- mice (Figure 5A). There were no noticeable differences in developmental stages of NK cells (immature NK (CD27+ CD11b-), transitional NK (CD27+CD11b+), and mature NK (CD27- CD11b+) cells) among those mice (Supplementary Figure S4A). In addition, we analyzed the expression pattern of Ly49G2, an NK cell inhibitory receptor. However, we found no significant difference (Supplementary Figure S4B). Interestingly, Bst2S/- NK cells showed a higher BST2 expression level than Bst2+/- NK cells, although both mice had a single copy of Bst2 gene (Figure 5B). The expression level of BST2 on Bst2S/- NK cells was even higher than that on Bst2+/+ NK cells having two copies of the gene (Figure 5D). This might be attributable to the reduced endocytic recycling because of the lack of a full-size cytoplasmic tail [4].
Next, we investigated whether the long isoform rather than short isoform of BST2 served as an inhibitory receptor in NK cells. Cytotoxicities of Bst2+/- NK cells, Bst2S/- NK cells, and Bst2-/- NK cells from littermate control mice against YAC-1, RMA-S, and B16 cell lines were measured. Bst2+/- NK cells showed lower cytotoxicities than Bst2S/- NK cells and Bst2-/- NK cells, while Bst2S/- NK cells (pink columns) and Bst2-/- NK cells (gray columns) showed similar cytotoxicities to all cell lines tested (Figure 5C). In addition, we analyzed whether Bst2S/- NK cells could not show enhanced cytotoxicity against Lgals9-/- target cells as cases of anti-BST2 and anti-Gal-9 antibody treatments. While Bst2+/+ cells again showed a significant increase of cytotoxicity against Lgals9-/- target cells compared to wild type YAC-1 cells, Bst2S/- NK cells showed slightly increased but statistically insignificant level of cytotoxicity increment against Lgals9-/- target cells compared to wild type YAC-1 target cells. Bst2-/- NK cells showed a modest increment of cytotoxicity against Lgals9-/- target cells compared to that against wild type YAC-1 target cells (Figure 5E). These results suggest that the short isoform of BST2 that lacks the first 12 amino acids (containing ITIM motif) of N-terminus in cytoplasmic tail does not participate in the inhibitory action of BST2 which is triggered by its interaction with Gal-9. In other words, the ITIM motif in the long isoform of BST2 is critical for the downregulation of NK cell cytotoxicity.

3. Discussion

BST2 is known as an anti-viral factor by physical interaction with budding virus and a modulator of type I interferon release by plasmacytoid dendritic cells [34]. However, in this study, we found that the cytoplasmic tail of BST2 had an ITIM motif, indicating that the cytotoxicity of NK cells could be regulated by BST2. To confirm this, we used various backgrounds of mice, such as B6 origins (Bst2+/+, Bst2+/-, or Bst2-/-), B6 x NZW F1 hybrids (Bst2S/+ or Bst2S/-), and NZW backcrossed B6 mice (Bst2+/-, Bst2S/-, or Bst2-/-). We found that the cytotoxicity of Bst2-/- NK cells or short BST2 expressing (Bst2S/-) NK cells was greater than that of NK cells expressing the long isoform of BST2 (Bst2+/+, Bst2+/-, or Bst2S/+). We also found that Gal-9 and Gal-8 could be partners of BST2 to regulate NK activity. Blocking BST2 or Gal-9 with blocking monoclonal antibody efficiently increased cytotoxicity of long isoform BST2 expressing NK cells. However, it had little effect on NK cells lacking the long isoform of BST2. It is interesting since Gal-9 has been proposed as an immune regulatory molecule exerting its effect through TIM3 on cytotoxic cells [22]. In addition, Gal-8 blocking also showed similar results as Gal-9 blocking. This implies that several galectins could be potential signaling ligands of BST2. These results indicate that the presence of ITIM (SFYHYL) motif in BST2 is crucial for the regulation of NK cell cytotoxicity.
The N-terminal cytoplasmic tail of murine BST2 consists of 30 amino acids (20 amino acids in human BST2) and this N-terminal cytoplasmic tail is known to contain a hemITAM motif with a potential ITIM motif. Interestingly, BST2 can be alternatively translated at the second methionine (at 13th amino acid), resulting in a short isoform. Since the ITIM motif is located between the first methionine and the second methionine, the short isoform of BST2 does not contain the ITIM motif [3]. This fits well with our observations that only the long isoform shows inhibitory activity against NK cell cytotoxicity. NK cells might regulate the expression ratio of the long and the short isoforms of BST2 molecule depending on the activation status and inflammatory conditions, thereby regulating their cytotoxicity. Based on our observations that the presence of short isoform did not decrease the cytotoxicity of NK cells (Figure 5C,E), if BST2 could regulate NK cell cytotoxicity, the actual regulator would be the amount of the long isoform of BST2. We can speculate that signaling molecules delivering NK inhibitory signals downstream of BST2 interact with the long isoform cytoplasmic tail of BST2, but what exactly these signaling molecules are remains to be elucidated.
Galectins such as Gal-3 and Gal-9 are involved in the downregulation of NK cell cytotoxicity by binding to NKp30 and TIM3, respectively [22,23]. As NKp30 is an activating receptor, tumor-released Gal-3 can directly bind to NKp30 and block NKp30-mediated cytotoxicity of NK cells [23]. Gal-9 binds to TIM3, an immune check point molecule on NK cells, thus impeding NK cytotoxicity [22]. Interestingly, we observed a similar result regarding BST2/Gal-8 and 9-dependent downregulation of NK cell cytotoxicity. Blockade of either BST2 or Gal-8/Gal-9 by monoclonal antibodies enhanced the cytotoxicity of NK cells. Antibody-dependent cell-mediated cytotoxicity (ADCC) would not be the reason for the enhanced cytotoxicity after anti-BST2 and anti-Gal-8/-9 antibody treatment since the increased cytotoxicity was only observed in NK cells expressing the long isoform of BST2.
Considering the involvement of Gal-3 in the downregulation of NK cell activity, our findings suggest that galectins might be another line of NK cell inhibitory ligand systems that recruit diverse receptors such as NKp30, TIM3, and BST2, in addition to well-known receptor systems such as NKG2A and C in NK receptor complex (NKC) and killer cell immunoglobulin-like receptors (KIRs) in leukocyte receptor complex (LRC).
Many activating receptors on NK cells do not possess their own signaling motifs. Instead, they transmit the signal through noncovalently associated common adaptor molecules, such as DAP-10 or DAP-12, which contain ITAM motifs [35]. These adaptor molecules are not restricted to a specific activating receptor, therefore, controlling these adaptor molecules would be a clever way to regulate NK cell cytotoxicity initiated by various types of ligands. When NK cells attach to a target cell, an immunological synapse occurs at the interface between two cells [36]. Immune synapses are regions rich in lipid rafts where many NK cell receptors are located [37]. Both DAP-10 and DAP-12 are found at lipid rafts, in particular DAP-12 is reported to be found in its boundaries [38,39]. It is interesting that BST2 is also abundant in the boundaries of lipid rafts due to its topology [2,40]. The C-terminal GPI anchor of BST2 is embedded within the lipid raft region, whereas the N-terminus is located outside of lipid raft [2]. With this characteristic, BST2 can perform its function as an organizer of membrane microdomains [40].
DAP-12 has two crucial tyrosine residues in its ITAM motif. With strong signaling, both tyrosine residues are phosphorylated, and DAP-12 transmits the activation signal. However, when the signal is weak, only one tyrosine residue is phosphorylated and inhibitory signal is transmitted [27]. The partial sequence of DAP-12 ITAM motif has SDVYSDL(SxxYxxL), which coincidently resembles with the sequence in ITIM of BST2; SYDYCRV(SxxYxxV). It might be possible that BST2 somehow interfere NK cell adaptor molecules such as DAP-12 by direct or indirect interactions in the lipid raft. Another possibility would be the competition between BST2 and DAP12 for the phosphorylation of signaling motifs, thus resulting in the regulation of NK cell cytotoxicity.
NK cells were first chosen to be analyzed in this study. However, the expression of BST2 in T cells or B cells was also increased after IL-2 stimulation. Thus, the regulatory mechanism through BST2 could be operational in these cell types (Supplementary Figure S1B). To test whether BST2 functioned similarly in cytotoxic CD8+ T cells, we introduced Bst2-/- into OT1 mice harboring ovalbumin- specific T cell receptor transgene. Antigen stimulated OT1 showed increased expression of BST2. Bst2-/- OT1 cells showed higher cytotoxicity against ovalbumin expressing E.G7 target cells than Bst2+/+ OT1 cells. Neither Bst2+/+ nor Bst2-/- OT1 cells showed any cytotoxicity against mother cell line EL4, which did not express ovalbumin (Supplementary Figure S5). This result suggests that BST2 possibly can act as an inhibitory receptor in cytotoxic T cells in addition to NK cells.
In this study, we found that the long isoform of BST2 could transmit inhibitory signals through the cytoplasmic tail containing an ITIM motif by recognizing Gal-8 and Gal-9. This suggests that galectins are new self-inhibitory ligands to modulate the over-stimulation of NK cell activity. Based on the results of previous reports suggesting the association of galectins with tumor malignancy in breast cancer, renal cancer, thyroid cancer, and other cancers [41], antibody therapy aiming at blocking either BST2 or Gal-8/-9 could be an option for anti-cancer therapy.

4. Materials and Methods

4.1. Cell Lines and Mice

Tumor cell lines YAC-1 (ATCC TIB-160), RMA-S, B16, EL4 (ATCC TIB-39), and E.G7-OVA (ATCC CRL-2113) were cultured in Roswell Park Memorial Institute (RPMI) 1640 Medium (RPMI 1640, Gibco) supplemented with 10% fetal bovine serum (FBS), 2 mM L-glutamine, 1% penicillin-streptomycin, 10 μg/mL gentamycin, and 50 µM β-mercaptoethanol (Gibco-BRL). Bst2 knockout mice (C57BL/6 background) were created on a C57BL/6Tac background by Xenogen Biosciences (Cranbury, NJ). NZW/N mice expressing cytoplasmic tail deficient, short isoform of BST2 (Bst2S/S) were purchased from Japan SLC (Hamamatsu, Japan) and crossed with Bst2 knockout C57BL/6 (B6) mice to generate B6/NZW F1 mice. To generate C57BL/6 mice containing Bst2 gene of NZW origin, NZW/N mice were backcrossed with C57BL/6 Bst2-/- mice at least eight times. All animal experiment protocols of this study were approved by the Institutional Animal Care and Use Committee of Korea University (KUIACUC-2018-25, 29 March~31 December 2018; and KUIACUC-2019-0003, 1 January 2019~31 December 2020).

4.2. Cell Line Gene Knock out

Murine Gal-9 genes (Lgals9) of YAC-1 were knocked out with a CRISPR-Cas9 system. Target sequence of Lgals9 used was 5′- CACGAAGCAGAACGGACAGT-3′. These target sequences were cloned into pX330 vector to make gene-specific gRNA. Reporter vector (tagged with GFP) was co-transfected. At two days after transfection, GFP positive cells were sorted and spread as single cells in a 96-well plate. Among single cells, clones with frame-shift mutation on its both alleles were selected as gene knocked out cells.

4.3. Preparation of NK Cells

For the in vivo stimulation and preparation of NK cells, 150 µg of Poly I:C was intraperitoneally injected. At 16 h after injection, mice were sacrificed and splenic NK cells were isolated using DX-5 microbeads (Miltenyi Biotec, Bergisch Gladbach, Germany).
For in vitro stimulation of NK cells, Naïve splenic NK cells were isolated using DX-5 microbeads. 1 × 10⁶/mL of sorted cells were cultured with 50 µg/mL of Poly I:C and 200 U/mL of IL-2 (PeproTech, Cranbury, NJ, USA) for 16 h.
For the generation of IL-2 activated NK cells (also known as Lymphokine Activated Killer cells or LAK cells), 4 × 10⁶ cells/mL of whole splenocytes were cultured in a 100 mm dish with 1000 U/mL of IL-2 for 72 h. Plate unbounded cells were removed and the remaining cells on the plate were further incubated with a 1:1 mixture of fresh medium containing 500 U/mL of IL-2 and conditioned medium for four days. These cells were composed of over 80% NK cells (NK1.1+TCRβ cells).

4.4. Preparation of OT1 Cells

CD8α+ splenocytes from OT1 mice were sorted using anti-CD8α microbeads (Miltenyi Biotech, Ly-2) and Magnetic-activated cell sorting (MACS) column (Miltenyi Biotech). Sorted cells presented TCRvα2 and TCRvβ5 exclusively that could specifically bind to Kb-OVA257–264. Naïve OT1 cells were stimulated with biotin-conjugated Kb-OVA/anti-CD28 antibody (eBioscience, San Diego, CA, USA, 37.51), which were mixed and bound to anti-biotin MACSiBead particles (Miltenyi Biotech). They were then incubated with 30 units/mL of IL-2 in RPMI medium for 2 to 3 days. Magnetic beads were removed with a magnetic bar prior to any assay.

4.5. Cytotoxic Assay

Before incubating with antibodies, FcγRs were blocked with anti-CD16/32 antibody (2.4G2) for 15 min at 4 °C. Then 10 μg/mL of functional grade anti-BST2 antibody (eBioscience, eBio927) and 50 μg/mL papain-treated anti-galectin antibody (IsuAbxis, Gyeonggi-do, Korea) were used to block respective antigens.
For 7-AAD/CFSE assay, NK cells were labeled with 0.625 μM of CFSE at 37 °C for five minutes. Next, NK cells and target cells were co-cultured for four hours. After 0.5 μg/mL of 7-AAD (BioLegend, San Diego, CA, USA) was added, the mixture was incubated at room temperature for 15 min. Cells were then fixed with 1% paraformaldehyde and analyzed by flow cytometry [42]. Finally, cytotoxicity was calculated using the following formula [43]:
% cytotoxicity = [(test release) − (spontaneous release)]/[(maximal release) − (spontaneous release)] × 100
For Calcein-AM release assay, tumor cells were labeled with 15 μg/mL of Calcein-AM (Thermo Fisher Scientific) for two hours in a 37 °C incubator. Non-fluorescent calcein-AM would turn green after removal of its acetoxymethyl group by intracellular esterases of live cells. Effector cells and tumor cells were co-cultured for one to four hours. After centrifuging the plate at 300× g for 4 min at room temperature, supernatants were collected to detect released as green-fluorescent calcein from tumor cells. Fluorescence was measured at the maximum excitation and emission wavelengths at 485 nm and 535 nm, respectively, using a SpectraMAX I3x. The maximum released calcein was determined after lysing target cells with 3% of Triton X-100. To calibrate the effect of Triton X-100 on results, medium containing triton was added (mediaTriton). The cytotoxicity was then calculated using the following formula:
% Specific lysis = % cytotoxicity = [(test release) − (spontaneous release)]/[{(maximal release) − (media + Triton)} − {(spontaneous release) − (media only)}] × 100

4.6. Flow Cytometry

For flow cytometry staining, 0.5–1 × 10⁶ cells were used. Non-specific binding of antibody to FcγR was blocked with anti-CD16/32 antibody (2.4G2) for 15 min on ice. Cells were incubated with fluorochrome-conjugated antibodies against cell surface antigen and then washed with flow cytometry buffer [PBS with 0.1%BSA (Sigma-Aldrich) and 0.01% sodium azide]. Fixation, permeabilization and staining of intracellular antigen was performed after surface staining. The following monoclonal antibodies were used: fluorescein isothiocyanate (FITC) conjugated anti-B220 (BD Bioscience, RA3-6B2), CD11b (BD Bioscience, M1/70), TCRβ (BD Bioscience, H57), CD25 (BD Bioscience, 7D4), NKG2A/C/E (BD Bioscience, 20d5), CD107a (BD Bioscience, 1D4B), CD44 (BD Bioscience, IM7), phycoerythrin (PE) conjugated streptavidin (BD Bioscience, 2B4), anti-NK1.1 (BD Bioscience, PK136), NKp46 (BD Bioscience, 29A1.4), CD27 (BioLegend, LG.3A10), Granzyme B (eBioscience, NGZB), CD8α (BD Bioscience, 53–6.7), PerCP-Cy5.5 conjugated anti-CD11c (BD, HL3), NK1.1 (BD Bioscience, PK136), eFluor660 conjugated anti-T-bet (eBioscience, ebio4B10), PerCP-eFluor710 conjugated anti-Ly49G2 (eBioscience, ebio4D11), allophycocyanin (APC) conjugated anti-NK1.1 (BD Bioscience, PK136), TCRβ (BD Bioscience, H57), NKG2D (BD Bioscience, CX5), CD62L (BD Bioscience, MEL-14), PE-Vio770 conjugated anti-CD3 (Miltenyi, REA641), APC-Cy7 conjugated anti-CD11b (BD, M1/70), BV421 conjugated anti- IFN-γ (BD, XMG1.2), BV786 conjugated anti-TCR β (BD, H67-597), PE-Cy7 conjugated anti-KLRG1 (eBioscience, 2F1) and biotin conjugated anti-PDCA-1 (eBioscience, e.Bio927). For CD107a staining, anti-CD107a antibody and Golgistop (BD, containing monensin) were added directly to cell culture media where effector cells and target cells were co-cultured. Flow cytometric data were acquired on an FACS Calibur, Verse, Lyric and Fortessa (Becton Dickinson). Data were analyzed using FlowJo version 10 (FlowJo, LLC)

4.7. Enzyme-Linked Immunosorbent Assay (ELISA)

After cytotoxicity assays were completed, culture supernatants were harvested for the detection of Granzyme B. Quantification was completed using ELISA kit (R&D systems, Minneapolis, MN, USA, DY1865) following the manufacturer’s protocol. Briefly, we coated ELISA plate with capture antibody for granzyme B and blocked the plate with BSA solution. After blocking, culture supernatants were added and incubated for appropriate time. Detection antibody for granzyme B was treated in order. Finally, we digitalized the amount of granzyme B in the plate after adding TMB solution followed by absorbance measurement with a microplate reader (Bio-Rad model 680).

4.8. Pull-Down Assay and Western Blot Analysis

Recombinant BST2 was obtained from plasmid transfected 293T cells as described previously [44]. GST-tagged fusion proteins Gal-8, Gal-9, and Gal-3 were expressed in Escherichia coli (E. coli) and then purified by glutathione affinity resin [45]. GST-tagged galectins were immobilized on glutathione-agarose beads and incubated with recombinant BST2. Protein complexes were then eluted with elution buffer from beads. Next, proteins were resolved by sodium dodecyl sulfate-polyacrylamide gel electrophoresis (SDS-PAGE) and silver stained. To confirm the interaction with BST2 and galectins, proteins were transferred to nitrocellulose membranes. Blots were incubated with rabbit anti-BST2 polyclonal antibody and detected with horseradish peroxidase (HRP)-conjugated anti-rabbit IgG. To detect galectin-9 in each target tumor cell lines, cells were lysed with M-PER (Mammalian Protein Extraction Reagent, Thermo scientific) with proteinase inhibitor. The concentration of total proteins was measured by Bradford assay (Bio-Rad, 5000006). 15μg of proteins per lane were loaded and separated by SDS-PAGE and transferred to PVDF (Polyvinylidene fluoride) membrane (Bio-Rad, 1620177). Purified anti-mouse galectin-9 antibody (Biolegend, 108A2, 137901) was used for primary antibody and HRP-conjugated goat anti-rat IgG (Santa Cruz Biotechnology, sc-2006) was used for detection antibody. Anti-GAPDH antibody (Santa Cruz Biotechnology, 6C5, sc-32233) and HRP-conjugated anti-mouse IgG (Sigma-Aldrich) were used for detection of GAPDH, a housekeeping gene. Blot images were obtained using an LAS4000 mini (GE Healthcare, Chicago, IL, USA).

4.9. Statistical Analysis

GraphPad Prism Version 6.0 (GraphPad Software Inc., San Diego, CA, USA) was used to perform all statistical analyses. Differences in data were compared using unpaired two-tailed t-test or two-way analysis of variance (ANOVA) with Sidak’s multiple comparison test. Data are expressed as mean ± standard deviation (S.D.). Differences were considered significant if p < 0.05. Asterisk was used to indicate significance levels (*, p < 0.05; **, p < 0.01; ***, p < 0.001; ****, p < 0.0001; n.s., not significant).

Supplementary Materials

The following supporting information can be downloaded at: https://www.mdpi.com/article/10.3390/ijms231911395/s1.

Author Contributions

Conceptualization: S.-H.P., J.O., and E.Y.; methodology: S.-H.P.; software: E.Y.; validation: J.O., E.Y., and S.P.; formal analysis: J.O. and E.Y.; investigation: J.O., E.Y., and S.-H.P.; resources: S.-H.P.; data curation: J.O.; writing—original draft preparation: J.O. and E.Y.; writing—review and editing: S.-H.P. and S.K.J.; visualization: J.O. and E.Y.; supervision: S.-H.P.; project administration: S.-H.P.; funding acquisition: S.-H.P. All authors have read and agreed to the published version of the manuscript.

Funding

This research was funded by the Basic Science Research Programs of the National Research Foundation of Korea, grant number NRF-2020M3A9I2108528 and NRF-2022R1A2C1011029.

Institutional Review Board Statement

The animal study protocols adopted in this study were approved by the Institutional Animal Care and Use Committee of Korea University.

Informed Consent Statement

Not applicable.

Data Availability Statement

The data presented in this study are available in article or Supplementary Materials.

Acknowledgments

The authors thank Sang-Ho Park and Hyouna Yoo of IsuAbxis Co. for providing research materials as generous gifts and their valuable comments. We also thank the staff of Gyerim Experimental Animal Resource Center for animal care and technical assistance.

Conflicts of Interest

The authors declare no conflict of interest.

References

  1. Ruiz, A.; Lau, D.; Mitchell, R.S.; Hill, M.S.; Schmitt, K.; Guatelli, J.C.; Stephens, E.B. BST-2 mediated restriction of simian-human immunodeficiency virus. Virology 2010, 406, 312–321. [Google Scholar] [CrossRef] [PubMed]
  2. Kupzig, S.; Korolchuk, V.; Rollason, R.; Sugden, A.; Wilde, A.; Banting, G. Bst-2/HM1.24 is a raft-associated apical membrane protein with an unusual topology. Traffic 2003, 4, 694–709. [Google Scholar] [CrossRef] [PubMed]
  3. Cocka, L.J.; Bates, P. Identification of alternatively translated Tetherin isoforms with differing antiviral and signaling activities. PLoS Pathog. 2012, 8, e1002931. [Google Scholar] [CrossRef] [PubMed]
  4. Barrett, B.S.; Smith, D.S.; Li, S.X.; Guo, K.; Hasenkrug, K.J.; Santiago, M.L. A single nucleotide polymorphism in tetherin promotes retrovirus restriction in vivo. PLoS Pathog. 2012, 8, e1002596. [Google Scholar] [CrossRef] [PubMed]
  5. Galão, R.P.; Pickering, S.; Curnock, R.; Neil, S.J.D. Retroviral retention activates a Syk-dependent HemITAM in human tetherin. Cell Host Microbe 2014, 16, 291–303. [Google Scholar] [CrossRef]
  6. Orr, M.T.; Lanier, L.L. Natural killer cell education and tolerance. Cell 2010, 142, 847–856. [Google Scholar] [CrossRef]
  7. Hua, C.T.; Gamble, J.R.; Vadas, M.A.; Jackson, D.E. Recruitment and activation of SHP-1 protein-tyrosine phosphatase by human platelet endothelial cell adhesion molecule-1 (PECAM-1). Identification of immunoreceptor tyrosine-based inhibitory motif-like binding motifs and substrates. J. Biol. Chem. 1998, 273, 28332–28340. [Google Scholar] [CrossRef]
  8. Daeron, M.; Jaeger, S.; Du Pasquier, L.; Vivier, E. Immunoreceptor tyrosine-based inhibition motifs: A quest in the past and future. Immunol. Rev. 2008, 224, 11–43. [Google Scholar] [CrossRef]
  9. Brandstadter, J.D.; Yang, Y. Natural killer cell responses to viral infection. J. Innate Immun. 2011, 3, 274–279. [Google Scholar] [CrossRef]
  10. Stewart, C.A.; Laugier-Anfossi, F.; Vély, F.; Saulquin, X.; Riedmuller, J.; Tisserant, A.; Gauthier, L.; Romagné, F.; Ferracci, G.; Arosa, F.A.; et al. Recognition of peptide-MHC class I complexes by activating killer immunoglobulin-like receptors. Proc. Natl. Acad. Sci. USA 2005, 102, 13224–13229. [Google Scholar] [CrossRef] [Green Version]
  11. Khakoo, S.I.; Carrington, M. KIR and disease: A model system or system of models? Immunol. Rev. 2006, 214, 186–201. [Google Scholar] [CrossRef] [PubMed]
  12. Bauer, S.; Groh, V.; Wu, J.; Steinle, A.; Phillips, J.H.; Lanier, L.L.; Spies, T. Activation of NK cells and T cells by NKG2D, a receptor for stress-inducible MICA. Science 1999, 285, 727–729. [Google Scholar] [CrossRef] [PubMed]
  13. Barrow, A.D.; Martin, C.J.; Colonna, M. The Natural Cytotoxicity Receptors in Health and Disease. Front. Immunol. 2019, 10, 909. [Google Scholar] [CrossRef]
  14. Prager, I.; Watzl, C. Mechanisms of natural killer cell-mediated cellular cytotoxicity. J. Leukoc. Biol. 2019, 105, 1319–1329. [Google Scholar] [CrossRef] [PubMed]
  15. Martín-Antonio, B.; Suñe, G.; Perez-Amill, L.; Castella, M.; Urbano-Ispizua, A. Natural Killer Cells: Angels and Devils for Immunotherapy. Int. J. Mol. Sci. 2017, 18, 1868. [Google Scholar] [CrossRef]
  16. Moretta, L.; Ciccone, E.; Mingari, M.C.; Biassoni, R.; Moretta, A. Human natural killer cells: Origin, clonality, specificity, and receptors. Adv. Immunol. 1994, 55, 341–380. [Google Scholar]
  17. Wagtmann, N.; Rajagopalan, S.; Winter, C.C.; Peruzzi, M.; Long, E.O. Killer cell inhibitory receptors specific for HLA-C and HLA-B identified by direct binding and by functional transfer. Immunity 1995, 3, 801–809. [Google Scholar] [CrossRef]
  18. Karlhofer, F.M.; Ribaudo, R.K.; Yokoyama, W.M. MHC class I alloantigen specificity of Ly-49+ IL-2-activated natural killer cells. Nature 1992, 358, 66–70. [Google Scholar] [CrossRef]
  19. Rotte, A.; Jin, J.Y.; Lemaire, V. Mechanistic overview of immune checkpoints to support the rational design of their combinations in cancer immunotherapy. Ann. Oncol. 2018, 29, 71–83. [Google Scholar] [CrossRef]
  20. Chou, F.-C.; Chen, H.-Y.; Kuo, C.-C.; Sytwu, H.-K. Role of Galectins in Tumors and in Clinical Immunotherapy. Int. J. Mol. Sci. 2018, 19, 430. [Google Scholar] [CrossRef]
  21. Li, S.; Yu, Y.; Koehn, C.D.; Zhang, Z.; Su, K. Galectins in the Pathogenesis of Rheumatoid Arthritis. J. Clin. Cell. Immunol. 2013, 4, 1000164. [Google Scholar] [CrossRef] [PubMed] [Green Version]
  22. Golden-Mason, L.; McMahan, R.H.; Strong, M.; Reisdorph, R.; Mahaffey, S.; Palmer, B.E.; Cheng, L.; Kulesza, C.; Hirashima, M.; Niki, T.; et al. Galectin-9 functionally impairs natural killer cells in humans and mice. J. Virol. 2013, 87, 4835–4845. [Google Scholar] [CrossRef] [PubMed]
  23. Wang, W.; Guo, H.; Geng, J.; Zheng, X.; Wei, H.; Sun, R.; Tian, Z. Tumor-released Galectin-3, a soluble inhibitory ligand of human NKp30, plays an important role in tumor escape from NK cell attack. J. Biol. Chem. 2014, 289, 33311–33319. [Google Scholar] [CrossRef]
  24. Liu, F.T.; Rabinovich, G.A. Galectins as modulators of tumour progression. Nat. Rev. Cancer 2005, 5, 29–41. [Google Scholar] [CrossRef] [PubMed]
  25. Elola, M.; Ferragut, F.; Delgado, V.; Nugnes, L.; Gentilini, L.; Laderach, D.; Troncoso, M.; Compagno, D.; Wolfenstein-Todel, C.; Rabinovich, G. Expression, localization and function of galectin-8, a tandem-repeat lectin, in human tumors. Histol. Histopathol. 2014, 29, 1093–1105. [Google Scholar] [CrossRef] [PubMed]
  26. Staub, E.; Rosenthal, A.; Hinzmann, B. Systematic identification of immunoreceptor tyrosine-based inhibitory motifs in the human proteome. Cell. Signal. 2004, 16, 435–456. [Google Scholar] [CrossRef]
  27. Barrow, A.D.; Trowsdale, J. You say ITAM and I say ITIM, let’s call the whole thing off: The ambiguity of immunoreceptor signalling. Eur. J. Immunol. 2006, 36, 1646–1653. [Google Scholar] [CrossRef]
  28. Takemoto, Y.; Furuta, M.; Sato, M.; Kubo, M.; Hashimoto, Y. Isolation and characterization of a novel HS1 SH3 domain binding protein, HS1BP3. Int. Immunol. 1999, 11, 1957–1964. [Google Scholar] [CrossRef]
  29. Taylor, V.C.; Buckley, C.D.; Douglas, M.; Cody, A.J.; Simmons, D.L.; Freeman, S.D. The myeloid-specific sialic acid-binding receptor, CD33, associates with the protein-tyrosine phosphatases, SHP-1 and SHP-2. J. Biol. Chem. 1999, 274, 11505–11512. [Google Scholar] [CrossRef]
  30. Martínez-Lostao, L.; Anel, A.; Pardo, J. How Do Cytotoxic Lymphocytes Kill Cancer Cells? Clin. Cancer Res. 2015, 21, 5047–5056. [Google Scholar] [CrossRef]
  31. Alter, G.; Malenfant, J.M.; Altfeld, M. CD107a as a functional marker for the identification of natural killer cell activity. J. Immunol. Methods 2004, 294, 15–22. [Google Scholar] [CrossRef] [PubMed]
  32. Li, Y.-H.; Zhou, W.-H.; Tao, Y.; Wang, S.-C.; Jiang, Y.-L.; Zhang, D.; Piao, H.-L.; Fu, Q.; Li, D.-J.; Du, M.-R. The Galectin-9/Tim-3 pathway is involved in the regulation of NK cell function at the maternal–fetal interface in early pregnancy. Cell. Mol. Immunol. 2016, 13, 73–81. [Google Scholar] [CrossRef] [PubMed]
  33. Li, S.X.; Barrett, B.S.; Heilman, K.J.; Messer, R.J.; Liberatore, R.A.; Bieniasz, P.D.; Kassiotis, G.; Hasenkrug, K.J.; Santiago, M.L. Tetherin promotes the innate and adaptive cell-mediated immune response against retrovirus infection in vivo. J. Immunol. 2014, 193, 306–316. [Google Scholar] [CrossRef] [PubMed]
  34. Cao, W.; Bover, L.; Cho, M.; Wen, X.; Hanabuchi, S.; Bao, M.; Rosen, D.B.; Wang, Y.-H.; Shaw, J.L.; Du, Q.; et al. Regulation of TLR7/9 responses in plasmacytoid dendritic cells by BST2 and ILT7 receptor interaction. J. Exp. Med. 2009, 206, 1603–1614. [Google Scholar] [CrossRef]
  35. Vivier, E.; Nunès, J.A.; Vély, F. Natural Killer Cell Signaling Pathways. Science 2004, 306, 1517–1519. [Google Scholar] [CrossRef] [PubMed]
  36. Orange, J.S. Formation and function of the lytic NK-cell immunological synapse. Nat. Rev. Immunol. 2008, 8, 713–725. [Google Scholar] [CrossRef]
  37. Inoue, H.; Miyaji, M.; Kosugi, A.; Nagafuku, M.; Okazaki, T.; Mimori, T.; Amakawa, R.; Fukuhara, S.; Domae, N.; Bloom, E.T.; et al. Lipid rafts as the signaling scaffold for NK cell activation: Tyrosine phosphorylation and association of LAT with phosphatidylinositol 3-kinase and phospholipase C-γ following CD2 stimulation. Eur. J. Immunol. 2002, 32, 2188–2198. [Google Scholar] [CrossRef]
  38. Dong, R.; Tan, Y.; Fan, A.; Liao, Z.; Liu, H.; Wei, P. Molecular Dynamics of the Recruitment of Immunoreceptor Signaling Module DAP12 Homodimer to Lipid Raft Boundary Regulated by PIP2. J. Phys. Chem. B 2020, 124, 504–510. [Google Scholar] [CrossRef]
  39. Serrano-Pertierra, E.; Cernuda-Morollón, E.; Brdička, T.; Hoøejši, V.; López-Larrea, C. L-plastin is involved in NKG2D recruitment into lipid rafts and NKG2D-mediated NK cell migration. J. Leukoc. Biol. 2014, 96, 437–445. [Google Scholar] [CrossRef]
  40. Billcliff, P.G.; Rollason, R.; Prior, I.; Owen, D.M.; Gaus, K.; Banting, G. CD317/tetherin is an organiser of membrane microdomains. J. Cell Sci 2013, 126 Pt 7, 1553–1564. [Google Scholar] [CrossRef]
  41. Uhlén, M.; Fagerberg, L.; Hallström, B.M.; Lindskog, C.; Oksvold, P.; Mardinoglu, A.; Sivertsson, Å.; Kampf, C.; Sjöstedt, E.; Asplund, A.; et al. Tissue-based map of the human proteome. Science 2015, 347, 1260419. [Google Scholar] [CrossRef] [PubMed]
  42. Lecoeur, H.; Février, M.; Garcia, S.; Rivière, Y.; Gougeon, M.-L. A novel flow cytometric assay for quantitation and multiparametric characterization of cell-mediated cytotoxicity. J. Immunol. Methods 2001, 253, 177–187. [Google Scholar] [CrossRef]
  43. Neri, S.; Mariani, E.; Meneghetti, A.; Cattini, L.; Facchini, A. Calcein-acetyoxymethyl cytotoxicity assay: Standardization of a method allowing additional analyses on recovered effector cells and supernatants. Clin. Diagn. Lab. Immunol. 2001, 8, 1131–1135. [Google Scholar] [CrossRef] [PubMed]
  44. Yoo, H.; Park, S.H.; Ye, S.K.; Kim, M. IFN-gamma-induced BST2 mediates monocyte adhesion to human endothelial cells. Cell. Immunol. 2011, 267, 23–29. [Google Scholar] [CrossRef]
  45. Schäfer, F.; Seip, N.; Maertens, B.; Block, H.; Kubicek, J. Chapter Nine—Purification of GST-Tagged Proteins. In Methods in Enzymology; Lorsch, J.R., Ed.; Academic Press: Cambridge, MA, USA, 2015; Volume 559, pp. 127–139. [Google Scholar]
Figure 1. PolyI:C stimulated Bst2-/- NK cells have a higher cytotoxicity to tumor cells than Bst2+/+ NK cells. B6-origin Bst2 wildtype (+/+) and Bst2 knockout (-/-) mice were intraperitoneally injected with polyI:C. At 16 hrs after injections, splenic NK cells were isolated using DX-5 microbeads. (A) Bst2+/+ and Bst2-/- NK cells were stained with anti-BST2 antibody and analyzed by flow cytometry. NK1.1+ TCRβ- cells were indicated as NK cells. Data are representative of two independent experiments. (B) Calcein-AM stained target cells (YAC-1 and RMA-S) were co-cultured with Bst2+/+ and Bst2-/- NK cells for 4 hrs at 37 °C in a humidified incubator. Released calcein was measured by SpectraMAX with excitation/emission wavelengths at 485 nm/535 nm. Graphs showed a mean ± S.D. (n = 3 per group). Data are representative of three independent experiments. (*, p < 0.05; ***, p < 0.001; ****, p < 0.0001).
Ijms 23 11395 g001
Figure 2. Bst2-/- lymphokine activated killer cells have higher cytotoxicity to tumor cells than Bst2+/+ LAK cells. Naïve splenocytes of B6-origin Bst2+/+ and Bst2-/- mice were stimulated with IL-2 for seven days to generate LAK cells. (A) Bst2+/+ and Bst2-/- LAK cells were stained with anti-BST2 antibody and analyzed by flow cytometry. (B) Calcein-AM stained target cells (YAC-1) were co-cultured with Bst2+/+ and Bst2-/- LAK cells for 1 hr at 37 °C in a humidified incubator. Released calcein was measured to analyze cytotoxicity of effector cells as described in Figure 1. Graphs showed a mean ± S.D. (n = 3–4 per group). Data are representative of three independent experiments. (C) After detecting calcein released in media, released granzyme B in the same media was measured by enzyme-linked immunosorbent assay (ELISA). Graphs showed a mean ± S.D. (n = 3–4 per group). Data are representative of two independent experiments. (D) Bst2+/+ and Bst2-/- LAK cells were co-cultured with target cells (YAC-1) in culture media containing Golgistop and anti-CD107a antibody. NK1.1 and TCRβ were stained after 1 hr of cultivation at 37 °C in a humidified incubator. Percentages of CD107a positive cells from LAK cells (NK1.1+ TCRβ-) were indicated. Graphs showed a mean ± S.D. (n = 3 per group). Data are representative of two independent experiments. (E) CFSE stained Bst2+/+ LAK cells were treated with isotype control or anti-BST2 antibodies and co-cultured with target cells (RMA-S and B16) for 4 hrs at 37 °C in a humidified incubator. Cells were stained with 7-AAD after cultivation. These cells were then fixed with 1% paraformaldehyde and analyzed by flow cytometry. CFSE-, 7-AAD+ population is designated as lysed target cells. The word ‘iso’ indicates isotype control antibody treatment and ‘αBST2′ indicates anti-BST2 antibody treatment. Graphs showed a mean ± S.D. (n = 3–5 per group). (**, p < 0.01; ***, p < 0.001; ****, p < 0.0001; n.s., not significant).
Ijms 23 11395 g002
Figure 3. Galectin-9 is associated with BST2-dependent NK cell activity. (A) Recombinant BST2 protein was pulled down with GST-tagged Gal-3 (GST-Gal3), as well as the GST-tagged long isoform of Gal-9 (GST-Gal9L). Precipitates were then analyzed by western blotting with anti-BST-2 antibody. (B) Recombinant BST2 protein was pulled down with either GST-tagged NCRD or CCRD of Gal9L (GST-Gal9L-NCRD or GST-Gal9L-CCRD). Precipitates were then analyzed by western blotting with anti-BST-2 antibody. (C) Naïve splenocytes of B6-origin Bst2+/+ and Bst2-/- mice were stimulated by IL-2 for seven days to generate LAK cells. CFSE stained Bst2+/+ and Bst2-/- LAK cells were co-cultured with target cells (B16) for 4 hrs at 37 °C in a humidified incubator in the presence of isotype control antibody or anti-Gal-9 antibody. Cells were stained with 7-AAD after cultivation. These cells were then fixed with 1% paraformaldehyde and analyzed by flow cytometry. CFSE-, 7-AAD+ population is designated as lysed target cells. Graphs showed a mean ± S.D. (n = 2–4 per group). (D) Naïve splenocytes of B6-origin Bst2+/+ and Bst2-/- mice were stimulated by IL-2 for seven days to generate LAK cells. Calcein-AM stained target cells (Wild type (WT) YAC-1 and Lgals9-/- YAC-1) were co-cultured with Bst2+/+ and Bst2-/- LAK cells for 3 hrs in a 96-well round plate. Released calcein was measured to analyze cytotoxicity of effector cells as described in Figure 1. Graphs showed a mean ± S.D. (n = 4–6 per group). Data are representative of two independent experiments. (E) Western blotting was performed on whole cell lysates of tumor target cell lines with anti-galectin-9 antibody and anti-GAPDH antibody. GAPDH was used as a loading control. The upper panel showed the result of wildtype tumor cell lines (RMA-S, B16, and YAC-1) and the lower panel showed the comparison of wildtype YAC-1 and Lgals9-/- YAC-1 clone used in this study. (*, p < 0.05; **, p < 0.01; ****, p < 0.0001; n.s., not significant).
Ijms 23 11395 g003
Figure 4. Long isoform, but not short isoform, of BST2 on NK cells impedes cytotoxicity. (A) F1 hybrids were generated by crossing B6-origin Bst2+/- mice and NZW mice (Bst2S/S). (B) Naïve splenocytes of F1 hybrids and B6-origin Bst2-/- mice were stimulated by IL-2 for seven days to generate LAK cells. Expression of BST2 was detected through flow cytometry staining. (C) CFSE stained Bst2S/+ and Bst2S/- LAK cells were co-cultured with target cells (YAC-1, RMA-S, and B16) for 4 hrs at 37 °C in a humidified incubator. Cells were stained with 7-AAD after cultivation. These cells were then fixed with 1% paraformaldehyde and analyzed by FACS. CFSE-, 7-AAD+ population is designated as lysed target cells. Graphs showed a mean ± S.D. (n = 4 per group). (D) CFSE stained Bst2S/+ and Bst2S/- LAK cells from F1 hybrids were co-cultured with target cells (RMA-S) cells for 4 hrs at 37 °C in a humidified incubator in absence or presence of anti-BST2 antibody. Graphs showed mean ± S.D. (n = 3–4 per group). (**, p < 0.01; ****, p < 0.0001; n.s., not significant).
Ijms 23 11395 g004
Figure 5. NK cells with short isoform of BST2 show enhanced cytotoxicity as well as BST2 deficient NK cells. (A) Backcross from NZW (Bst2S/S) background to B6 background. (B) BST2 expression of LAK cells generated from splenocytes of B6-background Bst2+/-, Bst2S/-, and Bst2-/- mice. (C) Calcein-AM stained target cells (YAC-1, RMA-S, and B16) were co-cultured with Bst2+/-, Bst2S/-, and Bst2-/- LAK cells for 4 hrs at 37 °C in a humidified incubator. Released calcein was measured to analyze cytotoxicity of effector cells as described in Figure 1. Data are representative of two independent experiments. Graphs showed mean ± S.D. (n = 4 per group). (D) Naïve splenocytes of B6-origin Bst2+/+, Bst2S/-, and Bst2-/- mice were stimulated by IL-2 for seven days to generate LAK cells. Expression level of BST2 was measured through flow cytometry staining. (E) Calcein-AM stained target cells (YAC-1 and Lgals9-/- YAC-1) were co-cultured with Bst2+/+, Bst2S/-, and Bst2-/- LAK cells for 4 hrs at 37 °C in a humidified incubator. Released calcein was measured to analyze cytotoxicity of effector cells as described in Figure 1. Graphs showed a mean ± S.D. (n = 6 per group). (*, p < 0.05; **, p < 0.01; n.s., not significant).
Ijms 23 11395 g005
Table 1. ITIM motif of the cytoplasmic tail domain in BST2.
GeneSpeciesAmino acid Sequence Alongside ITIM MotifITIM Tyrosine ResidueReference
BST2HumanMASTSYDYCRVPMEDGDKRC…Y8
Bst2MouseMAPSFYHYLPVPMDEMGGKQGWGS…Y6
Hs1bp3Mouse…GHVEYQILVVTR…VSKKYSEIEEFYQKLSSRY…Y41, Y71, Y78[28]
CD33Human…ELHYASLNFH…STEYSEVRTQY340, Y358[29]
1. Underline indicates ITIM motif. 2. Red character indicates conserved amino acids of ITIM motif.
Publisher’s Note: MDPI stays neutral with regard to jurisdictional claims in published maps and institutional affiliations.

