
An Association between Diet and MC4R Genetic Polymorphism, in Relation to Obesity and Metabolic Parameters—A Cross Sectional Population-Based Study

 , , ,
, , ,  , , , ,
Abstract
1. Introduction
2. Results
2.1. The Characteristic of Studied Population
2.2. Dietary Intake
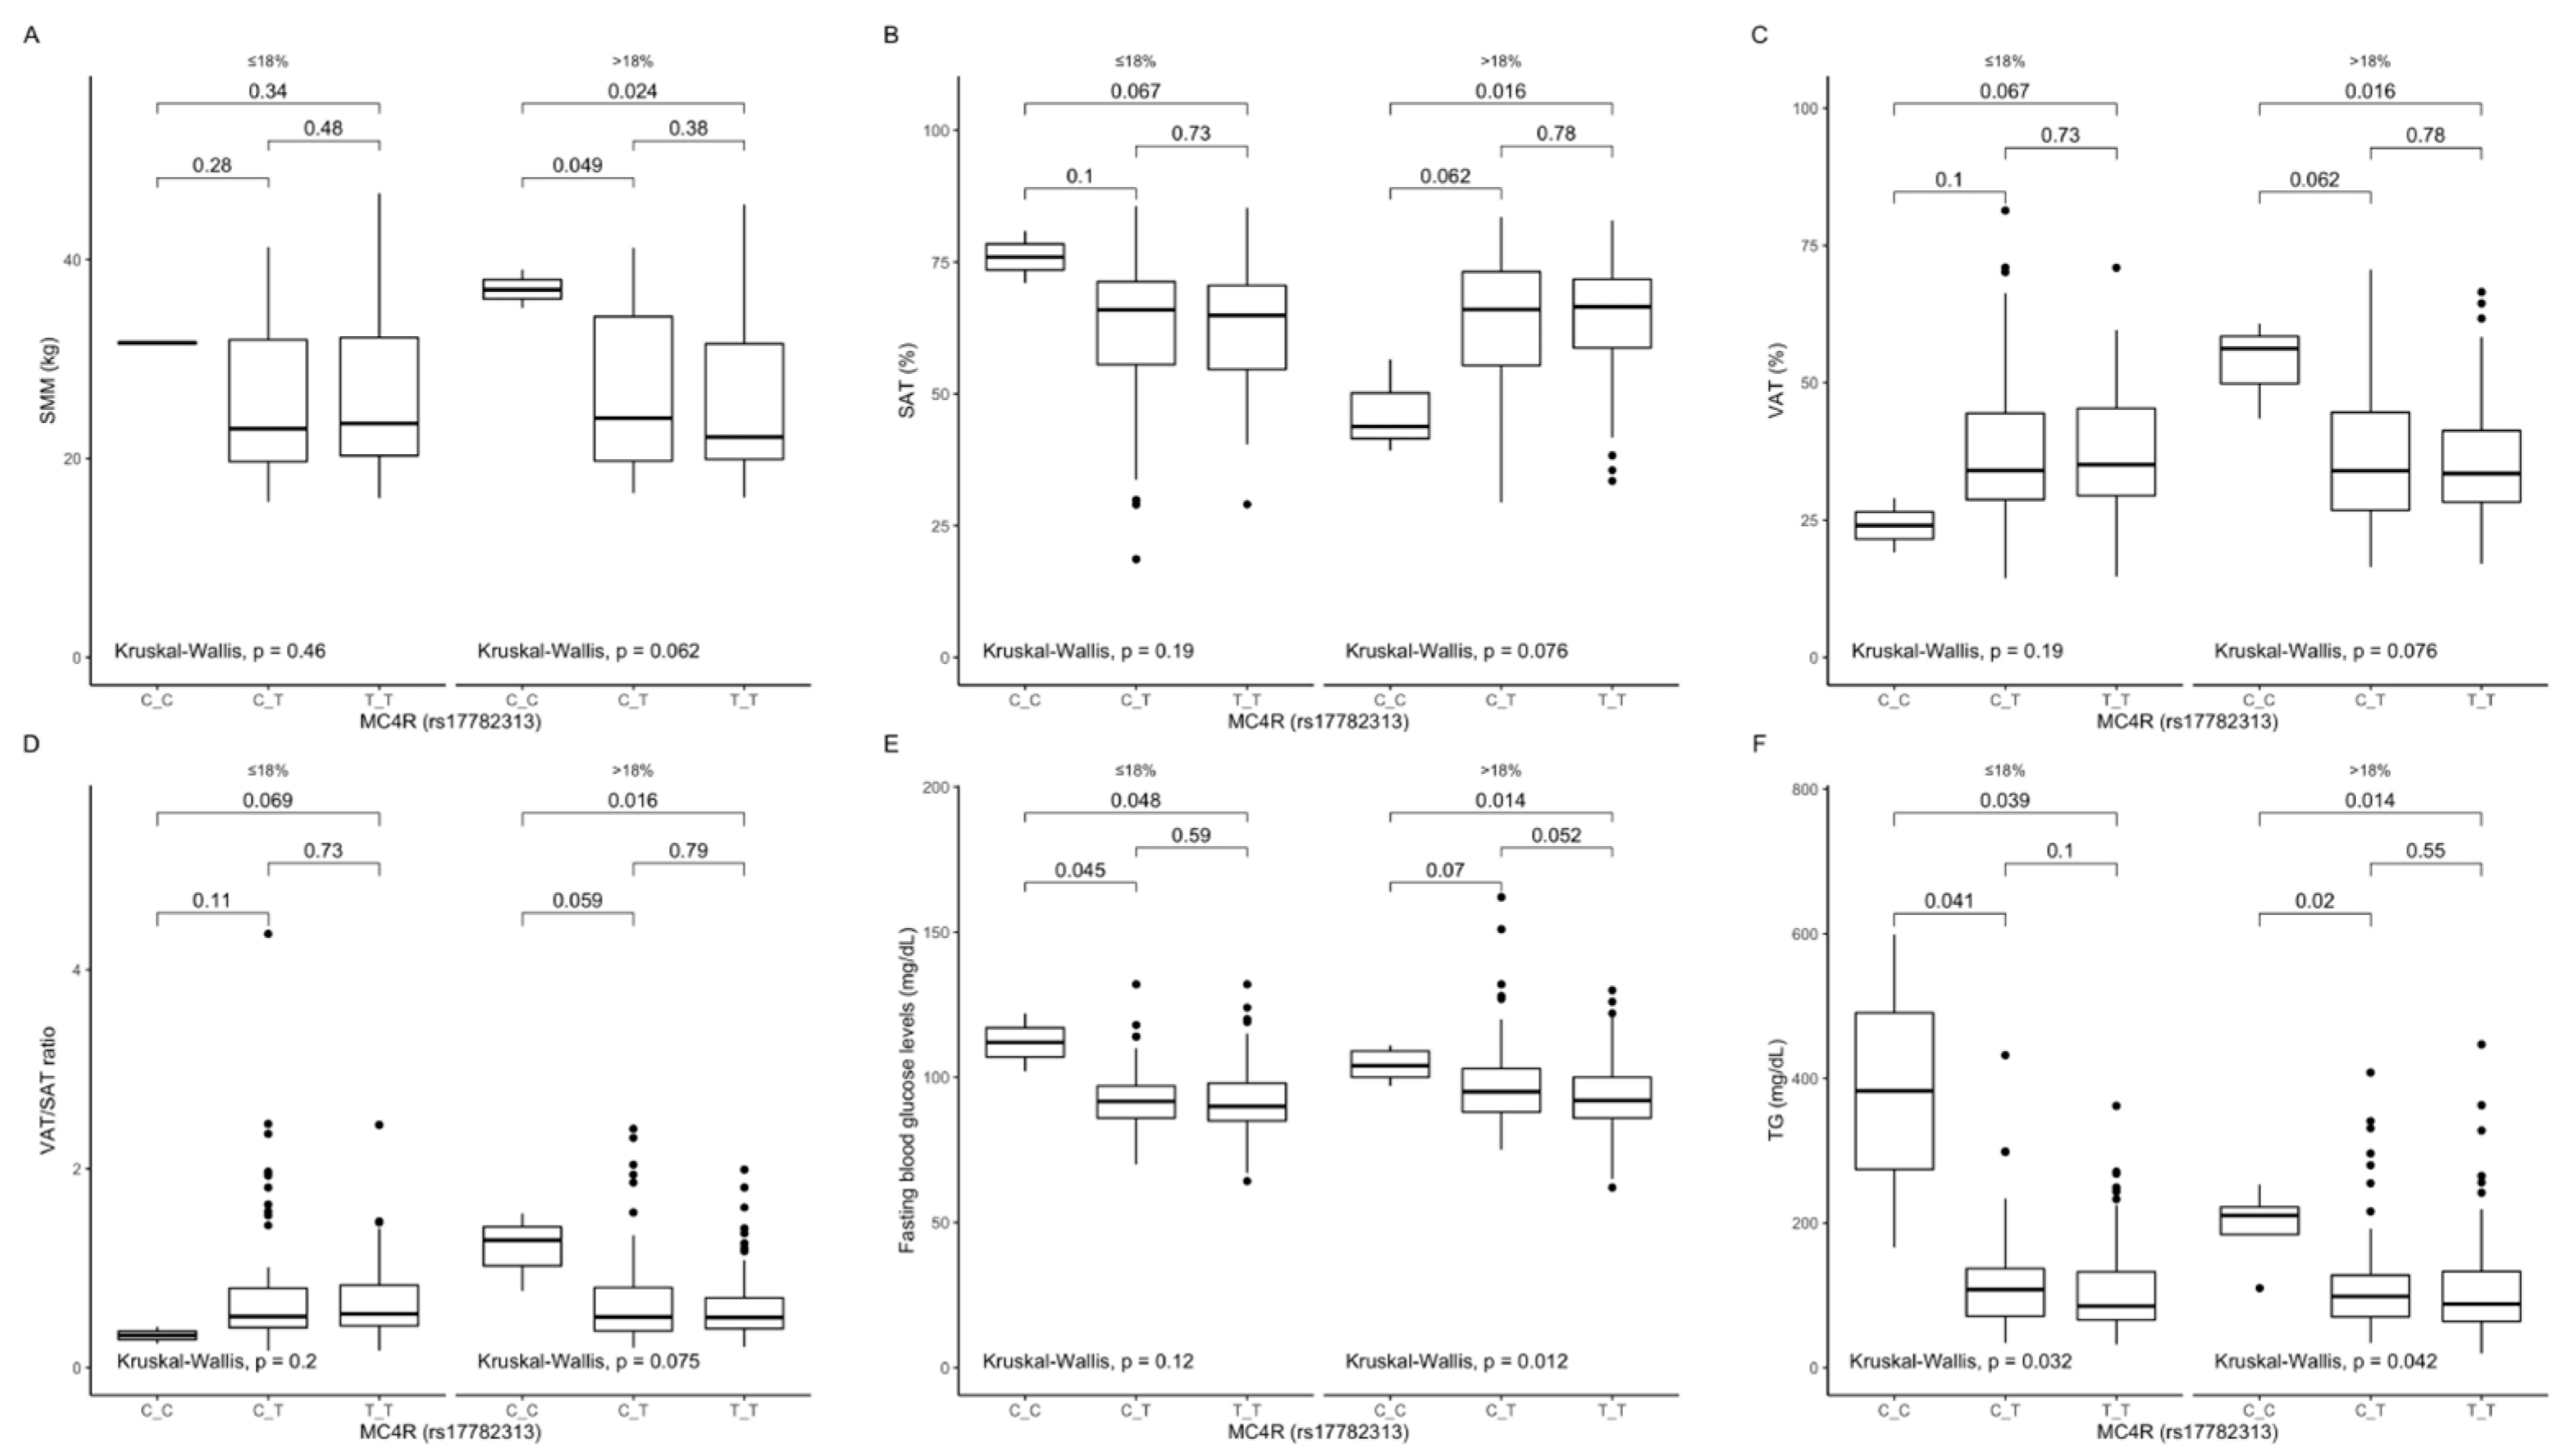
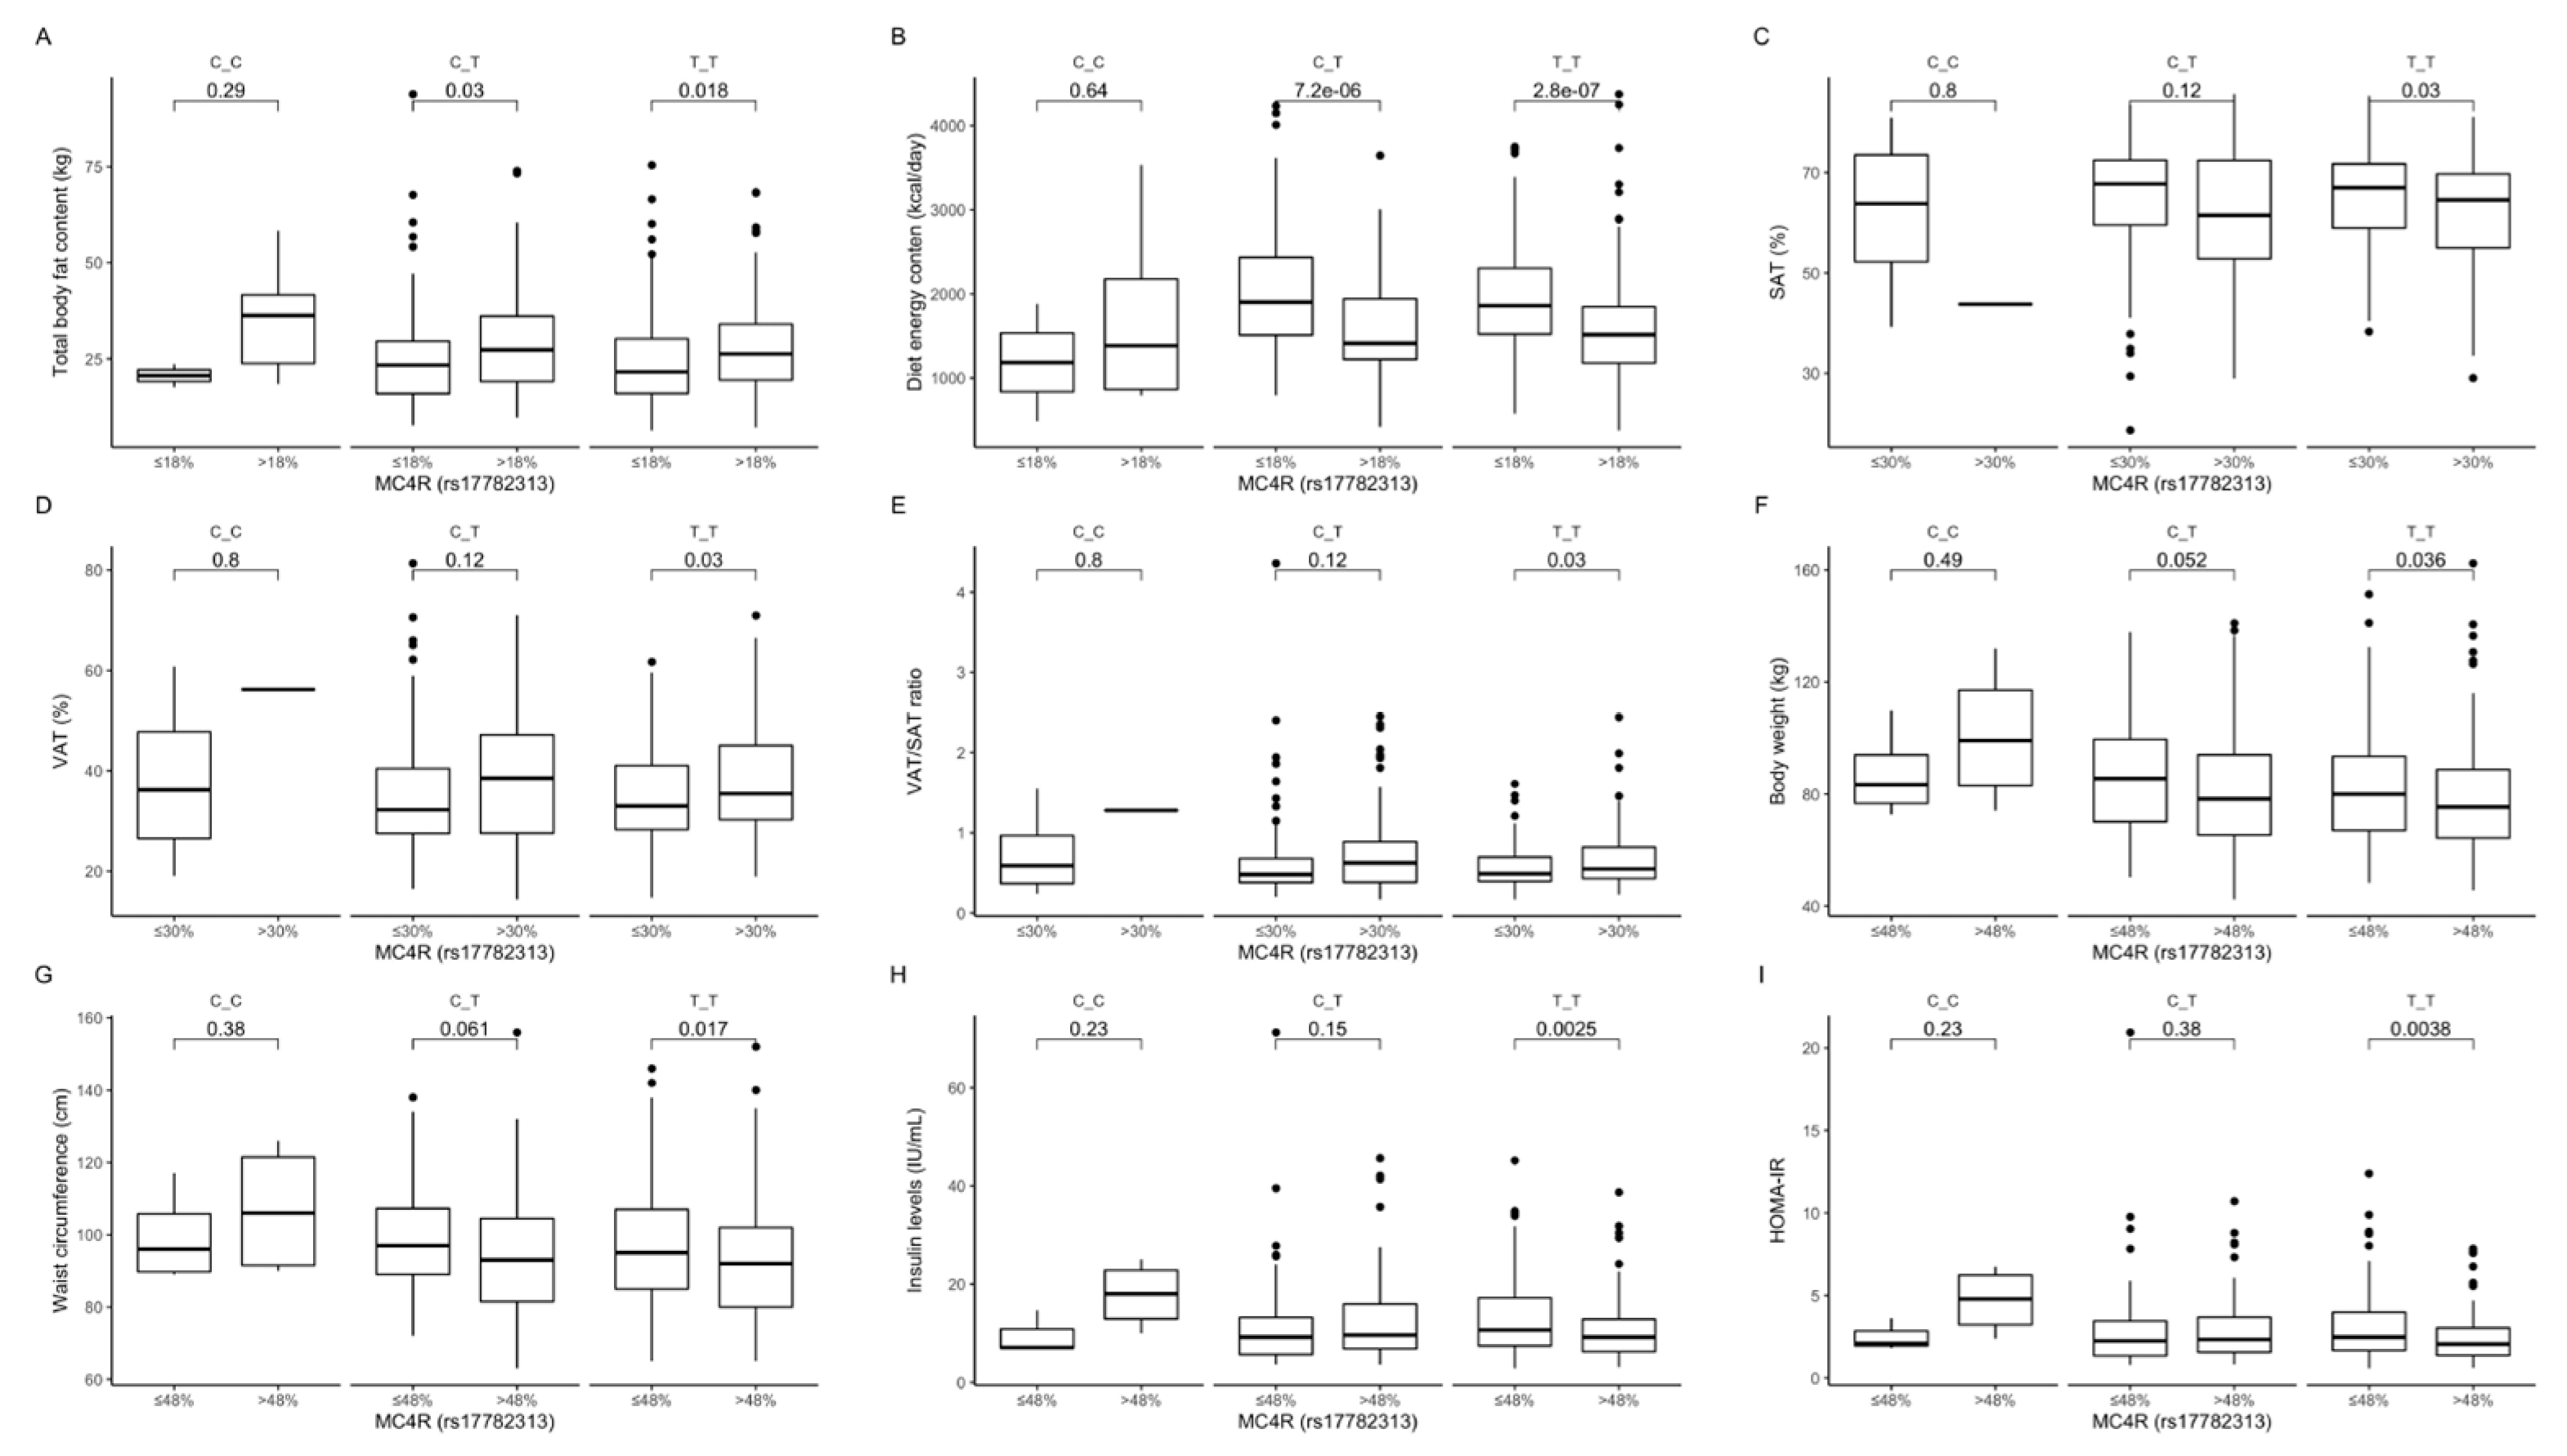
2.3. Associations between the rs17782313 Polymorphism and Obesity, Its Comorbidities and Dietary Intake
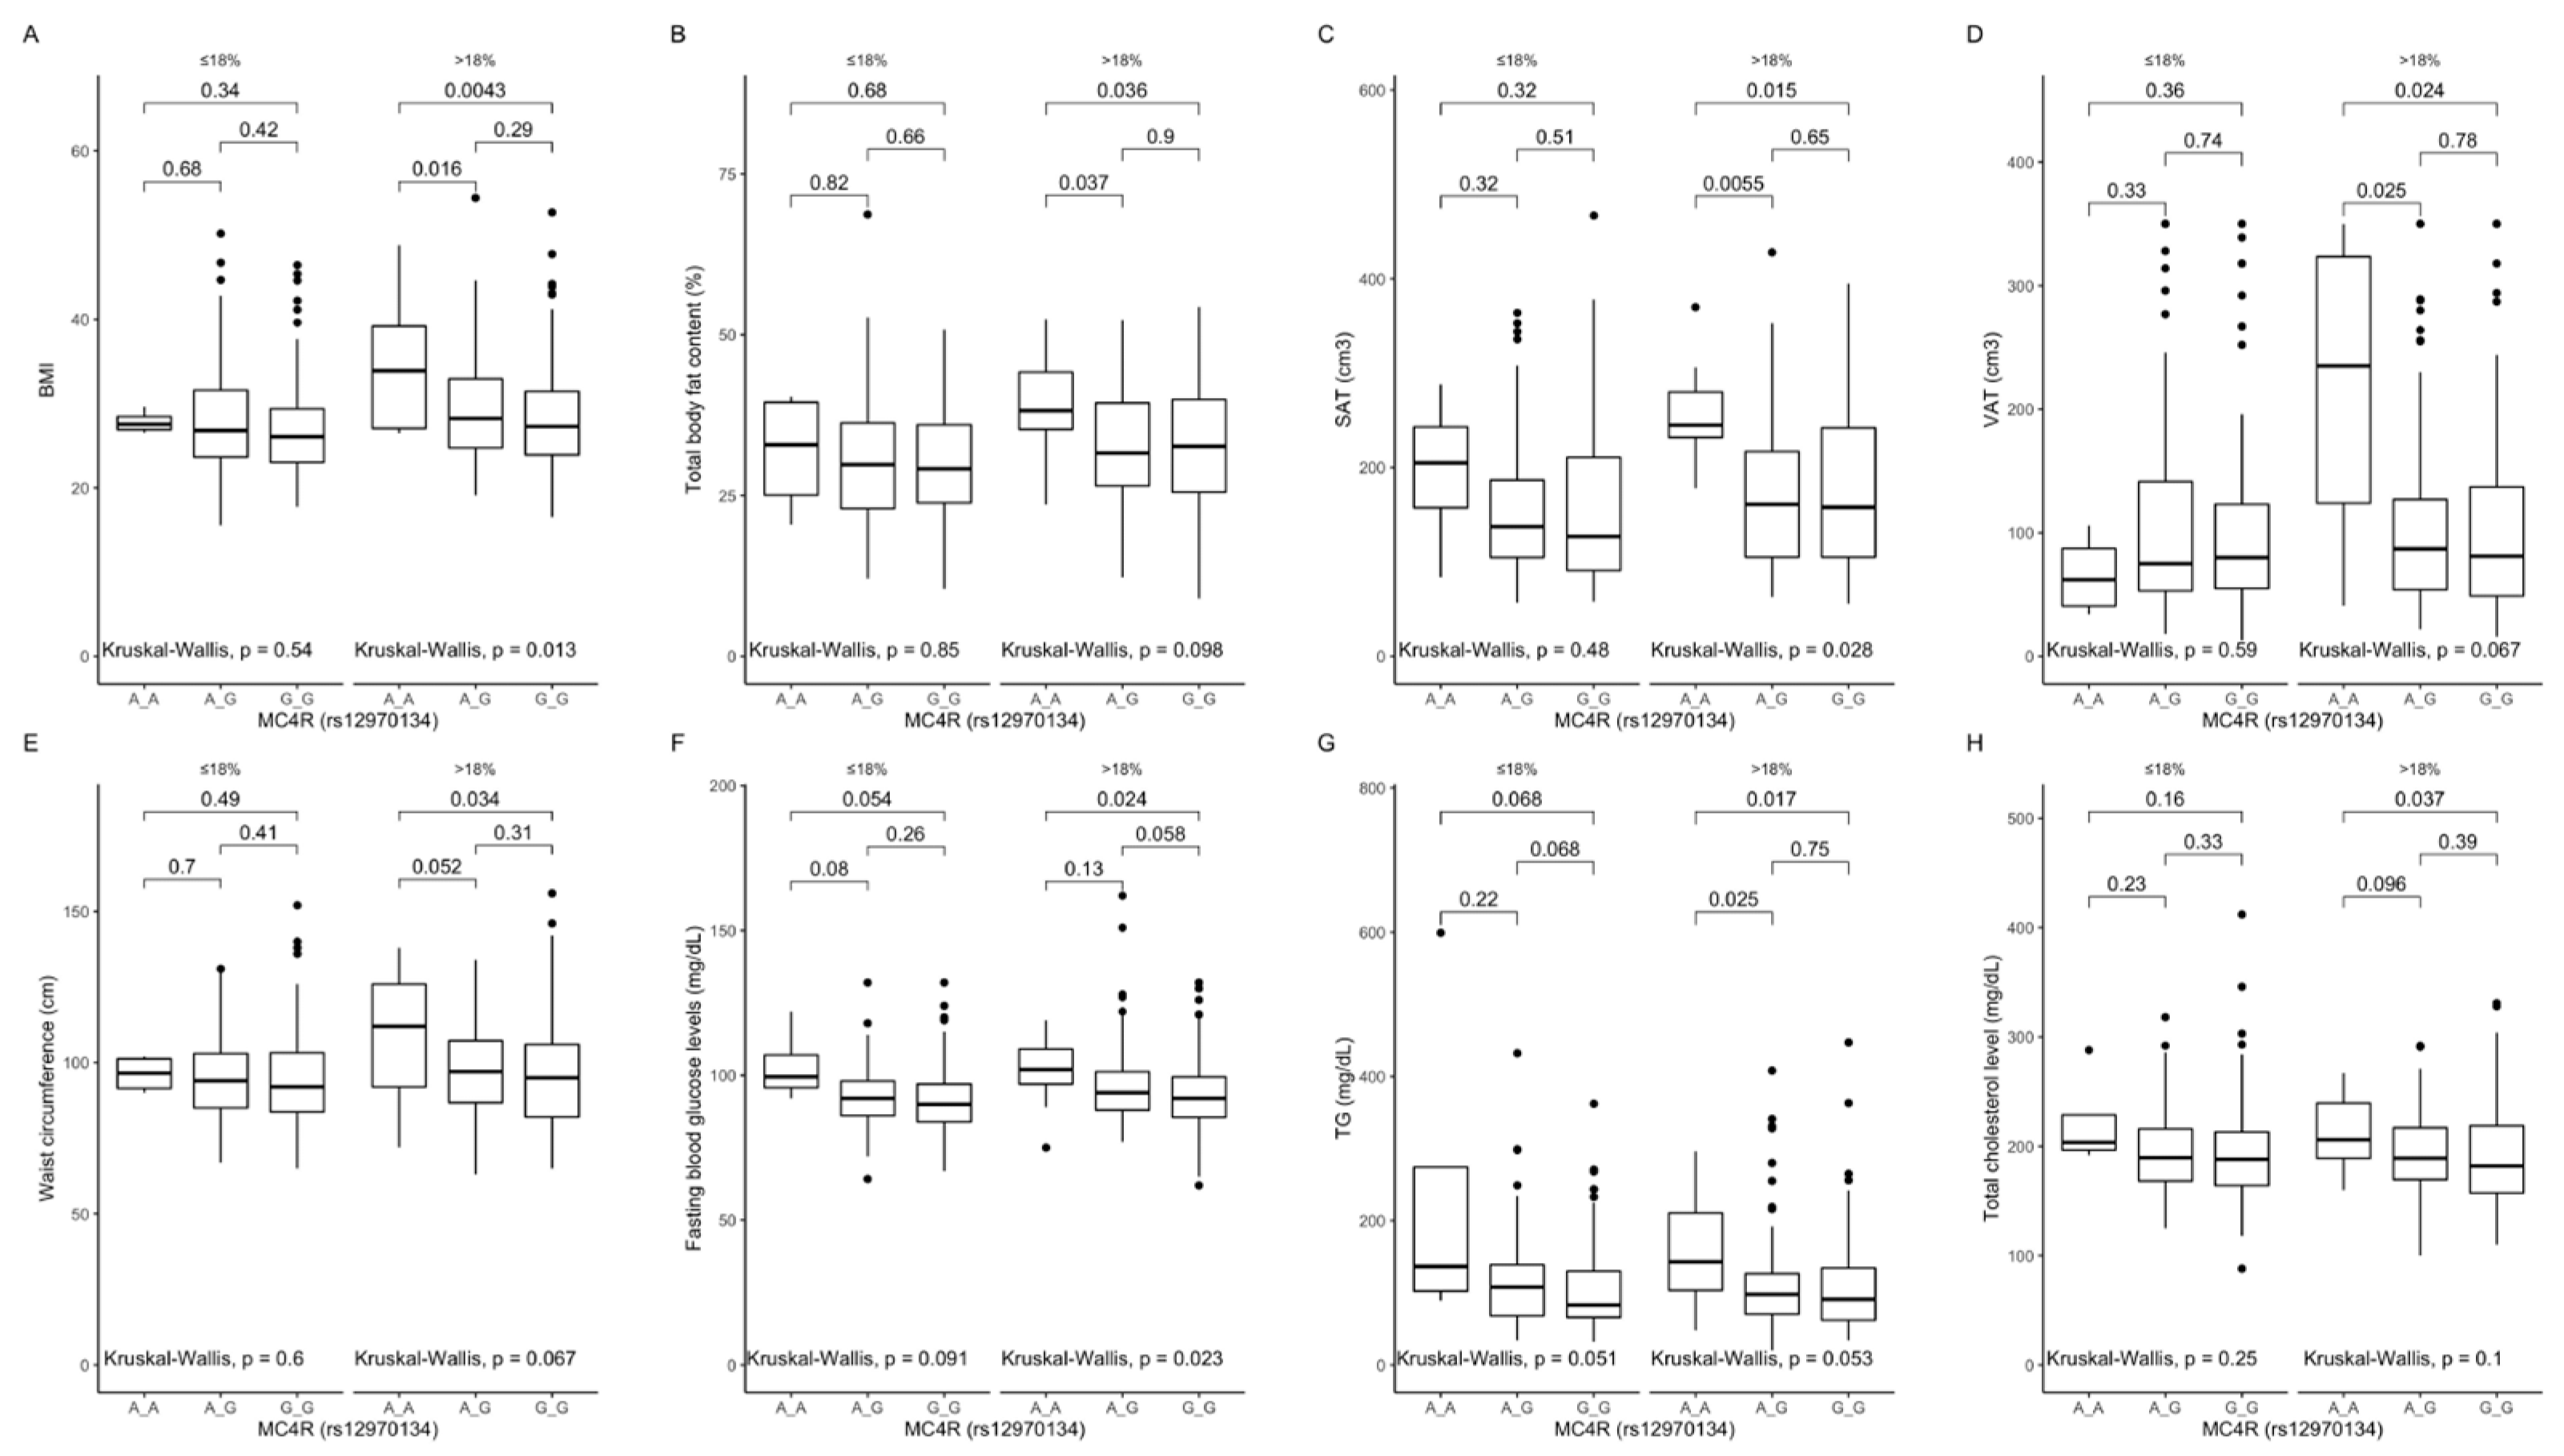
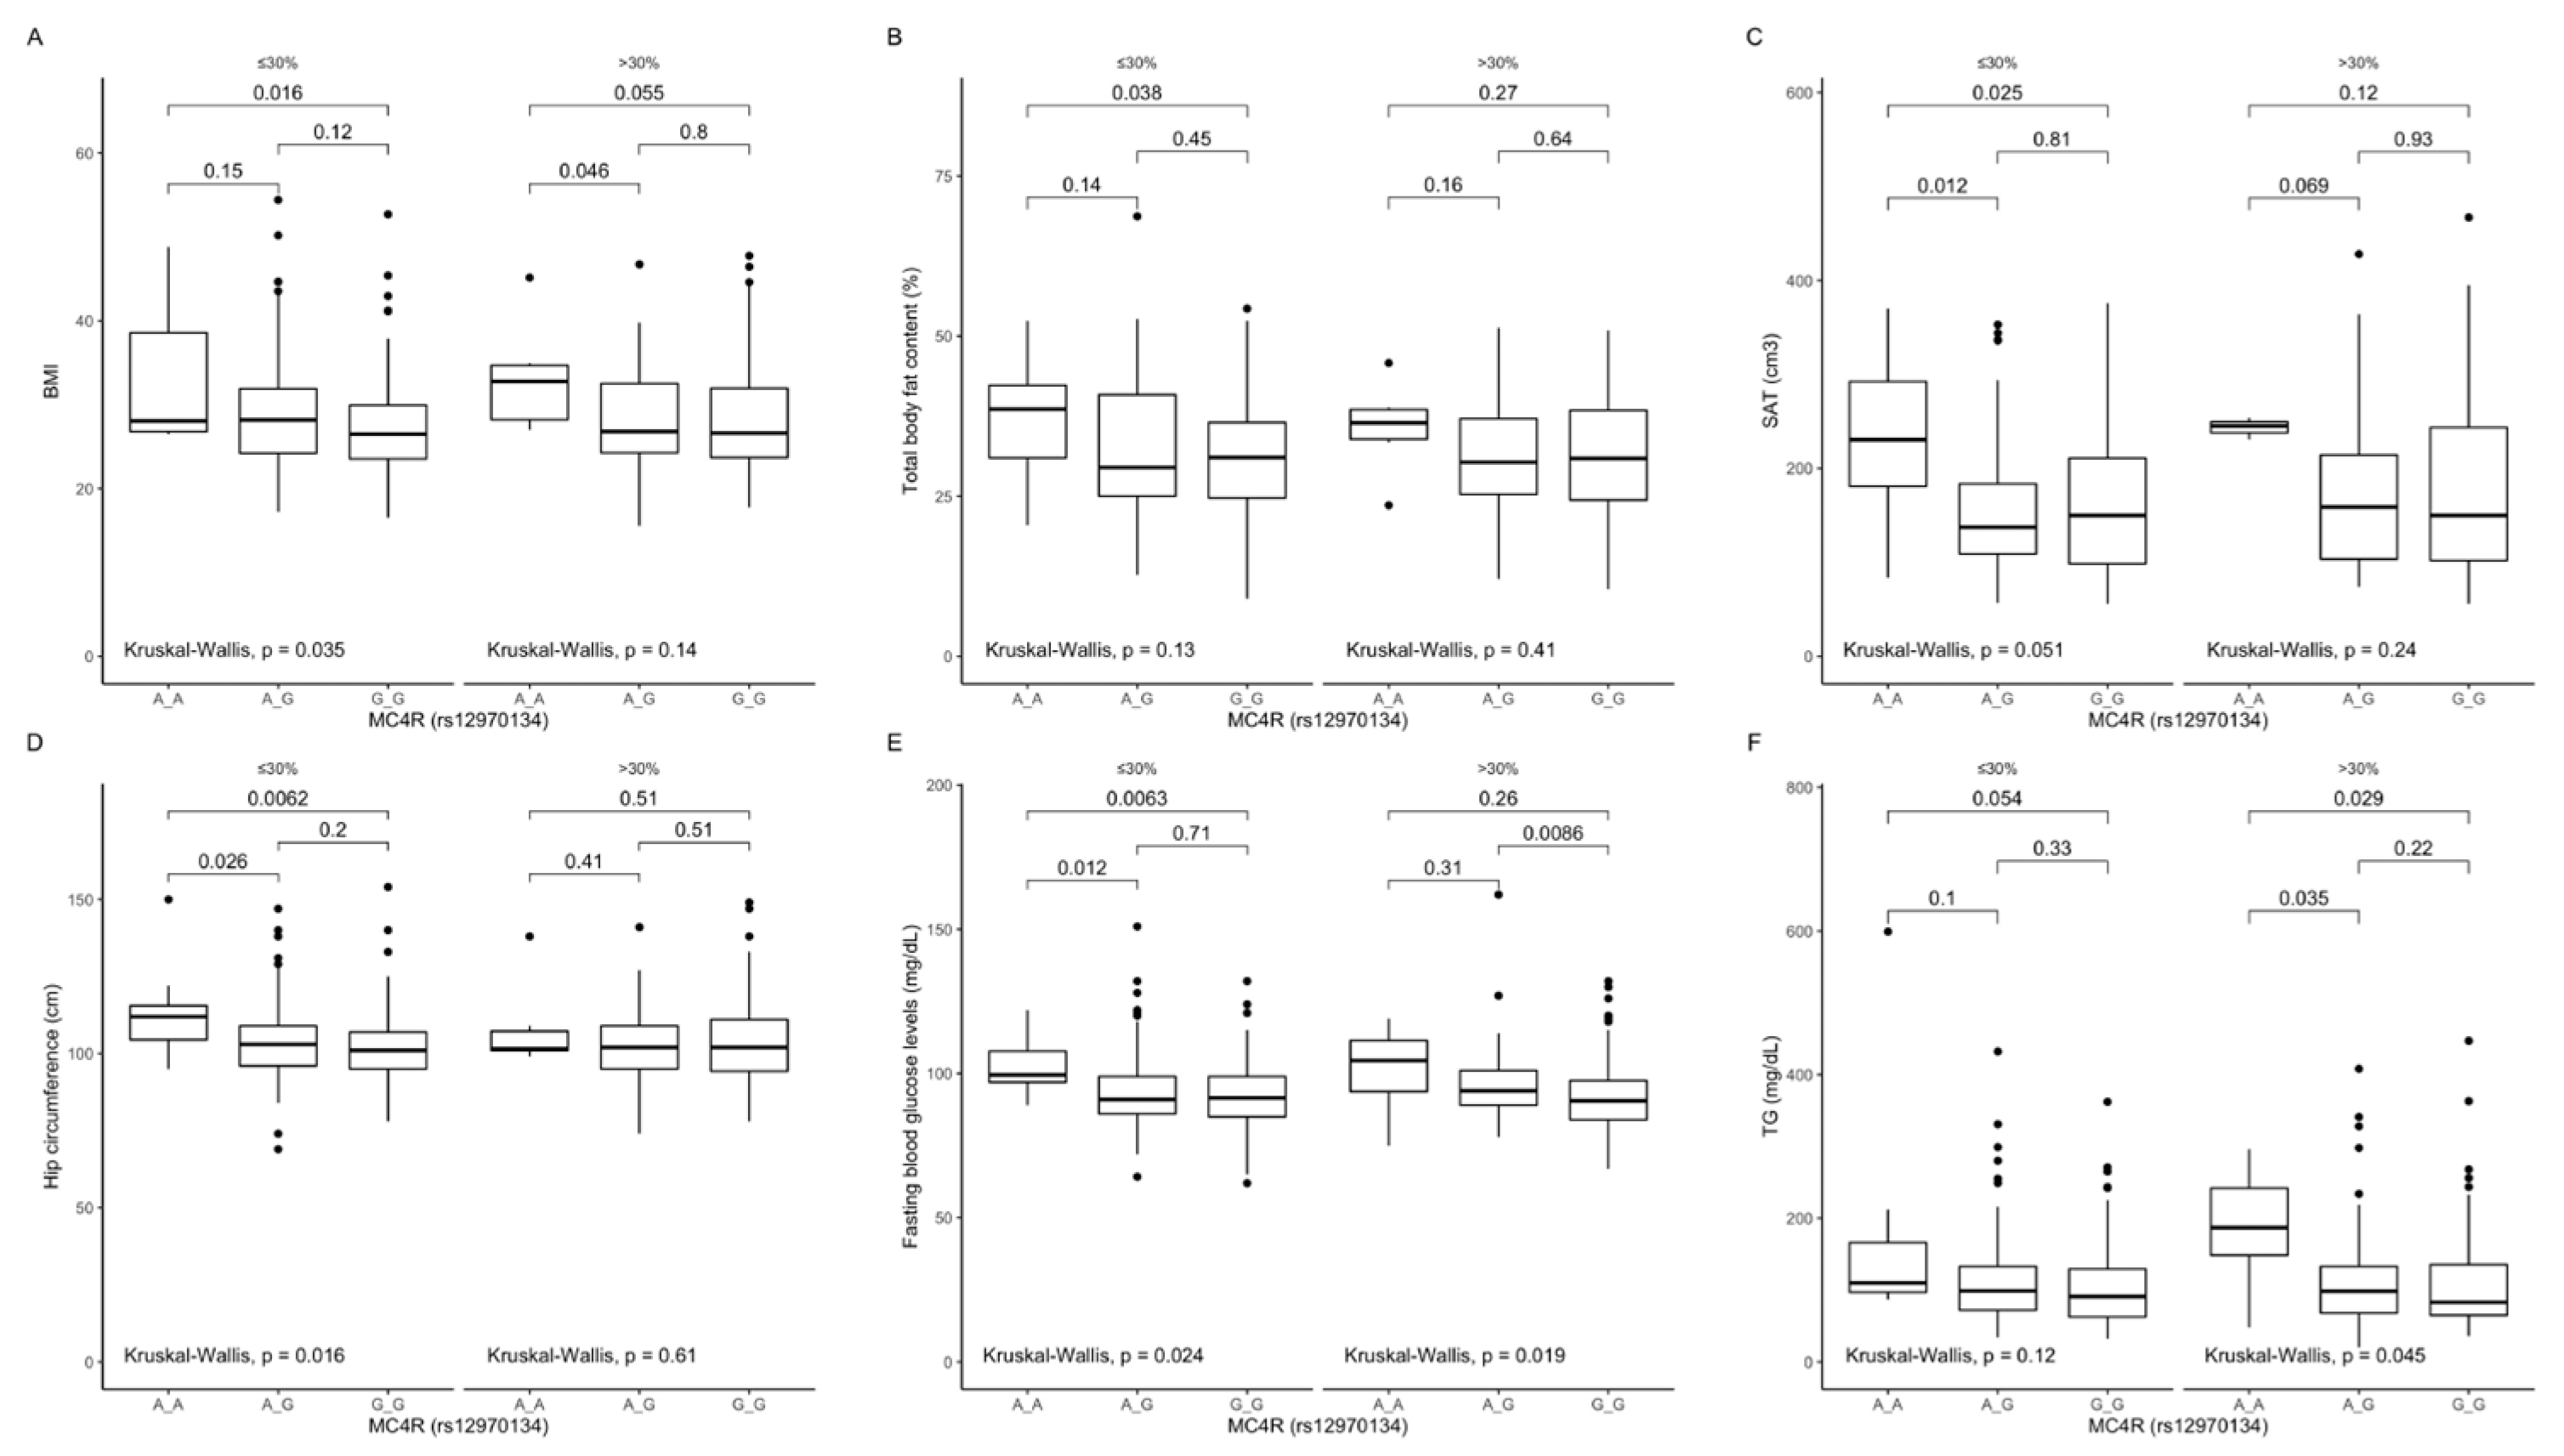
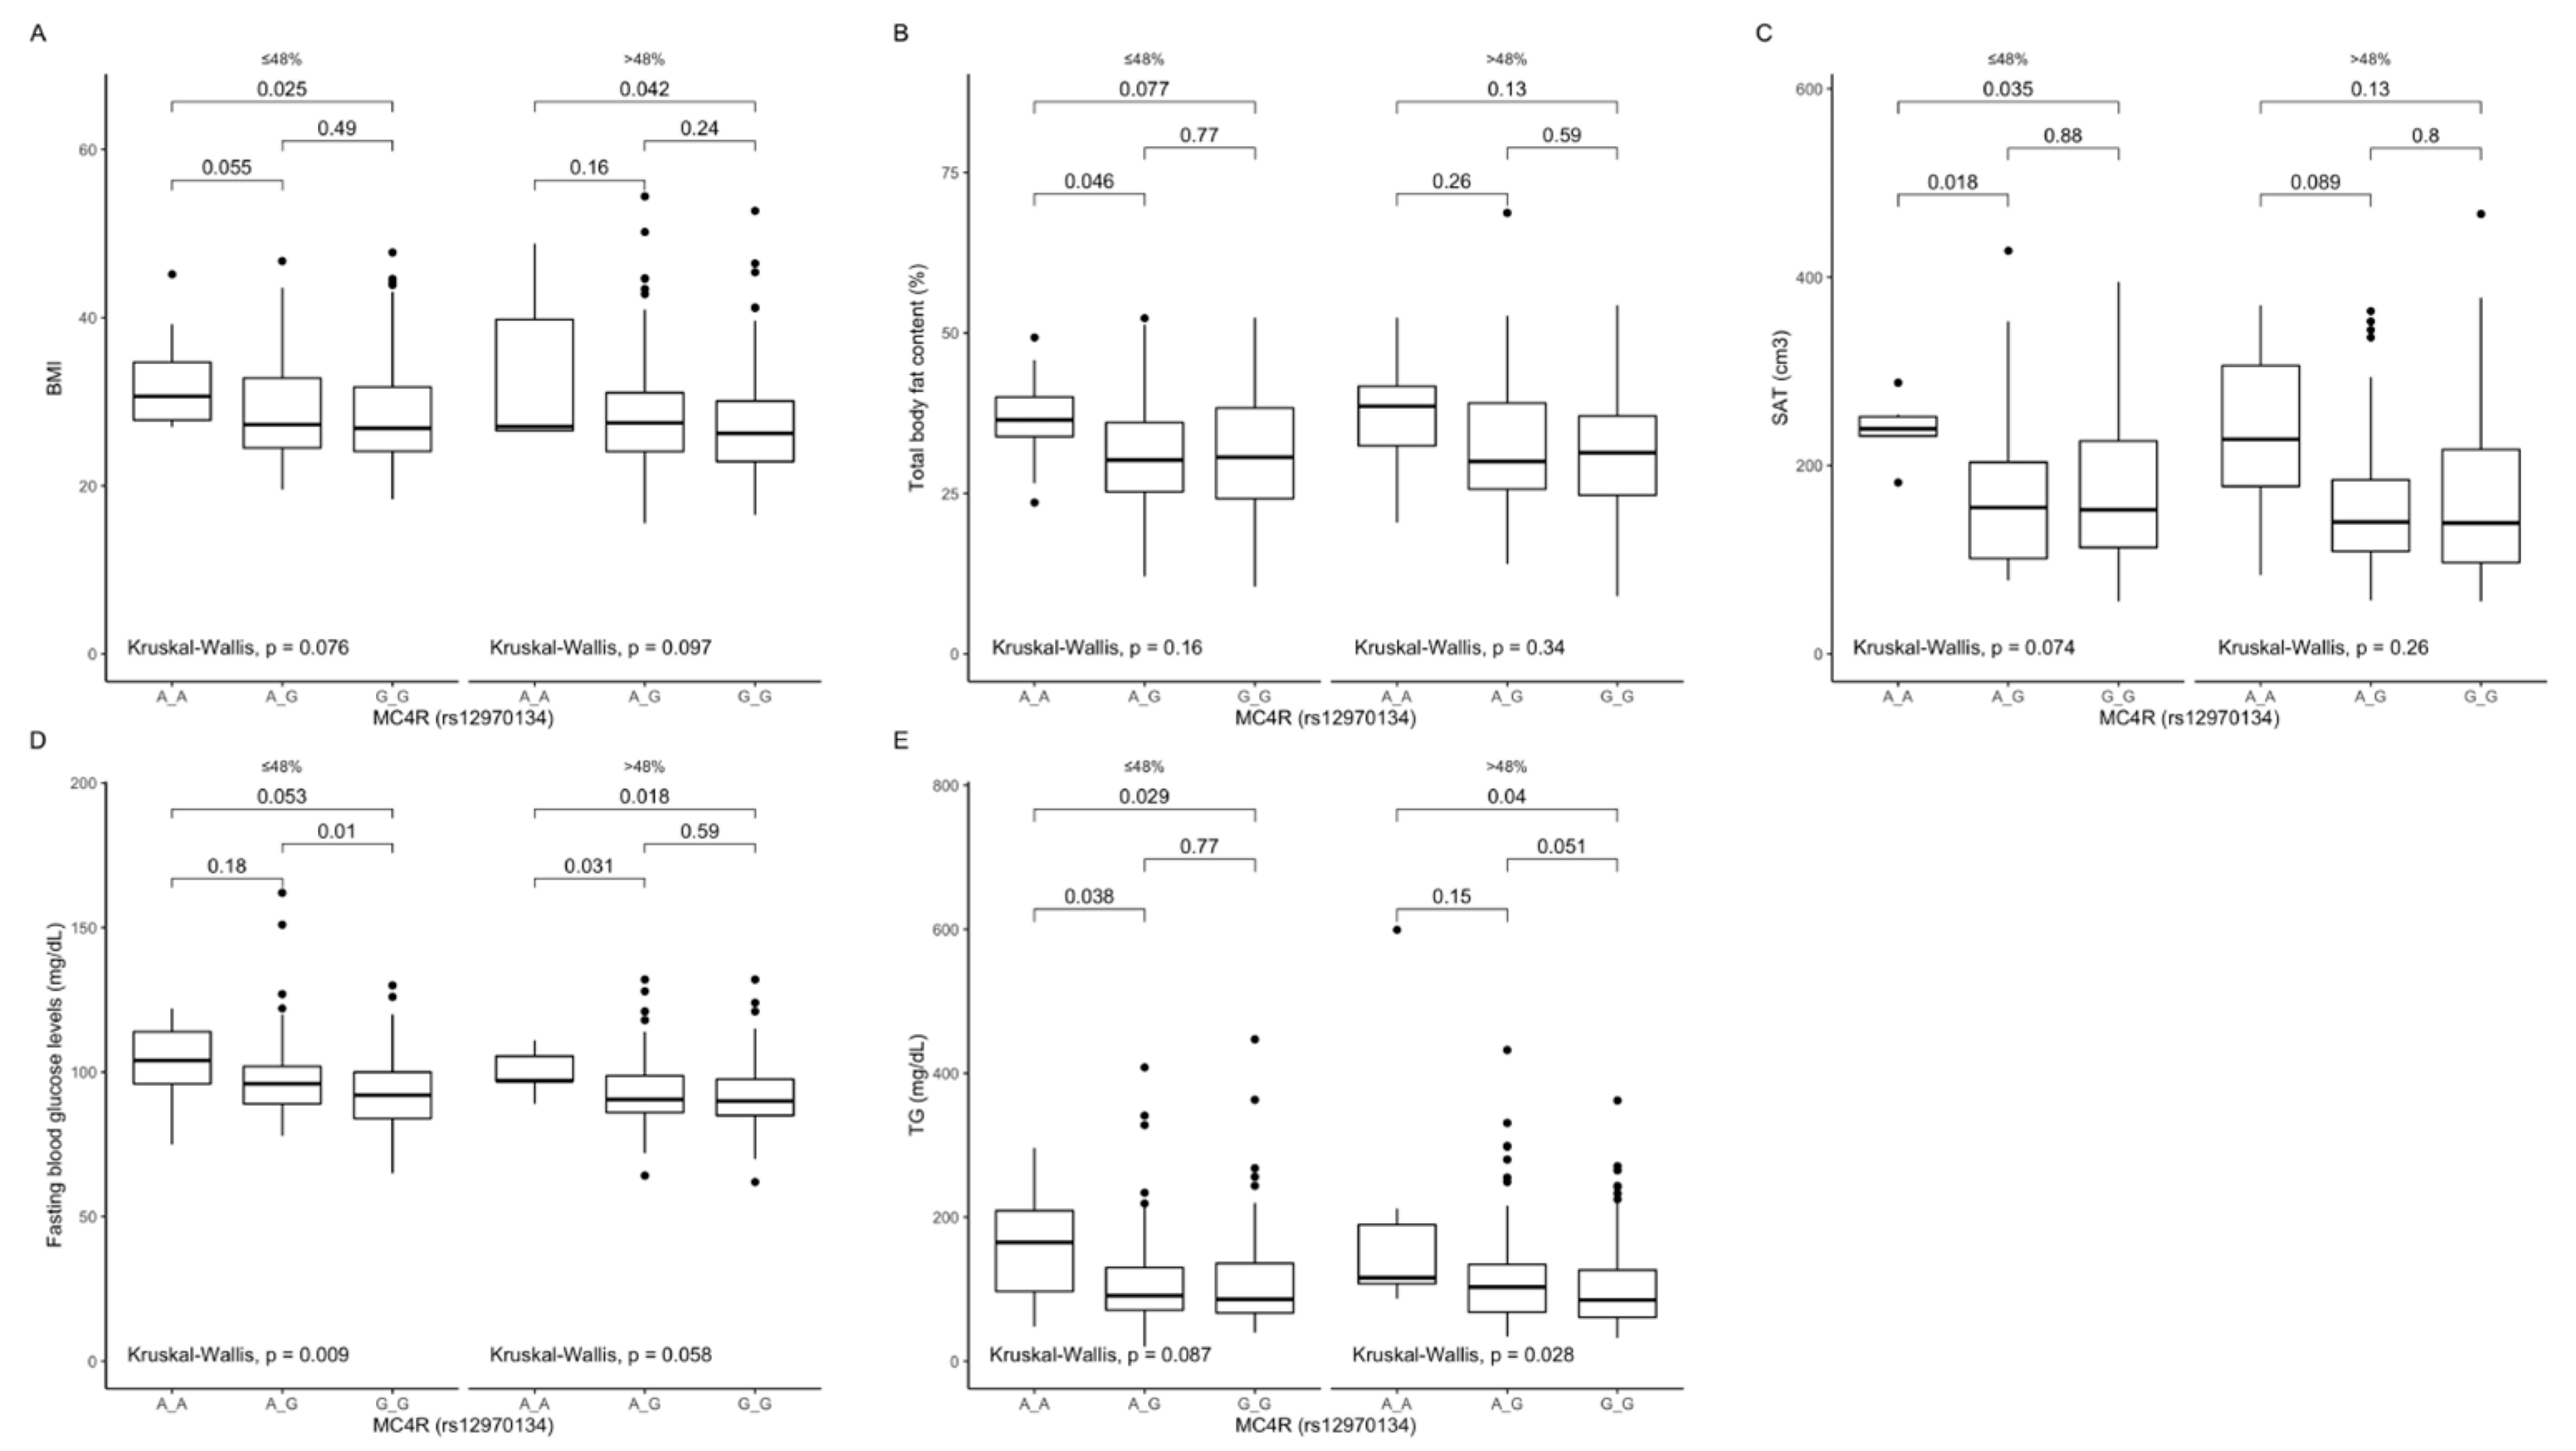
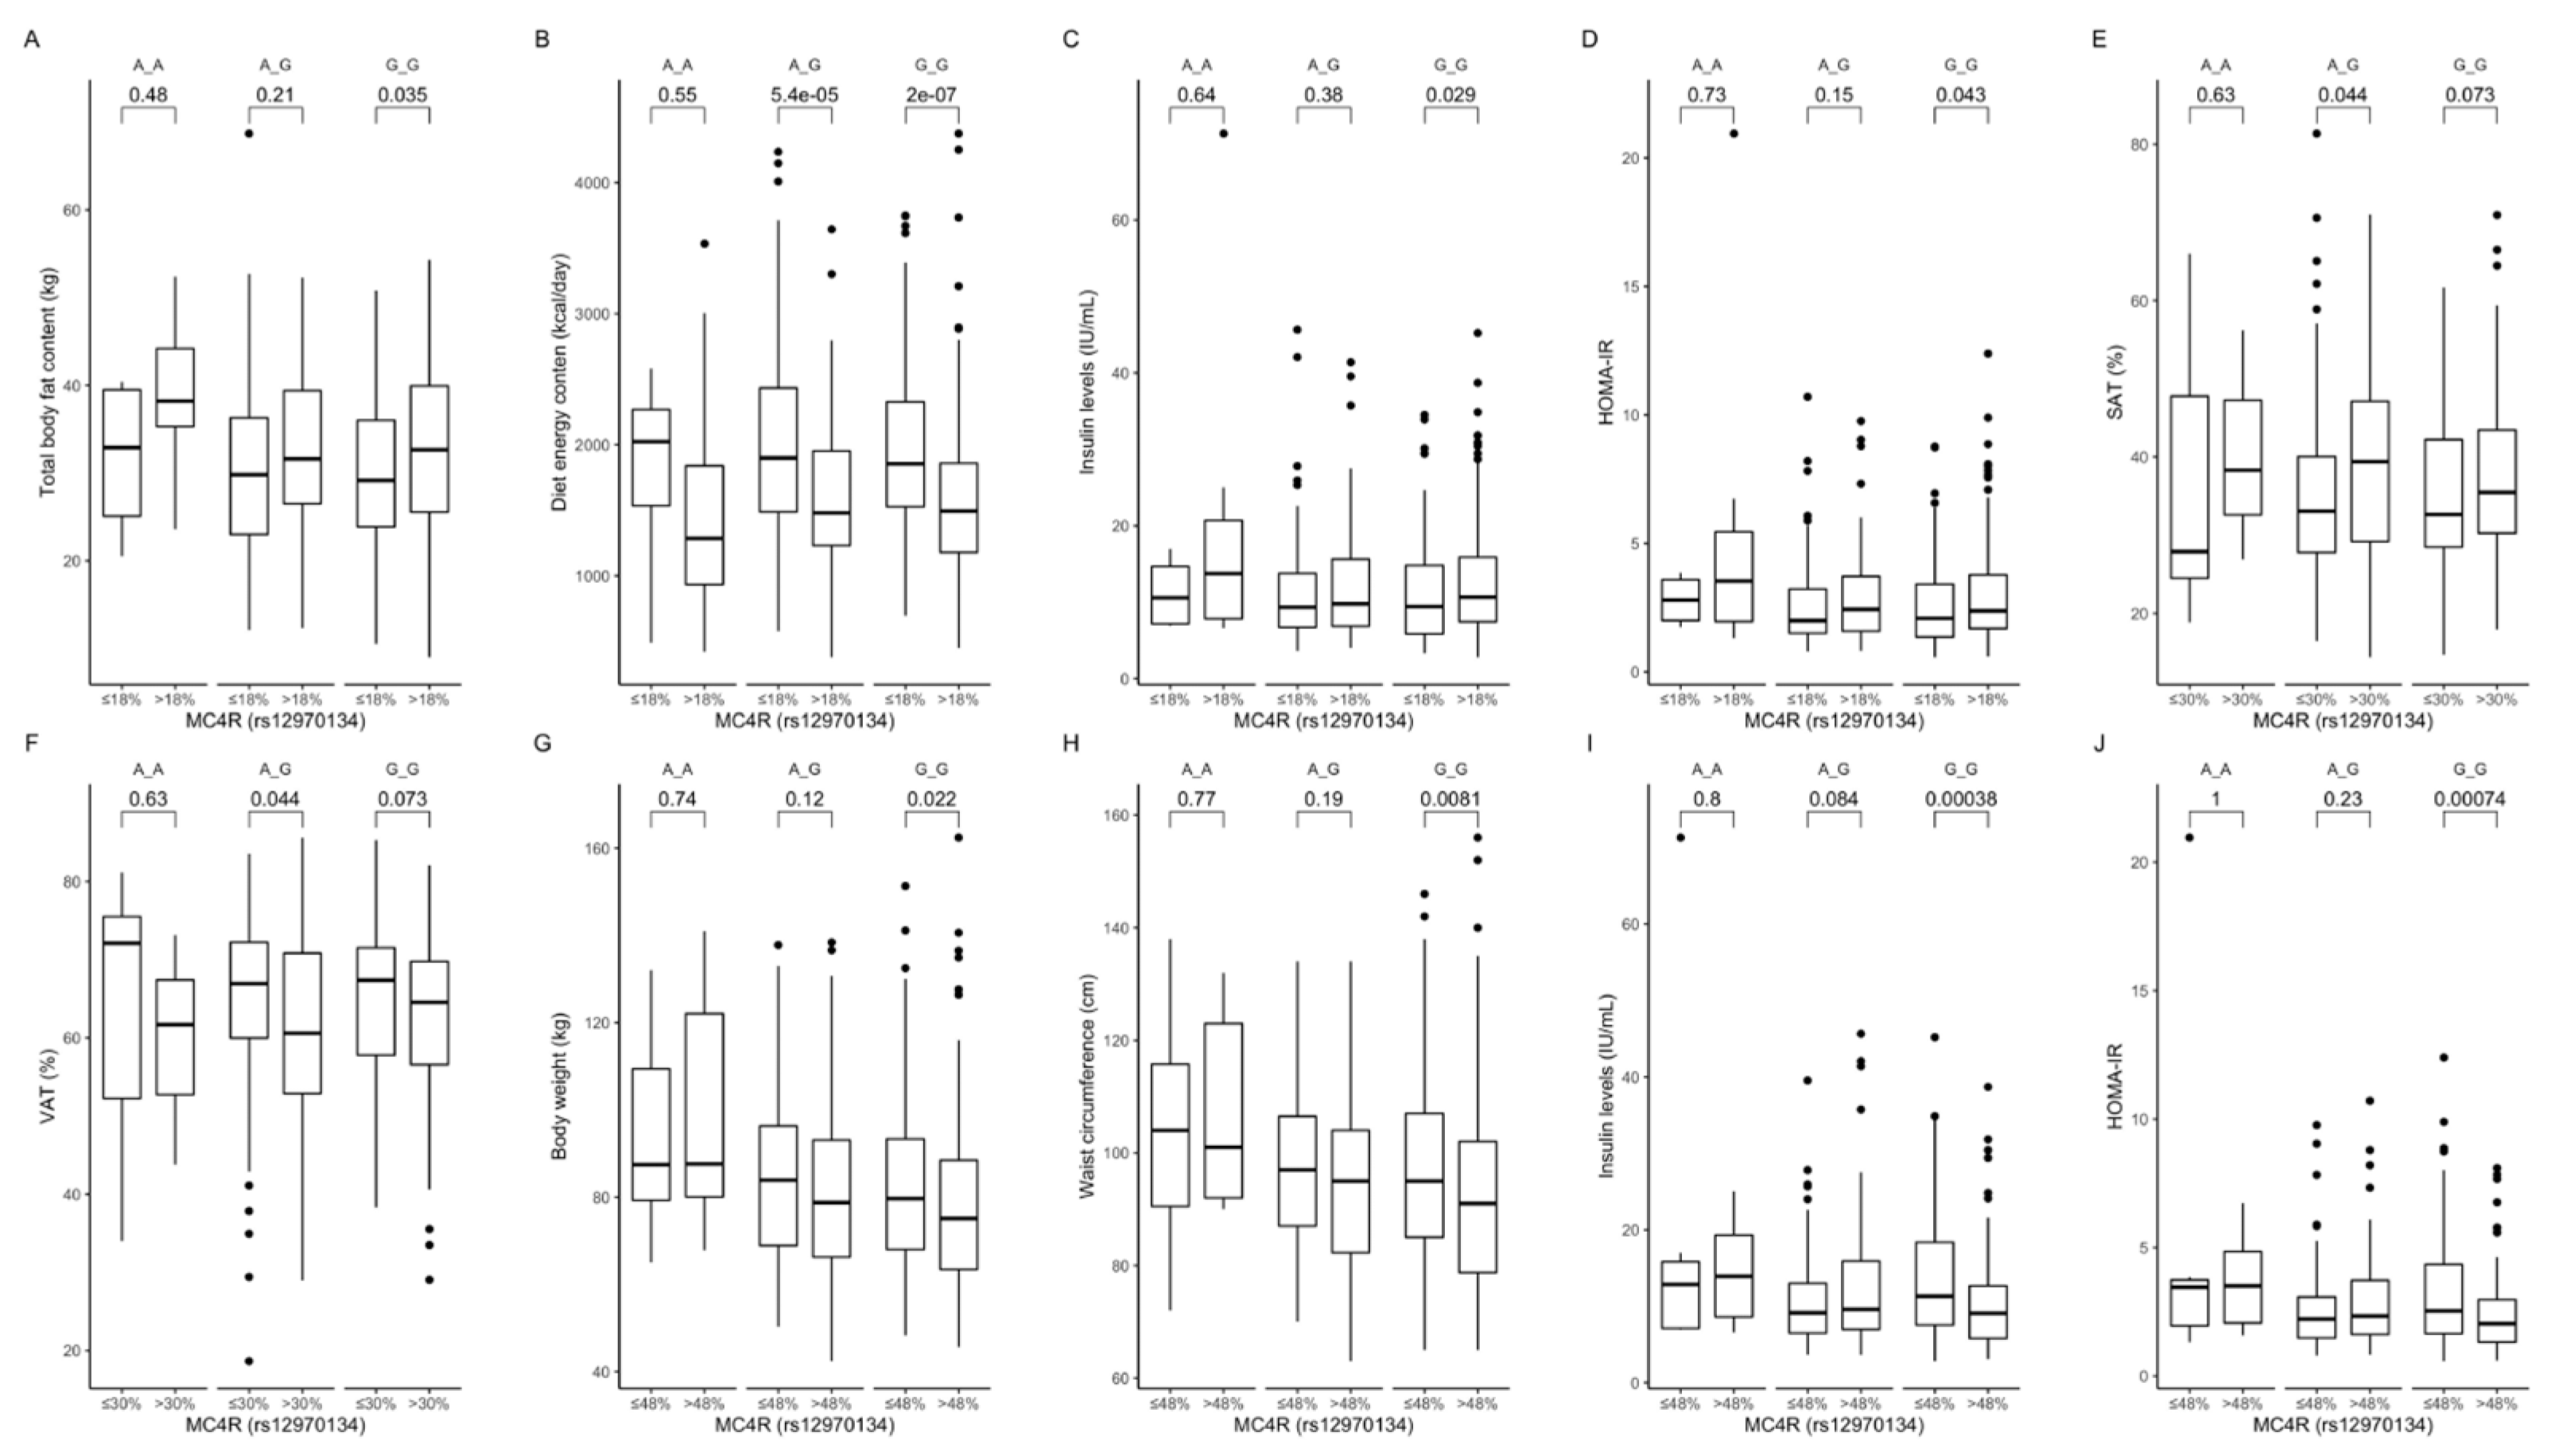
2.4. Associations between the rs12970134 Polymorphism and Obesity, Its Comorbidities, and Dietary Intake
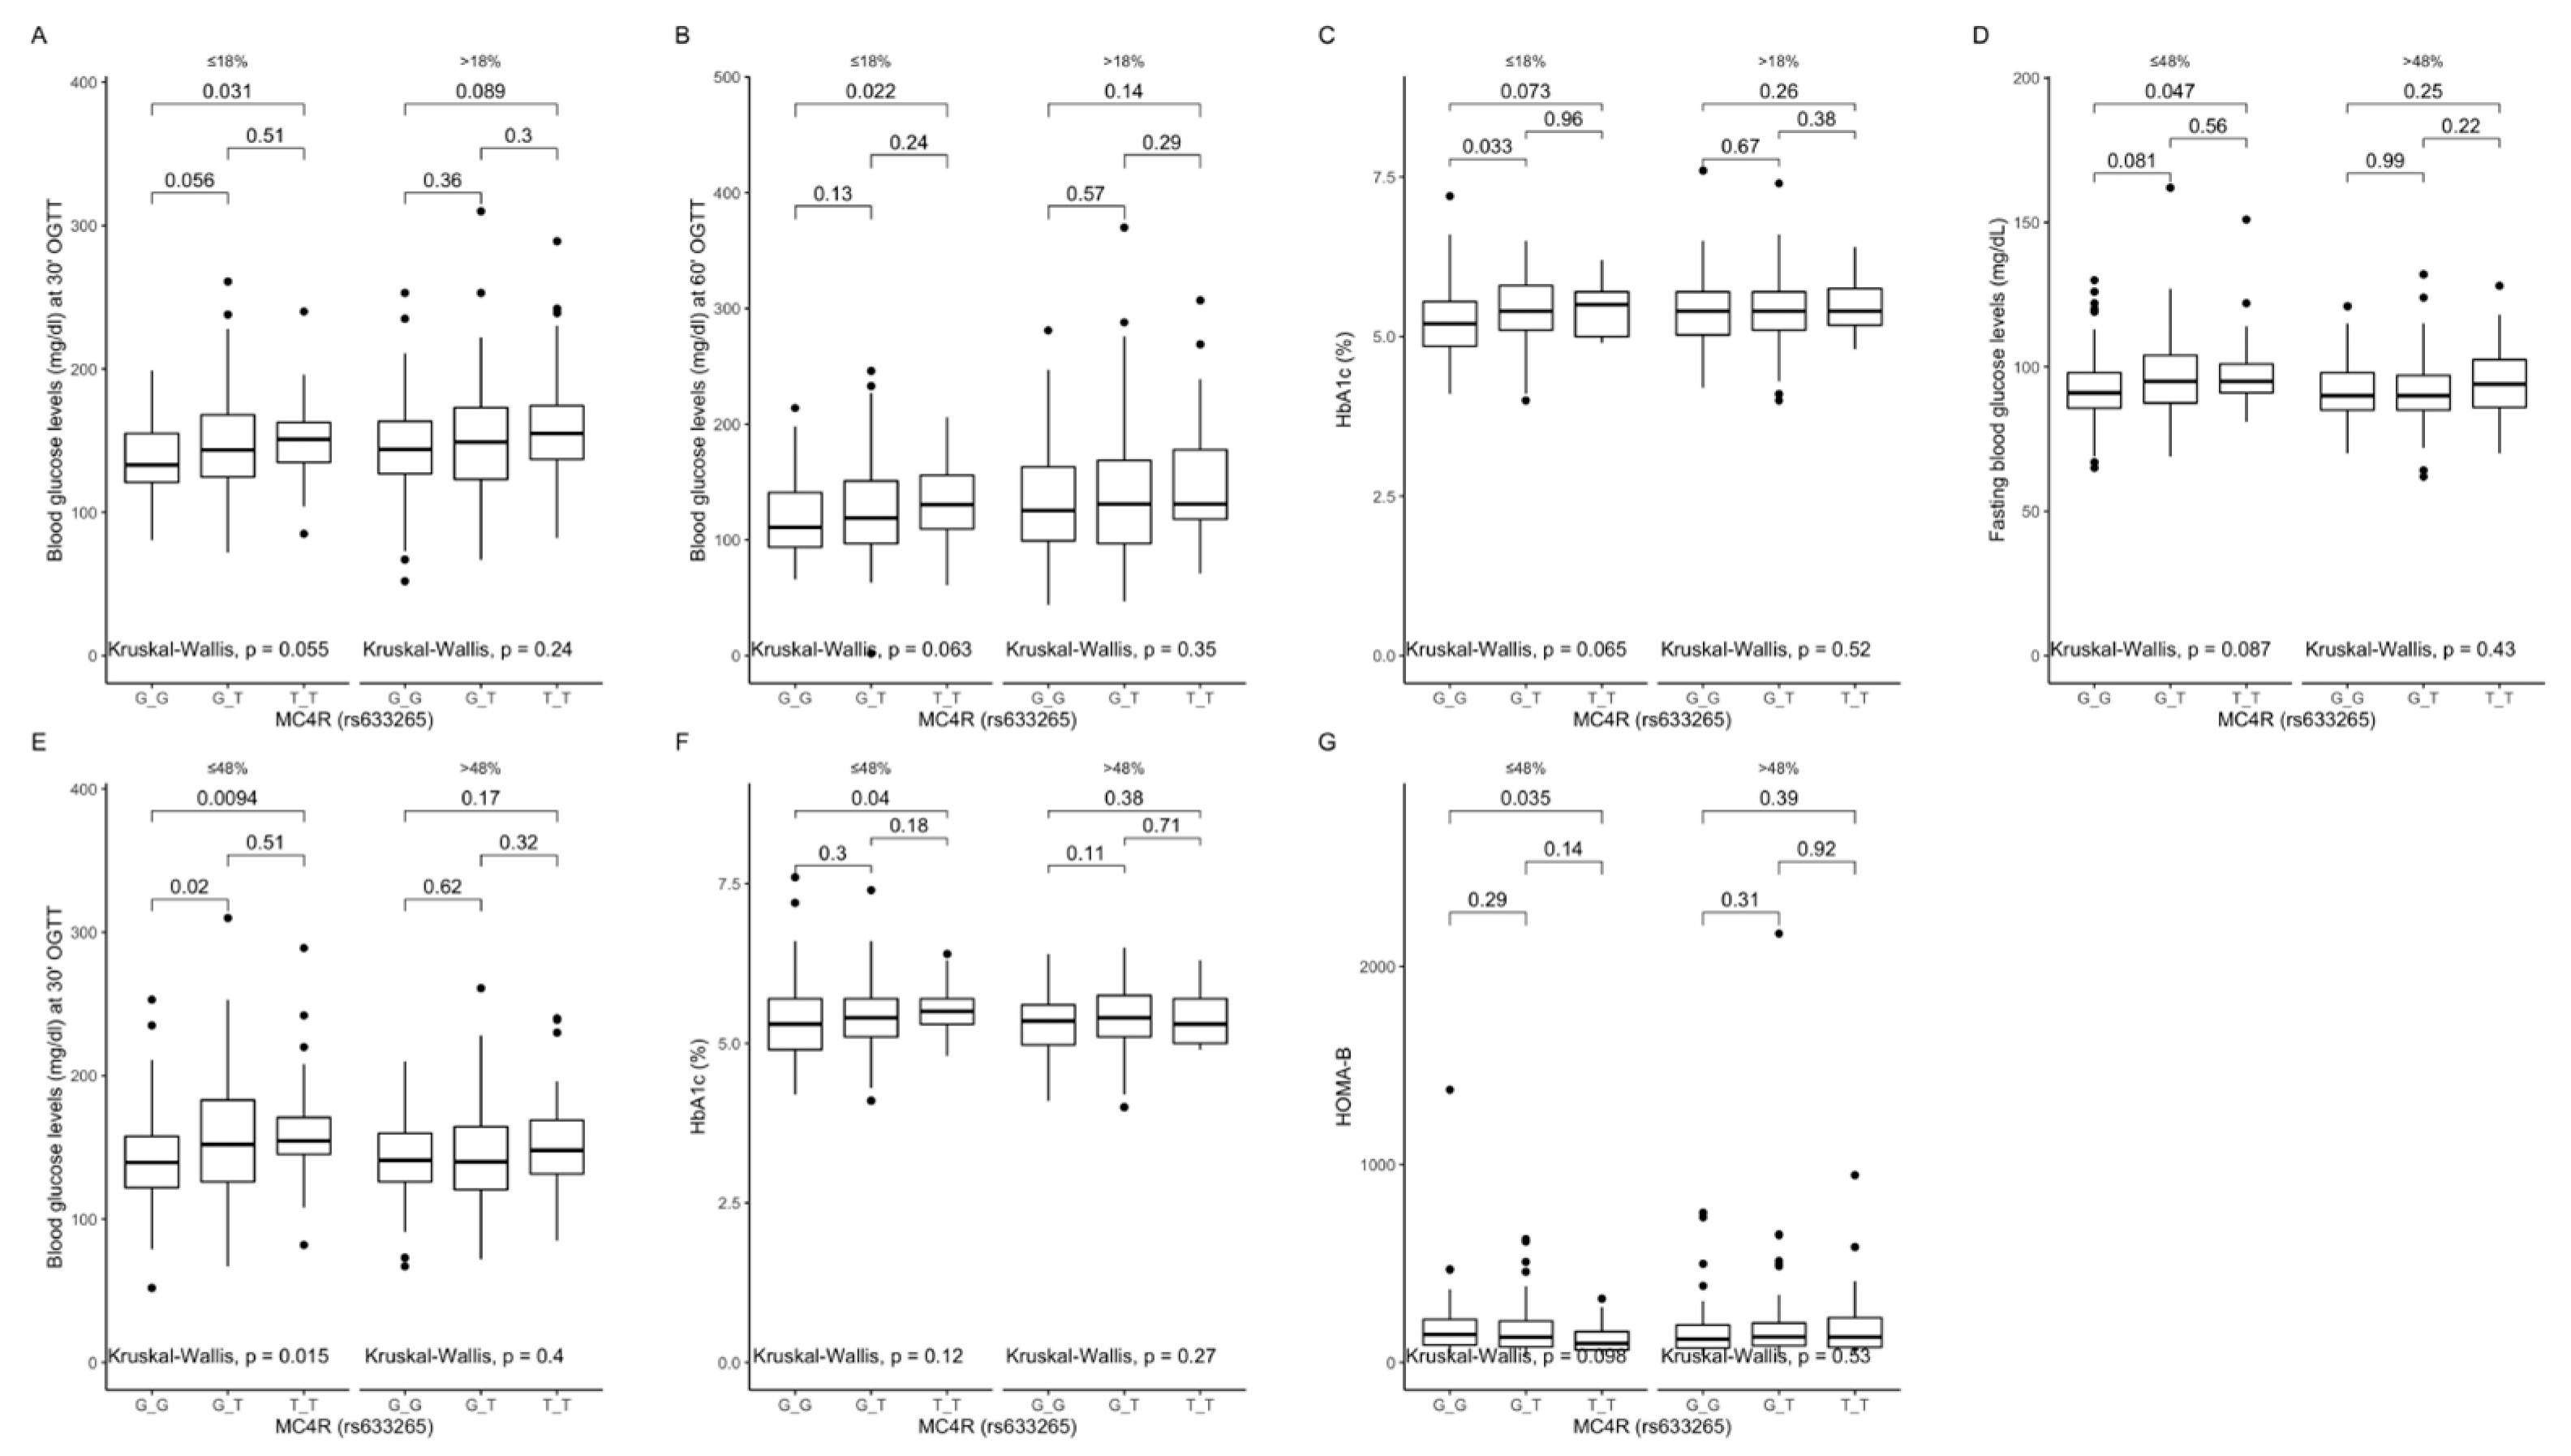
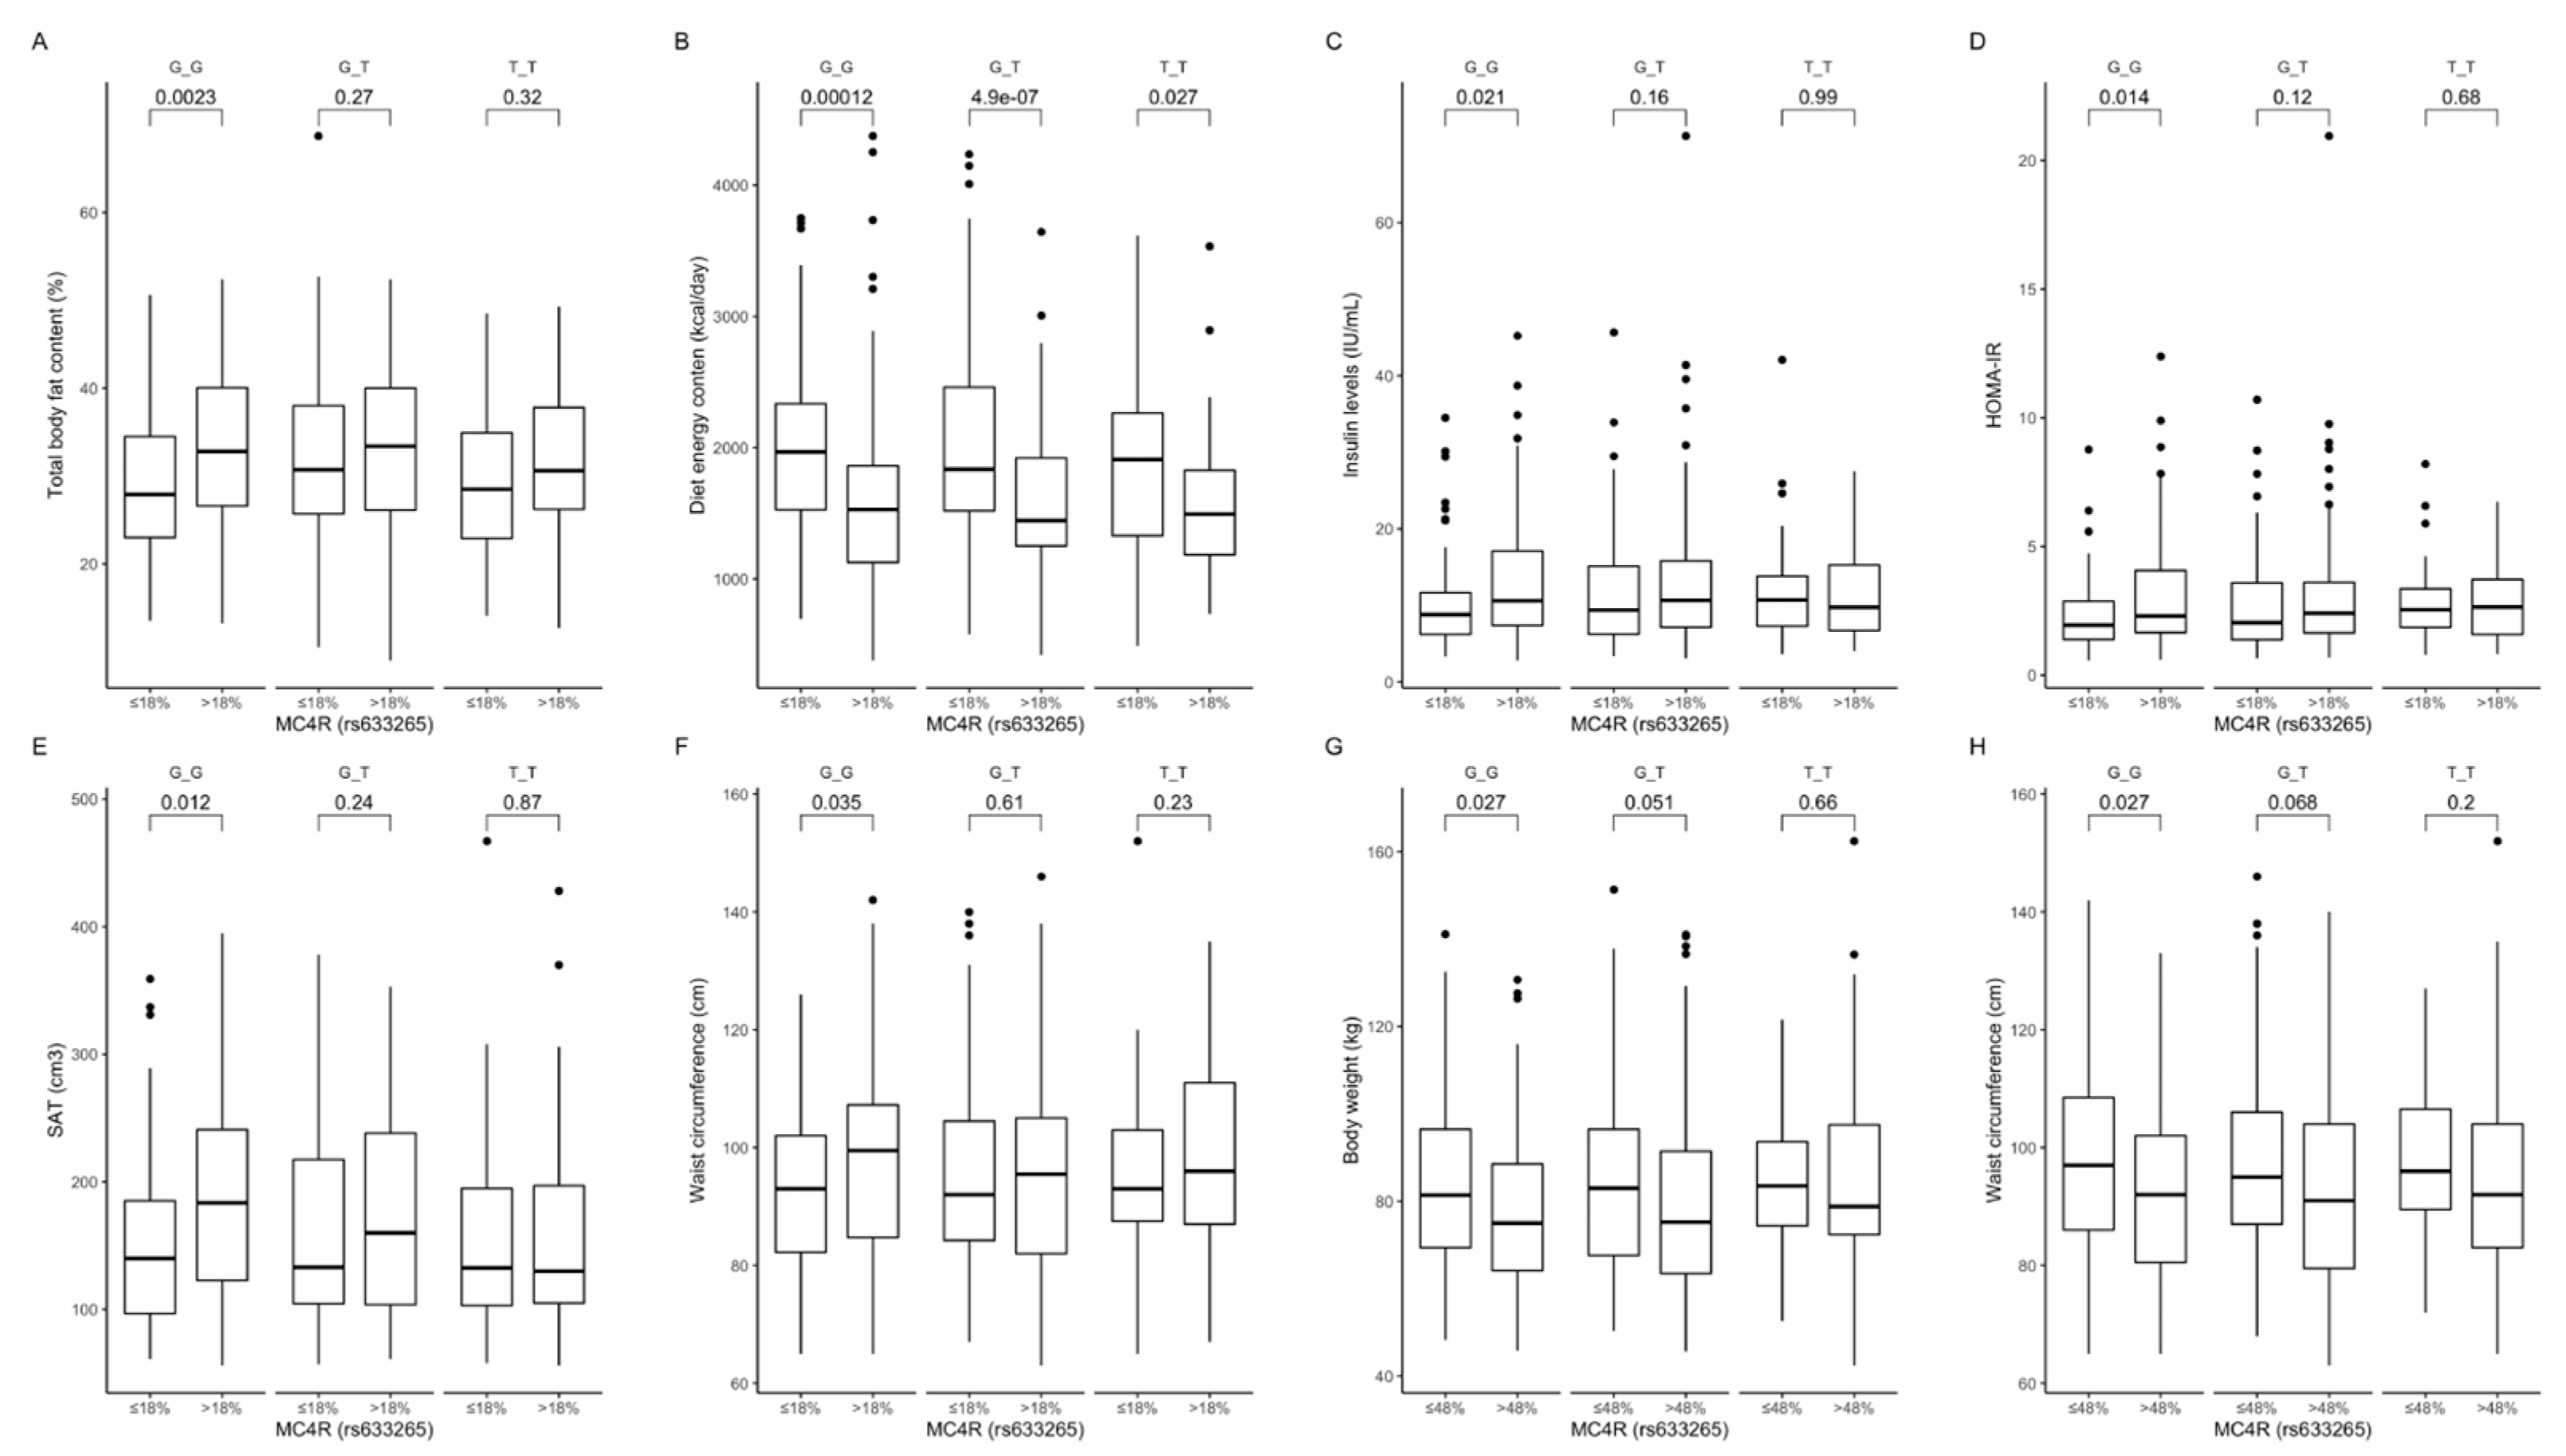
2.5. Associations between the rs633265 Polymorphism and Obesity, Its Comorbidities and Dietary Intake
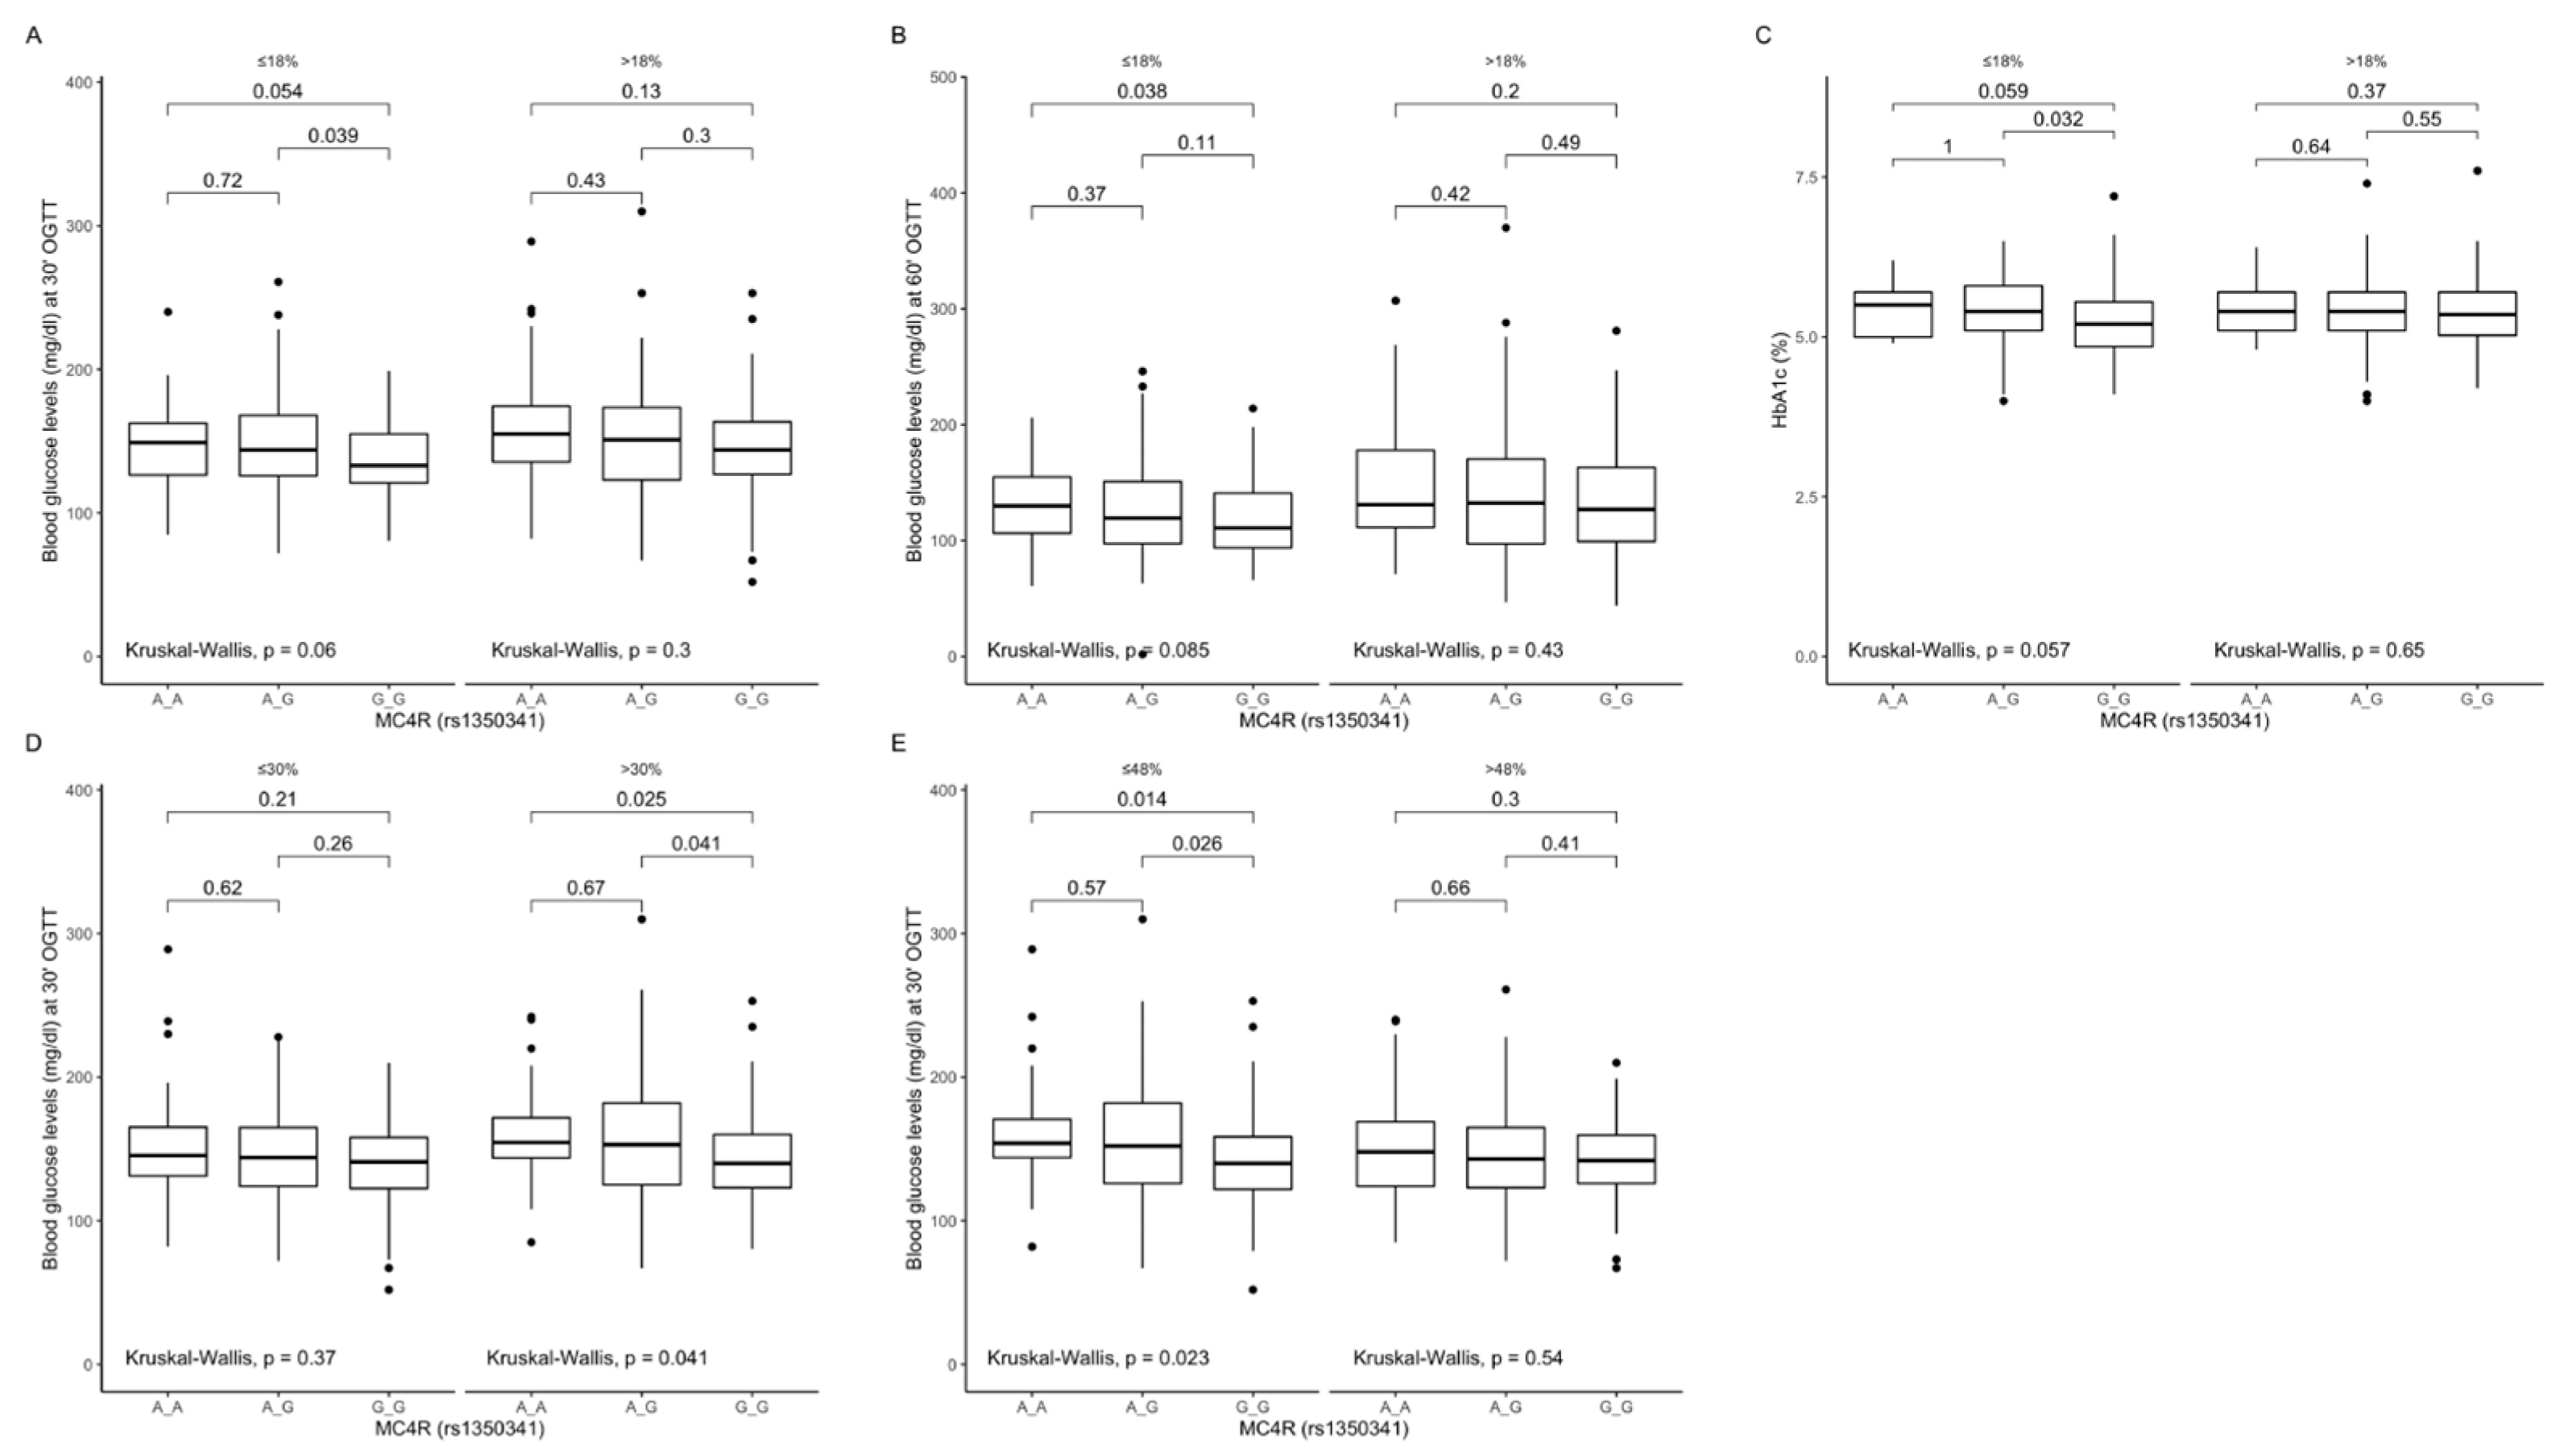
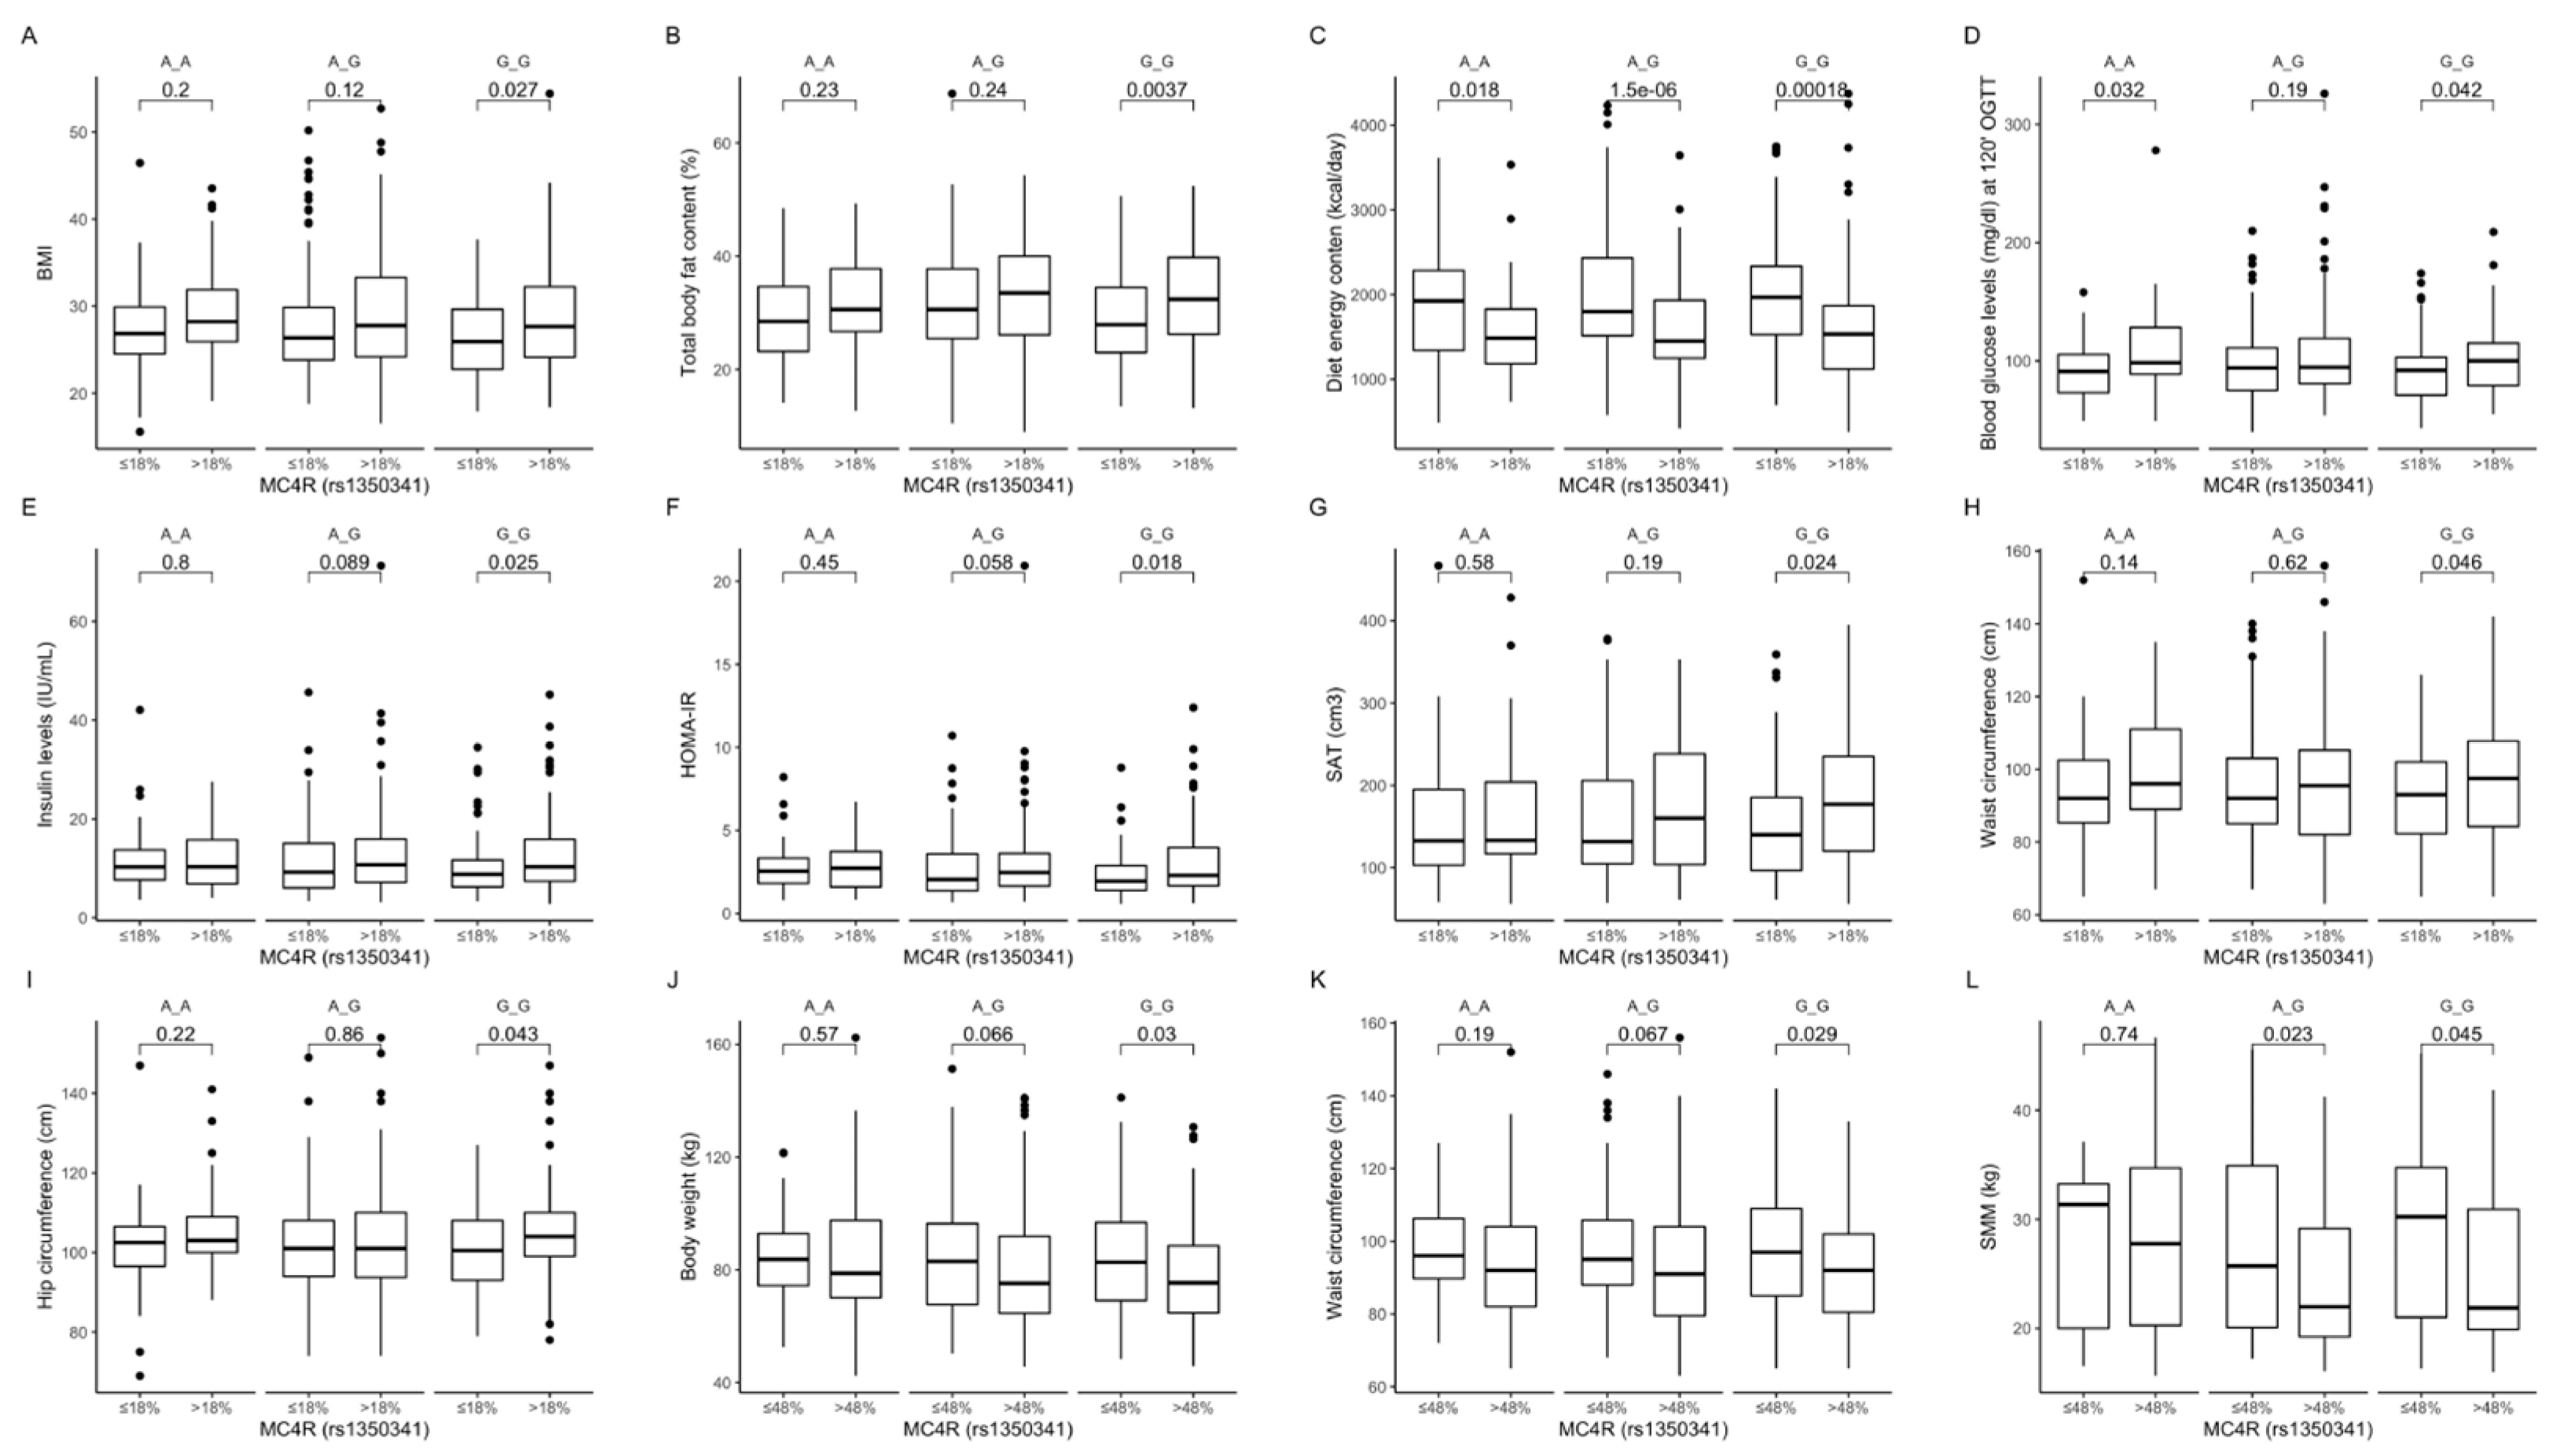
2.6. Association between the rs1350341 Polymorphism and Obesity, Its Comorbidities, and Dietary Intake
3. Discussion
4. Materials and Methods
4.1. The Aim and Study Design
4.2. Participants
4.3. Anthropometric Measurements and Body Composition Analysis
4.4. Oral Glucose Tolerance Test (OGTT) Performance
4.5. Blood Collections and Biochemical Analysis
4.6. Calculations
4.7. Daily Physical Activity and Dietary Intake Analyses
4.8. Study Group Stratification Dependently on the Daily Dietary Intake
4.9. Genetic Analysis
4.10. Ethics
4.11. Statistical Analysis
5. Conclusions
Supplementary Materials
Author Contributions
Funding
Institutional Review Board Statement
Informed Consent Statement
Data Availability Statement
Acknowledgments
Conflicts of Interest
Abbreviations
| T2DM | Type 2 Diabetes Mellitus |
| SNPs | single nucleotide polymorphisms |
| MC4R | melanocortin-4 receptors |
| VAT | visceral adipose tissue |
| SAT | subcutaneous adipose tissue |
| OGTT | Oral glucose tolerance test |
| WHO | World Health Organization |
| LDL | low-density lipoprotein |
| HDL | high-density lipoprotein |
| HPLC | high performance liquid chromatography |
| BMI | body mass index |
| WHR | waist–hip ratio |
| HOMA-IR | homeostatic model assessment of insulin resistance |
| HOMA-B | index for homeostatic model assessment of β-cell function |
| MET | metabolic equivalent |
| IPAQ-LF | International Physical Activity Questionnaire-Long Form |
| SD | standard deviation |
| ANOVA | analysis of variance |
| SMM | skeletal muscle mass |
| IR | insulin resistance |
References
- Al-Goblan, A.S.; Al-Alfi, M.A.; Khan, M.Z. Mechanism linking diabetes mellitus and obesity. Diabetes Metab. Syndr. Obes. 2014, 7, 587–591. [Google Scholar] [CrossRef]
- Canto, E.D.; Ceriello, A.; Rydén, L.; Ferrini, M.; Hansen, T.B.; Schnell, O.; Standl, E.; Beulens, J.W. Diabetes as a cardiovascular risk factor: An overview of global trends of macro and micro vascular complications. Eur. J. Prev. Cardiol. 2019, 26, 25–32. [Google Scholar] [CrossRef] [PubMed]
- Jaacks, L.M.; Vandevijvere, S.; Pan, A.; McGowan, C.; Wallace, C.; Imamura, F.; Mozaffarian, D.; Swinburn, B.; Ezzati, M. The obesity transition: Stages of the global epidemic. Lancet Diabetes Endocrinol. 2019, 7, 231–240. [Google Scholar] [CrossRef]
- Saeedi, P.; Petersohn, I.; Salpea, P.; Malanda, B.; Karuranga, S.; Unwin, N.; Colagiuri, S.; Guariguata, L.; Motala, A.A.; Ogurtsova, K.; et al. Global and regional diabetes prevalence estimates for 2019 and projections for 2030 and 2045: Results from the International Diabetes Federation Diabetes Atlas, 9th edition. Diabetes Res. Clin. Pract. 2019, 157, 107843. [Google Scholar] [CrossRef] [PubMed]
- Barness, L.A.; Opitz, J.M.; Gilbert-Barness, E. Obesity: Genetic, molecular, and environmental aspects. Am. J. Med Genet. Part A 2007, 143A, 3016–3034. [Google Scholar] [CrossRef] [PubMed]
- Loos, R. Genetic determinants of common obesity and their value in prediction. Best Pr. Res. Clin. Endocrinol. Metab. 2012, 26, 211–226. [Google Scholar] [CrossRef]
- Fawcett, K.A.; Barroso, I. The genetics of obesity: FTO leads the way. Trends Genet. 2010, 26, 266–274. [Google Scholar] [CrossRef] [PubMed]
- Adan, R.A.H.; Tiesjema, B.; Hillebrand, J.J.G.; La Fleur, S.E.; Kas, M.; De Krom, M. The MC4 receptor and control of appetite. Br. J. Pharmacol. 2006, 149, 815–827. [Google Scholar] [CrossRef] [PubMed]
- Mansoori, A.; Amini, M.; Kolahdooz, F.; Seyedrezazadeh, E. Obesity and Pro12Ala Polymorphism of Peroxisome Proliferator-Activated Receptor-Gamma Gene in Healthy Adults: A Systematic Review and Meta-Analysis. Ann. Nutr. Metab. 2015, 67, 104–118. [Google Scholar] [CrossRef] [PubMed]
- Rohde, K.; Keller, M.; La Cour Poulsen, L.; Blüher, M.; Kovacs, P.; Böttcher, Y. Genetics and epigenetics in obesity. Metabolism 2019, 92, 37–50. [Google Scholar] [CrossRef] [PubMed]
- McCaffery, J.M.; Papandonatos, G.D.; Peter, I.; Huggins, G.S.; Raynor, H.; Delahanty, L.M.; Cheskin, L.J.; Balasubramanyam, A.; E Wagenknecht, L.; Wing, R.R.; et al. Obesity susceptibility loci and dietary intake in the Look AHEAD Trial. Am. J. Clin. Nutr. 2012, 95, 1477–1486. [Google Scholar] [CrossRef]
- Wardle, J.; Carnell, S.; Haworth, C.M.; Farooqi, I.S.; O’Rahilly, S.; Plomin, R. Obesity associated genetic variation in FTO is associated with diminished satiety. J. Clin. Endocrinol. Metab. 2008, 93, 3640–3643. [Google Scholar] [CrossRef]
- Goran, M.I. Genetic influences on human energy expenditure and substrate utilization. Behav. Genet. 1997, 27, 389–399. [Google Scholar] [CrossRef] [PubMed]
- Adamska, E.; Kretowski, A.; Goscik, J.; Citko, A.; Bauer, W.; Waszczeniuk, M.; Maliszewska, K.; Paczkowska-Abdulsalam, M.; Niemira, M.; Szczerbinski, L.; et al. The type 2 diabetes susceptibility TCF7L2 gene variants affect postprandial glucose and fat utilization in non-diabetic subjects. Diabetes Metab. 2018, 44, 379–382. [Google Scholar] [CrossRef]
- Bienertová-Vasků, J.; Bienert, P.; Forejt, M.; Tomandl, J.; Brázdová, Z.; Vasků, A. Genotype x nutrient association of common polymorphisms in obesity-related genes with food preferences and time structure of energy intake. Br. J. Nutr. 2010, 103, 352–359. [Google Scholar] [CrossRef] [PubMed]
- Krashes, M.J.; Lowell, B.B.; Garfield, A.S. Melanocortin-4 receptor–regulated energy homeostasis. Nat. Neurosci. 2016, 19, 206–219. [Google Scholar] [CrossRef]
- Balthasar, N.; Dalgaard, L.; Lee, C.E.; Yu, J.; Funahashi, H.; Williams, T.; Ferreira, M.; Tang, V.; McGovern, R.A.; Kenny, C.D.; et al. Divergence of Melanocortin Pathways in the Control of Food Intake and Energy Expenditure. Cell 2005, 123, 493–505. [Google Scholar] [CrossRef]
- Branson, R.; Potoczna, N.; Kral, J.G.; Lentes, K.-U.; Hoehe, M.R.; Horber, F.F. Binge Eating as a Major Phenotype of Melanocortin 4 Receptor Gene Mutations. New Engl. J. Med. 2003, 348, 1096–1103. [Google Scholar] [CrossRef] [PubMed]
- Farooqi, I.S.; O’Rahilly, S. Monogenic Obesity in Humans. Annu. Rev. Med. 2005, 56, 443–458. [Google Scholar] [CrossRef]
- Loos, R.J.F.; Prostate, L.T.; Lindgren, C.M.; Li, S.; Wheeler, E.; Zhao, J.H.; Prokopenko, I.; Inouye, M.; Freathy, R.M.; Attwood, A.P.; et al. Common variants near MC4R are associated with fat mass, weight and risk of obesity. Nat. Genet. 2008, 40, 768–775. [Google Scholar] [CrossRef] [PubMed]
- Ranadive, S.A.; Vaisse, C. Lessons from Extreme Human Obesity: Monogenic Disorders. Endocrinol. Metab. Clin. N. Am. 2008, 37, 733–751. [Google Scholar] [CrossRef] [PubMed]
- Kring, I.I.S.; Holst, C.; Toubro, S.; Astrup, A.; Hansen, T.; Pedersen, O.; Sørensen, I.A.T. Common variants near MC4R in relation to body fat, body fat distribution, metabolic traits and energy expenditure. Int. J. Obes. 2009, 34, 182–189. [Google Scholar] [CrossRef][Green Version]
- Qi, L.; Kraft, P.; Hunter, D.J.; Hu, F.B. The common obesity variant near MC4R gene is associated with higher intakes of total energy and dietary fat, weight change and diabetes risk in women. Hum. Mol. Genet. 2008, 17, 3502–3508. [Google Scholar] [CrossRef] [PubMed]
- Xi, B.; AGEN-T2D Consortium; Takeuchi, F.; Chandak, G.R.; Kato, N.; Pan, H.-W.; Zhou, D.H.; Mi, J. Common polymorphism near the MC4R gene is associated with type 2 diabetes: Data from a meta-analysis of 123,373 individuals. Diabetologia 2012, 55, 2660–2666. [Google Scholar] [CrossRef] [PubMed]
- Koochakpoor, G.; Hosseini-Esfahani, F.; Daneshpour, M.A.; Hosseini, S.A.; Mirmiran, P. Effect of interactions of polymorphisms in the Melanocortin-4 receptor gene with dietary factors on the risk of obesity and Type 2 diabetes: A systematic review. Diabet. Med. 2016, 33, 1026–1034. [Google Scholar] [CrossRef] [PubMed]
- Wang, S.; Song, J.; Yang, Y.; Chawla, N.V.; Ma, J.; Wang, H. Rs12970134 near MC4R is associated with appetite and beverage intake in overweight and obese children: A family-based association study in Chinese population. PLoS ONE 2017, 12, e0177983. [Google Scholar] [CrossRef] [PubMed]
- Hasselbalch, A.L.; Ängquist, L.; Christiansen, L.; Heitmann, B.L.; Kyvik, K.O.; Sørensen, T.I.A. A Variant in the Fat Mass and Obesity-Associated Gene (FTO) and Variants near the Melanocortin-4 Receptor Gene (MC4R) Do Not Influence Dietary Intake. J. Nutr. 2010, 140, 831–834. [Google Scholar] [CrossRef] [PubMed]
- Muller, Y.L.; Thearle, M.S.; Piaggi, P.; Hanson, R.; Hoffman, D.; Gene, B.; Mahkee, D.; Huang, K.; Kobes, S.; Votruba, S.; et al. Common genetic variation in and near the melanocortin 4 receptor gene (MC4R) is associated with body mass index in American Indian adults and children. Qual. Life Res. 2014, 133, 1431–1441. [Google Scholar] [CrossRef]
- Lauria, F.; Siani, A.; Pico, C.; Ahrens, W.; Bammann, K.; De Henauw, S.; Foraita, R.; Iacoviello, L.; Kourides, Y.; Marild, S.; et al. A Common Variant and the Transcript Levels of MC4R Gene Are Associated With Adiposity in Children: The IDEFICS Study. J. Clin. Endocrinol. Metab. 2016, 101, 4229–4236. [Google Scholar] [CrossRef]
- American Diabetes Association. Abridged for Primary Care Providers. Clin. Diabetes 2020, 38, 10–38. [Google Scholar]
- Zobel, D.P.; Andreasen, C.H.; Grarup, N.; Eiberg, H.; Sørensen, T.I.; Sandbaek, A.; Lauritzen, T.; Borch-Johnsen, K.; Jørgensen, T.; Pedersen, O.; et al. Variants Near MC4R Are Associated With Obesity and Influence Obesity-Related Quantitative Traits in a Population of Middle-Aged People: Studies of 14,940 Danes. Diabetes 2008, 58, 757–764. [Google Scholar] [CrossRef] [PubMed]
- Adamska-Patruno, E.; Goscik, J.; Czajkowski, P.; Maliszewska, K.; Ciborowski, M.; Golonko, A.; Wawrusiewicz-Kurylonek, N.; Citko, A.; Waszczeniuk, M.; Kretowski, A.; et al. The MC4R genetic variants are associated with lower visceral fat accumulation and higher postprandial relative increase in carbohydrate utilization in humans. Eur. J. Nutr. 2019, 58, 2929–2941. [Google Scholar] [CrossRef] [PubMed]
- Karastergiou, K.; Smith, R.S.; Greenberg, A.S.; Fried, S.K. Sex differences in human adipose tissues–The biology of pear shape. Biol. Sex Differ. 2012, 3, 13. [Google Scholar] [CrossRef]
- Bennett, E.; Peters, A.E.S.; Woodward, M. Sex differences in macronutrient intake and adherence to dietary recommendations: Findings from the UK Biobank. BMJ Open 2018, 8, e020017. [Google Scholar] [CrossRef]
- Ibrahim, M.M. Subcutaneous and visceral adipose tissue: Structural and functional differences. Obes. Rev. 2010, 11, 11–18. [Google Scholar] [CrossRef]
- Katzmarzyk, P.T.; Mire, E.; Bouchard, C. Abdominal obesity and mortality: The Pennington Center Longitudinal Study. Nutr. Diabetes 2012, 2, e42. [Google Scholar] [CrossRef]
- Kaess, B.M.; Pedley, A.; Massaro, J.; Murabito, J.; Hoffmann, U.; Fox, C.S. The ratio of visceral to subcutaneous fat, a metric of body fat distribution, is a unique correlate of cardiometabolic risk. Diabetologia 2012, 55, 2622–2630. [Google Scholar] [CrossRef]
- Maliszewska, K.; Adamska-Patruno, E.; Kretowski, A. The interplay between muscle mass decline, obesity, and type 2 diabetes. Pol. Arch. Intern. Med. 2019, 129, 809–816. [Google Scholar] [CrossRef]
- Rojo, D.; McCarthy, C.; Raingo, J.; Rubinstein, M. Mouse models for V103I and I251L gain of function variants of the human MC4R display decreased adiposity but are not protected against a hypercaloric diet. Mol. Metab. 2020, 42, 101077. [Google Scholar] [CrossRef] [PubMed]
- Butler, A.; Marks, D.L.; Fan, W.; Kuhn, C.M.; Bartolome, M.V.; Cone, R.D. Melanocortin-4 receptor is required for acute homeostatic responses to increased dietary fat. Nat. Neurosci. 2001, 4, 605–611. [Google Scholar] [CrossRef]
- Weigle, D.S.; Breen, P.A.; Matthys, C.C.; Callahan, H.S.; Meeuws, K.E.; Burden, V.R.; Purnell, J.Q. A high-protein diet induces sustained reductions in appetite, ad libitum caloric intake, and body weight despite compensatory changes in diurnal plasma leptin and ghrelin concentrations. Am. J. Clin. Nutr. 2005, 82, 41–48. [Google Scholar] [CrossRef] [PubMed]
- Meisel, S.F.; for the PGen Study Group; Carere, D.A.; Wardle, J.; Kalia, S.S.; Moreno, T.A.; Mountain, J.L.; Roberts, J.S.; Green, R.C. Explaining, not just predicting, drives interest in personal genomics. Genome Med. 2015, 7, 74. [Google Scholar] [CrossRef] [PubMed]
- Scherag, A.; Jarick, I.; Grothe, J.; Biebermann, H.; Scherag, S.; Volckmar, A.-L.; Vogel, C.I.G.; Greene, B.; Hebebrand, J.; Hinney, A. Investigation of a Genome Wide Association Signal for Obesity: Synthetic Association and Haplotype Analyses at the Melanocortin 4 Receptor Gene Locus. PLoS ONE 2010, 5, e13967. [Google Scholar] [CrossRef]
- Hinney, A.; Bettecken, T.; Tarnow, P.; Brumm, H.; Reichwald, K.; Lichtner, P.; Scherag, A.; Nguyen, T.T.; Schlumberger, P.; Rief, W.; et al. Prevalence, Spectrum, and Functional Characterization of Melanocortin-4 Receptor Gene Mutations in a Representative Population-Based Sample and Obese Adults from Germany. J. Clin. Endocrinol. Metab. 2006, 91, 1761–1769. [Google Scholar] [CrossRef] [PubMed]
- Vázquez-Moreno, M.; Locia-Morales, D.; Valladares-Salgado, A.; Sharma, T.; Wacher-Rodarte, N.; Cruz, M.; Meyre, D. Sex/Gender Modifies the Association Between the MC4R p.Ile269Asn Mutation and Type 2 Diabetes in the Mexican Population. J. Clin. Endocrinol. Metab. 2021, 106, e112–e117. [Google Scholar] [CrossRef]
- Heitmann, B.L.; Lissner, L. Dietary underreporting by obese individuals–is it specific or non-specific? BMJ 1995, 311, 986–989. [Google Scholar] [CrossRef]
- Adamska-Patruno, E.; Ostrowska, L.; Golonko, A.; Pietraszewska, B.; Goscik, J.; Kretowski, A.; Gorska, M. Evaluation of Energy Expenditure and Oxidation of Energy Substrates in Adult Males after Intake of Meals with Varying Fat and Carbohydrate Content. Nutrients 2018, 10, 627. [Google Scholar] [CrossRef] [PubMed]
- Adamska-Patruno, E.; Ostrowska, L.; Goscik, J.; Pietraszewska, B.; Kretowski, A.; Gorska, M. The relationship between the leptin/ghrelin ratio and meals with various macronutrient contents in men with different nutritional status: A randomized crossover study. Nutr. J. 2018, 17, 1–7. [Google Scholar] [CrossRef] [PubMed]
- Czajkowski, P.; Adamska-Patruno, E.; Bauer, W.; Fiedorczuk, J.; Krasowska, U.; Moroz, M.; Gorska, M.; Kretowski, A. The Impact of FTO Genetic Variants on Obesity and Its Metabolic Consequences Is Dependent on Daily Macronutrient Intake. Nutrients 2020, 12, 3255. [Google Scholar] [CrossRef] [PubMed]
- Bauer, W.; Adamska-Patruno, E.; Krasowska, U.; Moroz, M.; Fiedorczuk, J.; Czajkowski, P.; Bielska, D.; Gorska, M.; Kretowski, A. Dietary Macronutrient Intake May Influence the Effects of TCF7L2 rs7901695 Genetic Variants on Glucose Homeostasis and Obesity-Related Parameters: A Cross-Sectional Population-Based Study. Nutrients 2021, 13, 1936. [Google Scholar] [CrossRef]
- Nagy, E.; on behalf of the HELENA Study Group; Vicente-Rodriguez, G.; Manios, Y.; Béghin, L.; Iliescu, C.; Censi, L.; Dietrich, S.; Ortega, F.B.; De Vriendt, T.; et al. Harmonization process and reliability assessment of anthropometric measurements in a multicenter study in adolescents. Int. J. Obes. 2008, 32, S58–S65. [Google Scholar] [CrossRef] [PubMed]
- Hagströmer, M.; Oja, P.; Sjöström, M. The International Physical Activity Questionnaire (IPAQ): A study of concurrent and construct validity. Public Health Nutr. 2006, 9, 755–762. [Google Scholar] [CrossRef] [PubMed]
- Team, R.C. R: A Language and Environment for Statistical Computing; R Foundation for Statistical Computing: Vienna, Austria, 2020. [Google Scholar]


| Parameter | |
|---|---|
| N (women/men, %) | 819 (52.5/47.5) |
| Age (years) | 42.1 (14.5) |
| BMI (kg/m2) | 28.5 (6.6) |
| % of subjects with BMI < 25.0 kg/ m2 (%) | 33.9 |
| % of subjects with BMI 25.0–29.9 kg/ m2 (%) | 34.5 |
| % of subjects with BMI ≥ 30.0 kg/ m2 (%) | 31.6 |
| Fat mass (kg) | 27.1 (13.8) |
| Fat mass (%) | 31.4 (9.6) |
| WHR | 0.928 (0.088) |
| Visceral fat (cm3) | 108.4 (80.6) |
| Visceral fat (%) | 37.1 (12.1) |
| Subcutaneous fat (cm3) | 167.9 (81.7) |
| Subcutaneous fat (%) | 62.8 (12.3) |
| Visceral/subcutaneous fat ratio | 0.669 (0.443) |
| Frequency of prediabetes or diabetes | |
| Yes | 411 (50.2%) |
| No | 408 (49.8%) |
| Fasting blood glucose level (mg/dL) | 98.8 (23.9) |
| Daily energy intake (kcal) | 1792.5 (697.4) |
| % of daily energy from protein | 18.9 (4.8) |
| % of daily energy from fat | 31.2 (7.5) |
| % of daily energy from carbohydrates | 47.6 (8.6) |
| Daily physical activity level, n (%) | |
| Low | 60 (7.3%) |
| Moderate | 173 (21.1%) |
| High | 586 (71.6%) |
| rs17782313 | C/C | C/T | T/T | p-Value |
|---|---|---|---|---|
| N (women/men) | 30 (10/20) | 275 (137/138) | 504 (277/227) | |
| Genotype frequency | 3.71% | 33.99% | 62.30% | >0.05 |
| BMI (kg/m2) | 29.8 (6.4) | 29.0 (6.9) | 28.1 (6.5) | 0.049 |
| BMI < 25.0 (kg/m2) | 7 (23.3%) | 83 (30.5%) | 182 (36.4%) | |
| BMI 25.0–29.9 (kg/m2) | 9 (30.0%) | 98 (36.0%) | 170 (34.0%) | 0.186 |
| BMI ≥ 30.0 (kg/m2) | 14 (46.7%) | 91 (33.5%) | 148 (29.6%) | |
| Fat mass (kg) | 29.2 (12.6) | 27.8 (14.6) | 26.6 (13.4) | 0.322 |
| Fat mass (%) | 32.0 (7.7) | 31.5 (10.0) | 31.3 (9.5) | 0.924 |
| WHR | 0.944 (0.100) | 0.935 (0.087) | 0.923 (0.088) | 0.133 |
| Visceral fat (cm3) | 151.9 (114.3) | 115.9 (89.7) | 101.7 (71.8) | 0.264 |
| Visceral fat (%) | 42.5 (14.0) | 38.1 (13.9) | 36.2 (10.7) | 0.107 |
| Subcutaneous fat (cm3) | 179.8 (82.2) | 167.7 (79.7) | 167.0 (82.8) | 0.693 |
| Subcutaneous fat (%) | 57.5 (14.0) | 61.9 (13.9) | 63.6 (11.2) | 0.110 |
| Visceral/subcutaneous fat ratio | 0.847 (0.478) | 0.736 (0.575) | 0.623 (0.345) | 0.105 |
| Frequency of prediabetes or diabetes | ||||
| Yes | 19 (61.3%) | 148 (53.6%) | 241 (47.4%) | 0.118 |
| No | 12 (38.7%) | 128 (46.4%) | 267 (52.6%) | |
| Fasting blood glucose level (mg/dL) | 104.5 (31.8) | 98.2 (24.0) | 94.7 (17.2) | 0.037 |
| Blood glucose level at 30′ of OGTT (mg/dL) | 151.1 (32.0) | 148.8 (37.3) | 145.2 (35.8) | 0.217 |
| Daily energy intake (kcal) | 1575.1 (1017.8) | 1825.0 (697.5) | 1774.6 (689.4) | 0.514 |
| % of daily energy from protein | 19.8 (2.4) | 18.7 (4.3) | 19.1 (5.1) | 0.329 |
| % of daily energy from fat | 27.9 (9.0) | 31.1 (6.7) | 31.3 (7.9) | 0.563 |
| % of daily energy from carbohydrates | 50.2 (9.3) | 47.6 (8.2) | 47.4 (8.9) | 0.644 |
| Daily physical activity level | ||||
| Low | 2 (6.5%) | 22 (8.0%) | 35 (6.9%) | |
| Moderate | 10 (32.3%) | 53 (19.2%) | 109 (21.5%) | 0.528 |
| High | 19 (61.3%) | 201 (72.8%) | 364 (71.7%) |
| rs12970134 | A/A | A/G | G/G | p-Value |
|---|---|---|---|---|
| N (women/men) | 44 (18/26) | 308 (157/151) | 459 (251/208) | |
| Genotype frequency | 5.43% | 37.98% | 56.59% | >0.05 |
| BMI (kg/m2) | 30.6 (6.8) | 28.8 (6.8) | 28.1 (6.5) | 0.010 |
| BMI < 25.0 (kg/m2) | 8 (18.2%) | 98 (32.1%) | 166 (36.5%) | |
| BMI 25.0–29.9 (kg/m2) | 15 (34.1%) | 105 (34.4%) | 157 (34.5%) | 0.050 |
| BMI ≥ 30.0 (kg/m2) | 21 (47.7%) | 102 (33.4%) | 132 (29.0%) | |
| Fat mass (kg) | 31.3 (13.9) | 27.5 (14.1) | 26.4 (13.6) | 0.035 |
| Fat mass (%) | 33.7 (8.2) | 31.6 (9.8) | 31.1 (9.7) | 0.209 |
| WHR | 0.949 (0.099) | 0.936 (0.089) | 0.921 (0.086) | 0.021 |
| Visceral fat (cm3) | 145.6 (111.7) | 111.6 (82.6) | 102.9 (75.0) | 0.235 |
| Visceral fat (%) | 39.4 (15.3) | 37.8 (13.1) | 36.4 (10.9) | 0.685 |
| Subcutaneous fat (cm3) | 196.4 (74.5) | 165.5 (77.2) | 167.0 (85.2) | 0.075 |
| Subcutaneous fat (%) | 60.6 (15.3) | 62.2 (13.1) | 63.5 (11.4) | 0.693 |
| Visceral/subcutaneous fat ratio | 0.777 (0.527) | 0.712 (0.533) | 0.630 (0.355) | 0.672 |
| Frequency of prediabetes or diabetes | ||||
| Yes | 26 (57.8%) | 162 (52.3%) | 221 (47.8%) | 0.285 |
| No | 19 (42.2%) | 148 (47.7%) | 241 (52.2%) | |
| Fasting blood glucose level (mg/dl) | 104.1 (33.1) | 97.8 (22.2) | 94.5 (17.4) | 0.038 |
| Blood glucose level at 30′ of OGTT (mg/dl) | 148.8 (33.4) | 149.3 (36.3) | 144.6 (36.4) | 0.119 |
| Daily energy intake (kcal) | 1599.3 (887.3) | 1831.3 (700.8) | 1780.0 (683.7) | 0.316 |
| % of daily energy from protein | 20.5 (4.1) | 18.6 (4.1) | 19.0 (5.2) | 0.130 |
| % of daily energy from fat | 29.1 (7.4) | 31.1 (7.1) | 31.3 (7.7) | 0.490 |
| % of daily energy from carbohydrates | 47.9 (8.3) | 47.9 (8.4) | 47.4 (8.8) | 0.691 |
| Daily physical activity level | ||||
| Low | 4 (8.9%) | 21 (6.8%) | 35 (7.6%) | |
| Moderate | 13 (28.9%) | 61 (19.7%) | 99 (21.4%) | 0.623 |
| High | 28 (62.2%) | 228 (73.5%) | 328 (71.0%) |
| rs633265 | G/G | G/T | T/T | p-Value |
|---|---|---|---|---|
| N (women/men) | 278 (151/127) | 399 (213/186) | 130 (59/71) | |
| Genotype frequency | 34.45% | 49.44% | 16.11% | >0.05 |
| BMI (kg/m2) | 27.9 (6.3) | 28.6 (6.8) | 28.9 (6.4) | 0.134 |
| BMI < 25.0 (kg/m2) | 100 (36.2%) | 140 (35.4%) | 32 (24.8%) | |
| BMI 25.0–29.9 (kg/m2) | 93 (33.7%) | 132 (33.4%) | 51 (39.5%) | 0.219 |
| BMI ≥ 30.0 (kg/m2) | 83 (30.1%) | 123 (31.1%) | 46 (35.7%) | |
| Fat mass (kg) | 26.1 (12.4) | 27.5 (14.8) | 27.6 (13.1) | 0.535 |
| Fat mass (%) | 31.1 (9.1) | 31.7 (10.3) | 31.1 (8.6) | 0.786 |
| WHR | 0.924 (0.087) | 0.928 (0.089) | 0.936 (0.088) | 0.474 |
| Visceral fat (cm3) | 101.9 (68.5) | 107.0 (82.0) | 123.8 (95.4) | 0.379 |
| Visceral fat (%) | 36.5 (10.9) | 36.7 (12.2) | 39.4 (13.9) | 0.163 |
| Subcutaneous fat (cm3) | 167.6 (81.4) | 166.7 (80.9) | 170.5 (84.3) | 0.935 |
| Subcutaneous fat (%) | 63.5 (10.9) | 63.1 (12.8) | 60.7 (13.8) | 0.169 |
| Visceral/subcutaneous fat ratio | 0.635 (0.368) | 0.665 (0.484) | 0.749 (0.471) | 0.164 |
| Frequency of prediabetes or diabetes | ||||
| Yes | 132 (46.8%) | 203 (50.8%) | 73 (55.7%) | 0.244 |
| No | 150 (53.2%) | 197 (49.2%) | 58 (44.3%) | |
| Fasting blood glucose level (mg/dL) | 98.1 (21.2) | 96.8 (22.6) | 94.5 (16.7) | 0.144 |
| Blood glucose level at 30′ of OGTT (mg/dL) | 152.6 (38.7) | 147.8 (36.1) | 142.0 (34.7) | 0.023 |
| Daily energy intake (kcal) | 1818.8 (740.8) | 1796.5 (675.8) | 1733.0 (668.6) | 0.715 |
| % of daily energy from protein | 19.1 (5.3) | 18.7 (4.5) | 19.2 (4.5) | 0.502 |
| % of daily energy from fat | 32.1 (8.1) | 30.5 (7.1) | 31.4 (7.2) | 0.120 |
| % of daily energy from carbohydrates | 47.0 (9.3) | 47.9 (8.4) | 47.2 (8.0) | 0.535 |
| Daily physical activity level | ||||
| Low | 15 (5.3%) | 36 (9.0%) | 9 (6.9%) | |
| Moderate | 66 (23.4%) | 79 (19.8%) | 26 (19.8%) | 0.401 |
| High | 201 (71.3%) | 285 (71.2%) | 96 (73.3%) |
| rs1350341 | A/A | A/G | G/G | p-Value |
|---|---|---|---|---|
| N (women/men) | 127 (59/68) | 390 (207/183) | 274 (149/125) | |
| Genotype frequency | 16.06% | 49.30% | 34.64% | >0.05 |
| BMI (kg/m2) | 29.0 (6.5) | 28.7 (7.0) | 27.9 (6.3) | 0.128 |
| BMI <25.0 (kg/ m2) | 31 (24.6%) | 136 (35.2%) | 100 (36.8%) | |
| BMI 25.0–29.9 (kg/ m2) | 51 (40.5%) | 131 (33.9%) | 91 (33.5%) | 0.196 |
| BMI ≥30.0 (kg/ m2) | 44 (34.9%) | 119 (30.8%) | 81 (29.8%) | |
| Fat mass (kg) | 27.7 (13.2) | 27.4 (15.0) | 26.1 (12.5) | 0.484 |
| Fat mass (%) | 31.2 (8.6) | 31.5 (10.3) | 31.1 (9.1) | 0.890 |
| WHR | 0.934 (0.089) | 0.927 (0.088) | 0.923 (0.087) | 0.507 |
| Visceral fat (cm3) | 124.9 (96.8) | 106.1 (81.4) | 101.7 (69.1) | 0.386 |
| Visceral fat (%) | 39.1 (14.0) | 36.7 (12.3) | 36.6 (11.0) | 0.294 |
| Subcutaneous fat (cm3) | 173.3 (84.9) | 165.3 (80.2) | 165.8 (80.2) | 0.734 |
| Subcutaneous fat (%) | 61.0 (13.9) | 63.1 (12.9) | 63.4 (11.0) | 0.304 |
| Visceral/subcutaneous fat ratio | 0.741 (0.476) | 0.669 (0.490) | 0.638 (0.371) | 0.296 |
| Frequency of prediabetes or diabetes | ||||
| Yes | 69 (53.9%) | 195 (50.0%) | 129 (46.7%) | 0.385 |
| No | 59 (46.1%) | 195 (50.0%) | 147 (53.3%) | |
| Fasting blood glucose level (mg/dl) | 97.4 (20.7) | 95.9 (17.9) | 94.3 (16.2) | 0.198 |
| Blood glucose level at 30′ of OGTT (mg/dl) | 152.4 (38.7) | 148.3 (36.0) | 142.0 (34.8) | 0.021 |
| Daily energy intake (kcal) | 1741.1 (670.7) | 1789.2 (674.1) | 1823.0 (744.7) | 0.742 |
| % of daily energy from protein | 19.2 (4.6) | 18.7 (4.3) | 19.1 (5.4) | 0.604 |
| % of daily energy from fat | 31.4 (7.1) | 30.5 (7.2) | 32.1 (8.1) | 0.097 |
| % of daily energy from carbohydrates | 47.2 (8.1) | 48.0 (8.4) | 47.0 (9.3) | 0.476 |
| Daily physical activity level | ||||
| Low | 8 (6.2%) | 34 (8.7%) | 15 (5.4%) | |
| Moderate | 27 (21.1%) | 76 (19.5%) | 62 (22.5%) | 0.524 |
| High | 93 (72.7%) | 280 (71.8%) | 199 (72.1%) |
Publisher’s Note: MDPI stays neutral with regard to jurisdictional claims in published maps and institutional affiliations. |
© 2021 by the authors. Licensee MDPI, Basel, Switzerland. This article is an open access article distributed under the terms and conditions of the Creative Commons Attribution (CC BY) license (https://creativecommons.org/licenses/by/4.0/).
Share and Cite
Adamska-Patruno, E.; Bauer, W.; Bielska, D.; Fiedorczuk, J.; Moroz, M.; Krasowska, U.; Czajkowski, P.; Wielogorska, M.; Maliszewska, K.; Puckowska, S.; et al. An Association between Diet and MC4R Genetic Polymorphism, in Relation to Obesity and Metabolic Parameters—A Cross Sectional Population-Based Study. Int. J. Mol. Sci. 2021, 22, 12044. https://doi.org/10.3390/ijms222112044
Adamska-Patruno E, Bauer W, Bielska D, Fiedorczuk J, Moroz M, Krasowska U, Czajkowski P, Wielogorska M, Maliszewska K, Puckowska S, et al. An Association between Diet and MC4R Genetic Polymorphism, in Relation to Obesity and Metabolic Parameters—A Cross Sectional Population-Based Study. International Journal of Molecular Sciences. 2021; 22(21):12044. https://doi.org/10.3390/ijms222112044
Chicago/Turabian StyleAdamska-Patruno, Edyta, Witold Bauer, Dorota Bielska, Joanna Fiedorczuk, Monika Moroz, Urszula Krasowska, Przemyslaw Czajkowski, Marta Wielogorska, Katarzyna Maliszewska, Sylwia Puckowska, and et al. 2021. "An Association between Diet and MC4R Genetic Polymorphism, in Relation to Obesity and Metabolic Parameters—A Cross Sectional Population-Based Study" International Journal of Molecular Sciences 22, no. 21: 12044. https://doi.org/10.3390/ijms222112044
APA StyleAdamska-Patruno, E., Bauer, W., Bielska, D., Fiedorczuk, J., Moroz, M., Krasowska, U., Czajkowski, P., Wielogorska, M., Maliszewska, K., Puckowska, S., Szczerbinski, L., Lipinska, D., Gorska, M., & Kretowski, A. (2021). An Association between Diet and MC4R Genetic Polymorphism, in Relation to Obesity and Metabolic Parameters—A Cross Sectional Population-Based Study. International Journal of Molecular Sciences, 22(21), 12044. https://doi.org/10.3390/ijms222112044