Article

Endothelial Response Boosted by Platelet Lysate: The Involvement of Calcium Toolkit

1
DiSIT—Dipartimento di Scienze e Innovazione Tecnologica, University of Piemonte Orientale, Viale Teresa Michel 11, 15121 Alessandria, Italy
2
DiSIT—Dipartimento di Scienze e Innovazione Tecnologica, University of Piemonte Orientale, piazza Sant’Eusebio 5, 13100 Vercelli, Italy
3
Laboratorio Produzione Emocomponenti e Medicina Rigenerativa, SIMT—AO “SS Antonio e Biagio”, 15121 Alessandria, Italy
*
Author to whom correspondence should be addressed.
Int. J. Mol. Sci. 2020, 21(3), 808; https://doi.org/10.3390/ijms21030808
Submission received: 26 November 2019 / Revised: 21 January 2020 / Accepted: 22 January 2020 / Published: 26 January 2020
(This article belongs to the Special Issue Blood-Derived Products for Tissue Repair/Regeneration 2.0)

Abstract

:
Wound repair is a dynamic process during which crucial signaling pathways are regulated by growth factors and cytokines released by several kinds of cells directly involved in the healing process. However, the limited applications and heterogeneous clinical results of single growth factors in wound healing encouraged the use of a mixture of bioactive molecules such as platelet derivatives for best results in wound repair. An interesting platelet derivative, obtained from blood samples, is platelet lysate (PL), which has shown potential clinical application. PL is obtained from freezing and thawing of platelet-enriched blood samples. Intracellular calcium (Ca2+) signals play a central role in the control of endothelial cell survival, proliferation, motility, and differentiation. We investigated the role of Ca2+ signaling in the PL-driven endothelial healing process. In our experiments, the functional significance of Ca2+ signaling machinery was highlighted performing the scratch wound assay in presence of different inhibitors or specific RNAi. We also pointed out that the PL-induced generation of intracellular ROS (reactive oxygen species) via NOX4 (NADPH oxidase 4) is necessary for the activation of TRPM2 and the resulting Ca2+ entry from the extracellular space. This is the first report of the mechanism of wound repair in an endothelial cell model boosted by the PL-induced regulation of [Ca2+]i.

1. Introduction

Wound healing is a well-orchestrated process strictly dependent on correct functions of several cell types, such as inflammatory cells, endothelial cells, fibroblasts, and keratinocyte cells, with the ultimate goal of restoring tissue integrity [1].
This process relies on a complex integration of some cellular signaling, requiring multiple growth factors and cytokines stimuli, with positive and negative effects on different wound phases [2].
Some of these factors are well characterized, but until now, few of them are available for clinical use due to their short half-life and excessive cost. In particular, the use of single growth factor is not effective in affecting wound repair, and the best solution should be to deliver a mixture of several growth factors in order to induce complete repair [3,4].
Platelets are important elements in wound repair and tissue regeneration processes, affecting cell recruitment and extracellular matrix remodeling, as well as blood vessel growth and angiogenesis.
Platelets are characterized by the presence of granules containing growth factors, cytokines, and chemokines that are able to stimulate cellular activities at wounded sites [5].
An increasing amount of research has shown the positive role of growth factors, released by platelets, if delivered in wound healing sites, stimulating the healing process in a physiological fashion [6].
An attractive platelet derivative, showing potential clinical application, is platelet lysate (PL). PL is obtained from repeated freezing and thawing of platelet-enriched blood samples [5]. This PL contains a mixture of growth factors and other molecules able to stimulate tissue regeneration. Human PL has been also been proposed as an alternative to classic fetal bovine serum (FBS) to avoid xenogenic immune reactions as well as viruses and prion transmissions [7].
We have previously demonstrated by in vitro scratch wound, cell migration, and microscope image analysis that PL activates the repair mechanisms in various types of injured endothelial cell layers [8].
Our observations suggested that the PL-induced wound healing is driven by a complex of effects, including both cell proliferation and migratory behavior. These data confirm previous findings about the chemotactic responses to platelet derivatives of glial cells [9], rat fetal cells [10], osteoblasts [11], keratinocytes [12], and primary fibroblasts [13].
Cytosolic free Ca2+ is essential for cell proliferation and motility [14]. Moreover, the role of intracellular Ca2+ in wound healing has been suggested by wound-induced Ca2+ waves observed in injured cells, as well as by PL-induced oscillatory Ca2+ signaling [15].
Studies carried out on endothelial cells have shown wound-induced Ca2+ waves [16], while intracellular Ca2+ signaling is essential to promote wound healing during endothelial repair [17].
An increase in intracellular Ca2+ concentration [Ca2+]i is a proposed trigger in wound healing, and Ca2+ waves spread from injured areas leading to temporary Ca2+ increase. Moreover, a correlation between Ca2+ dynamics and wound repair has been reported in studies on several cell types, i.e., keratinocytes, fibroblasts, and endothelial cells, where PL has induced significant Ca2+ signals, and the use of Ca2+ chelator BAPTA-AM (1,2-Bis(2-aminophenoxy)ethane-N,N,N′,N′-tetraacetic acid tetrakis-acetoxymethyl ester) in experiments of scratch wound healing suppressed the healing effect of PL [8,11,12,18].
Intracellular Ca2+ signaling plays a central role in stimulating wound healing; however, the mechanistic information on injury-induced Ca2+ waves in vascular endothelium is still under investigation [17].
The aim of this study is to further characterize the PL-induced wound healing processes investigating the involvement of the Ca2+ toolkit in the PL-boosted regeneration. Disclosing the molecular nature of the pathway gating Ca2+ entry into PL-stimulated endothelium is a crucial challenge to employ Ca2+ signals for therapeutic purposes.

2. Results

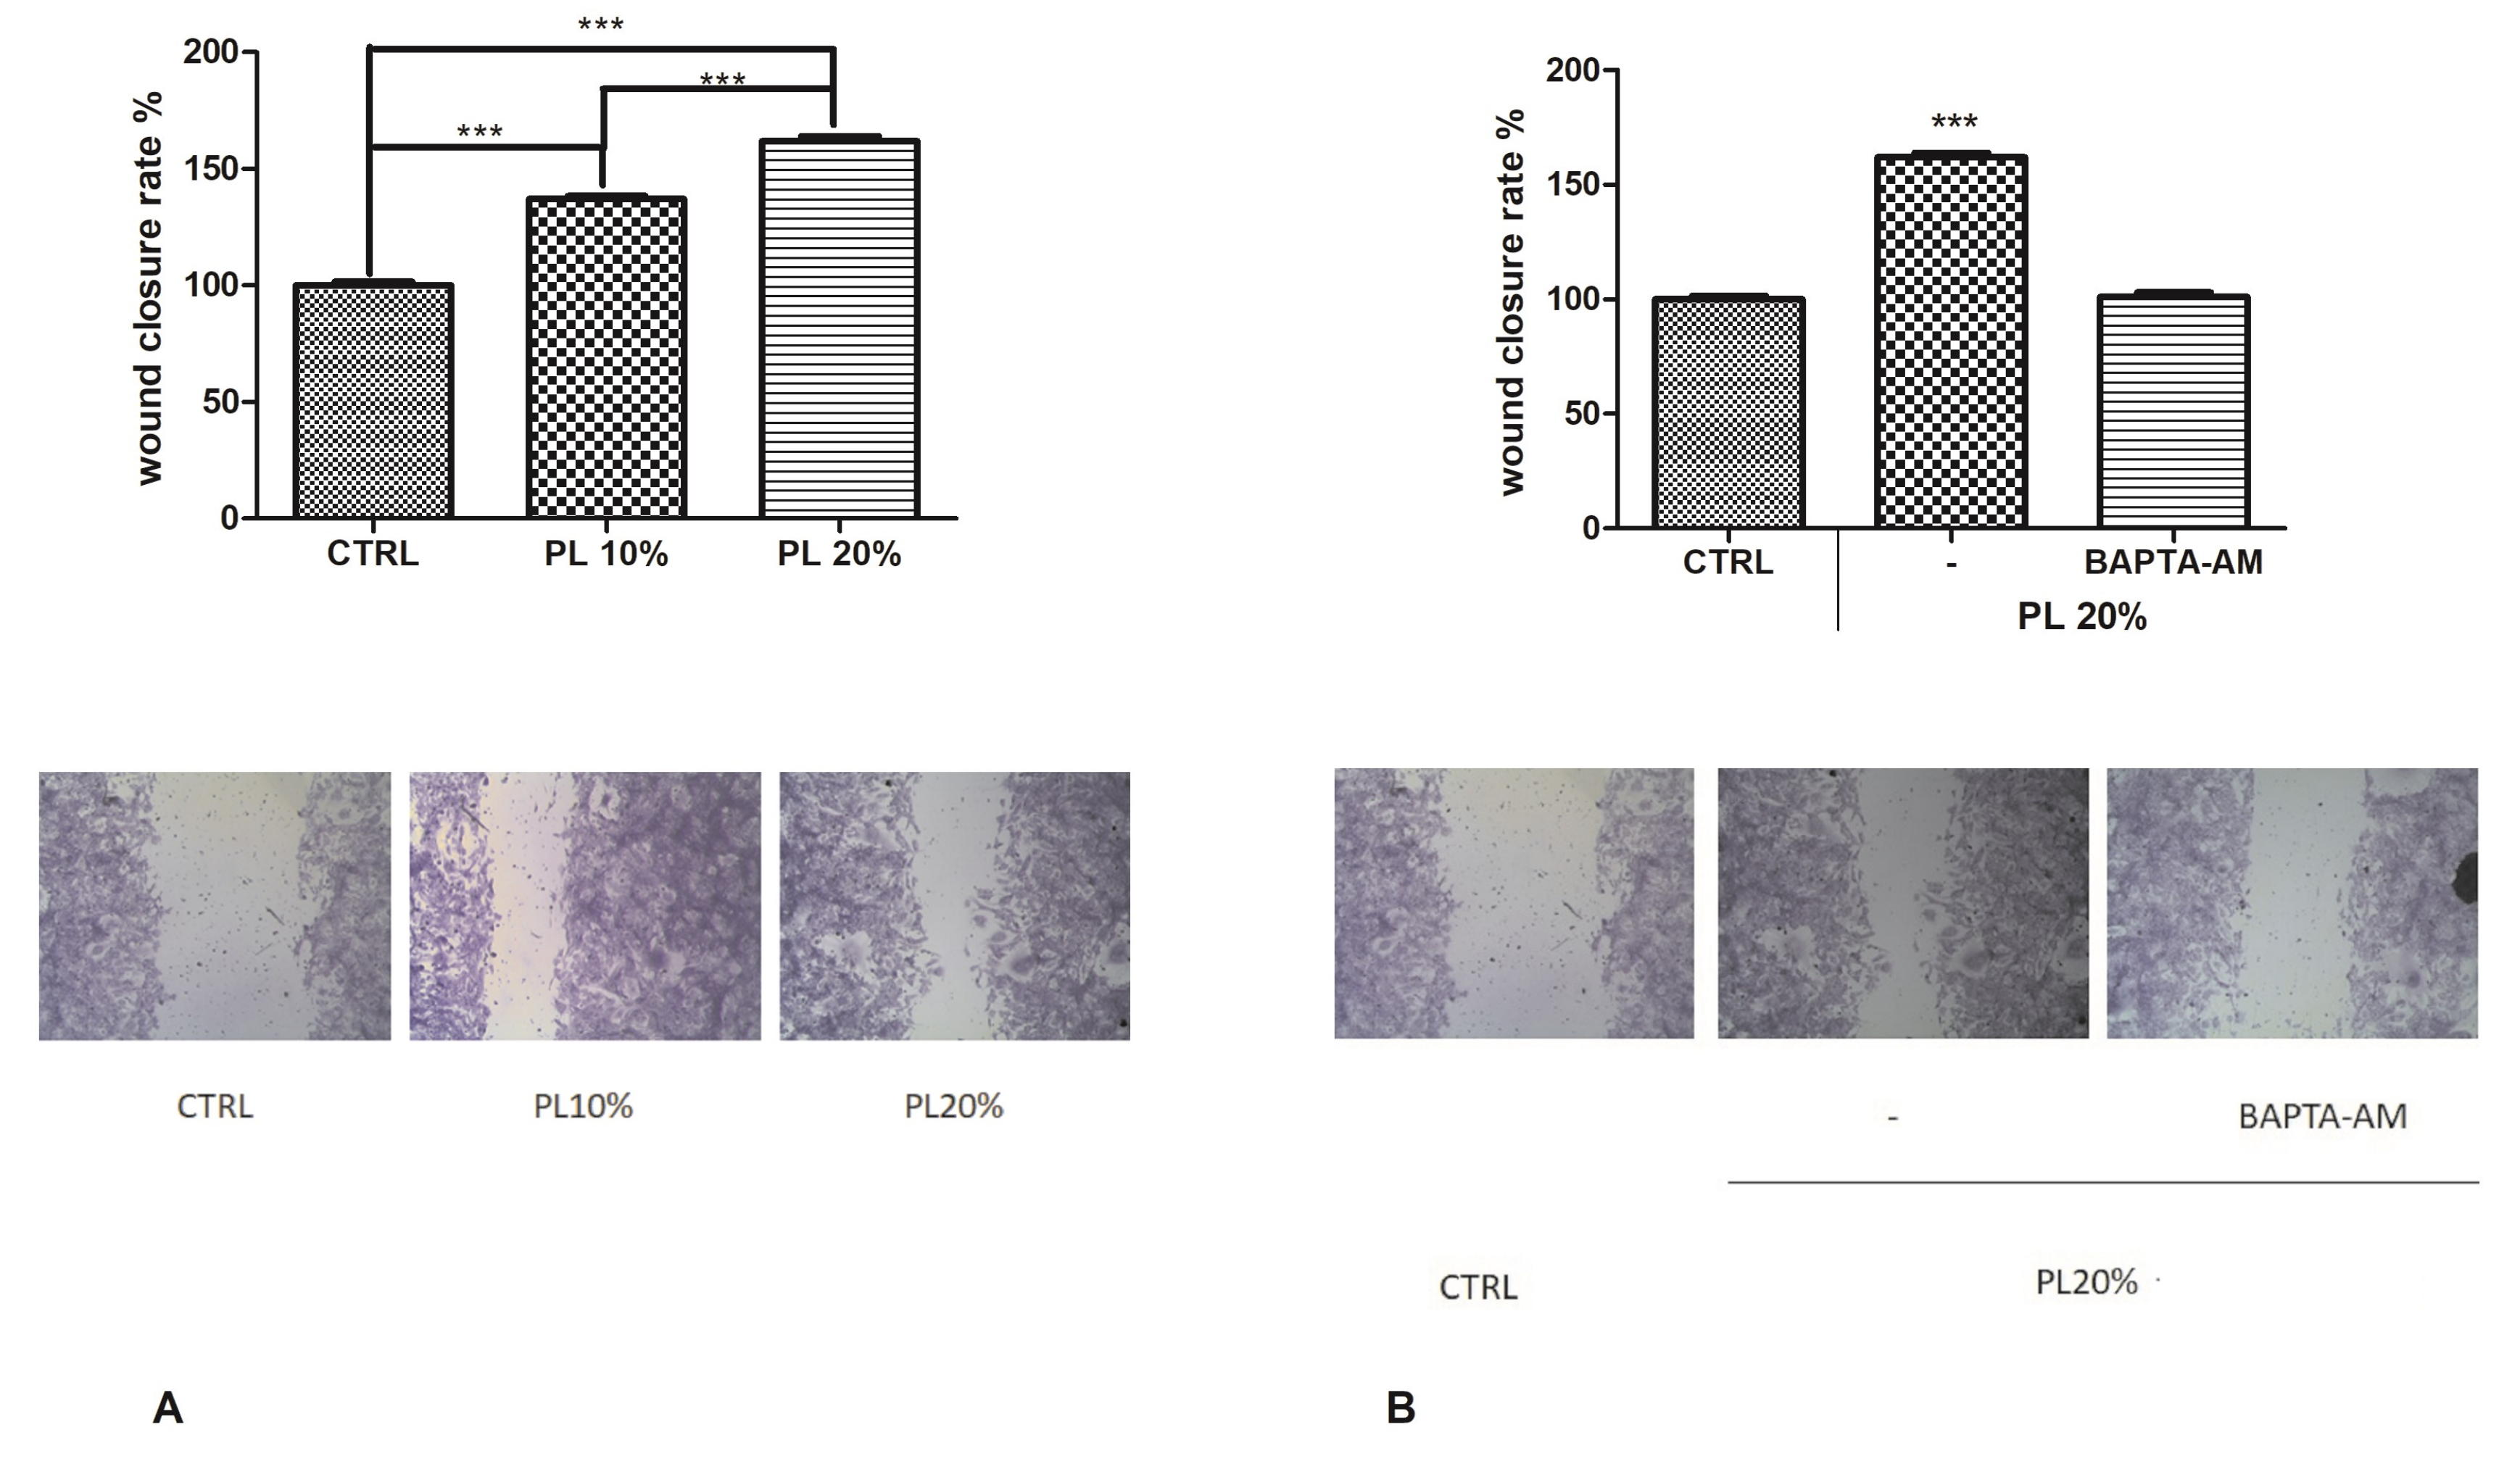
2.1. PL Induces Tissue Regeneration in a Dose-Dependent Manner

We have earlier demonstrated that in endothelial cells, PL exposure induced variable increases of cell viability and proliferation, with maximum effects observed at 20% PL [19].
To disclose the functional role of PL in tissue regeneration, we performed the scratch wound assay on bEND5 cells, in presence of 10% or 20% v/v PL (Figure 1A), confirming that 20% PL was the most effective concentration also in inducing wound closure.
Then, to demonstrate the involvement of Ca2+ signaling in the PL-induced wound closure mechanism, we repeated the scratch wound assay in presence or not of BAPTA-AM. We observed that this inhibitor significantly reduced the wound healing rate, highlighting the importance of extracellular Ca2+ entry (Figure 1B,C).

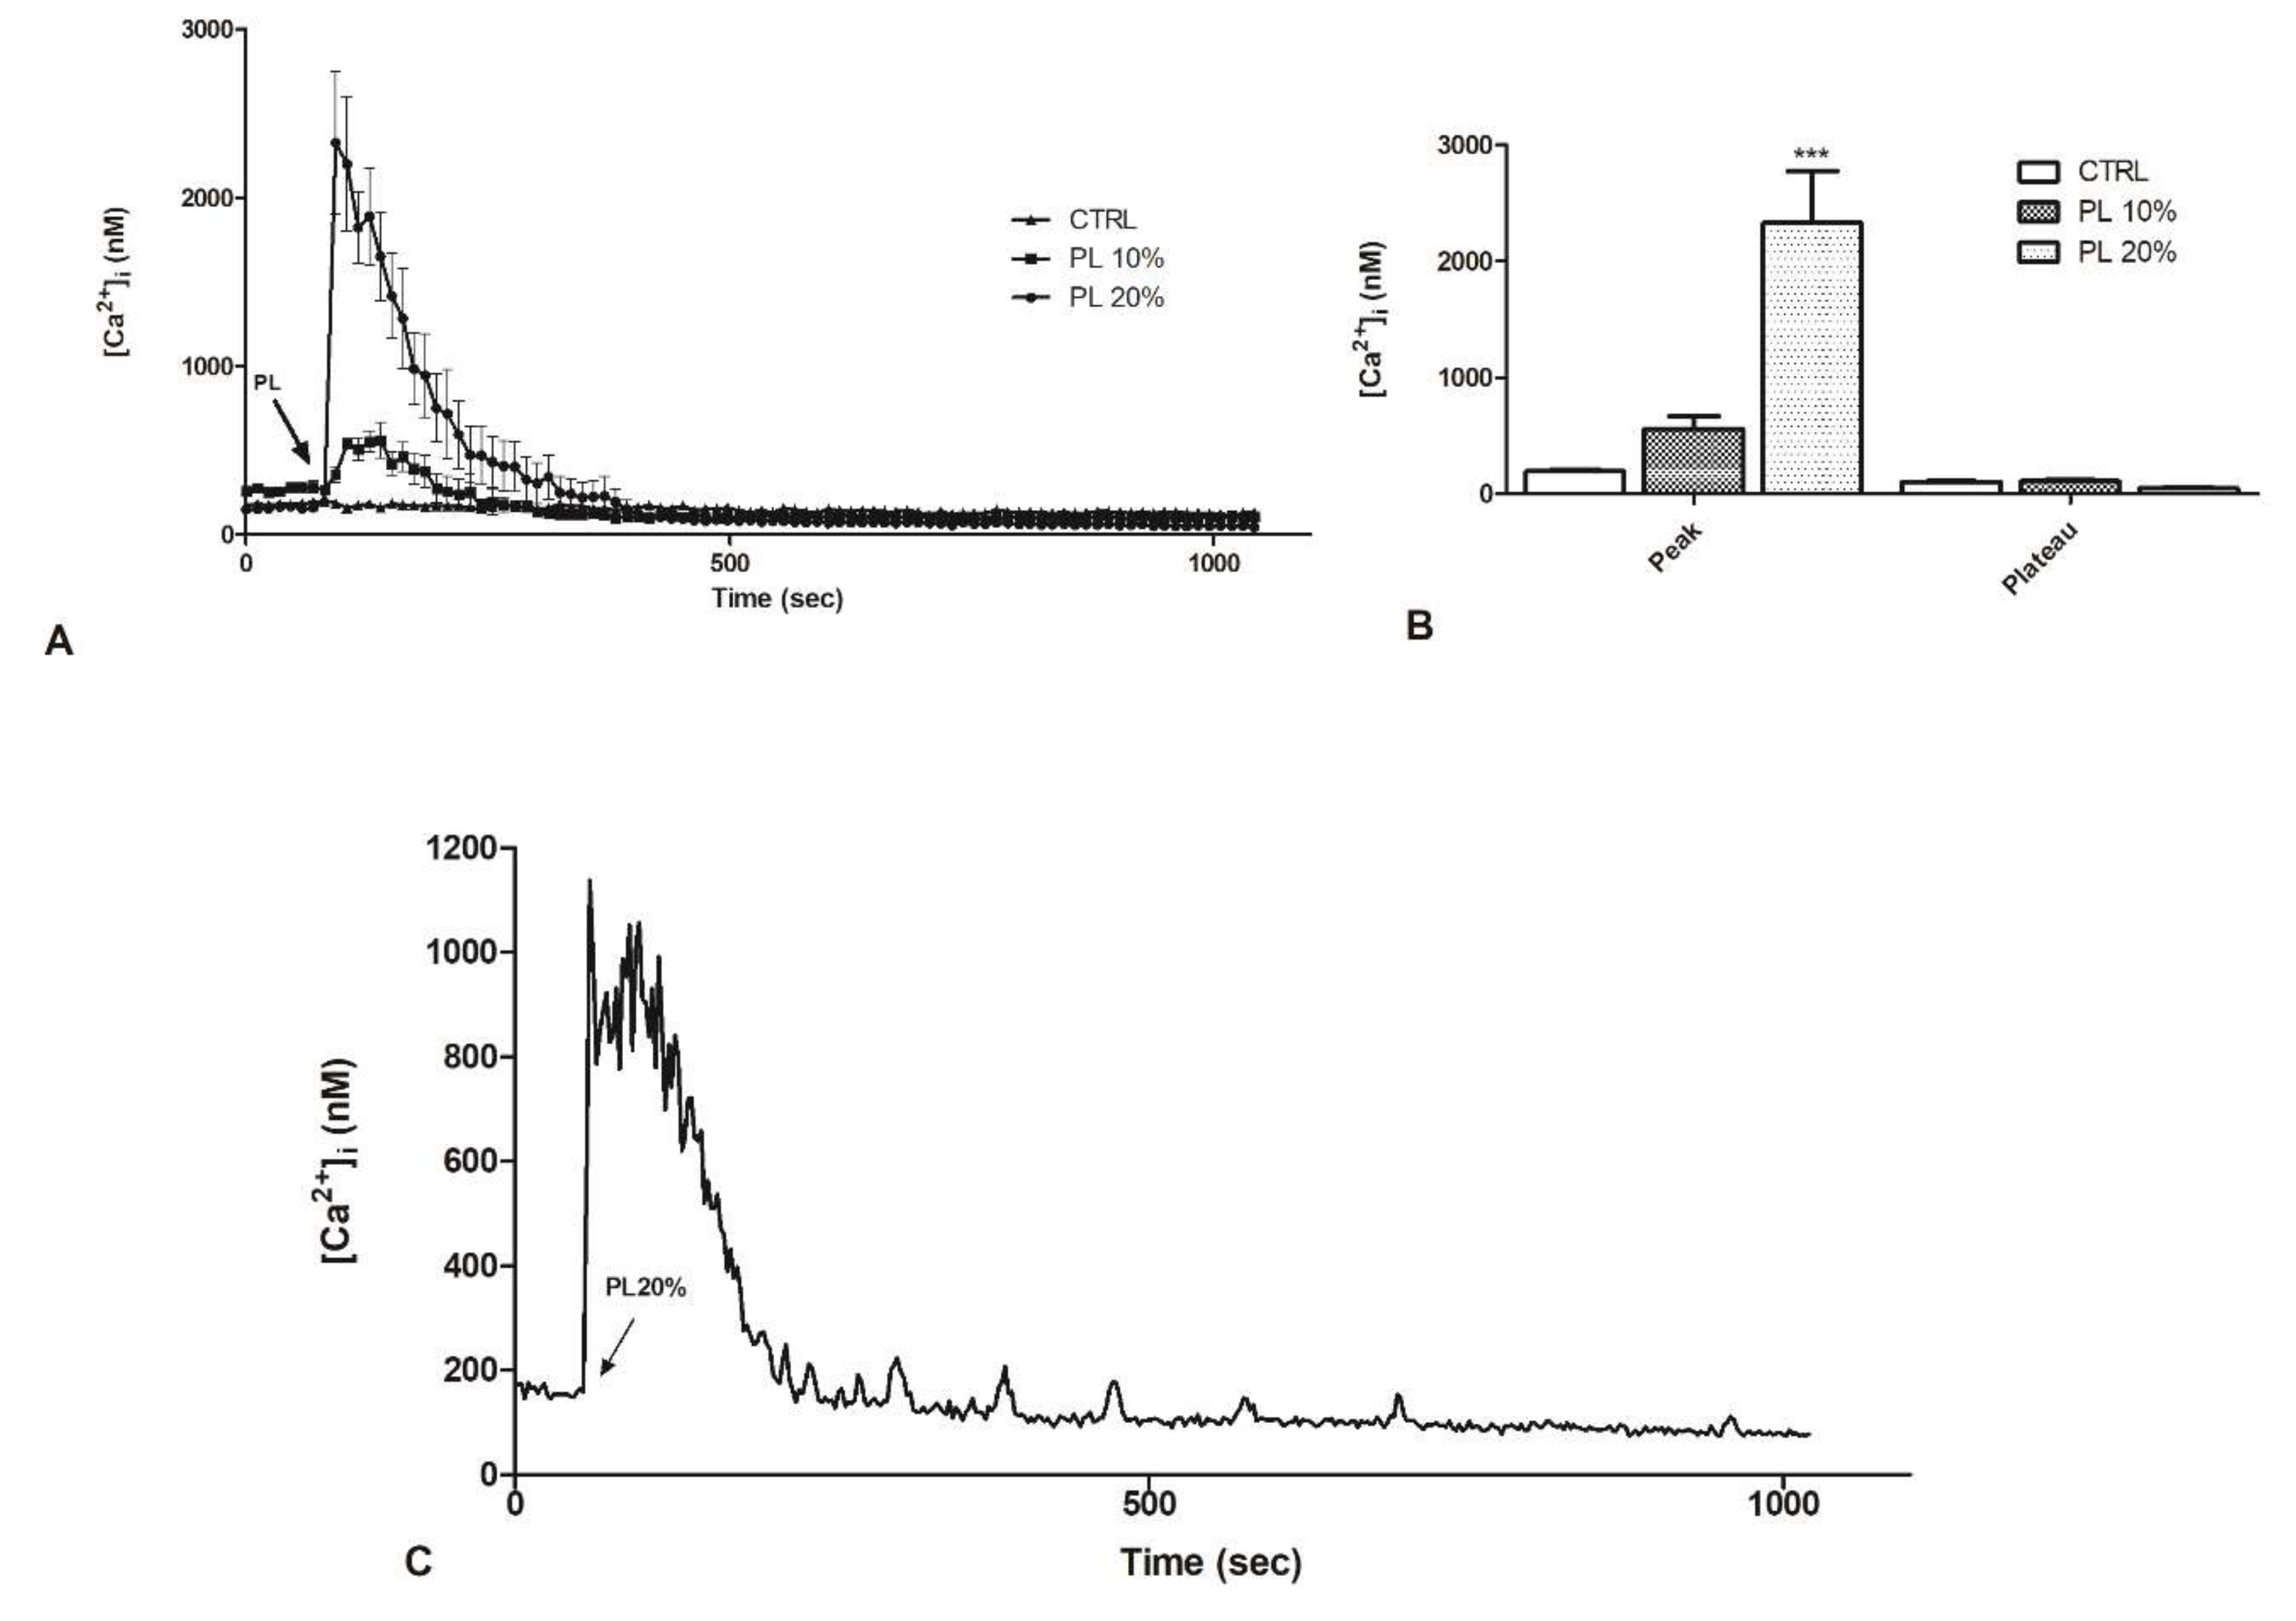
2.2. PL Induces Ca2+ Signals in a Dose-Dependent Manner

Based on the previously observed fundamental role of Ca2+ in the wound closure, we investigated whether and how PL determines variations in [Ca2+]i. Therefore, we assessed intracellular Ca2+ variations, by using time-lapse confocal microscopy imaging of bEND5 cells loaded with the fluorescent Ca2+ probe Fluo-3/AM.
The analysis of confocal imaging of Fluo-3/AM loaded bEND5 cells exposed to 20% PL revealed a single, large [Ca2+]i spike. After PL exposure, the spike started immediately reaching the peak and returned to basal line in approximately 400 s (Figure 2A,B). Ten percent PL induced only a smaller peak, and the [Ca2+]i returned to the basal line in 250 s (Figure 2A,B). These observations showed that [Ca2+]i, sampled in bEND5 cells at 10 s intervals, did not undergo any spontaneous oscillations in control conditions (Figure 2A).
We decided to investigate if the increase in [Ca2+]i had fluctuations over time; hence, we repeated the analysis by confocal imaging of Fluo-3/AM loaded bEND5 cells exposed to 20% PL at 1 s intervals. When the peak was reached, oscillations were observed for about 100 s. Subsequently, there was a decrease until reaching the basal level. However, before the signal stabilization, small oscillations could be observed that gradually decreased in intensity and frequency (Figure 2C).

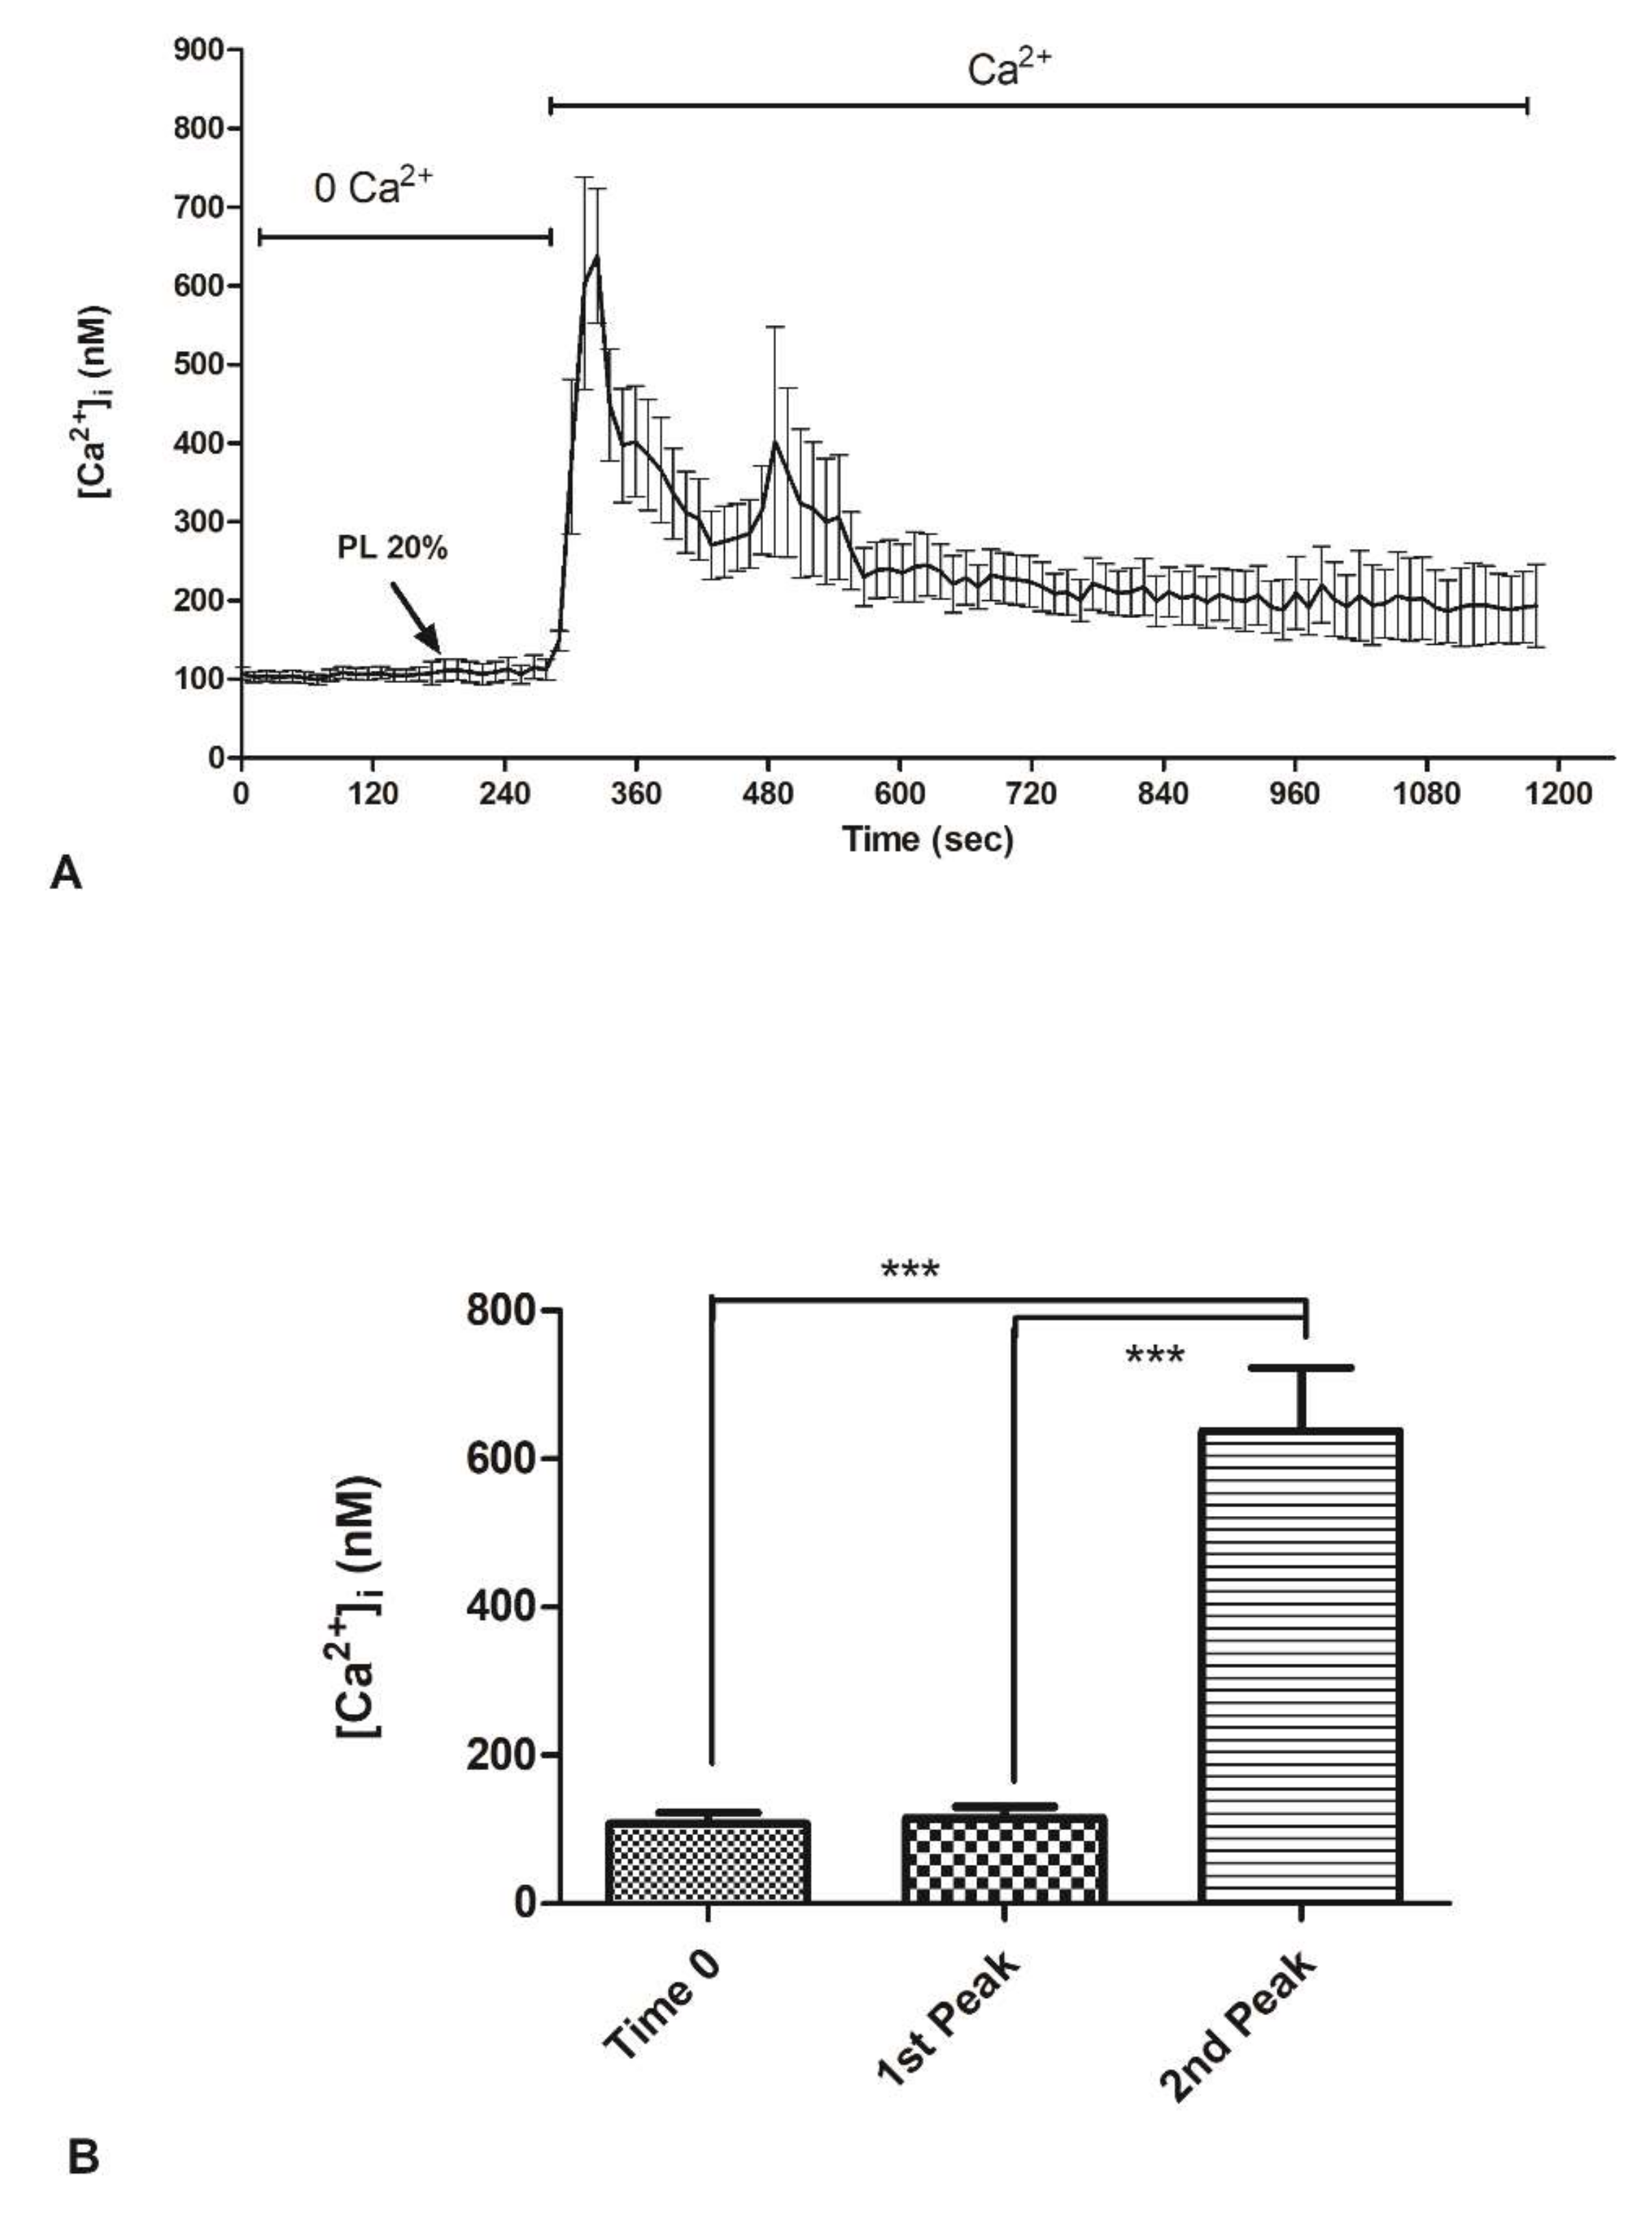
2.3. Contribution of Extracellular Ca2+ to Cytosolic Increase

In order to assess which Ca2+ sources underlie these Ca2+ signals, 20% PL was applied in the absence of external Ca2+ (0Ca2+), after which Ca2+ was reintroduced in the continued presence of the agonist. PL did not cause any increase in [Ca2+]i under 0Ca2+ conditions, which reflects the fundamental role of extracellular Ca2+ (Figure 3A,B). The subsequent restitution of Ca2+ to the medium induced an elevation [Ca2+]i which depends on extracellular Ca2+ entry (Figure 3A,B).
We have knowledge that transient receptor potential cation channel, subfamily M, member 2 (TRPM2) is highly expressed in endothelial cells where it mediates redox-activated Ca2+ entry [20]. Hence, based on our data defining ROS production after PL treatment, to better define the Ca2+ entry from the extracellular environment under PL exposure, we focused on the role of TRPM2 channel.
Confocal imaging showed that bEND5 cell preincubation (30 min) with 10 µM econazole, a TRPM2 inhibitor [21], was able to reduce the [Ca2+]i increase caused by 20% PL exposure (Figure 4A), determining a significantly reduction of the amplitude of Ca2+-peak in response to PL (Figure 4B). The depletion of TRPM2 channel by RNAi (Figure 4C) determines the complete abrogation of the peak in [Ca2+]i increase after 20% PL exposure (Figure 4D,E).

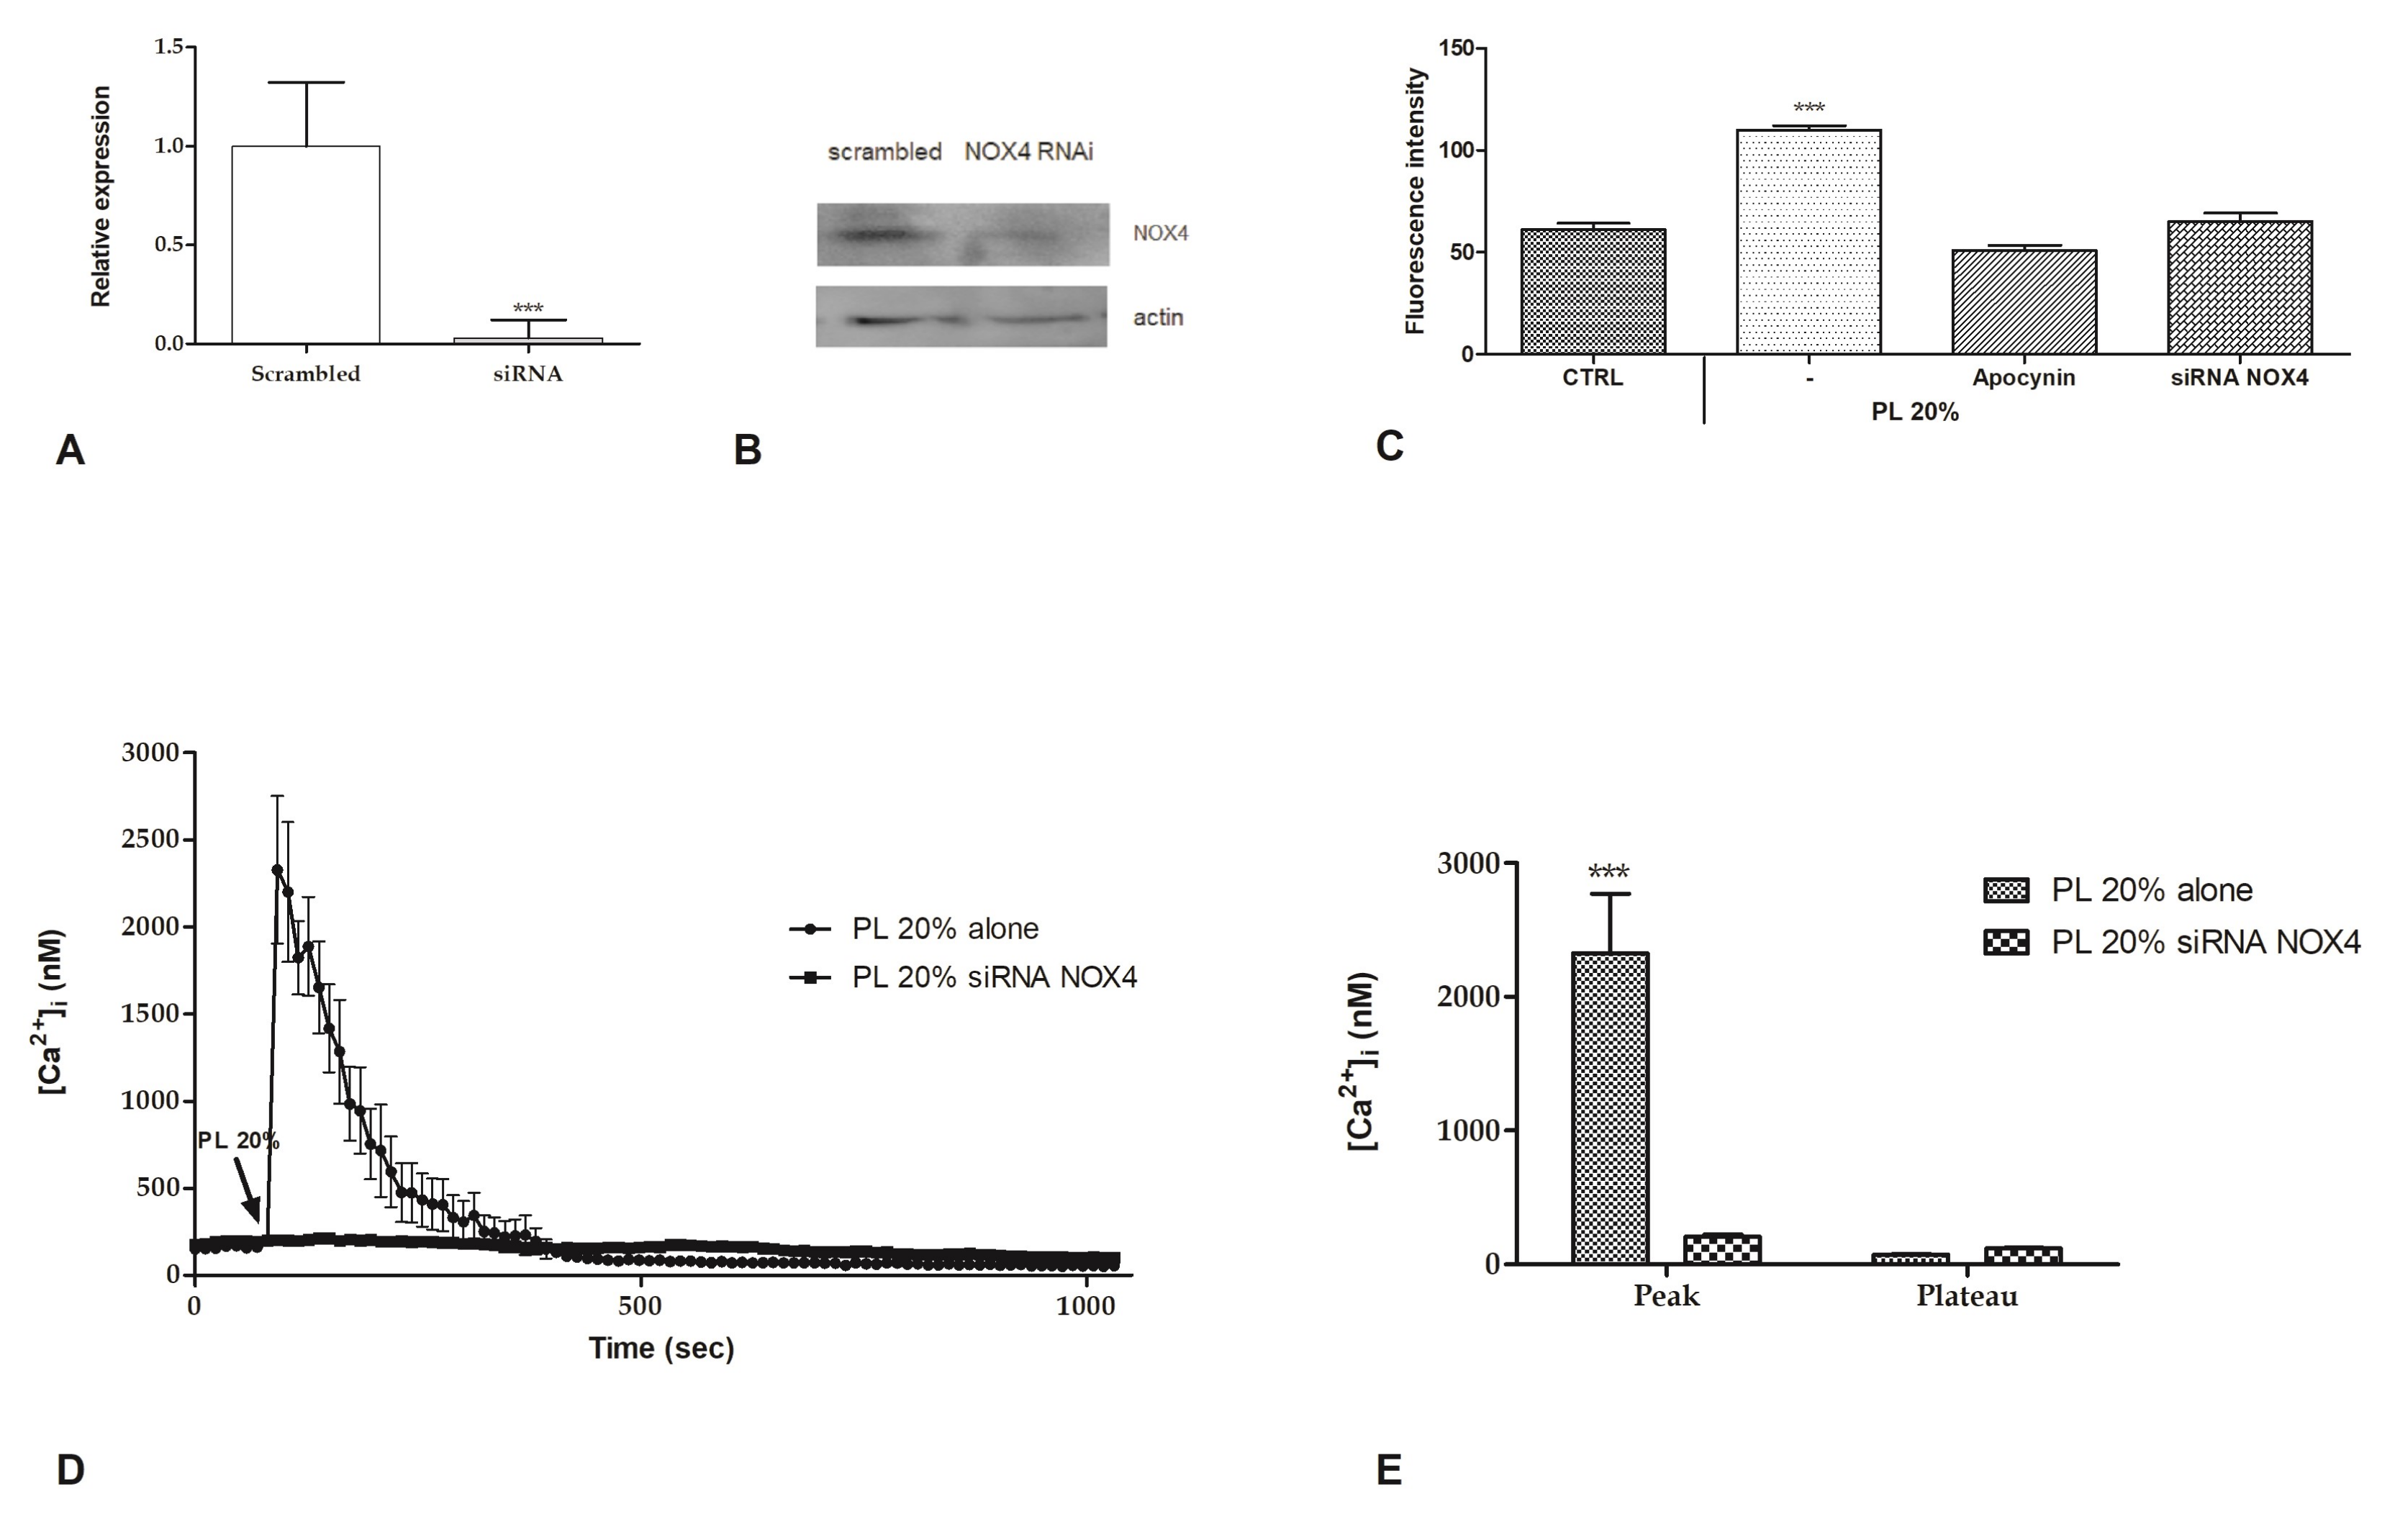
2.4. Intracellular ROS Generation

It is commonly known that some growth factors (GFs), such as PDGF [22] and VEGF [23], are able to stimulate the generation of intracellular ROS by activation of NAPH oxidases complex [24]. To determine if also treatment with PL is able to induce this pathway, we assessed the generation of intracellular ROS after addition of 20% PL by using dihydrorhodamine-123 (DHR-123). Intracellular levels of ROS were revealed using the fluorescent dye DHR-123, which is converted to fluorescent rhodamine-123 upon reaction with ROS. We observed that PL induces the increase of intracellular ROS. Data were confirmed by the absence of this rise in presence of 50 µM apocynin, a NOX (NADPH oxidase) inhibitor, or siRNA for NOX4 (Figure 5A–C).
Confocal imaging of bEND5 cells treated with RNAi for NOX4 showed that the [Ca2+]i increase caused by 20% PL exposure was completely abrogated (Figure 5D,E).

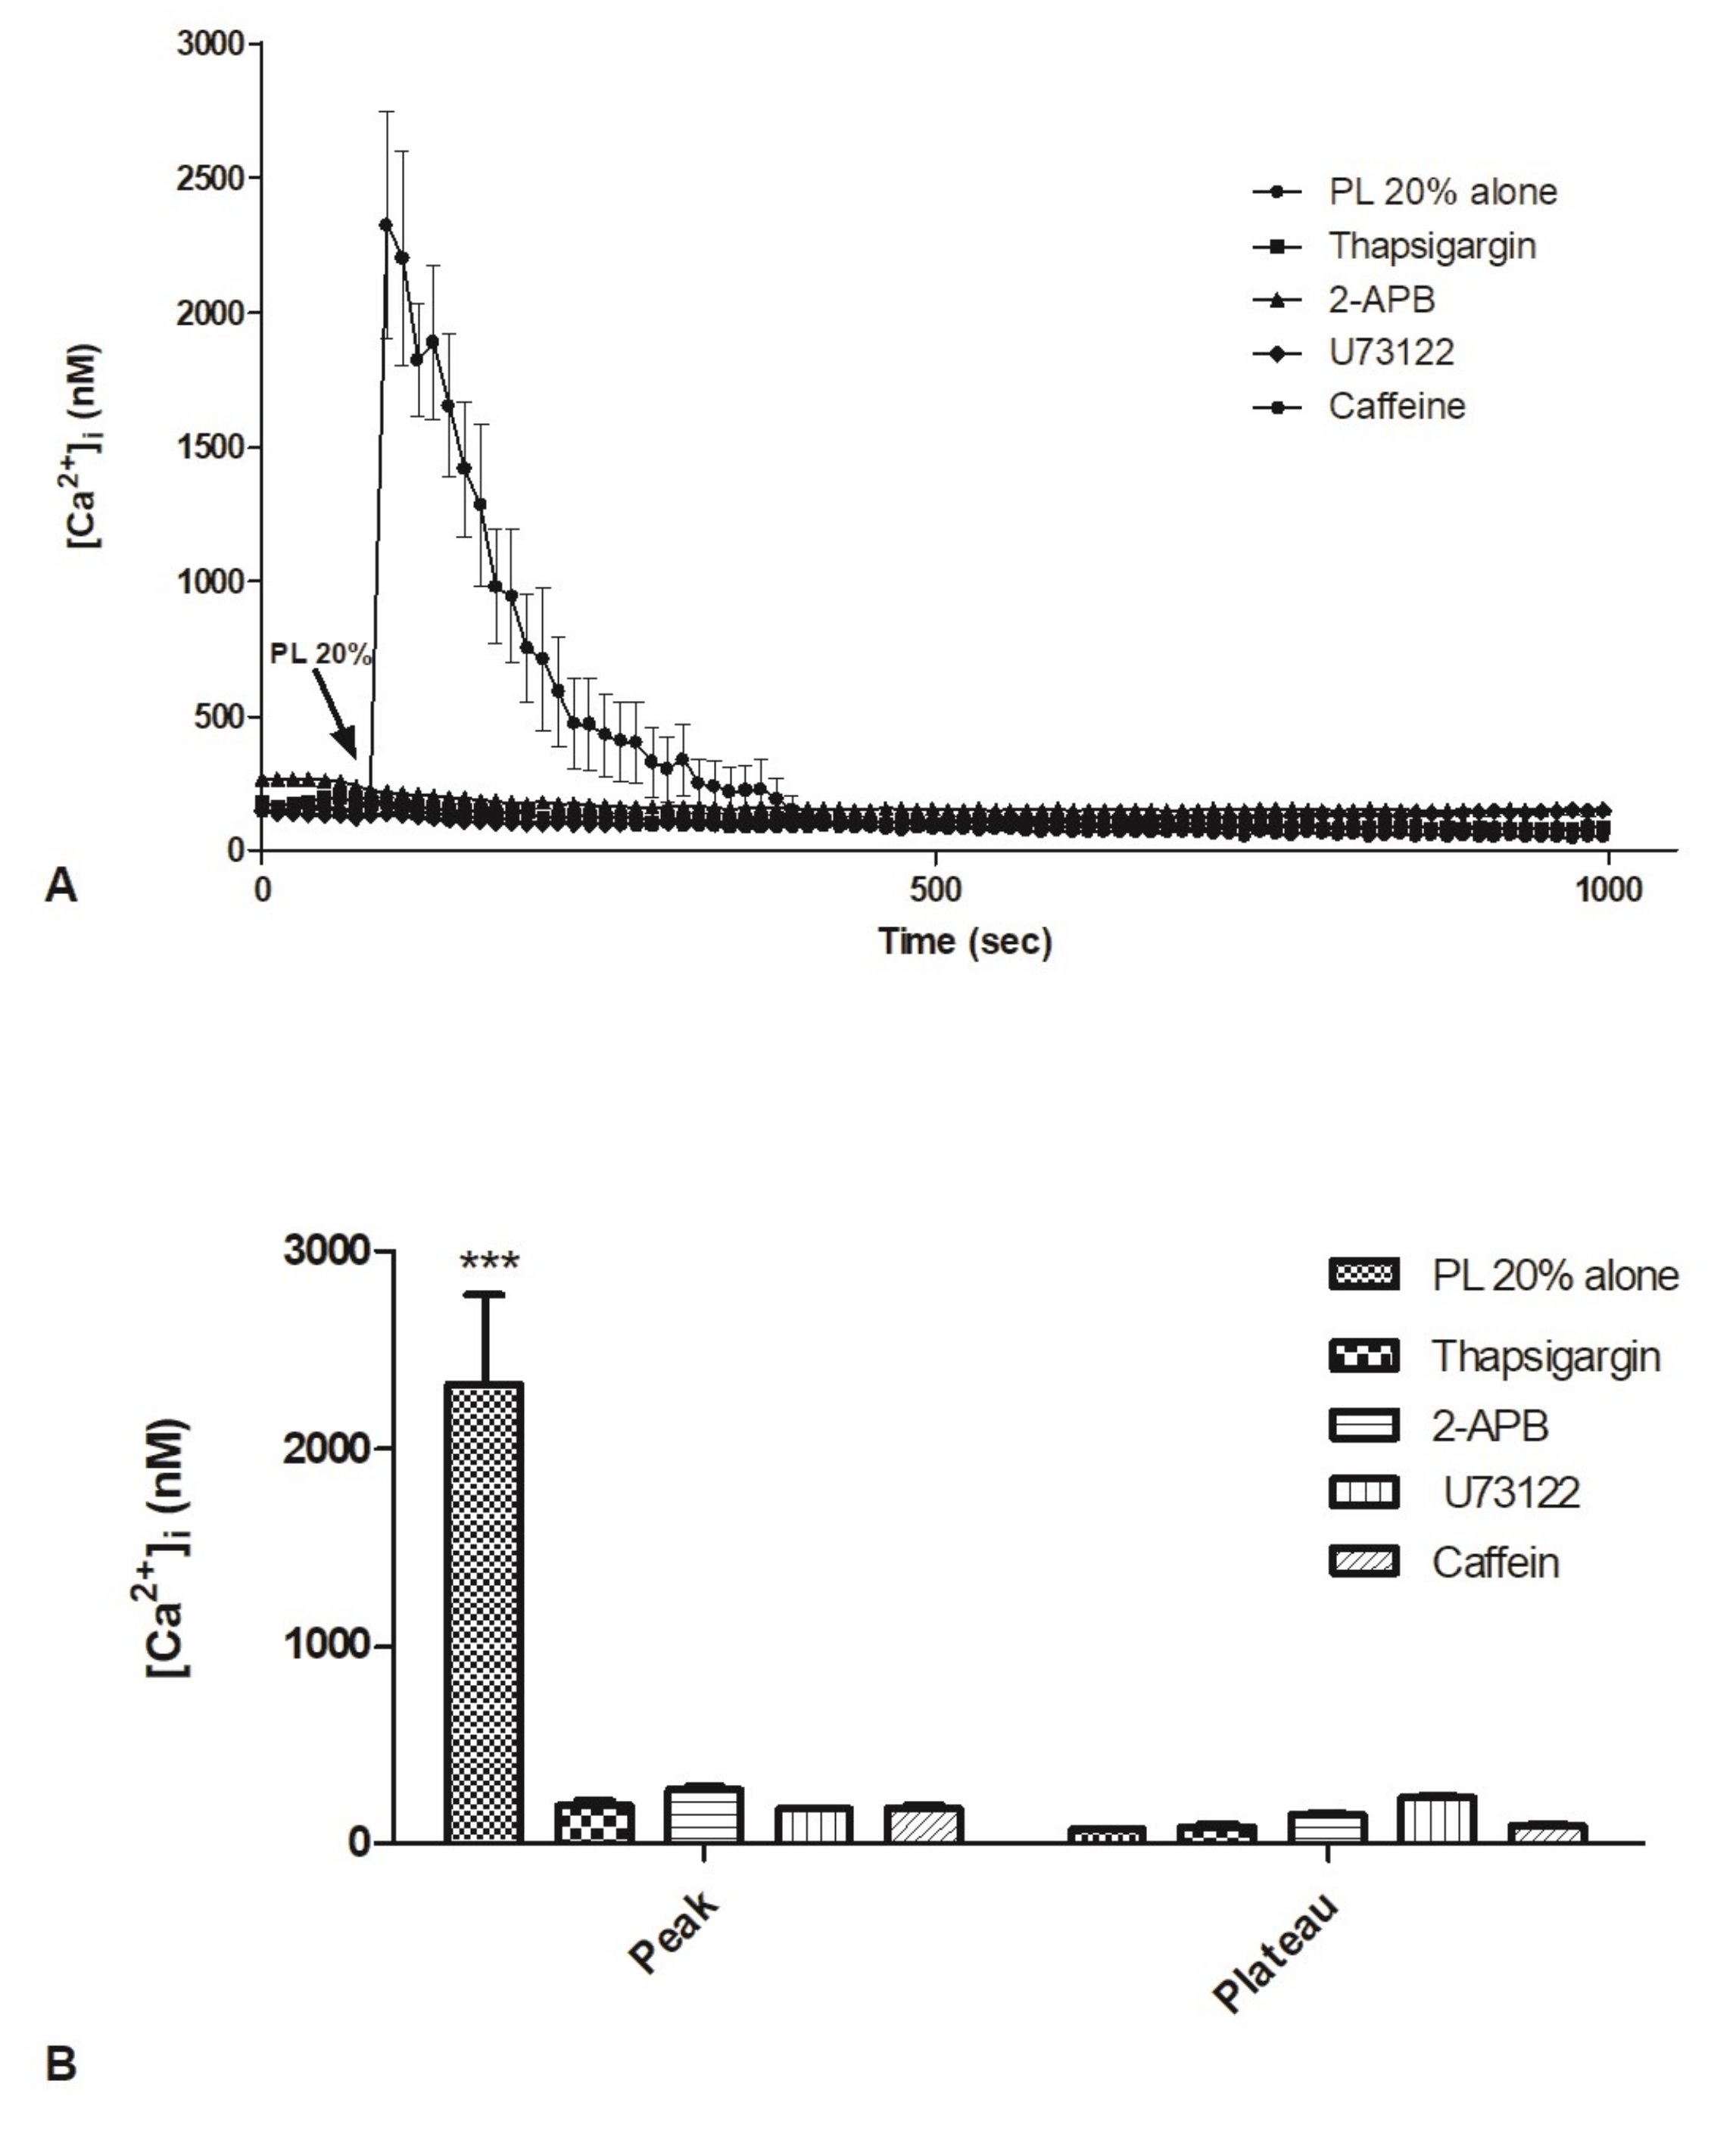
2.5. Contribution of Intracellular Stores to Cytosolic Ca2+ Increase

It is well known that GFs binding to their specific receptors, belonging to G-protein-coupled receptors (GPCRs) and tyrosine kinase receptors (TKRs) families, determine an increase in [Ca2+]i, through the engagement of phospholipase C (PLC) that leads to PIP2 hydrolysis in InsP3 and DAG.
For this reason, we focused on the contribution of the ER in the variation of [Ca2+]i in response to PL. For this purpose, we utilized a panel of inhibitors, i.e., thapsigargin, 2-APB, U73122, and caffeine.
Confocal imaging showed that bEND5 cell incubation with thapsigargin (5 µM, 30 min), a non-competitive inhibitor of the sarco/endoplasmic reticulum Ca2+ ATPase, was able to completely reduce the [Ca2+]i increase triggered by PL exposure (Figure 6A,B).
2-APB (50 µM, 30 min preincubation) and caffeine (10 mM, 30 min preincubation), two different blockers of InsP3R [25,26], induced the same effects, reducing the amplitude of the peak of the Ca2+ response to PL (Figure 6A,B).
Likewise, U73122 (10 µM, 30 min preincubation), a PLC inhibitor [27], determined a significant decrease of PL-induced rise in [Ca2+]i (Figure 6A,B).
Cell incubation with vehicle DMSO used alone is ineffective on Ca2+.

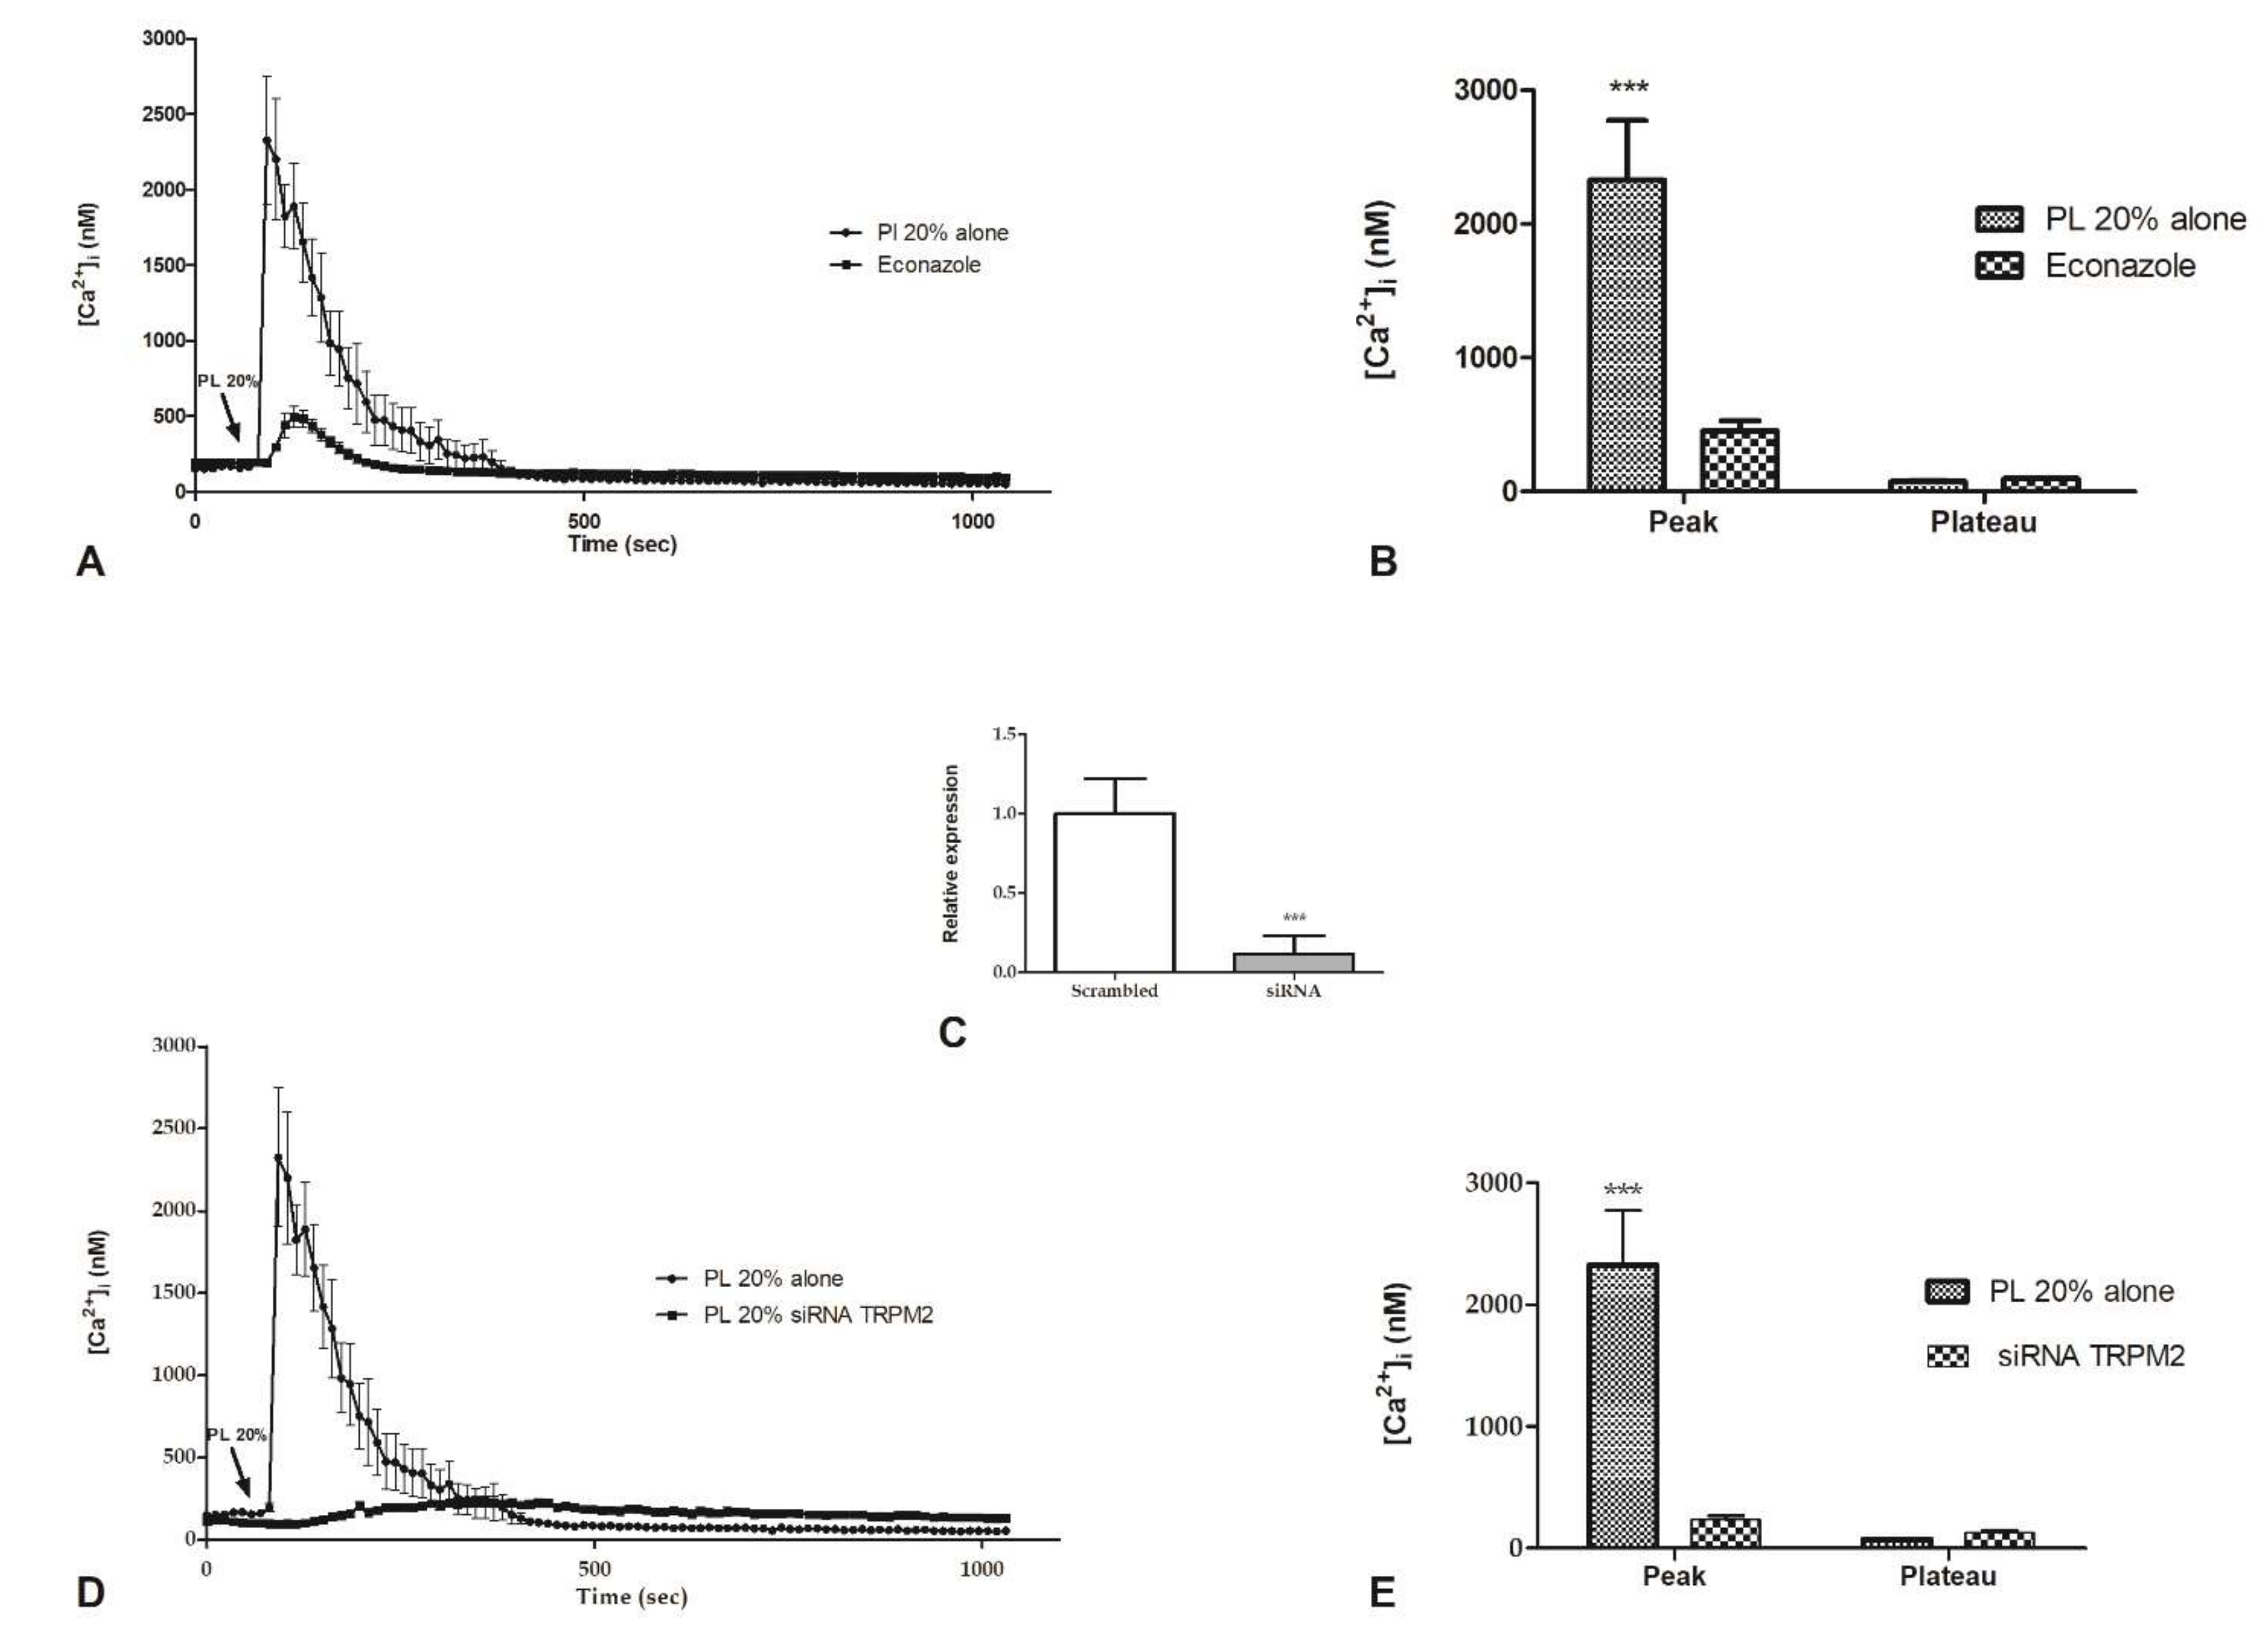
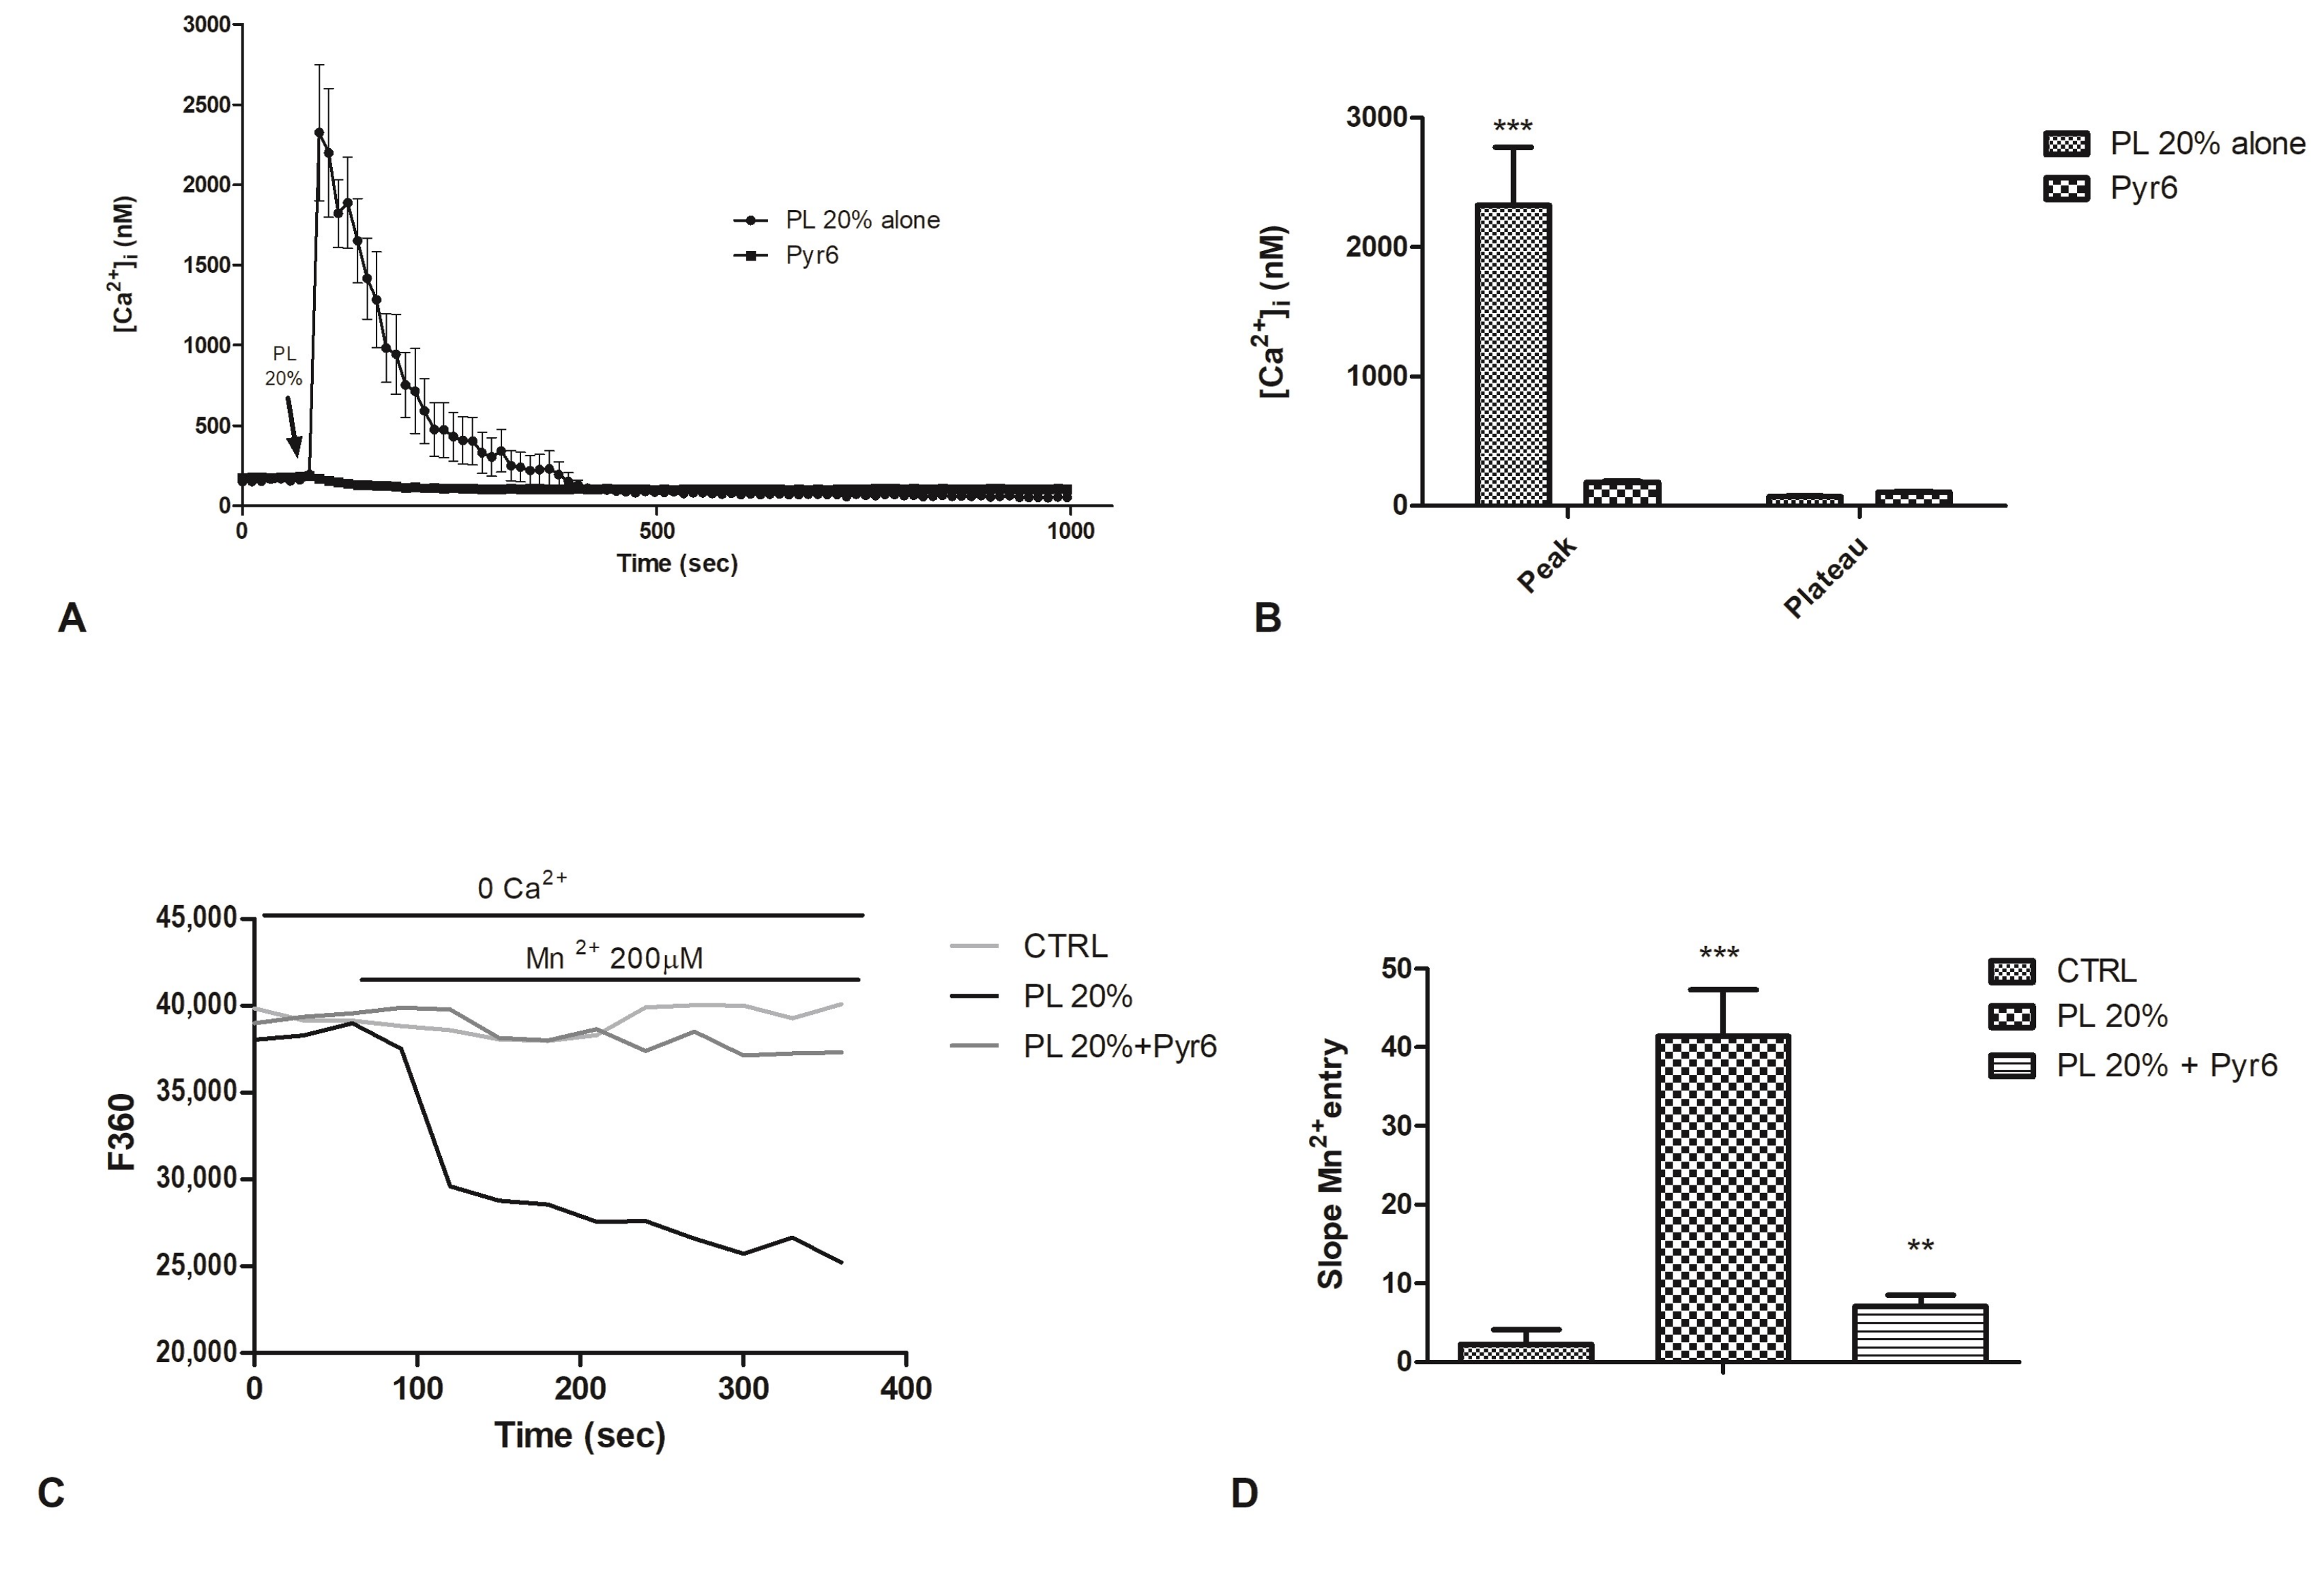
2.6. Involvement of Store-Operated Ca2+ Entry

The Ca2+ pool reduction in the ER, following to InsP3-dependent Ca2+ release, led to the activation of store-operated Ca2+ entry (SOCE) [28,29]. Therefore, we investigated the involvement of SOCE in PL-stimulated cells. Pyr6 (1µM, 30 min), a selective inhibitor of Orai1 channels [30,31], caused a complete decrease of peak phase of PL-boosted elevation in [Ca2+]i (Figure 7A,B).
As recently discussed, in endothelial cells, resting conditions determine the partial activation of SOCE, leading to a control of ER Ca2+ refilling in bEND5 cells [32]. For this reason, to corroborate Pyr6 data, we then utilized the Mn2+-quenching technique, an established tool to monitor agonist-induced Ca2+ entry in vascular endothelial cells to assess whether 1) SOCE is active in un-stimulated cells and 2) PL stimulation may affect the rate of SOCE activation in bEND5 cells [33,34].
It is possible to use Mn2+ as a consistent surrogate of Ca2+ because it flows through most Ca2+-permeable channels. Considering the unidirectional influx of Mn2+, quenching of Fura-2 fluorescence, may be used as an index for stimulated cation entry.
Figure 7C,D shows that a Ca2+-free extracellular solution (0Ca2+ 0EGTA), containing 200 µM Mn2+, enhanced the quenching of Fura-2 fluorescence, suggesting a constitutive Ca2+ entry pathway in bEND5 cells [32]. To assess whether PL stimulates SOCE in bEND5 cells, PL 20% was added once the rate of basal quenching had been established, and in this condition, we observed an increase in the slope of the quenching curve (Figure 7C,D). The pharmacological blockade of SOCE with Pyr6 prevented PL-induced divalent cation entry (Figure 7C,D).

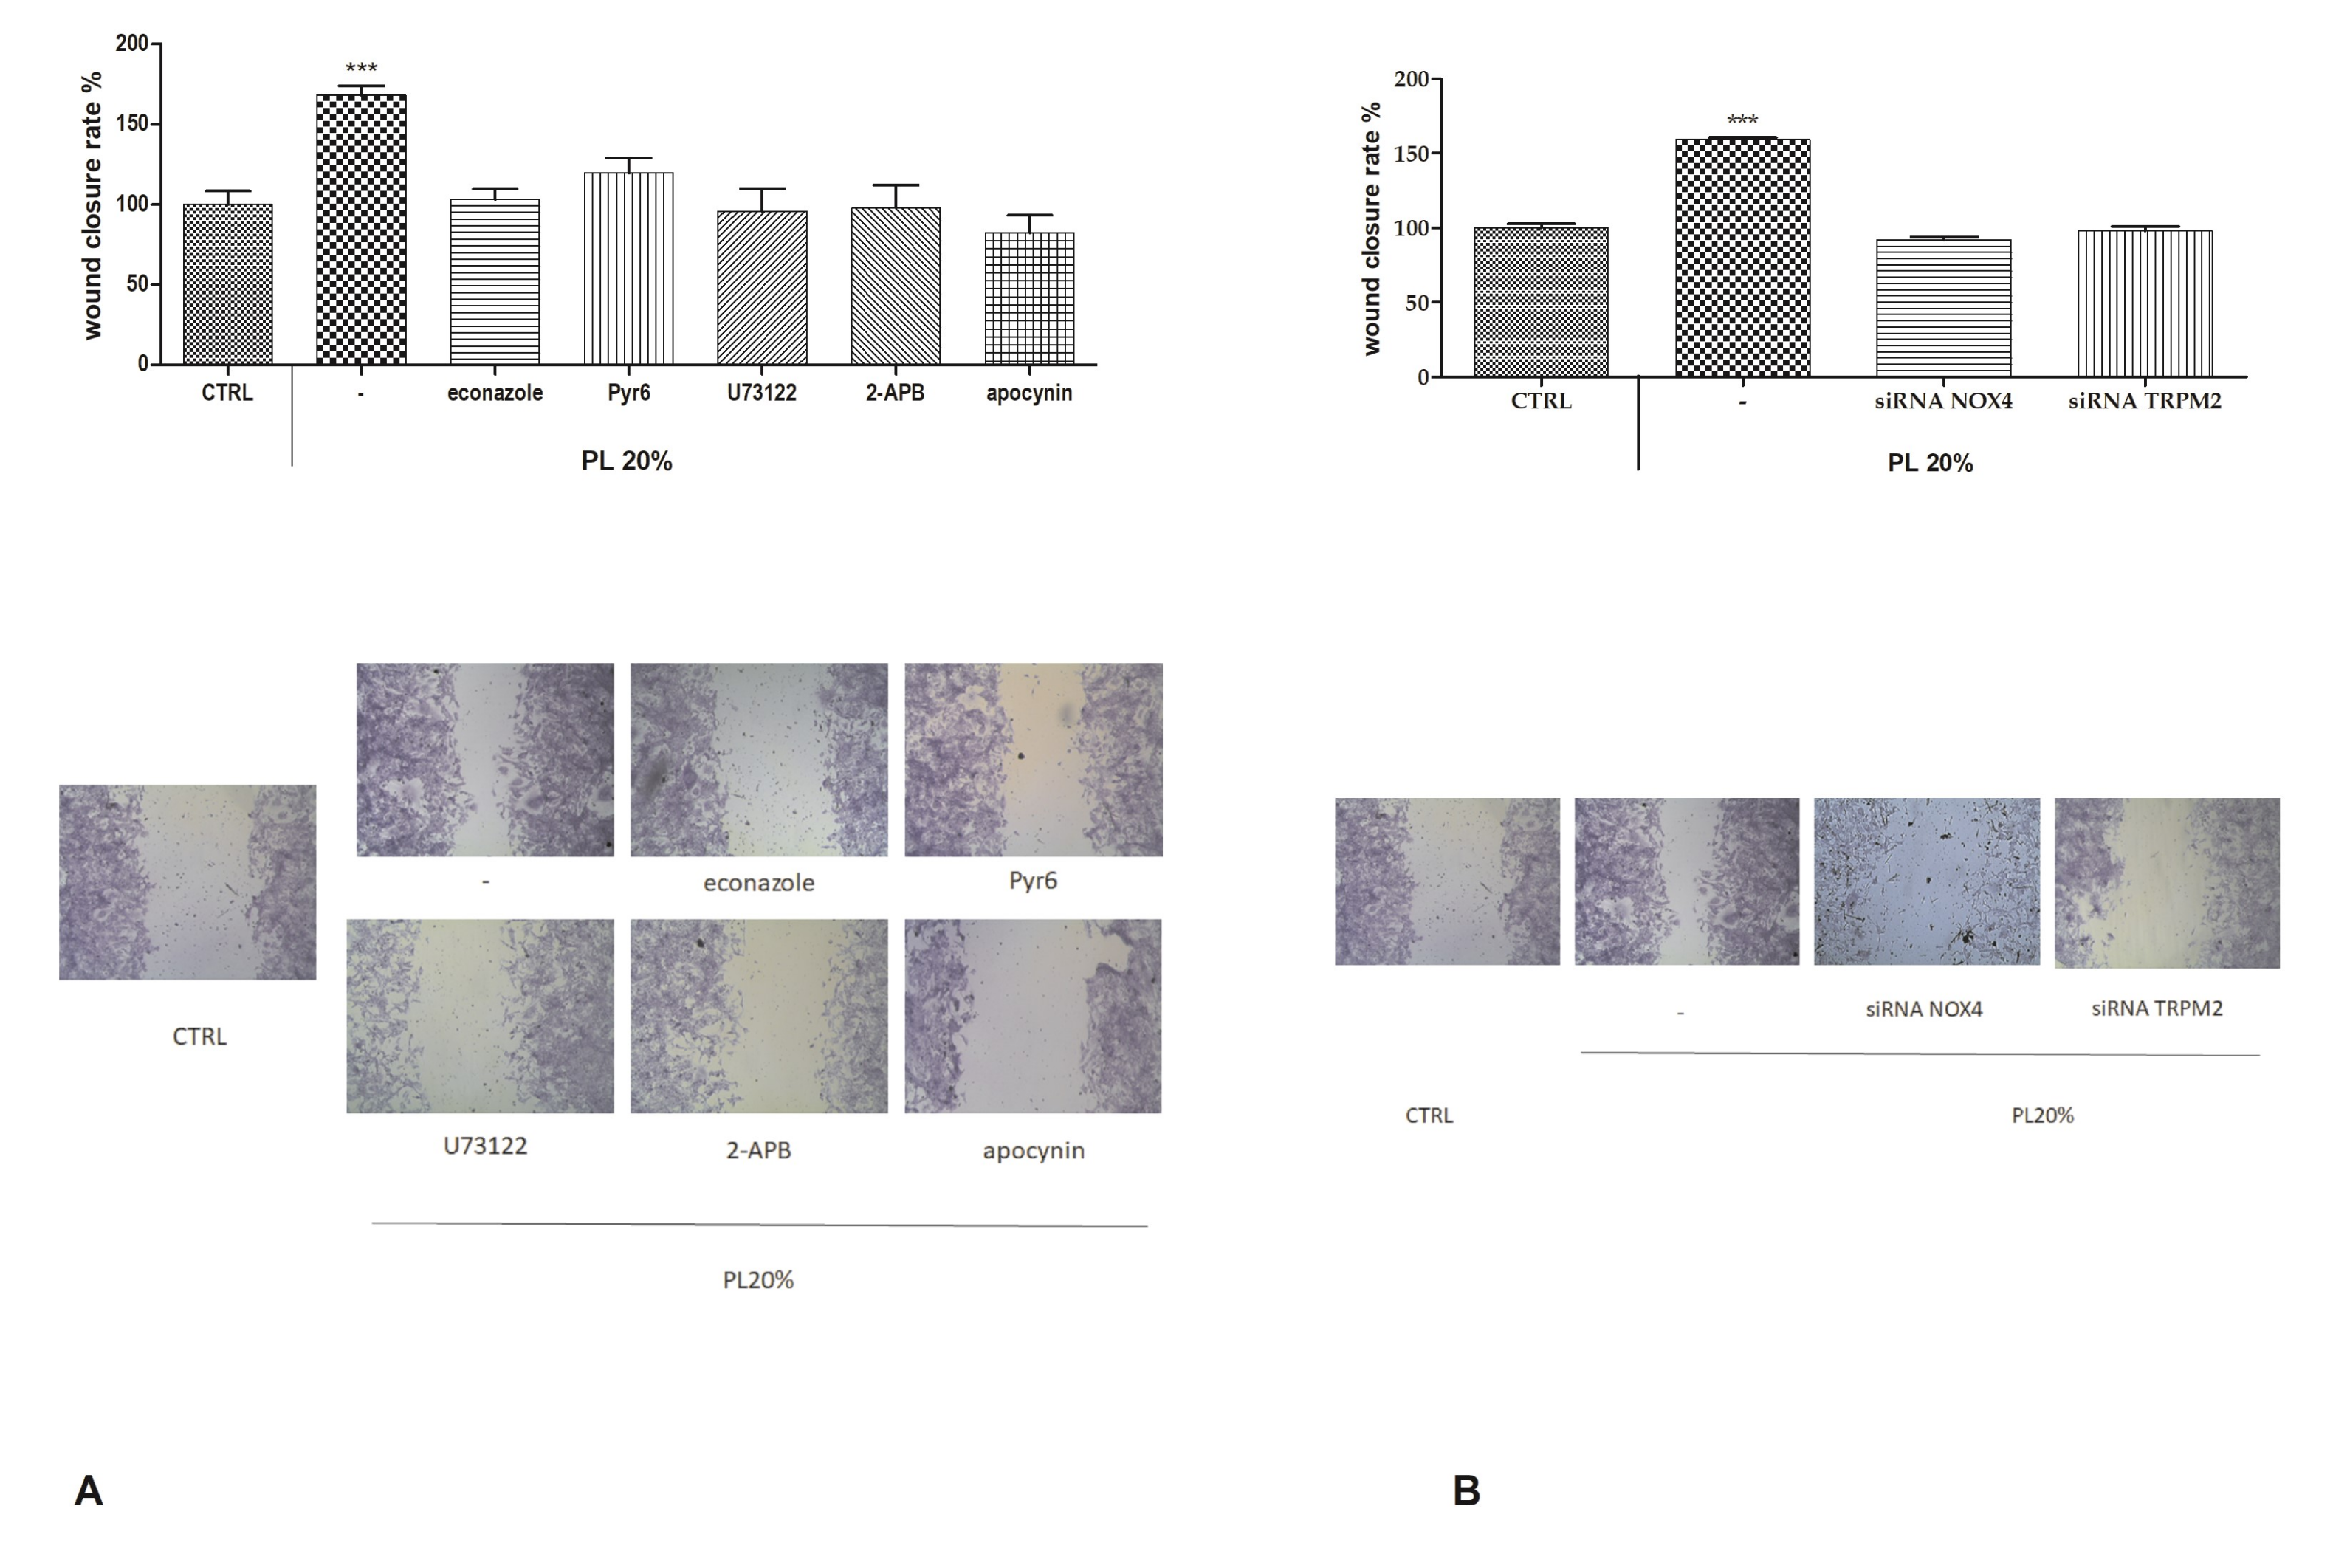
2.7. Functional Role of PL-Induced Tissue Regeneration

To further confirm our observations, we repeated the scratch wound assay under different conditions of inhibition, i.e., econazole and siRNA for TRPM2 channel, Pyr6, U73122, 2-APB, and apocynin and siRNA for NOX4. In presence of all of these, we could observe a significant reduction of the wound closure rate (Figure 8).

3. Discussion

Wound repair is a dynamic process during which crucial signaling pathways are regulated by growth factors and cytokines released by several kinds of cells directly involved in the healing process.
However, the limited applications and heterogeneous clinical results [35] of single growth factors in wound healing encouraged the use of a mixture of bioactive molecules, such as platelet derivatives, for best results in wound repair.
PL, obtained by repeated freezing/thawing of blood platelets, showed to release more growth factors compared to platelet-rich plasma [36]. Moreover, to standardize the PL product, we obtained it from a pool of healthy donors, to minimize individual variability. We have previously validated that PDGF-AB amounts, one of most abundant growth factors in PL, resulted in the same order of size of previous studies on PL [37].
We have already observed as cell viability and proliferation, cell migration induction, and scratch wound assay, revealed that 20% PL promotes cellular activity, accelerating in vitro wound healing in various cell types [8,11,12,13,38,39], including endothelial cells [8].
The integrity of an endothelial monolayer may be compromised by either disturbed blood flow or pathological conditions [17]. Moreover, the prolonged and/or repeated exposure of the endothelial monolayer to well-known cardiovascular risk factors (i.e., hypertension, hyperlipidemia, hypercholesterolemia, smoking, and ageing) has a dramatic impact on vascular endothelium [17]. Vascular injury causes endothelial cells to lose integrity, progress to senescence, undergo apoptosis, and ultimately slough off the vessel wall into the bloodstream. Endothelial integrity may then be disturbed by several surgical procedures aiming at restoring blood flow. It is therefore not surprising that novel approaches are crucial for clinicians, to achieve the early restoration of a fully competent endothelium in order to gain more effective long-term results after vascular regenerative surgery [17].
Intracellular Ca2+ signals play a central role for control endothelial survival, proliferation, motility, and differentiation [29]. Ca2+ entry from the extracellular environment usually triggers long-lasting cytosolic Ca2+ signals of smaller amplitude compared to the Ca2+ release-related spikes. The best-characterized endothelial Ca2+ channels are voltage independent, even if voltage-dependent Ca2+ fluxes have been described in primary endothelial cells [29]. Moreover, store-operated calcium entry (SOCE) is of relevance to sustain endothelial proliferation, migration, gene expression, and NO synthesis [40]. Likewise, it is well known that Ca2+ plays a crucial role in guiding the tissue regeneration mechanism [41].
In this study, we investigated the role of Ca2+ signaling in the PL-driven endothelial healing process. Immediately after 20% PL addition, it was possible to detect a huge increase in [Ca2+]i level, characterized by a 100 sec oscillations peak phase, followed by a decrease and stabilization phase also featured by the presence of less intense and less frequent oscillations. This increase was completely prevented by using different inhibitors.
We observed that in absence of Ca2+ in the extracellular space, the PL-induced signaling cascade was not triggered, but reestablishment of basal [Ca2+]e generates again a Ca2+ response observable by the presence of two spikes. These findings demonstrate that the onset of the Ca2+ increase after PL addiction depend on Ca2+ influx from extracellular space that is required to sustain the intracellular Ca2+ signal.
In this Ca2+ influx plays a pivotal role the TRPM2 channel that is well known to be activated by intracellular ROS. PL, due to its growth factors, is able to generate ROS in the intracellular space. GFs, after binding to their specific receptors, activate the NADPH oxidase complex that led to an increase of intracellular ROS, as we observed with DHR-123 fluorescent probe.
The existence of the link between PL, TRPM2, and intracellular ROS was confirmed by pharmacological inhibition through apocynin and by RNAi for NOX4, which lead to a reduction of Ca2+ entry.
Further, Ca2+ release from the ER is fundamental to sustain the PL-induced cytosolic Ca2+ increase. Our data suggest that depletion of Ca2+ in the ER after pretreatment with thapsigargin determined the complete abrogation of cytosolic Ca2+ rise.
Moreover, PLC/InsP3-mediated Ca2+ release showed a pivotal role in PL-induced endothelial tissue regeneration: the inhibition of PLCγ using U73122 [27] and of InsP3R by using 50 µM 2-APB [42] or 10 mM caffeine [43] determined a complete abolition of the PL-induced intracellular Ca2+ increase.
The activation of SOCE during PL-induced Ca2+ signaling was determined inhibiting Orai1 channel with Pyr6: in this condition, we could not observe any variations in [Ca2+]i. Such observation was confirmed by using the Mn2+-quenching technique [32] that revealed a Ca2+ influx pathway compatible with that of SOCE as a result of PL treatment in bEND5 cells. The slope of this Ca2+ entry was almost completely nullified in the presence of Pyr6.
Overall, these data suggest a role of intracellular Ca2+ stores in the PL-induced increase of cytosolic Ca2+: in particular, we observed an involvement of InsP3 and InsP3R in the transducing pathway of PL-induced Ca2+ spike; hence, we could speculate a role of PLC, through InsP3-sensitive channels. Moreover, the correct replenishment of the ER by SERCA pump and SOCE activation are equally fundamental.
Intracellular Ca2+ is essential for cell proliferation and motility [44], and its role in wound healing has been repetitively described, also in endothelial cells [45], while intracellular Ca2+ rises have been found to promote cell growth and movement throughout endothelial repair [46].
We have already described a correlation between Ca2+ dynamics and wound repair in studies on skin cells, such as keratinocytes and fibroblasts, where PL induced evidentCa2+ signals, and BAPTA-AM abrogated the PL effect on wound healing [12,38].
In our experiments, the functional significance of a Ca2+ toolkit was highlighted when performing the scratch wound assay in presence of different inhibitors or specific RNAi. In every condition, the wound closure rate was heavily reduced compared to the one given by PL. We also pointed out that the generation of intracellular ROS via NOX4, boosted by PL induction, is necessary for the activation of TRPM2 and the resulting Ca2+ entry from the extracellular space.
This is the first report investigating the PL-induced regulation of [Ca2+]i boosting wound repair in endothelial cell model. We can summarize our results as described in the following model (see Figure 9):
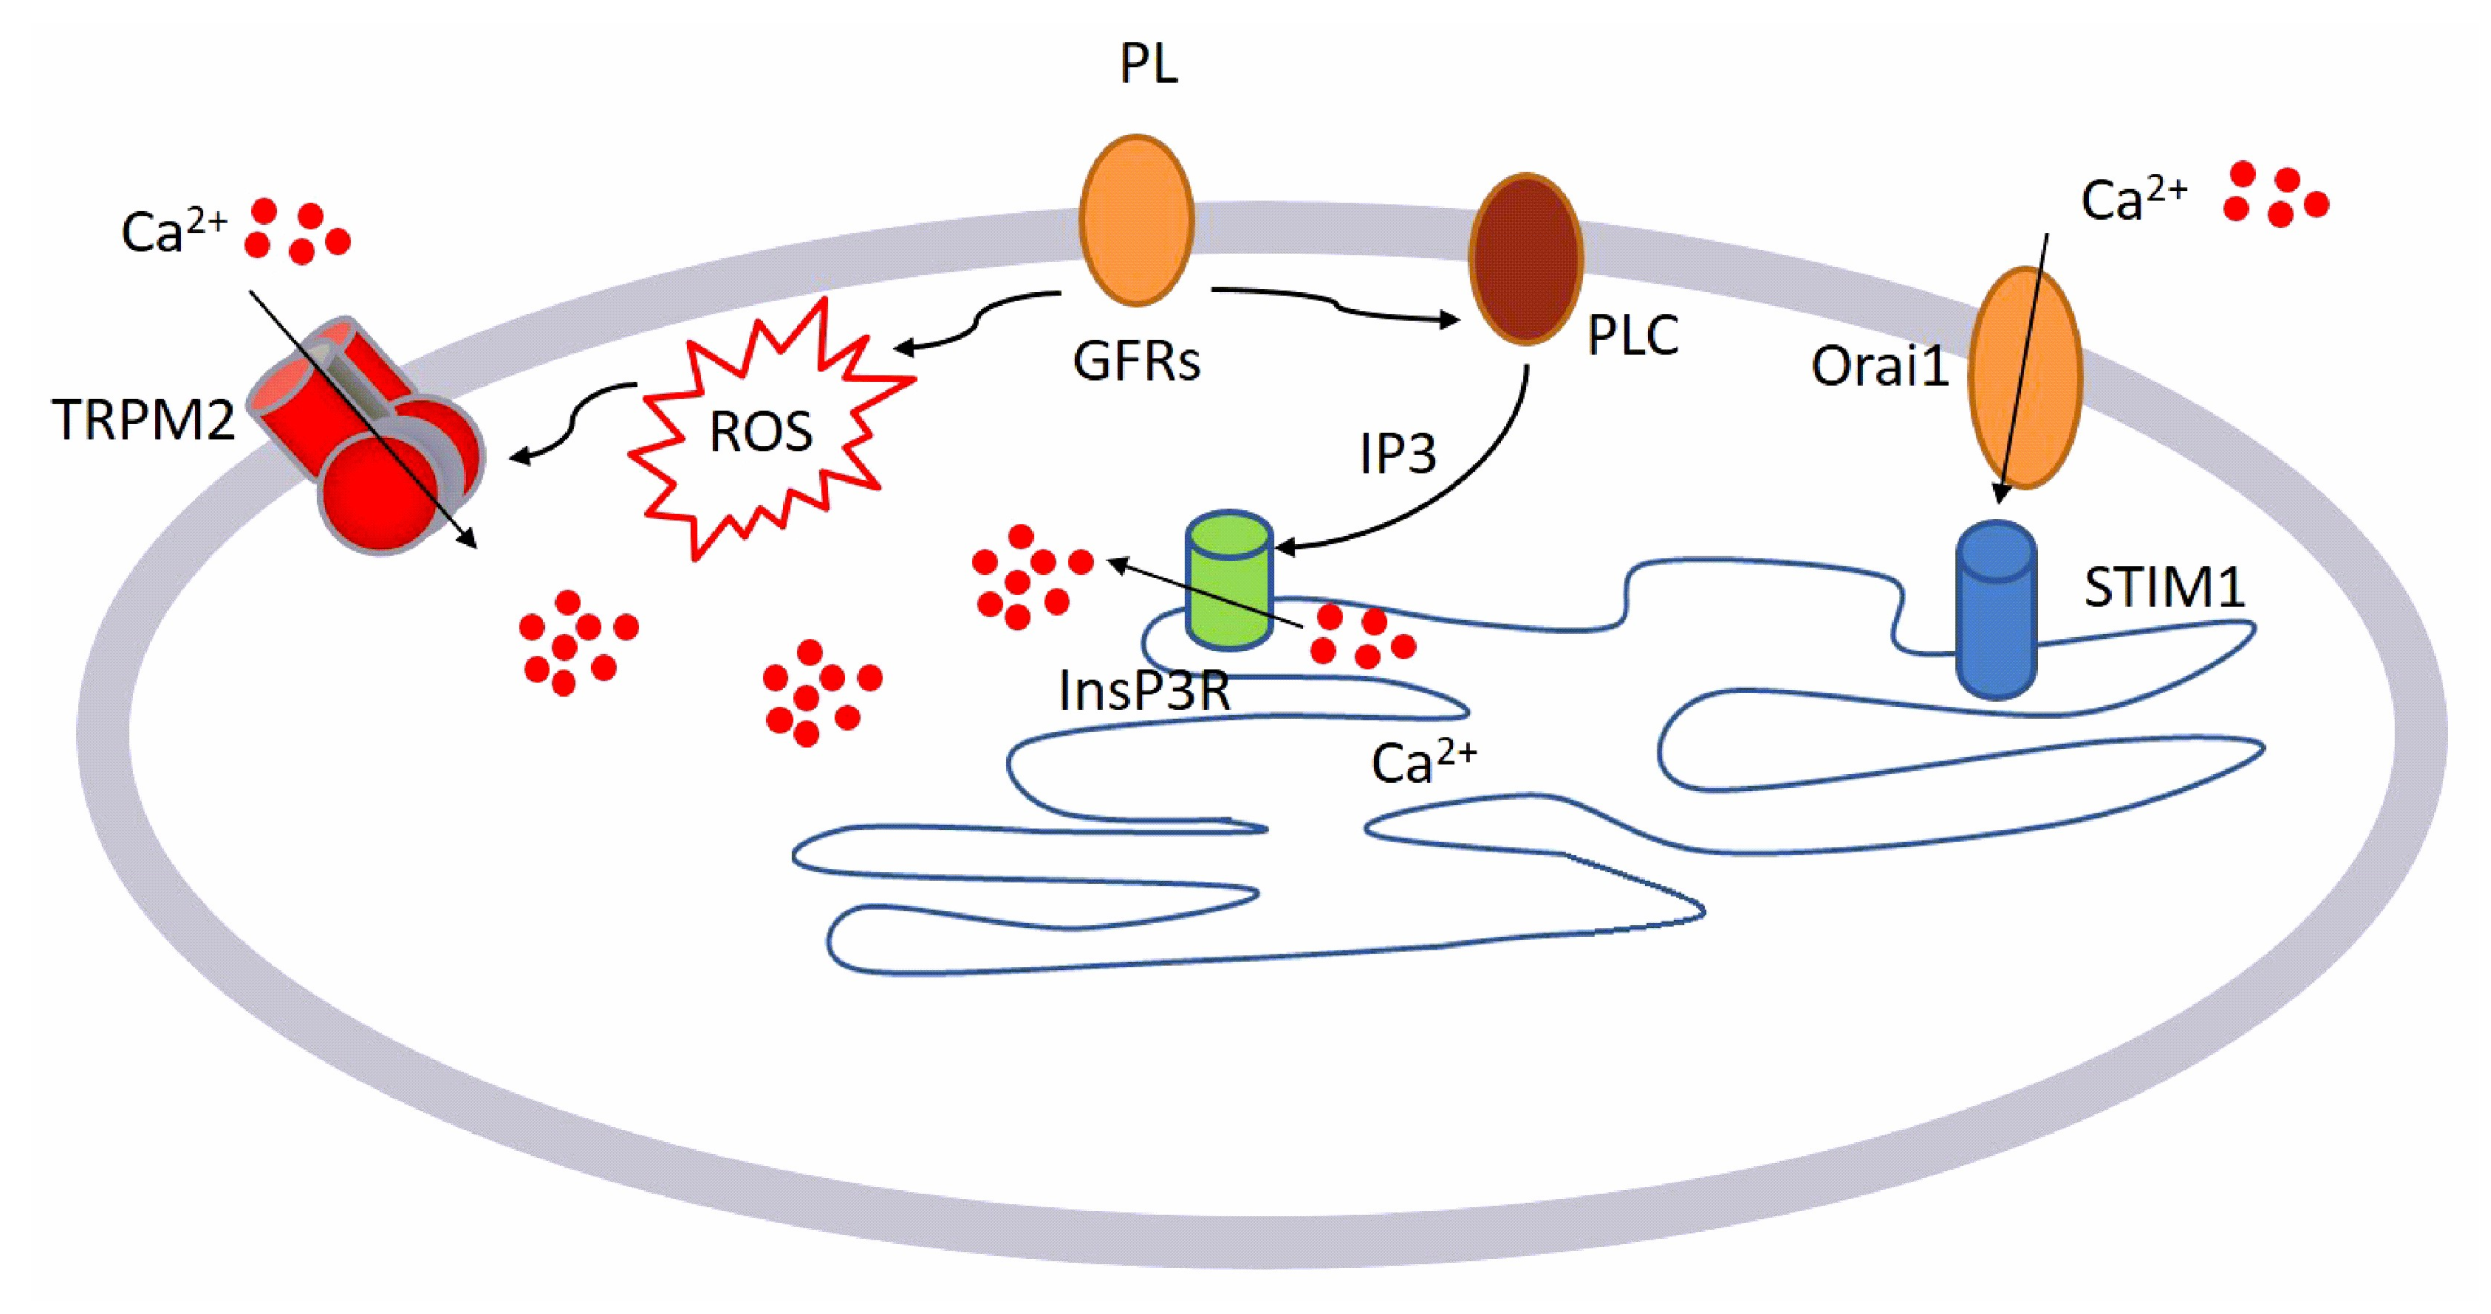
  • GFs contained in PL bind to their specific receptors
  • This binding leads to the activation of two different pathways:
    Generation of intracellular ROS via NOX4
    Activation of PLCγ, leading to the production of InsP3
  • Intracellular ROS activates TRPM2 channel and consequently Ca2+ entry from the extracellular space.
InsP3 determines the release of Ca2+ from the intracellular store, activating the SOCE that operates to reload the intracellular stores sustaining the PL Ca2+ response.
Data showed that PL could trigger intracellular Ca2+ changes. PL induced, via intracellular ROS generation, the activation of TRPM2 that in turn determined Ca2+ entry from the extracellular space. Pharmacological and genetic (siRNA) inhibition of TRPM2 inhibited the Ca2+ response to PL.
At the same time, GFs binding to their receptors induces PLC activation and consequently the release of Ca2+ from the ER through InsP3R, confirmed by the pharmacological inhibition of the PLC/InsP3 cascade. Therefore, the pharmaceutical inhibition of Orai1 also diminished the Ca2+ response to PL, suggesting the involvement of SOCE in sustaining of response to PL.
Moreover, our findings can also represent an important knowledge for the use of PL as an alternative for ex-vivo expansion of endothelial cells before clinical administration, avoiding issues related to the use of fetal bovine serum.

4. Materials and Methods

4.1. Cell Culture and Reagents

All reagents were from Sigma-Aldrich, unless otherwise indicated.
The bEND5 cell line (American Type Culture Collection, Manassas, VA, USA) is an immortalized mouse cell line from brain capillary endothelial cells. Cells were grown at 37 °C, 5% CO2 in DMEM (high glucose, 4.5 g/L), supplemented with 10% FBS, L-glutamine (200 mM), 100 U/mL penicillin, and 100 mg/mL streptomycin [8].

4.2. Platelet Lysate (PL) Preparation

Platelet concentrates were obtained following a standard clinical method. A platelet-enriched fraction was purified from platelet concentrate obtained according to standard procedures for the preparation of blood components. To obtain PL, the platelets concentrate, at the density of 1 × 10⁹ cell/mL, was washed three times in Ham’s F10 medium, 0.3% ethylenediamine tetraacetic acid (EDTA) to remove possible traces of plasma factors. To complete PL preparation, the concentrated washed platelets were then subjected to thermal shock: frozen (−80 °C) and thawed (37 °C). Platelet bodies and debris were eliminated by centrifugation and the supernatant was stored in aliquots at −80 °C until use [8,12,38,47].

4.3. Scratch Wound Test

Scratch wounds were made in confluent monolayers by using a sterile 0.1–10 µL pipette tip. After washing away suspended cells, cultures were refed with medium in the presence of PL for 24 h. After cell exposures, cells were fixed for 30 min in 3.7% formaldehyde prepared in PBS for 30 min, and then stained for 30 min at room temperature with 0.1% toluidine blue for 30 min. The wound space width was measured at wounding and at the end of treatments, using an inverted microscope (Leica Microsystems, Wetzlar, Germany) equipped with a digital camera. Digitized pictures of wounds were analyzed using the NIH Image J software. Wound closure was determined as the difference between wound width at 0 h and at 24 h.

4.4. Western Blotting

Cells were lysed in RIPA buffer (supplemented with a protease and phosphatase inhibitor cocktail) and homogenates were solubilized in Laemmli buffer. Amounts of 25 μg of proteins were loaded on gel, subjected to SDS-PAGE (12% gel), and then transferred to a nitrocellulose membrane, using a Bio-Rad Mini Trans Blot electrophoretic transfer unit (Bio-Rad Laboratories, Hercules, CA, USA). Membranes were blocked with 5% nonfat dry milk in PBS and then probed at 4 °C overnight, with a primary antibody against NADPH oxidase (NOX)–4 (dilution, 1:500; AbCam, Cambridge, UK). Membranes were then washed three times with PBS-0.05% Tween-20 to remove unbound antibodies and further incubated with appropriate horseradish peroxidase-conjugated secondary antibodies (dilution, 1:1000; Bethyl Laboratories, Montgomery, TX, USA). Membranes were developed using an enhanced chemiluminescence kit (Millipore, Billerica, MA, USA) according to the manufacturer’s protocol and digitized with Quantity One Image Software (ChemiDoc XRS; Bio-Rad). Equal loadings were confirmed with an anti-actin antibody (Santa Cruz Biotechnology, Paso Robles, CA, USA).

4.5. Measurements of Intracellular ROS

Intracellular levels of ROS were evaluated using dihydrorhodamine (DHR) 123, a fluorescent dye precursor, which is converted to fluorescent rhodamine 123 upon reaction with ROS.
Cells were plated on glass-base dishes (Iwaki Glass, Inc., Tokyo, Japan), allowed to settle overnight, and loaded for 30 min at room temperature in the dark with DHR-123 (30 µM) in a loading buffer consisting of (mM) 10 glucose, 10 Hepes, 140 NaCl, 2 CaCl2, 1 MgCl2, and 5 KCl, pH 7.4. After probe loading and washing, cells were observed through confocal time-lapse analysis, using a Zeiss LSM 510 confocal system interfaced with a Zeiss Axiovert 100 M microscope (Carl Zeiss Inc., Oberkochen, Germany).
Excitation was acquired by the 488 nm line of an Ar laser, and emission was collected using a 505–550 bandpass filter. ROS production data were expressed as fluorescence arbitrary units [48].

4.6. Measurements of Free Cytosolic Ca2+ Concentration ([Ca2+]i)

Cells were plated on glass-base dishes (Iwaki Glass, Inc., Tokyo, Japan), allowed to settle overnight, and then loaded with Fluo-3/AM (20 mM), a cell-permeant, fluorescent calcium probe in the dark for 30 min at 37 °C. The loading buffer consisted of (mM) 140 NaCl, 10 glucose, 10 HEPES pH 7.4, 2 CaCl2, 5 KCl, and 1 MgCl2. For Ca2+-free experiments, the ion was omitted from the loading buffer [38,49,50].
After probe loading and washing, cells were analyzed through confocal time-lapse analysis, using a Zeiss LSM 510 confocal system interfaced with a Zeiss Axiovert 100 M microscope (Carl Zeiss Inc., Oberkochen, Germany).
Excitation was realized by the 488 nm line of an Ar laser, and emission was collected using a 505–550 bandpass filter.
Several cells were viewed together through a 20× Plan-Neofluar Zeiss objective (0.5 NA). Fluo-3/AM fluorescence was evaluated in digitized images as the average value over defined contours of individual cells. Fluo-3 calibration was achieved by the following equation [51]:
Ca2+ = Kd(F-Fmin)/(Fmax-F)
where Kd = 400 nmol/L.
Fmax and Fmin are maximum and minimum fluorescence intensities obtained by Fluo-3/AM calibration after cell exposure to 500 µM A23187 for about 10 min, followed by addition of 20 mM EDTA.

4.7. Quantitative Reverse Transcriptase PCR (qRT-PCR) and RNA Interference (siRNA)

Cells were settled in multi-well plates for 24 h and then subjected to the indicated experimental conditions. NucleoSpin RNAII Kit (Macherey-Nagel, Düren, Germany) was utilized to extract total RNA. Complementary DNA was synthesized from RNA using the Transcriptor First Strand cDNA Synthesis Kit (Roche Diagnostics GmbH, Penzberg, Germany).
qRT-PCR was performed using Power Sybr Green Mastermix (Ambion Austin, TX, USA) and KiCqStart® SYBR® Green Primers (Sigma-Aldrich, Table 1) in a CFX384 Real-Time PCR Detection System (Bio-Rad Laboratories, Hercules, CA, USA). Gene expression was measured by the ∆∆Ct method.
For NOX-4, RNAi was performed by transfecting cells with 5 µM siRNA oligonucleotides (Sigma-Aldrich, 5’-GAAUGAGUGCAAUUUCUAA-3’ (sense) and 5’-UCCCAUAUGAGUUCUG-3’ (antisense)) or with equimolar scramble siRNA by using the N-ter Nanoparticle siRNA Transfection System (Sigma-Aldrich).
For TRPM2, RNAi was performed using esiRNA (esiRNA, cat. no. EHU133821, Sigma-Aldrich). Scramble siRNA was obtained using commercial non-targeting siRNA (MISSION siRNA Universal Negative Control). Cells were collected at 24 h after transfection and used for the experiments.

4.8. Statistical Analysis

All statistical tests were carried out with GraphPad Prism 5 (GraphPad Software, Inc, San Diego, CA, USA).

Author Contributions

S.M., M.P., and E.R. conceived the original idea. S.M., M.P., V.B., L.M., and E.R. performed and analyzed the experiments. S.M. and E.R. analyzed Ca2+ imaging experiments. L.M. and V.B. provided platelet lysate. S.M. and E.R. supervised the work, wrote the manuscript, and finalized the submission. All authors have reviewed and approved the final version of the manuscript.

Funding

S.M. received a financial support from the University del Piemonte Orientale (Ricerca Locale 2019).

Conflicts of Interest

The authors declare that there is no conflict of interests.

References

  1. Ranzato, E.; Burlando, B. Signaling pathways in wound repair. In Wound Healing: Process, Phases and Promoting; Middleton, J.E., Ed.; Nova Publishers Inc.: Hauppauge, NY, USA, 2011. [Google Scholar]
  2. Martinotti, S.; Ranzato, E. Dynamic interplay between cell types during wound healing. In Keratinocytes: Structure, Molecular Mechanisms and Role in Immunity; Ranzato, E., Ed.; Nova Publishers Inc.: Hauppauge, NY, USA, 2013. [Google Scholar]
  3. Mao, A.S.; Mooney, D.J. Regenerative medicine: Current therapies and future directions. Proc. Natl. Acad. Sci. USA 2015, 112, 14452–14459. [Google Scholar] [CrossRef] [PubMed] [Green Version]
  4. Ioannidou, E. Therapeutic modulation of growth factors and cytokines in regenerative medicine. Curr. Pharm. Des. 2006, 12, 2397–2408. [Google Scholar] [CrossRef] [PubMed]
  5. Ranzato, E.; Mazzucco, L.; Burlando, B. Platelet Derivatives: A New Horizon in Regenerative Medicine. In Advances in Medicine and Biology; Lv, B., Ed.; Nova Publishers Inc.: Hauppauge, NY, USA, 2010. [Google Scholar]
  6. Burnouf, T.; Goubran, H.A.; Chen, T.M.; Ou, K.L.; El-Ekiaby, M.; Radosevic, M. Blood-derived biomaterials and platelet growth factors in regenerative medicine. Blood Rev. 2013, 27, 77–89. [Google Scholar] [CrossRef] [PubMed]
  7. Rauch, C.; Feifel, E.; Amann, E.M.; Spotl, H.P.; Schennach, H.; Pfaller, W.; Gstraunthaler, G. Alternatives to the Use of Fetal Bovine Serum: Human Platelet Lysates as a Serum Substitute in Cell Culture Media. Altex-Altern. Anim. Ex. 2011, 28, 305–316. [Google Scholar]
  8. Ranzato, E.; Boccafoschi, F.; Mazzucco, L.; Patrone, M.; Burlando, B. Role of ERK1/2 in Platelet Lysate-Driven Endothelial Cell Repair. J. Cell Biochem. 2010, 110, 783–793. [Google Scholar] [CrossRef]
  9. Castelnovo, L.; Dosquet, C.; Gaudric, A.; Sahel, J.; Hicks, D. Human platelet suspension stimulates porcine retinal glial proliferation and migration in vitro. Invest. Ophth. Vis. Sci. 2000, 41, 601–609. [Google Scholar]
  10. Soffer, E.; Ouhayoun, J.P.; Anagnostou, F. Fibrin sealants and platelet preparations in bone and periodontal healing. Oral Surg. Oral Med. O. 2003, 95, 521–528. [Google Scholar] [CrossRef]
  11. Martinotti, S.; Mazzucco, L.; Balbo, V.; Patrone, M.; Mozzati, M.; Ranzato, E.; Burlando, B. Platelet-Rich Plasma Induces Mixed Osteogenic/Osteoclastogenic Phenotype in Osteosarcoma SaOS-2 Cells: Role of TGF-Beta. Curr. Pharm. Biotechno. 2014, 15, 120–126. [Google Scholar] [CrossRef]
  12. Ranzato, E.; Patrone, M.; Mazzucco, L.; Burlando, B. Platelet lysate stimulates wound repair of HaCaT keratinocytes. Br. J. Dermatol. 2008, 159, 537–545. [Google Scholar] [CrossRef]
  13. Cipriani, V.; Ranzato, E.; Balbo, V.; Mazzucco, L.; Cavaletto, M.; Patrone, M. Long-term effect of platelet lysate on primary fibroblasts highlighted with a proteomic approach. J. Tissue Eng. Regen. M. 2009, 3, 531–538. [Google Scholar] [CrossRef]
  14. Borowiec, A.S.; Bidaux, G.; Pigat, N.; Goffin, V.; Bernichtein, S.; Capiod, T. Calcium channels, external calcium concentration and cell proliferation. Eur. J. Pharmacol. 2014, 739, 19–25. [Google Scholar] [CrossRef]
  15. Moe, A.M.; Golding, A.E.; Bement, W.M. Cell healing: Calcium, repair and regeneration. Semin. Cell Dev. Biol. 2015, 45, 10–15. [Google Scholar] [CrossRef] [PubMed] [Green Version]
  16. Socha, M.J.; Behringer, E.J.; Segal, S.S. Calcium and electrical signalling along endothelium of the resistance vasculature. Basic Clin. Pharmacol. Toxicol. 2012, 110, 80–86. [Google Scholar] [CrossRef]
  17. Moccia, F.; Tanzi, F.; Munaron, L. Endothelial Remodelling and Intracellular Calcium Machinery. Curr. Mol. Med. 2014, 14, 457–480. [Google Scholar] [CrossRef] [PubMed]
  18. Martinotti, S.; Patrone, M.; Mazzucco, L.; Ranzato, E. Platelet lysate-driven endothelial cell repair: The mastermind role of intracellular calcium. Vasc. Pharmacol. 2018, 103, 62. [Google Scholar] [CrossRef]
  19. Ranzato, E.; Martinotti, S.; Burlando, B. Epithelial mesenchymal transition traits in honey-driven keratinocyte wound healing: Comparison among different honeys. Wound Repair Regen. 2012, 20, 778–785. [Google Scholar] [CrossRef] [PubMed]
  20. Hecquet, C.M.; Ahmmed, G.U.; Vogel, S.M.; Malik, A.B. Role of TRPM2 channel in mediating H2O2-induced Ca2+ entry and endothelial hyperpermeability. Circ. Res. 2008, 102, 347–355. [Google Scholar] [CrossRef] [Green Version]
  21. Oda, S.; Uchida, K.; Wang, X.Y.; Lee, J.; Shimada, Y.; Tominaga, M.; Kadowaki, M. TRPM2 contributes to antigen-stimulated Ca2+ influx in mucosal mast cells. Pflug. Arch. Eur. J. Phy. 2013, 465, 1023–1030. [Google Scholar] [CrossRef]
  22. Sundaresan, M.; Yu, Z.X.; Ferrans, V.J.; Irani, K.; Finkel, T. Requirement for generation of H2O2 for platelet-derived growth factor signal transduction. Science 1995, 270, 296–299. [Google Scholar] [CrossRef] [Green Version]
  23. Mittal, M.; Urao, N.; Hecquet, C.M.; Zhang, M.; Sudhahar, V.; Gao, X.P.; Komarova, Y.; Ushio-Fukai, M.; Malik, A.B. Novel role of reactive oxygen species-activated Trp melastatin channel-2 in mediating angiogenesis and postischemic neovascularization. Arterioscler. Thromb. Vasc. Biol. 2015, 35, 877–887. [Google Scholar] [CrossRef] [Green Version]
  24. Urao, N.; Inomata, H.; Razvi, M.; Kim, H.W.; Wary, K.; McKinney, R.; Fukai, T.; Ushio-Fukai, M. Role of nox2-based NADPH oxidase in bone marrow and progenitor cell function involved in neovascularization induced by hindlimb ischemia. Circ. Res. 2008, 103, 212–220. [Google Scholar] [CrossRef] [PubMed]
  25. Maruyama, T.; Kanaji, T.; Nakade, S.; Kanno, T.; Mikoshiba, K. 2APB, 2-aminoethoxydiphenyl borate, a membrane-penetrable modulator of Ins(1,4,5)P3-induced Ca2+ release. J. Biochem. 1997, 122, 498–505. [Google Scholar] [CrossRef] [PubMed]
  26. Choi, K.J.; Kim, K.S.; Kim, S.H.; Kim, D.K.; Park, H.S. Caffeine and 2-Aminoethoxydiphenyl Borate (2-APB) Have Different Ability to Inhibit Intracellular Calcium Mobilization in Pancreatic Acinar Cell. Korean J. Physiol. Pha. 2010, 14, 105–111. [Google Scholar] [CrossRef] [PubMed] [Green Version]
  27. Wilsher, N.E.; Court, W.J.; Ruddle, R.; Newbatt, Y.M.; Aherne, W.; Sheldrake, P.W.; Jones, N.P.; Katan, M.; Eccles, S.A.; Raynaud, F.I. The phosphoinositide-specific phospholipase C inhibitor U73122 (1-(6-((17beta-3-methoxyestra-1,3,5(10)-trien-17-yl)amino)hexyl)-1H-pyrrole-2,5-d ione) spontaneously forms conjugates with common components of cell culture medium. Drug Metab. Dispos. 2007, 35, 1017–1022. [Google Scholar] [CrossRef]
  28. Moccia, F.; Dragoni, S.; Lodola, F.; Bonetti, E.; Bottino, C.; Guerra, G.; Laforenza, U.; Rosti, V.; Tanzi, F. Store-Dependent Ca2+ Entry in Endothelial Progenitor Cells As a Perspective Tool to Enhance Cell-Based Therapy and Adverse Tumour Vascularization. Curr. Med. Chem. 2012, 19, 5802–5818. [Google Scholar] [CrossRef]
  29. Moccia, F.; Berra-Romani, R.; Tanzi, F. Update on vascular endothelial Ca(2+) signalling: A tale of ion channels, pumps and transporters. World J. Biol. Chem. 2012, 3, 127–158. [Google Scholar] [CrossRef]
  30. Santiago, E.; Climent, B.; Munoz, M.; Garcia-Sacristan, A.; Rivera, L.; Prieto, D. Hydrogen peroxide activates store-operated Ca(2+) entry in coronary arteries. Br. J. Pharmacol. 2015, 172, 5318–5332. [Google Scholar] [CrossRef] [Green Version]
  31. Prakriya, M.; Lewis, R.S. Store-Operated Calcium Channels. Physiol. Rev. 2015, 95, 1383–1436. [Google Scholar] [CrossRef] [Green Version]
  32. Zuccolo, E.; Bottino, C.; Diofano, F.; Poletto, V.; Codazzi, A.C.; Mannarino, S.; Campanelli, R.; Fois, G.; Marseglia, G.L.; Guerra, G.; et al. Constitutive Store-Operated Ca(2+) Entry Leads to Enhanced Nitric Oxide Production and Proliferation in Infantile Hemangioma-Derived Endothelial Colony-Forming Cells. Stem Cells Dev. 2016, 25, 301–319. [Google Scholar] [CrossRef]
  33. Moccia, F.; Berra-Romani, R.; Baruffi, S.; Spaggiari, S.; Adams, D.J.; Taglietti, V.; Tanzi, F. Basal nonselective cation permeability in rat cardiac microvascular endothelial cells. Microvasc. Res. 2002, 64, 187–197. [Google Scholar] [CrossRef]
  34. Zuccolo, E.; Lim, D.; Kheder, D.A.; Perna, A.; Catarsi, P.; Botta, L.; Rosti, V.; Riboni, L.; Sancini, G.; Tanzi, F.; et al. Acetylcholine induces intracellular Ca(2+) oscillations and nitric oxide release in mouse brain endothelial cells. Cell Calcium 2017, 66, 33–47. [Google Scholar] [CrossRef] [PubMed]
  35. Anitua, E.; Sanchez, M.; Nurden, A.T.; Nurden, P.; Orive, G.; Andia, I. New insights into and novel applications for platelet-rich fibrin therapies. Trends Biotechnol. 2006, 24, 227–234. [Google Scholar] [CrossRef] [PubMed]
  36. Doucet, C.; Ernou, I.; Zhang, Y.Z.; Llense, J.R.; Begot, L.; Holy, X.; Lataillade, J.J. Platelet lysates promote mesenchymal stem cell expansion: A safety substitute for animal serum in cell-based therapy applications. J. Cell Physiol. 2005, 205, 228–236. [Google Scholar] [CrossRef] [PubMed]
  37. Mazzucco, L.; Balbo, V.; Cattana, E.; Borzini, P. Platelet-rich plasma and platelet gel preparation using Plateltex (R). Vox. Sang. 2008, 94, 202–208. [Google Scholar] [CrossRef] [PubMed]
  38. Ranzato, E.; Mazzucco, L.; Patrone, M.; Burlando, B. Platelet lysate promotes in vitro wound scratch closure of human dermal fibroblasts: Different roles of cell calcium, P38, ERK and PI3K/AKT. J. Cell Mol. Med. 2009, 13, 2030–2038. [Google Scholar] [CrossRef] [PubMed]
  39. Ranzato, E.; Martinotti, S.; Balbo, V.; Boccafoschi, F.; Patrone, M.; Mazzucco, L.; Burlando, B. Platelet Lysate-Driven in Vitro Wound Healing. Wound Repair. Regen. 2009, 17, A78. [Google Scholar]
  40. Abdullaev, I.F.; Bisaillon, J.M.; Potier, M.; Gonzalez, J.C.; Motiani, R.K.; Trebak, M. Stim1 and Orai1 mediate CRAC currents and store-operated calcium entry important for endothelial cell proliferation. Circ. Res. 2008, 103, 1289–1299. [Google Scholar] [CrossRef]
  41. Rossello, R.A.; David, H. Cell communication and tissue engineering. Commun. Integr. Biol. 2010, 3, 53–56. [Google Scholar] [CrossRef]
  42. Berra-Romani, R.; Faris, P.; Negri, S.; Botta, L.; Genova, T.; Moccia, F. Arachidonic Acid Evokes an Increase in Intracellular Ca(2+) Concentration and Nitric Oxide Production in Endothelial Cells from Human Brain Microcirculation. Cells 2019, 8, 689. [Google Scholar] [CrossRef] [Green Version]
  43. Ostrovskaya, O.; Goyal, R.; Osman, N.; McAllister, C.E.; Pessah, I.N.; Hume, J.R.; Wilson, S.M. Inhibition of ryanodine receptors by 4-(2-aminopropyl)-3,5-dichloro-N,N-dimethylaniline (FLA 365) in canine pulmonary arterial smooth muscle cells. J. Pharmacol. Exp. Ther 2007, 323, 381–390. [Google Scholar] [CrossRef] [Green Version]
  44. Anguita, E.; Villalobo, A. Ca(2+) signaling and Src-kinases-controlled cellular functions. Arch. Biochem. Biophys. 2018, 650, 59–74. [Google Scholar] [CrossRef] [PubMed]
  45. Berra Romani, R.; Raqeeb, A.; Laforenza, U.; Scaffino, M.F.; Moccia, F.; Avelino-Cruz, J.E.; Oldani, A.; Coltrini, D.; Milesi, V.; Taglietti, V.; et al. Cardiac microvascular endothelial cells express a functional Ca+ -sensing receptor. J. Vasc. Res. 2009, 46, 73–82. [Google Scholar] [CrossRef] [PubMed] [Green Version]
  46. Sammak, B.M.; Yousef, B.A.; Gali, M.H.; al Karawi, M.A.; Mohamed, A.E. Case report: Radiological and endoscopic management of bile leak following laparoscopic cholecystectomy. J. Gastroenterol. Hepatol. 1997, 12, 34–38. [Google Scholar] [CrossRef] [PubMed]
  47. Ranzato, E.; Martinotti, S.; Volante, A.; Mazzucco, L.; Burlando, B. Platelet lysate modulates MMP-2 and -9 expression, matrix deposition and cell-to-matrix adhesion in keratinocytes and fibroblasts. Exp. Dermatol. 2011, 20, 308–313. [Google Scholar] [CrossRef]
  48. Ranzato, E.; Martinotti, S.; Magnelli, V.; Murer, B.; Biffo, S.; Mutti, L.; Burlando, B. Epigallocatechin-3-gallate induces mesothelioma cell death via H2O2 -dependent T-type Ca2+ channel opening. J. Cell Mol. Med. 2012, 16, 2667–2678. [Google Scholar] [CrossRef]
  49. Martinotti, S.; Laforenza, U.; Patrone, M.; Moccia, F.; Ranzato, E. Honey-Mediated Wound Healing: H2O2 Entry through AQP3 Determines Extracellular Ca2+ Influx. Int. J. Mol. Sci. 2019, 20, 764. [Google Scholar] [CrossRef] [Green Version]
  50. Ranzato, E.; Magnelli, V.; Martinotti, S.; Waheed, Z.; Cain, S.M.; Snutch, T.P.; Marchetti, C.; Burlando, B. Epigallocatechin-3-gallate elicits Ca2+ spike in MCF-7 breast cancer cells: Essential role of Cav3.2 channels. Cell Calcium 2014, 56, 285–295. [Google Scholar] [CrossRef]
  51. Grynkiewicz, G.; Poenie, M.; Tsien, R.Y. A new generation of Ca2+ indicators with greatly improved fluorescence properties. J. Biol. Chem. 1985, 260, 3440–3450. [Google Scholar]
Figure 1. Platelet lysate (PL)-induced wound closure. (A) Upper panel: Effect of different concentrations of PL in scratch wound repair of bEND5 monolayers. PL was used; 10% and 20% v/v. CTRL are cells in control conditions, i.e., cells grown in DMEM with 10% FBS as described in the Materials and Methods section. Wound closure rate is expressed as the difference between wound width at 0 and 24 h. Data were recorded 24 h after scratch wound healing of cells exposed to PL. Bars represent mean ± S.E.M. of wound closure derived from two independent experiments, each with n = 20. Different asterisks on bars indicate statistical differences determined by one-way ANOVA with Tukey’s test (p < 0.05). Lower panel: Micrographs of scratch-wounded bEND5 monolayers incubated under control conditions (cells incubated in DMEM with 10% FBS) or in the presence of 10% and 20% PL and then stained with blue toluidine and observed 24 h after wounding. (B) Upper panel: Role of intracellular Ca2+ in PL-induced scratch wound repair of endothelial monolayers, in presence or not of 30 µM BAPTA-AM. Wound closure rate is expressed as the difference between wound width at 0 and 24 h. Data were recorded 24 h after scratch wound healing of cells exposed to PL. Bars represent mean ± S.E.M. of wound closure inhibition deriving from two independent experiments, each with n = 20. Asterisks on bars indicate statistical differences determined by one-way ANOVA with Tukey’s test (p < 0.001). Lower panel: Micrographs of scratch-wounded bEND5 monolayers incubated under control conditions (as described above) or in the presence of PL and BAPTA-AM and then stained with blue toluidine and observed 24 h after wounding.
Ijms 21 00808 g001
Figure 2. PL induces a dose-dependent increase in intracellular Ca2+ concentration in bEND5 cells. (A) [Ca2+]i variations recorded at 10 s intervals, showing no variations in control conditions (CTRL, i.e., cells incubated in confocal microscopy loading buffer, as described in Materials and Methods section), and distinct patterns of Ca2+ signaling after exposure to 10% and 20% PL. Data are means ± s.e.m. of [Ca2+]i traces recorded in different cells. Number of cells: CTRL: 20 cells from 2 experiments; 10% PL: 40 cells from 3 experiments; 20% PL: 40 cells from 3 experiments. (B) Mean ± s.e.m. of the peak Ca2+ response induced by treatment with 10% or 20% PL. Number of cells: CTRL: 20 cells from 2 experiments; 10% PL: 40 cells from 3 experiments; 20% PL: 40 cells from 3 experiments. Asterisks on bars indicate statistical differences determined by two-way ANOVA with Bonferroni’s correction (p < 0.001). C. [Ca2+]i variations recorded at 1 s intervals induced by 20% PL. Data are means ± s.e.m. of [Ca2+]i traces recorded in 40 different cells.
Ijms 21 00808 g002
Figure 3. PL-induced Ca2+ entry from the extracellular space in bEND5 cells. (A) To monitor exclusively intracellular Ca2+ mobilization, bEND5 cells were stimulated with 20% PL in the absence of external Ca2+ (0Ca2+). When Ca2+ has been added back to the medium, there was [Ca2+]i increase. (B) Mean ± s.e.m. of the Ca2+ response at time zero and to 20% PL recorded after PL addition (first peak) and at the peak after Ca2+ supplement in extracellular space (second peak). Data are means ± s.e.m. of [Ca2+]i measured by confocal imaging of 40 cells from 3 experiments Different asterisks on bars indicate statistical differences by one-way ANOVA according to Tukey’s test (p < 0.001).
Ijms 21 00808 g003
Figure 4. The inhibition of TRPM2 channel reduced PL-induced Ca2+ entry. (A) PL-induced Ca2+ entry was dramatically reduced in the presence of 10 µM Econazole (30 min preincubation). PL was added at 20% v/v. Data are means ± s.e.m. of [Ca2+]i traces recorded in different cells. Number of cells: PL alone: 40 cells from 3 experiments; PL + Econazole 10 µM: 50 cells from 3 experiments. (B) Mean ± s.e.m. of the Ca2+ response to 20% v/v PL recorded at the peak and at the plateau under the designated treatments. Data are means ± s.e.m. of [Ca2+]i measured by confocal imaging at peak maxima. Number of cells: PL alone: 40 cells from 3 experiments; PL + Econazole 10 µM: 50 cells from 3 experiments. Asterisks on bars indicate statistical differences determined by two-way ANOVA with Bonferroni’s correction (p < 0.001). (C) Expression of TRPM2 gene in bEND5 cells after RNAi. The mRNA quantity of TRPM2 was determined by qRT-PCR and is represented as mean relative expression ± SD (n = 3, * p < 0.001, t-test). (D) PL-induced Ca2+ entry was completely abrogated in cells transfected with RNAi targeting TRPM2. PL was added at 20% v/v. Data are means ± s.e.m. of [Ca2+]i traces recorded in different cells. Number of cells: PL alone: 30 cells from 3 experiments; PL after RNAi for TRPM2: 50 cells from 3 experiments. (E) Mean ± S.E.M. of the Ca2+ response to 20% v/v PL recorded at the peak and at the plateau under the designated treatments. Data are means ± s.e.m. of [Ca2+]i measured by confocal imaging at peak maxima. Number of cells: PL alone: 30 cells from 3 experiments; PL after RNAi for TRPM2: 50 cells from 3 experiments. Asterisks on bars indicate statistical differences determined by two-way ANOVA with Bonferroni’s correction (p < 0.001).
Ijms 21 00808 g004
Figure 5. PL-induced ROS production and their involvement in Ca2+ entry. (A) Expression of NOX4 gene in bEND5 cells after RNAi. The mRNA quantity of NOX4 was determined by qRT-PCR and is represented as mean relative expression ± SD (n = 3, * p < 0.001, t-test). (B). NOX4 protein expression in scrambled cells or after NOX4 RNAi. Blots representative of three were shown. Lanes were loaded with 25 μg of proteins, then probed with anti-NOX4 antibody, and managed as described in the Materials and Methods. The same blots were stripped and re-probed with anti-actin antibody. (C) ROS production in DHR-123 loaded cells recorded at 120 s after 20% PL exposure. CTRL are cells incubated in confocal microscopy loading buffer, as described in Materials and Methods section. Bars represent mean ± s.e.m. of ROS production deriving from two independent experiments, each with n = 20. Asterisks on bars indicate statistical differences determined by one-way ANOVA with Dunnet’s test (p < 0.001). (D) PL-induced Ca2+ entry was completely abrogated after RNAi for NOX4. PL was added at 20% v/v. Data are means ± s.e.m. of [Ca2+]i traces recorded in different cells. Number of cells: PL alone: 40 cells from 3 experiments; PL after RNAi for NOX4: 50 cells from 3 experiments. (E). Mean ± s.e.m. of the Ca2+ response to 20% v/v PL recorded at the peak and at the plateau under the designated treatments. Data are means ± s.e.m. of [Ca2+]i measured by confocal imaging at peak maxima. Number of cells: PL alone: 40 cells from 3 experiments; PL after RNAi for NOX4: 50 cells from 3 experiments. Asterisks on bars indicate statistical differences determined by two-way ANOVA with Bonferroni’s correction (p < 0.001).
Ijms 21 00808 g005
Figure 6. Contribution of intracellular stores to cytosolic Ca2+ increase. A. PL-induced Ca2+ release was dramatically reduced in the presence of thapsigargin, 2-APB, U73122, caffeine (30 min pre-incubation for each drug). PL was added at 20%. Data are means ± s.e.m. of [Ca2+]i traces recorded in different cells. Number of cells: PL 20% alone: 20 cells from 3 experiments; PL 20% + thapsigargin 5 µM: 40 cells from 3 experiments; PL 20% + 2-APB 50 µM: 45 cells from 3 experiments; PL 20% + U73122 10 µM: 50 cells from 3 experiments; PL 20% + caffeine 10 mM. B. Mean ± s.e.m. of the Ca2+ response to 20% PL recorded at the peak and at the plateau under the designated treatments. Data are means ± s.e.m. of [Ca2+]i measured by confocal imaging at peak maxima. Number of cells: PL 20% alone: 20 cells from 3 experiments; PL 20% + thapsigargin 5 µM: 40 cells from 3 experiments; PL 20% + 2-APB 50 µM: 45 cells from 3 experiments; PL 20% + U73122 10 µM: 50 cells from 3 experiments; PL 20% + caffeine 10 mM. Asterisks on bars indicate statistical differences determined by two-way ANOVA with Bonferroni’s correction (p < 0.001).
Ijms 21 00808 g006
Figure 7. The inhibition of Orai1 channel abolished PL-induced Ca2+ entry. A. PL-induced Ca2+ entry was completely abolished in the presence of 1 µM Pyr6 (30 min preincubation). PL was added at 20% v/v. Data are means ± s.e.m. of [Ca2+]i traces recorded in different cells. Number of cells: PL alone: 40 cells from 3 experiments; PL + Pyr6 1 µM: 50 cells from 3 experiments. B. Mean ± s.e.m. of the Ca2+ response to 20% PL recorded at the peak and at the plateau under the designated treatments. Data are means ± s.e.m. of [Ca2+]i measured by confocal imaging at peak maxima. Number of cells: PL alone: 40 cells from 3 experiments; PL + Pyr6 1 µM: 50 cells from 3 experiments. Asterisks on bars indicate statistical differences determined by two-way ANOVA with Bonferroni’s correction (p < 0.001). C. Using the Mn2+-quenching technique, the resting Ca2+ entry in bEND5 cells was evaluated. First, the extracellular medium was replaced with a 0Ca2+ solution and then, to cause an immediate decay in Fura-2 fluorescence, 200 µM Mn2+ was added. PL 20% treatment allowed an evident decay of fluorescence, while pre-incubating the cells with Pyr6 strongly prevented this decay. CTRL indicates cells incubated in 0Ca2+ solution. D. The quenching rate of Fura-2 fluorescence induced by Mn2+ addition was calculated as the slope of a linear regression. Different asterisks on bars indicate statistical differences (*** p < 0.001; ** p < 0.005).
Ijms 21 00808 g007
Figure 8. Role of intracellular ROS and Ca2+ in PL-induced wound closure. A. Upper panel: Effect of different inhibitors on PL-induced scratch wound repair of endothelial monolayers. Each inhibitor was used according to the procedures, which were previously shown to inhibit PL extracellular Ca2+ entry. CTRL are cells in control conditions, i.e., cells grown in DMEM with 10% FBS as described in the Materials and Methods section. Wound closure rate is expressed as the difference between wound width at 0 and 24 h. Data were recorded 24 h after scratch wound healing of cells exposed to PL. Bars represent mean ± s.e.m. of wound closure inhibition deriving from two independent experiments, each with n = 20. Asterisks on bars indicate statistical differences determined by two-way ANOVA with Bonferroni’s correction (p < 0.001). Lower panel: Micrographs of scratch-wounded bEND5 monolayers incubated under control conditions or in the presence of PL with different inhibitors. B. Upper panel: Effect of RNAi for NOX4 and TRPM2 on PL-induced scratch wound repair of endothelial monolayers. Wound closure rate is expressed as the difference between wound width at 0 and 24 h. Data were recorded 24 h after scratch wound healing of cells exposed to PL. Bars represent mean ± s.e.m. of wound closure inhibition deriving from two independent experiments, each with n = 20. Asterisks on bars indicate statistical differences determined by two-way ANOVA with Bonferroni’s correction (p < 0.001). Micrographs of scratch-wounded bEND5 monolayers incubated under control conditions (scrambled cells) or in the presence of PL and RNAi (siRNA) for NOX4 and TRPM2 and then stained with blue toluidine and observed 24 h after wounding.
Ijms 21 00808 g008
Figure 9. Diagram depicting the mechanism of action of PL on bEND5 endothelial cells, as characterized in the study.
Ijms 21 00808 g009
Table 1. Sequences of primers used for qRT-PCR.
TARGET GENEFORWARD SEQUENCEREVERSE SEQUENCE
β-actin5’-TCCCTGGAGAAGAGCTACGA-3′5’-AGCACTGTGTTGGCGTACAG-3′
GADPH5’-AATCCCATCACCATCTTCCA-3′5’-TGGACTCCACGACGTACTCA-3′
NOX45’-GGTATTGTTCCTCATGGTTAC-3’5’-TGGGATGATGTCTGGTTAAG-3’
TRPM25’-GTGAAGTCATCACTATTGGC-3′5’-GAATCTCCACACCATATTGC-3′

