Article

Identification of Alternative Mitochondrial Electron Transport Pathway Components in Chickpea Indicates a Differential Response to Salinity Stress between Cultivars

College of Science & Engineering, Flinders University, GPO Box 5100, Adelaide, SA 5001, Australia
*
Author to whom correspondence should be addressed.
Int. J. Mol. Sci. 2020, 21(11), 3844; https://doi.org/10.3390/ijms21113844
Submission received: 25 April 2020 / Revised: 26 May 2020 / Accepted: 27 May 2020 / Published: 28 May 2020
(This article belongs to the Special Issue Plant Respiration)

Abstract

:
All plants contain an alternative electron transport pathway (AP) in their mitochondria, consisting of the alternative oxidase (AOX) and type 2 NAD(P)H dehydrogenase (ND) families, that are thought to play a role in controlling oxidative stress responses at the cellular level. These alternative electron transport components have been extensively studied in plants like Arabidopsis and stress inducible isoforms identified, but we know very little about them in the important crop plant chickpea. Here we identify AP components in chickpea (Cicer arietinum) and explore their response to stress at the transcript level. Based on sequence similarity with the functionally characterized proteins of Arabidopsis thaliana, five putative internal (matrix)-facing NAD(P)H dehydrogenases (CaNDA1-4 and CaNDC1) and four putative external (inter-membrane space)-facing NAD(P)H dehydrogenases (CaNDB1-4) were identified in chickpea. The corresponding activities were demonstrated for the first time in purified mitochondria of chickpea leaves and roots. Oxidation of matrix NADH generated from malate or glycine in the presence of the Complex I inhibitor rotenone was high compared to other plant species, as was oxidation of exogenous NAD(P)H. In leaf mitochondria, external NADH oxidation was stimulated by exogenous calcium and external NADPH oxidation was essentially calcium dependent. However, in roots these activities were low and largely calcium independent. A salinity experiment with six chickpea cultivars was used to identify salt-responsive alternative oxidase and NAD(P)H dehydrogenase gene transcripts in leaves from a three-point time series. An analysis of the Na:K ratio and Na content separated these cultivars into high and low Na accumulators. In the high Na accumulators, there was a significant up-regulation of CaAOX1, CaNDB2, CaNDB4, CaNDA3 and CaNDC1 in leaf tissue under long term stress, suggesting the formation of a stress-modified form of the mitochondrial electron transport chain (mETC) in leaves of these cultivars. In particular, stress-induced expression of the CaNDB2 gene showed a striking positive correlation with that of CaAOX1 across all genotypes and time points. The coordinated salinity-induced up-regulation of CaAOX1 and CaNDB2 suggests that the mitochondrial alternative pathway of respiration is an important facet of the stress response in chickpea, in high Na accumulators in particular, despite high capacities for both of these activities in leaf mitochondria of non-stressed chickpeas.

1. Introduction

Mitochondria in all higher aerobic organisms are essential for the energy status of the cell and also play key roles in oxidative stress generation and management. Plant mitochondria have a branched electron transport chain (mETC): in addition to the classical mETC consisting of large complexes that transfer electrons from intramitochondrial NADH to oxygen, coupled to proton translocation and ATP synthesis, plant mitochondria contain an alternative pathway (AP) that does not conserve energy [1,2]. The AP consists of several single-subunit type II NAD(P)H dehydrogenases (NDs) on both the outside (NDBs) and inside (NDAs and NDCs) of the inner mitochondrial membrane, and an alternative oxidase (AOX) that accepts electrons from the ubiquinol pool and competes with the cytochrome pathway [3,4,5,6,7,8]. While there has been much speculation on the role of the AP, a consensus has emerged that it plays a key role in moderating the generation of reactive oxygen species (ROS) in the mETC and affects oxidative stress signaling in plant cells through linkages with key transcription factors [9,10,11,12]. Additionally, the AP may modulate other metabolic pathways and growth, through the regulation of cellular energy status and respiratory metabolite pools [7,13,14,15,16]. Overexpression of AP components can confer enhanced tolerance of environmental stresses in plants [17,18,19,20,21,22].
The genomic organization of AP genes, especially AOX, varies between species [23,24]. In many dicot species, exemplified by the model plant Arabidopsis thaliana, AOX is encoded in a small gene family consisting of several AOX1 genes and maybe one AOX2 gene, with one of the AOX1 genes the main expressed isoform, but only in the presence of stress. Monocot species, including important crop plants such as rice and wheat, lack functional AOX2 isoforms. The legume family appears to be another exception, with all species examined to date having multiple forms of AOX2, with at least one constitutively expressed and another preferentially transcribed to a high level in shoots [25]. In Arabidopsis, the NDs are also encoded in a small gene family, with two NDA genes, four NDB genes, and an NDC gene [4,26]. NDC1 and some of the NDA and NDB proteins are also found in other organelles [27]. The genomic structure of the ND genes in other species is less understood, although barley and rice ND genes have been identified and partially characterized [28].
Here we have investigated the AP in the important crop legume, chickpea, including the identification of ND genes and determination of those genes that are stress responsive. There was a marked difference in the expression of specific AP genes depending on whether cultivars accumulated high or low levels of Na in their leaves, suggesting that this pathway is important in tissues that accumulate Na. This information is important for our understanding of the role of mitochondria in tissue-specific functions and environmental stress responses in legumes.

2. Results

2.1. Type II NAD(P)H Dehydrogenase Activities in Chickpea

Activities for internal and external NAD(P)H dehydrogenases were measured in mitochondria purified from chickpea leaves and roots (Figure 1). In leaf mitochondria, the rate of external NADH oxidation was greater than 200 nmol O2 min−1 mg−1 protein and more than half of this rate was calcium-independent. External NADPH oxidation was approximately 100 nmol O2 min−1 mg−1 protein and completely calcium-dependent. In contrast, external NADH and NADPH oxidation rates in mitochondria from roots were lower by a factor of almost 10 and less dependent on calcium. Internal (matrix-generated) NADH oxidation rates, measured as rotenone-insensitive malate or glycine oxidation, were lower than those for external NADH or NADPH in leaf mitochondria. This was not likely due to a limitation in the rate of NADH generation in the matrix, as higher rates of malate and glycine oxidation were observed in the absence of rotenone (i.e., when Complex I was also active) and may reflect the poorer affinity of this pathway for NADH as observed in other species [29]. However, both rotenone-sensitive and rotenone-insensitive malate and glycine oxidation rates were much lower in root mitochondria.

2.2. Type II NAD(P)H Dehydrogenase Genes in Chickpea

2.2.1. Gene Identification

To identify candidate genes encoding ND proteins, C. arietinum sequences were extracted from the non-redundant protein sequence database (NCBI), using ND protein sequences previously characterized from A. thaliana [26]. Nine putative ND orthologs mapped to unique regions of the C. arietinum genome (Table 1) and these were classified according to A. thaliana nomenclature where possible: four NDA types CaNDA1-4 (i.e., internal-facing), four NDB types CaNDB1-4 (i.e., external-facing) and one NDC type CaNDC1. Sub-cellular localization was predicted based on the presence of N-terminal signal peptides (Table S1). Despite some disagreement between results from the different targeting tools, most NDA and NDB proteins are likely to target to mitochondria while NDC1 is probably dual targeted to the mitochondria and chloroplasts, as also seen in Arabidopsis [27]. Discrepancies between programs also highlights the need for experimental determination of cellular location of these proteins. Notably, some programs did not predict mitochondrial targeting for some Arabidopsis NDs despite experimental evidence for this [27,30].
Each of the CaND amino acid sequences contained the conserved FAD-binding domain (Figure S1) and all CaNDB sequences contained an EF-hand domain, which is characteristic of NDB proteins from other plants and the site of calcium binding [31,32,33]. Clustal alignments of the highly conserved NAD(P)H binding domains revealed no differences between the expected substrate preferences for chickpea NDs compared to Arabidopsis NDs, whereby all NDAs and NDBs (except NDB1) contained a glutamate residue that is characteristic of NADH preference at its binding site [34]. Additionally, like Arabidopsis, the chickpea NDB1 contained a glutamine at this site and is likely to preferentially bind NADPH (Figure S1).
Based on amino acid sequence identity (Table 1), it was not possible to assign any of the four CaNDAs as specific orthologues to AtNDA1 or AtNDA2. CaNDA1 and CaNDA2 shared 72–74% identity to both Arabidopsis NDAs, and CaNDA3 and CaNDA4 were approximately 66% identical to both Arabidopsis NDAs. Similarly, it was not possible to distinguish whether CaNDB2 or CaNDB3 were more like AtNDB2 or AtNDB3, since both chickpea proteins showed approximately 70% identity to both Arabidopsis counterparts. CaNDB4 shared 66–68% identity to AtNDB2, AtNDB3 and AtNDB4. However, CaNDB1 clearly showed the highest identity with AtNDB1, and CaNDC1 also showed the highest identity with AtNDC1.
CaND genes were found on five of the eight chickpea chromosomes, although the majority were located on chromosome 6 (CaNDA3, CaNDB1, CaNDB3, CaNDB4 and CaNDC1). CaNDB1 and CaNDB4 were only 11 kb apart, towards the 3′ end of chromosome Ca6. CaNDA3 and CaNDB3 were also close to each other (~250 kb) but considerably upstream of CaNDB1 and CaNDB4. As shown previously, the three CaAOX2 genes co-localized on chromosome Ca6 [25], but were approximately 1.1 Mb upstream of CaNDB3. All other CaND genes, CaNDA1, CaNDA2, CaNDA4 and CaNDB2 as well as the CaAOX1 gene [25], were found on separate chromosomes (Table 1; Ca5, 2, 4, 1 and 8, respectively).
Chickpea ND genes had similar exon structures to Arabidopsis (Figure S2). CaNDA1 and 2 had similar structures to the AtNDA genes, with eight introns, but CaNDA3 and CaNDA4 each had an extra intron at the start that contained only untranslated regions. A splice variant of the CaNDA2 gene was also predicted, whereby exons 5 and 6 were lost. This variant was termed CaNDA5. CaNDB1 had 10 exons compared to the nine exons of AtNDB1 due to an additional intron within exon 5. CaNDB2, 3 and 4 each had 10 exons as per AtNDB2 and 3 and none of the CaNDB genes had the six-exon structure of AtNDB4. CaNDC1 had 11 exons compared to the 10 exons of AtNDC1, due to an additional intron within the final exon. CaND genes typically had extended introns compared to Arabidopsis, some as large as 1-2.5 kb (found in CaNDA2, CaNDB1, CaNDB2, CaNDB3 and CaNDC1). The fourth introns of CaNDA2 and CaNDA5 were considerably longer, at approximately 5.5 and 6 kb, respectively.

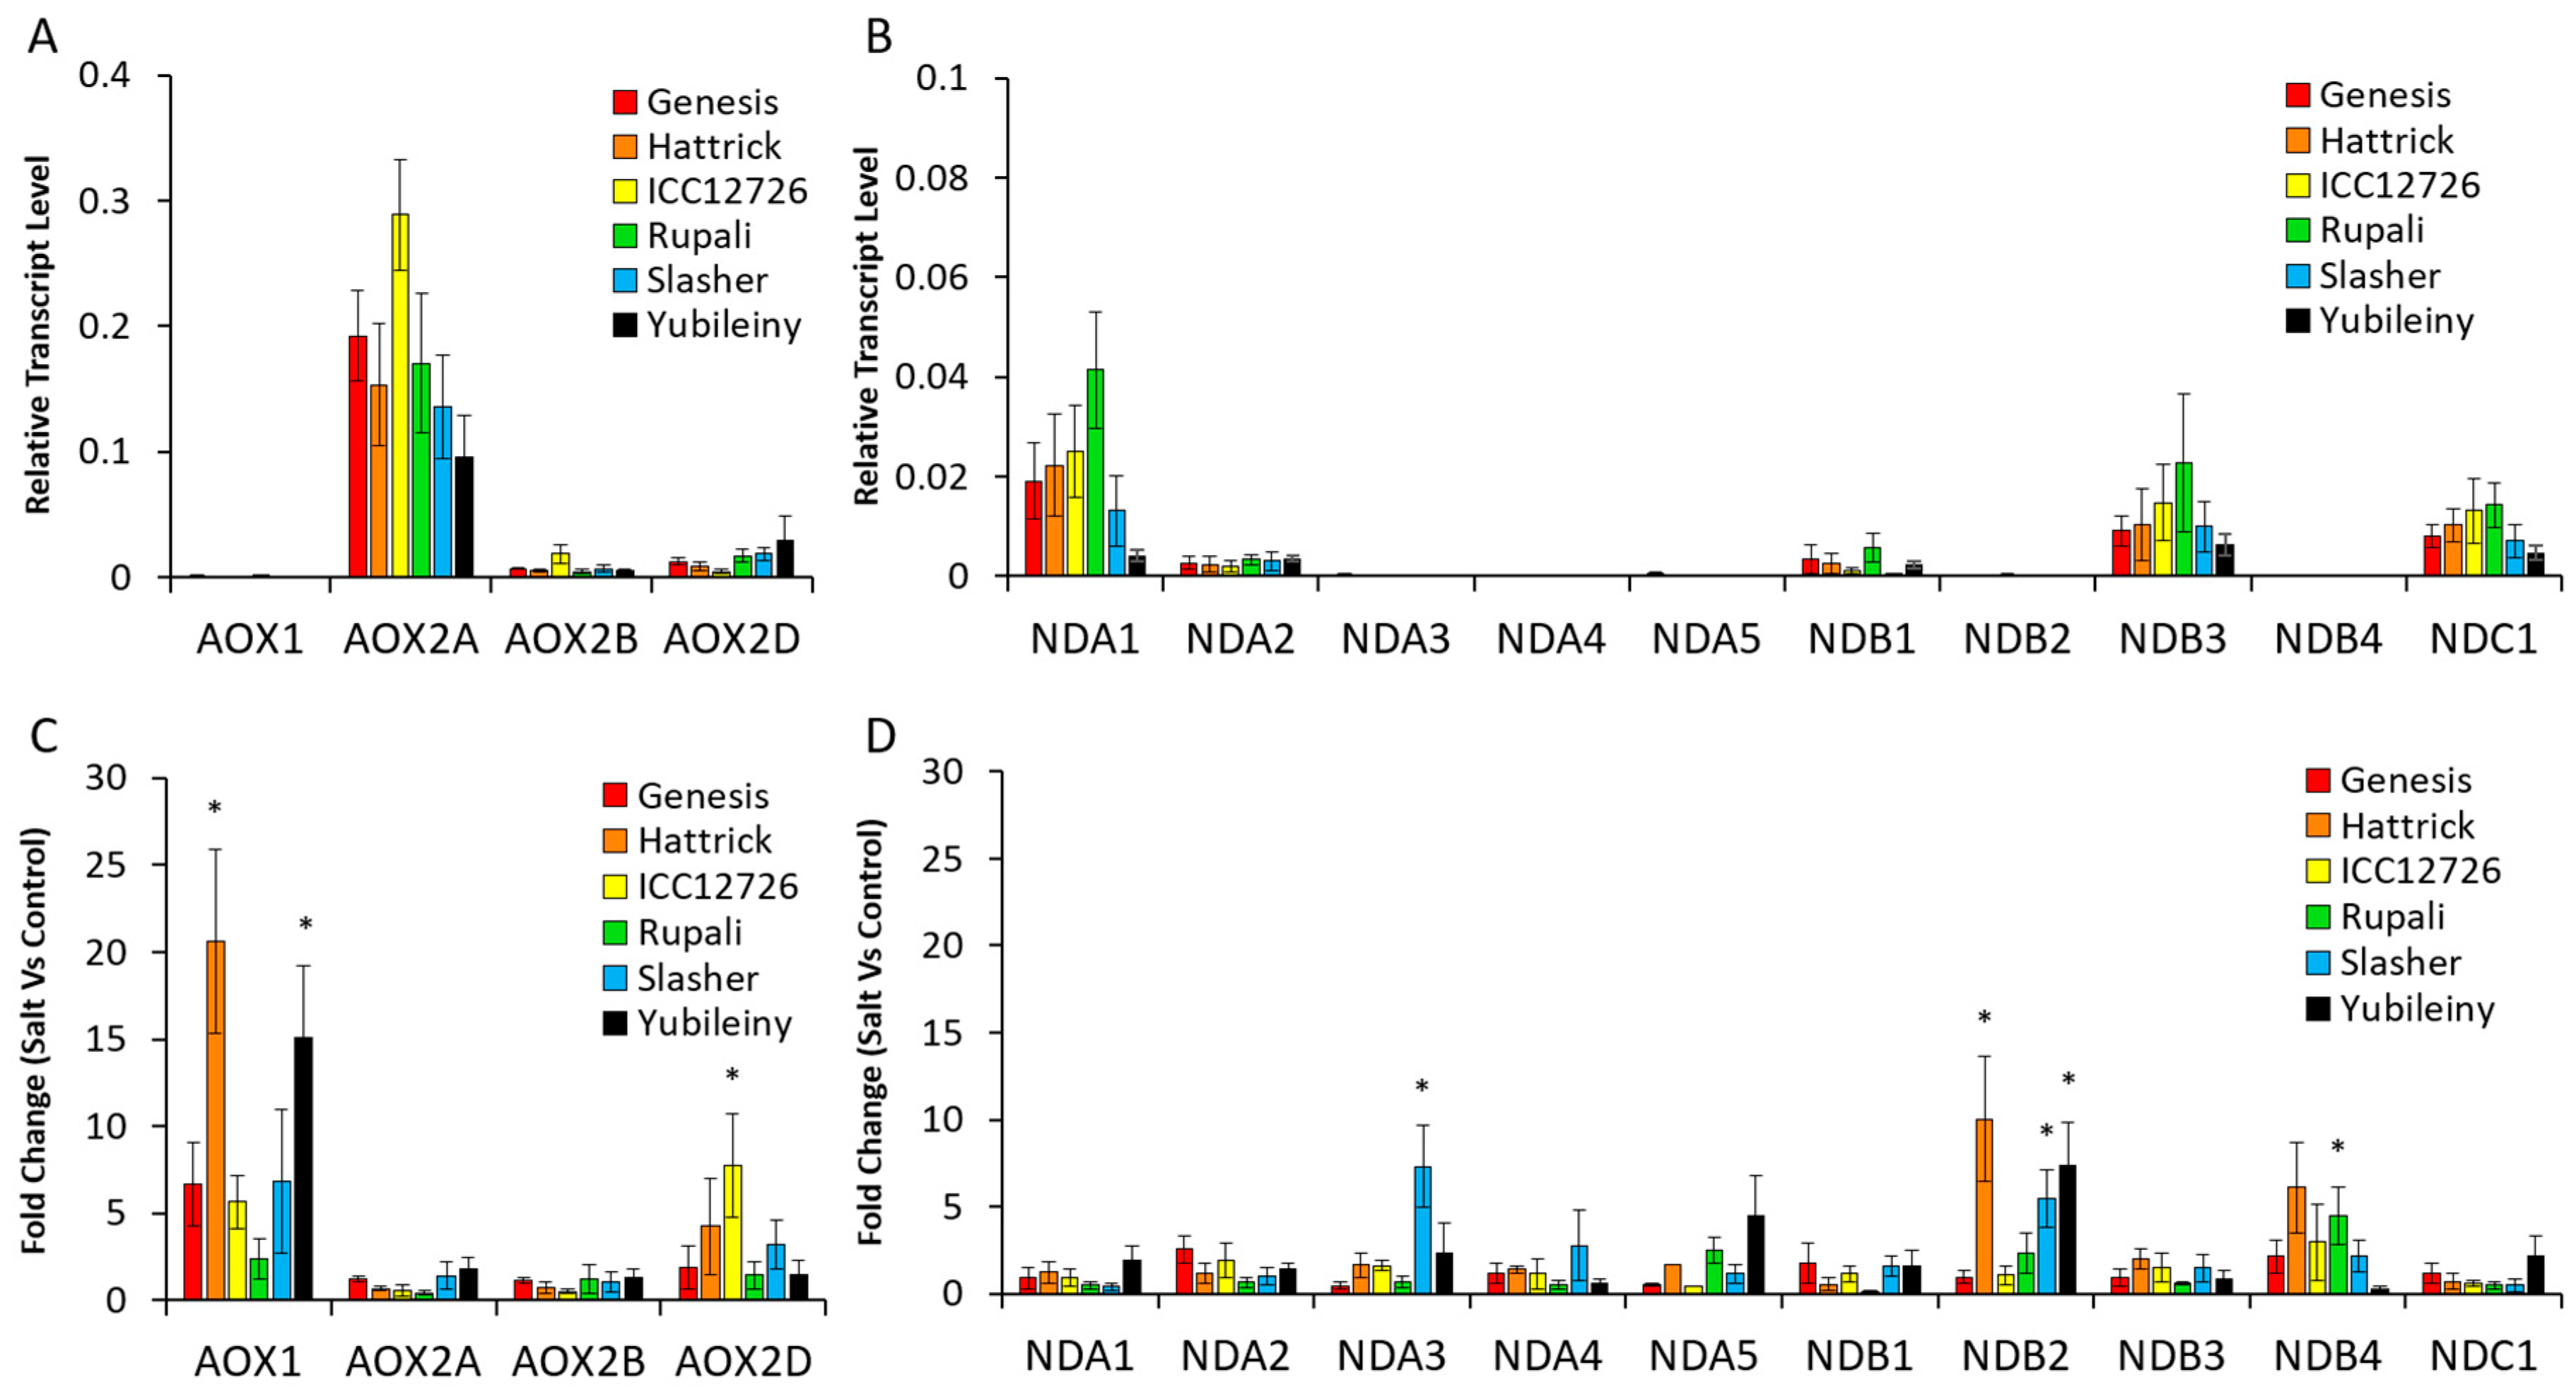
2.2.2. Differential Expression of AP Components in Chickpea Tissues

Tissue-specific expression patterns were explored (Table 2 and Table S2) using publicly available RNAseq data from an experiment with 15-day old seedlings [35] and from another experiment with plants at various developmental stages [36]. These were subsequently confirmed by qRT-PCR on our samples collected during mitochondrial isolation experiments. AOX gene transcript levels were also analysed by qRT-PCR and tissue-differential patterns of expression matched to those seen previously [25].
From these datasets, CaNDA1 was the most highly expressed CaNDA gene in the shoot/leaf but was missing entirely from roots (Table 2, Figure 2). This is similar to the AtNDA1 gene in Arabidopsis [30]. The CaNDA2 gene was expressed in all tissues but generally higher (or similar) in the root compared to leaf, also similar to the Arabidopsis AtNDA2 gene [30]. CaNDA2 had a potential alternative splice variant, so primers were designed to target both variants individually, with the latter designated CaNDA5. Transcripts could be detected for both of these variants, although CaNDA2 levels were approximately 10-fold those for CaNDA5. No RNAseq contigs for the CaNDA3 could be found, but this transcript was detected in low levels using qRT-PCR and was significantly lower in roots compared to leaves. In the Chickpea Transcriptome DataBase (CTDB), the CaNDA4 gene was represented by three small contigs rather than one complete contig, none of which were detected in the tissue libraries, although transcript levels were detected in most tissues from Kudapa et al. [36], where they were lower in roots than in leaves. This was confirmed using qRT-PCR, with the gene expressed at a low level similar to that of CaNDA3 (Figure 2).
The four NDB genes also showed transcriptional variation. CaNDB3 was the most highly expressed CaNDB gene in all tissues, while CaNDB1 was less abundant, especially in roots (Table 2, Figure 2). In contrast, the AtNDB1 gene was reported to be equally expressed in leaf and root tissues of Arabidopsis [30]. CaNDB2 and CaNDB4 were not detected in any tissue from RNAseq datasets but were present at low levels in qRT-PCR data, where expression was significantly lower in roots. CaNDC1 was expressed in all tissues but lower in (or absent from) roots, unlike the AtNDC1 gene, which was expressed equally in leaves and roots of Arabidopsis.

2.2.3. Expression of AP Genes in Response to Salinity Stress Varies between Cultivars and Is Related to Na Accumulation

To document the stress-responsiveness of ND genes in chickpea, mRNA transcripts of leaf samples from six chickpea cultivars exposed to salinity stress (90 mM) were measured. The growth response of these cultivars to salinity has been reported previously [37] and for convenience is summarized here in Table S3. Cultivars were classified as salt tolerant, sensitive or moderately sensitive based on the impact on growth and visible symptoms [37]. Cultivars were also classed as high or low salt accumulators based on Na:K ratios.
Leaves were harvested on days 5, 9 and 15 (T5, T9 and T15) after the final NaCl application, and expression levels of the CaAOX and CaND genes were quantified using qRT-PCR (Figure 3 and Figure S3). As seen previously [25], CaAOX2a was the most highly expressed alternative oxidase gene in chickpea leaves, whilst CaAOX1 was the most stress responsive. Of the NDs, CaNDA1 was the most highly expressed followed by CaNDB3 and CaNDC1, but none of these were consistently upregulated by stress. Only CaNDB2 showed a high level of induction across a number of time points, with 3- to 10-fold increased expression in Hattrick, ICC12726, Slasher and Yubileiny after 9 or 15 days (or both) of salt exposure. This gene was otherwise expressed at very low levels and undetected in RNAseq experiments (see above). Some other CaND genes showed transcript up-regulation in specific cultivars and at specific time points including CaNDA1, which was up-regulated 3- to 4-fold in Hattrick and Slasher after 15 days; CaNDA2, which was up-regulated two-fold in ICC12726 and Yubileiny after 15 days; CaNDA3, which was temporarily up-regulated seven-fold in Slasher after 9 days; CaNDA4, up-regulated four- and 12-fold in ICC12726 and Yubileiny after 15 days, respectively; CaNDB1, up-regulated two-fold in ICC12726 at 15 days of salt-exposure; CaNDB3, up-regulated two-fold in Slasher and Yubileiny after 15 days; and CaNDB4, up-regulated in several cultivars but not significantly, except for a three-fold increase in ICC12726 after 15 days and four-fold increase in Rupali after 9 days. From this it can be seen that there is genotype- and condition-specific regulation of the different CaND genes, with CaNDB2 the most commonly up-regulated.
An analysis of Na content in the cultivars showed that they could be grouped into high and low Na accumulators (Table S3). The transcriptional response of AP genes at different time points was then re-analysed (Figure 4). At 15 days CaAOX1, CaNDB2, CaNDB4 and CaNDC1 were more highly upregulated in the higher Na accumulators compared to the lower accumulators. Despite the correlation with leaf Na:K, there was no significant correlation of AP gene expression response with plant biomass [37] after one month of salt (not shown).

2.3. Type II NAD(P)H Dehydrogenase Genes of Other Legumes

To determine whether other legumes demonstrate similar ND expression patterns to chickpea, orthologs from 15 additional legume species were identified (Table S4). In general, there were similar numbers of ND gene family members across legume species, typically between 7 and 9 genes comprised, on average, of three NDA genes, four NDB genes and one NDC gene. Notable exceptions were Glycine max, which contained 14 putative ND genes including six NDAs, seven NDBs and one NDC and Prosopis alba, the white carob tree, which contained 10 putative ND genes including four NDAs, four NDBs and two NDCs. G. max is a partially diploidized tetraploid, which may explain the larger set of ND genes, although this species does not have an expanded AOX gene family compared to other legumes [25]. Many of the ND proteins are predicted to be targeted to mitochondria (Table S1) although this is yet to be experimentally determined.
According to publicly available transcriptomic data from G. max, Medicago truncatula, Lotus japonicus, Vigna unguiculata, Cajanus cajan and Phaseolus vulgaris, NDA1 and NDC1 transcripts are also largely absent from root tissues, while NDB1 is less expressed in roots compared to leaves or shoots (Figure S4).There are limited transcriptomic datasets available for abiotic stress experiments in legumes, and of these, many lack information for the entire set of ND genes (Table S5). Data from Genevestigator (Hruz et al., 2008) suggest that MtNDA3 is a stress-responsive gene in M. truncatula, becoming up-regulated in nine stress-imposed conditions, including salt, drought, cold, ozone and low phosphorous treatments, while MtNDA2 was up-regulated by drought and MtNDB3 by ozone [38,39,40,41]. Data from Lotus Base suggested that LjNDA3 is also up-regulated by drought in L. japonicus, and in this case there were some data available for LjNDB2, which is up-regulated by drought and salt treatments [42,43,44].

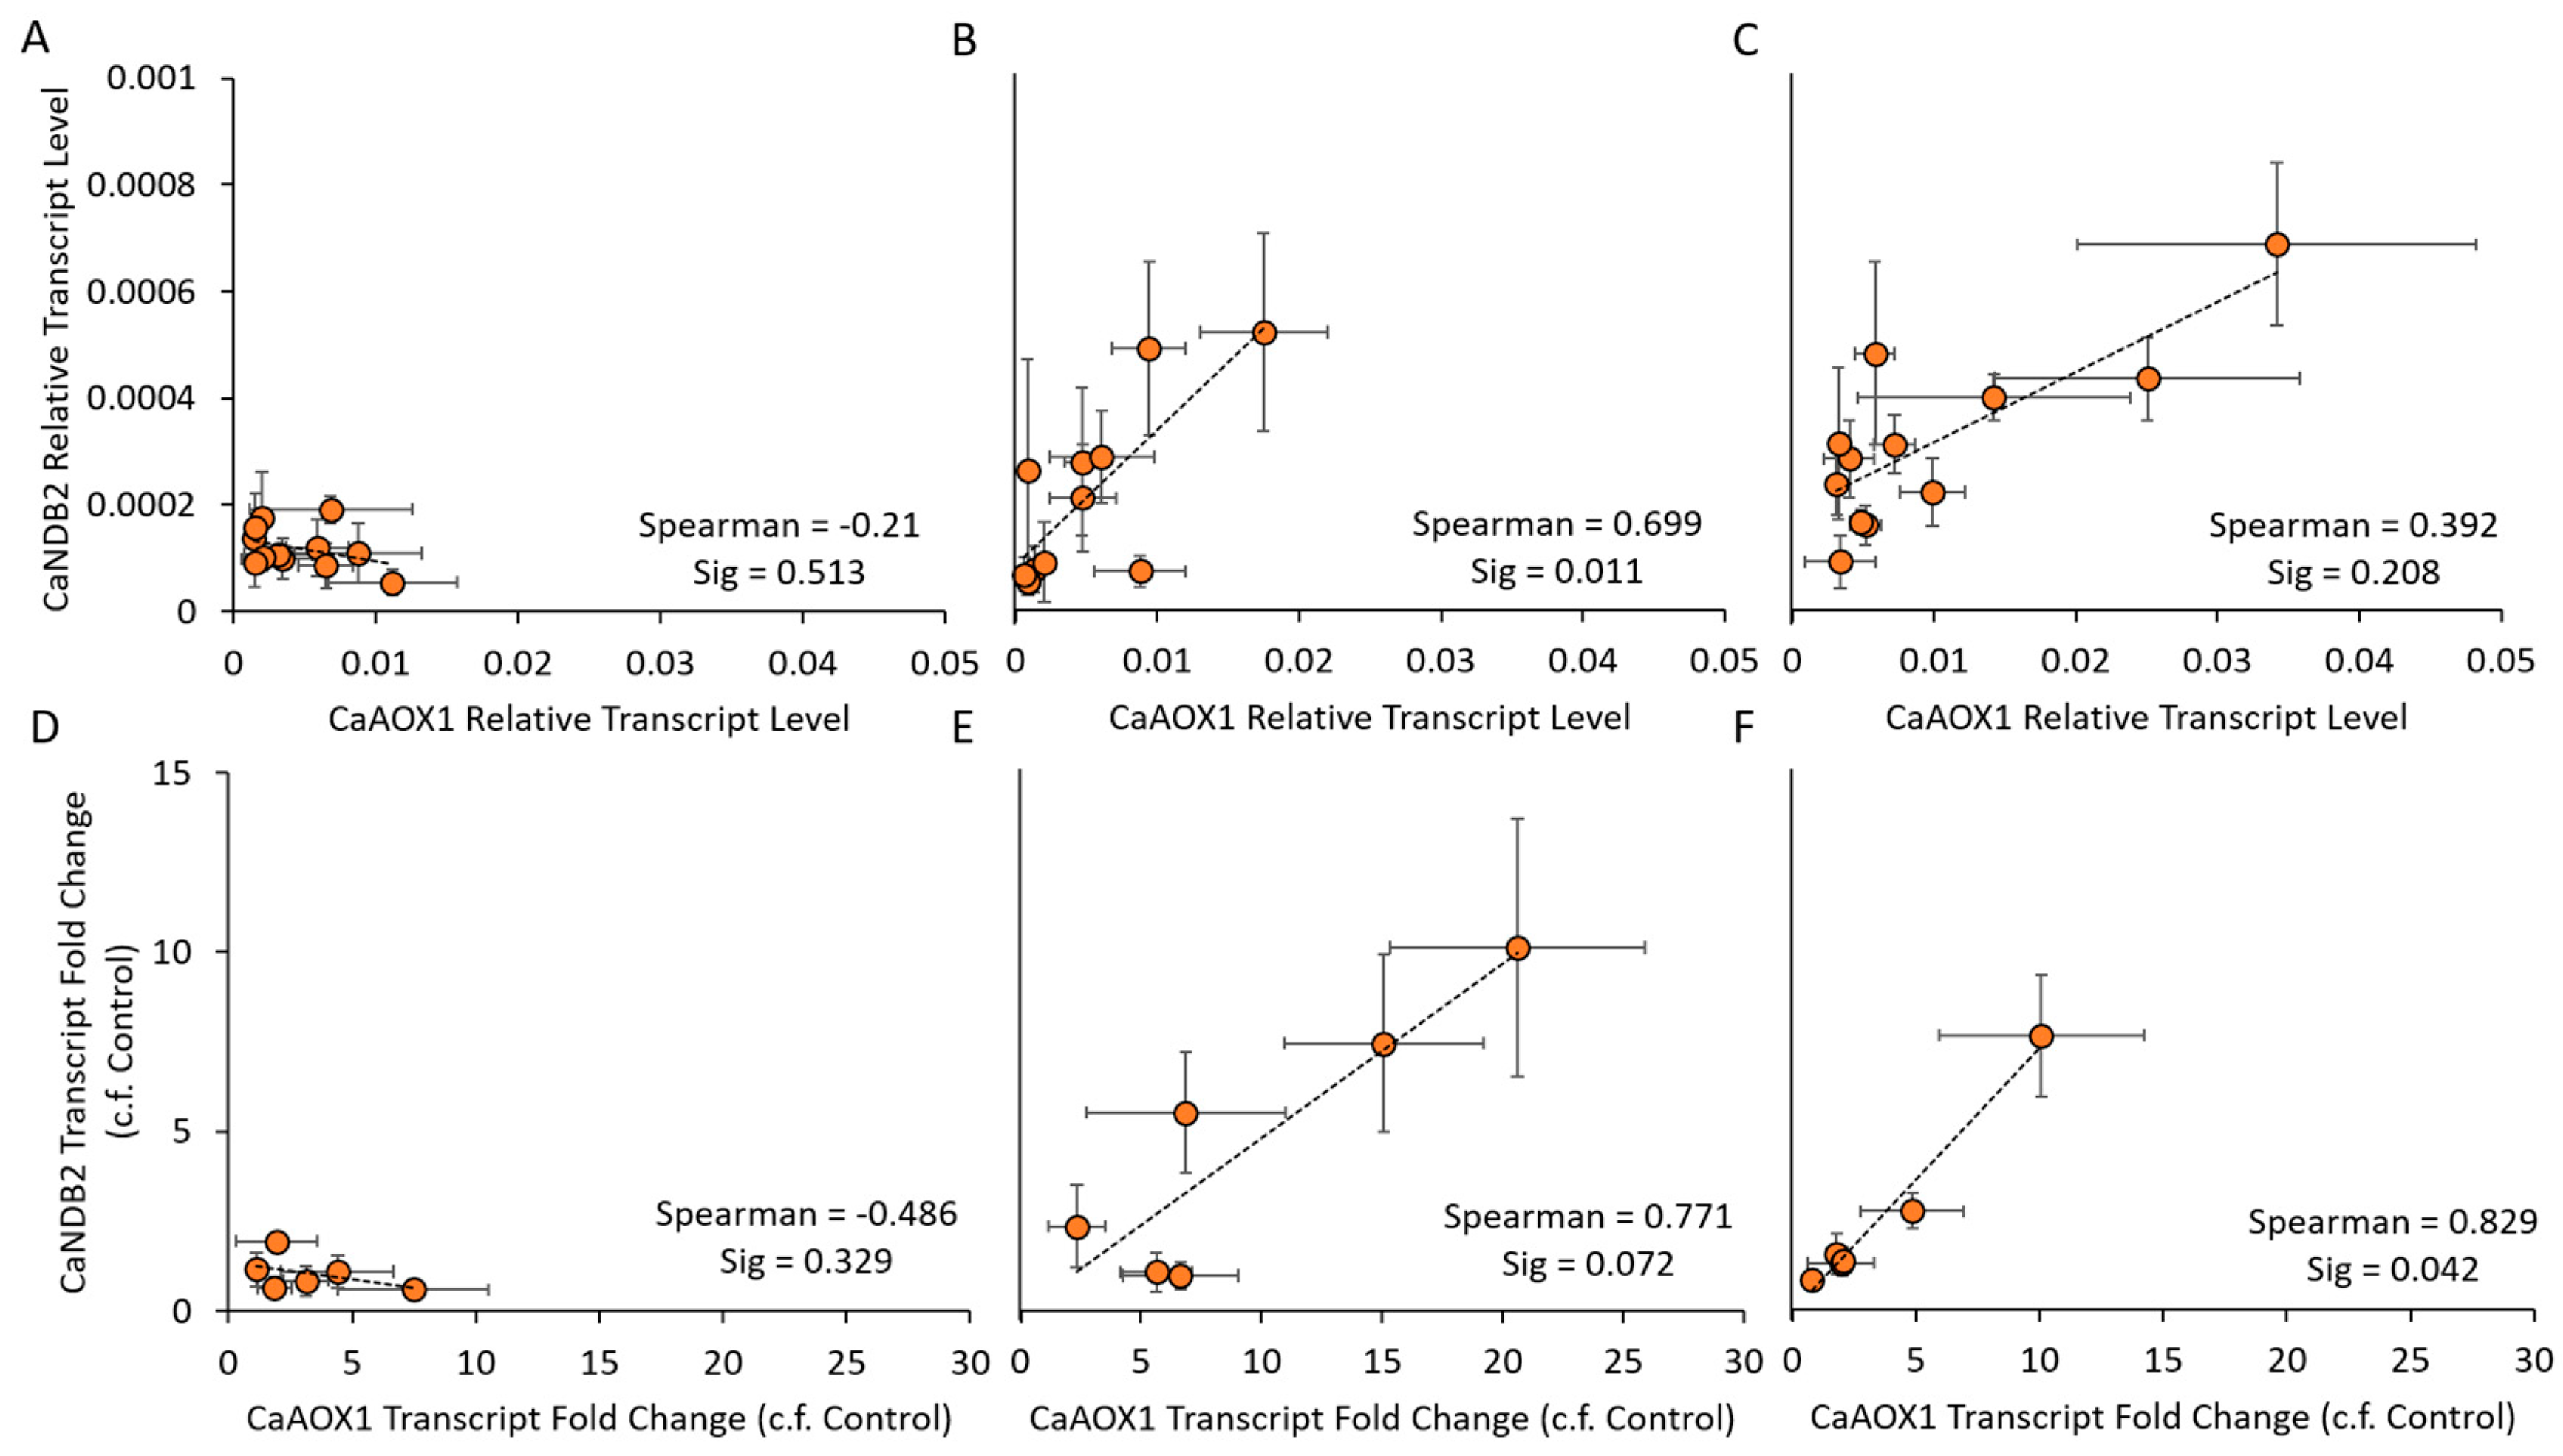
2.4. Co-Expression of AP Genes

The pattern of CaNDB2 transcript up-regulation was similar to that of CaAOX1, suggesting that there may be a degree of stress-induced co-regulation of these two genes in chickpea, as seen for AtAOX1a and AtNDB2 in Arabidopsis [45]. To explore further the possibility of co-regulation of the CaAOX1 and CaNDB2 genes, a correlation analysis with linear regression was completed, using transcript data from the salt experiment across all cultivars and treatments, at individual time points (Figure 5 and Figure S5). Positive correlations were found when using either relative transcript level data or fold change data, particularly at the two later timepoints T9 and T15 (Figure 5B and Figure 4F). Other AP genes that showed positive linear correlations with respect to their salinity response included CaAOX2A, CaAOX2B, CaNDA1 and CaNDC1 (Figure S5) and these also shared tissue-specific expression patterns, i.e., more highly expressed in shoots than roots (Figure 2, Table 2). CaNDA2, CaNDA3, CaNDA4 and CaNDB1 also showed positive correlations during the response to salt.
To further explore the potential co-regulation of CaAOX1 and CaNDB2, 2 kb of sequence upstream of the mRNA transcriptional start sites were scanned for the presence of elements highlighted by Thirkettle-Watts et al. [46] in G. max AOX promoter regions and by Clifton et al. [45] in A. thaliana AtAOX1A and AtNDB2 promoter regions, as well as for the presence of putative cis-acting regulatory elements in the PlantCARE database [47] (Figure S6). The upstream region of CaAOX2A was also included in these searches as a negative control, however only 1.6 kb could be used due to the presence of a neighbouring gene. CaAOX1, CaNDB2 and CaAOX2A all shared many regulatory elements from the PlantCARE database, therefore making it difficult to identify particular elements that may be responsible for salt-induced co-regulation of CaAOX1 and CaNDB2. However, elements present in AP genes of A. thaliana and G. max [45,46] were more common in the two stress-inducible genes CaAOX1 (13 elements) and CaNDB2 (6 elements) compared to the highly expressed CaAOX2A gene (2 elements), indicating that this warrants further experimental analysis.
To determine whether other legumes share similar co-expression patterns of AP genes during salinity treatments, publicly available transcriptomic data were revisited. Unfortunately, transcript level information for NDB2 and some other ND genes are missing from many legume datasets, due to the absence of probe sets on microarray chips and possibly below limits of detection for sequence reads. However, there are some data available for L. japonicus and a strong positive correlation was observed between LjAOX1 and LjNDB2 expression in salinity experiments (adjusted R2 = 0.86, p = 0.000; Figure S7).

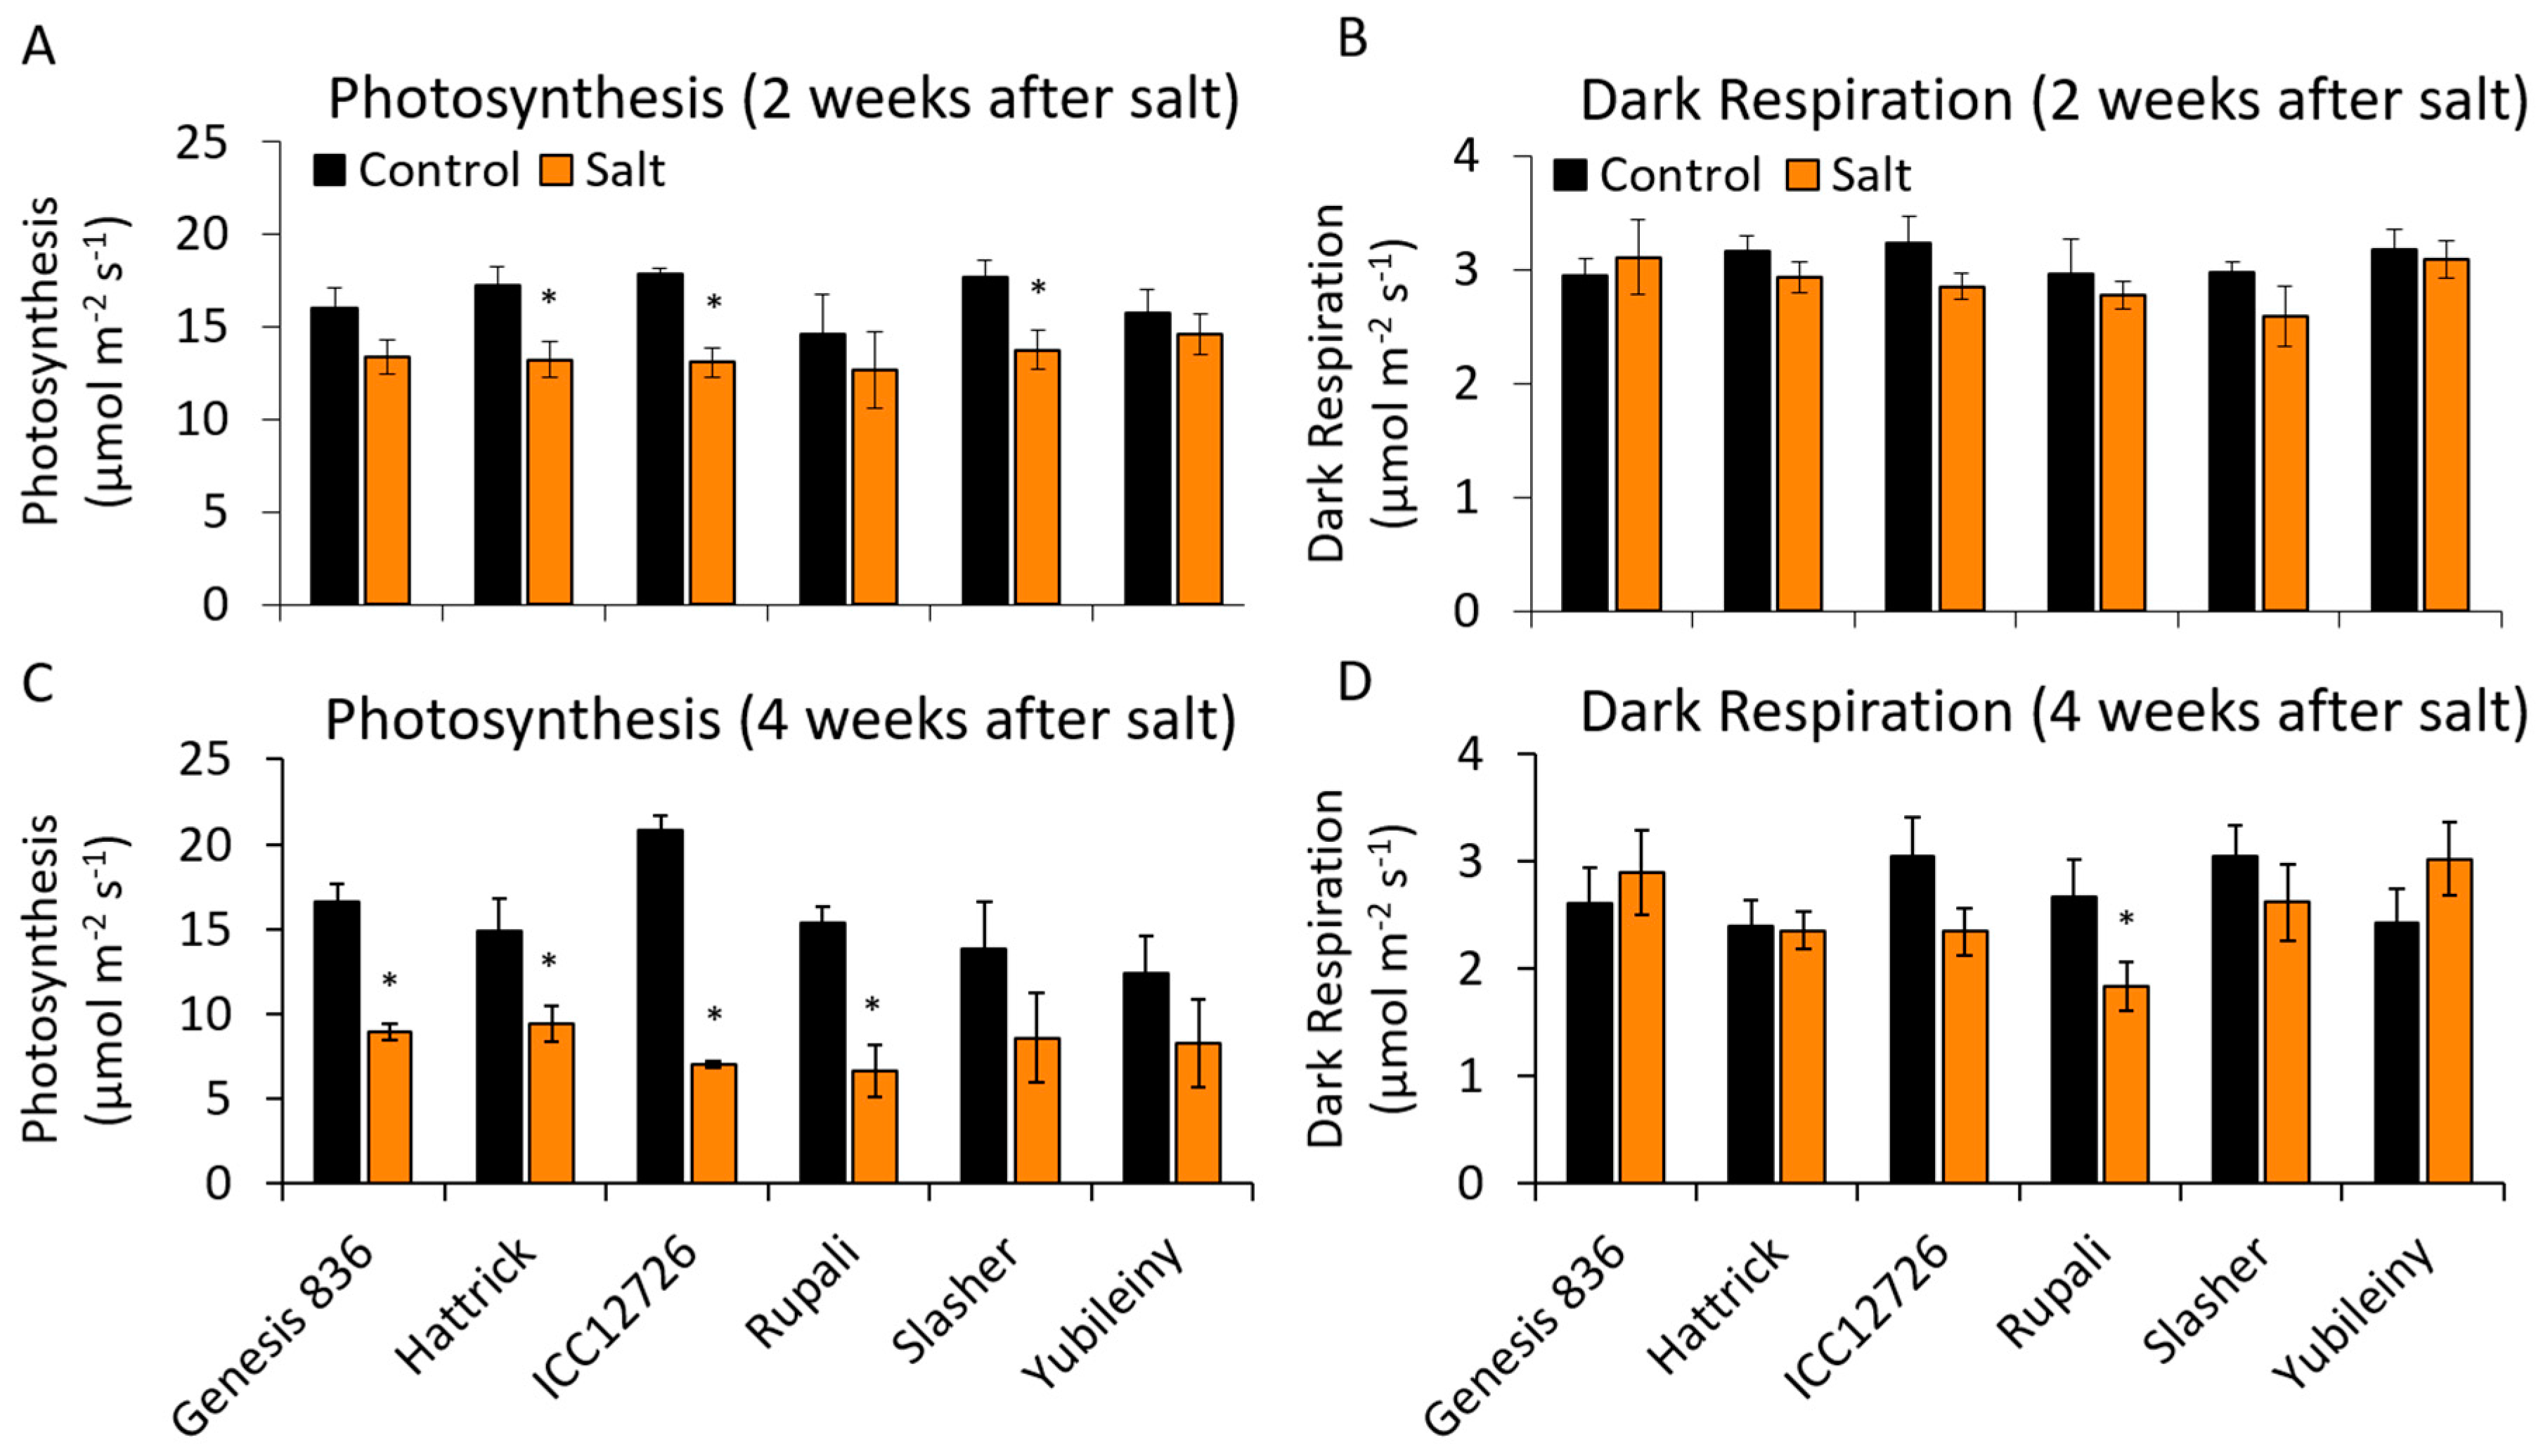
2.5. Maintaining Photosynthetic Rates during Salinity Stress

Chickpea cultivars that did not show enhanced CaNDB2 expression in response to salt, namely Genesis836, ICC12726 and Rupali, also showed the biggest inhibition of the rate of photosynthesis (Figure 6). Based on correlation analyses across all cultivars (Table S6), there was a positive relationship between CaNDB2 fold change at 9 days salinity treatment and photosynthesis at 4 weeks (R2 = 0.77, p = 0.072). A very similar relationship was also seen for CaNDB3 at 15 days. There was an even stronger positive correlation between CaAOX1 fold change at both 5 days and 9 days salinity treatment and photosynthesis at 4 weeks (R2 = 0.99, p < 0.001 and R2 = 0.89, p = 0.02, respectively). CaNDC1 fold change at 15 days also showed a weak positive correlation with photosynthesis, although not significant (R2 = 0.71, p = 0.111).

3. Discussion

The aim of this study was to identify the genes encoding AP components in chickpea mitochondria and to determine their expression in different tissues and in response to an environmental stress. We have identified, for the first time, the genes encoding members of the type2 alternative NAD(P)H dehydrogenases of the alternative mitochondrial electron transport chain in chickpea, and report on the activities of the corresponding proteins in mitochondria from leaves and roots. We have also examined the effect of salt stress on AP gene expression in leaves and found that specific gene responses are dependent on tissue Na content.

3.1. NAD(P)H Oxidation by Isolated Mitochondria

Rates of external NADH oxidation in chickpea leaf mitochondria were substantially higher (2–4 times) than those reported for A. thaliana leaf mitochondria, which under control conditions have very little AOX activity [13,20,22,48]. Rates were similar to those of soybean, tobacco and potato leaf mitochondria, all which have substantial AOX activity [5,49,50]. Similarly high rates of external NADH oxidation were seen in mitochondria from Arabidopsis transgenic lines over-expressing AOX and NDB2, which also have much higher AOX activity [22]. This might indicate that high AOX capacity enables high external NADH oxidation rates in leaf mitochondria, although this is not the case in non-photosynthetic tissues, since mitochondria from potato tubers have no AOX activity but readily oxidize external NADH [51].
Mitochondria from roots showed much less capacity than those from leaves for both external NAD(P)H and internal NADH oxidation, with the latter measured as oxidation of NAD-linked substrates. The lower rate of glycine oxidation in root mitochondria was expected, since glycine decarboxylase (GDC) genes are light dependent [52], but the much lower rates of malate oxidation in both the presence and absence of rotenone in roots are unusual in general [51]. Mitochondria from roots of soybean can oxidize both external NADH and malate rapidly and at rates similar to those in cotyledons [53]. The lower NAD(P)H oxidation rates in roots of chickpea were correlated with lower expression of all NDB genes and most of the NDA genes, as well as NDC, relative to leaves. Succinate oxidation rates were also much higher in leaves than in roots, as was AOX capacity [25]. Together, the results point to a far greater respiratory capacity in the leaves of chickpea, compared to roots.

3.2. Expression of AP Genes in Different Tissues

Our qRT-PCR analysis largely confirmed patterns of CaND expression as found in RNAseq databases and patterns of CaAOX expression reported in a previous study [25]. Overall, many of the AP genes were more highly expressed in leaves compared to roots by at least two-fold, the exceptions being CaAOX2D, CaNDA2 and CaNDA5, which were lower in roots but not significantly so. CaAOX2A and CaNDA1 in particular, but also CaAOX2B, CaNDB1 and CaNDC1, were highly expressed in leaves but essentially absent in roots. CaNDA3, CaNDA4, CaNDB2 and CaNDB4 were all expressed at very low levels in both organs, explaining the lack of data for these genes in RNAseq datasets; for each of these genes, transcript levels were significantly lower in roots than leaves. Public RNAseq data show that low expression of NDA1 and NDC1 in the roots seems to be a consistent feature of legumes. NDA1, NDC1 and AOX2A were also co-expressed across the six cultivars and three time points in the salinity stress experiment, perhaps pointing to cooperation between the three enzymes in photosynthetic tissues.
Why chickpea and other legumes (especially soybean) have such a large cohort of ND genes, compared to Arabidopsis, is not obvious, but it makes nomenclature rather difficult. The nomenclature used here is based partly on homology of the CaND protein sequences with Arabidopsis counterparts and their patterns of gene expression. CaNDB1 and CaNDC1 aligned well with the specific isoforms of Arabidopsis ND proteins based on sequence identity and tissue gene expression patterns. CaNDA1-4 did not, although CaNDA1 and 2 were more similar to the A. thaliana AtNDA protein sequences than CaNDA3 and 4. CaNDB2, 3 and 4 could not be associated with a particular A. thaliana AtNDB protein based on sequence identity nor tissue-specific gene expression patterns. CaNDB2 and CaNDB3 aligned with similar identity to both AtNDB2 and AtNDB3, and to counterparts in rice and barley [28]. Like AtNDB2, CaNDB3 was the most highly expressed isoform at the transcript level. However, CaNDB3 was not as stress-responsive; in that respect CaNDB2 was more similar to AtNDB2.

3.3. Stress-Responsive AP Genes in Chickpea

Some AP components in chickpea were stress-responsive (especially CaAOX1 and CaNDB2), but their up-regulation was time-dependent and temporary, as seen for some other species [28]. Analysis of elemental data from [37] showed that the six cultivars of chickpea could be separated into high and low accumulators of Na into leaf tissue, although lower leaf Na did not equate to improved tolerance, an observation made previously in chickpea [54,55]. There was a significant up-regulation of CaAOX1, CaNDB2, CaNDB4, CaNDA3 and CaNDC1 in the high Na accumulators which was absent in the low accumulators. This suggests that a stress response occurred in tissues with high Na levels, resulting in the upregulation of genes whose protein products encode a non-phosphorylating mETC. The signals mediating this upregulation remain to be identified, but it is possible that increased ROS or demand for osmolytes to help osmotic adjustment may have led to enhanced AP capacity in cells accumulating high Na. Such a response has been observed in Arabidopsis under salinity stress, which also accumulates Na at high levels [20]. Regardless of the mechanism, in the current study the upregulation of these genes in the high Na accumulators did not correlate with improved biomass during salinity stress in these cultivars.
Coordinated expression of CaAOX1 and CaNDB2 genes in response to salinity stress suggests that, despite the inherently high activities of AOX and external NADH oxidation observed in chickpea leaf mitochondria (and some other legumes), a stress-responsive aspect of the alternative pathway is still beneficial to the plant, at least in some tissues or cells. A similar correlation was found from publicly available data for L. japonicus, an important model legume. Overall, this suggests that different AP components play different roles and potentially in different cell types in chickpea and other legumes. Correlations in the stress-responsiveness of CaAOX1 and CaNDB2 occurred despite the distant localization of these genes in the genome. This suggests that their individual promoters contain common regulatory elements that are relevant to the salinity response, and indeed these two genes do contain some previously reported regulatory elements seen in the promoters of AP genes of G. max and A. thaliana [45,46]. In contrast, the CaAOX2 genes, CaNDA3 and CaNDB3, which are located very close to each other showed very different transcriptional patterns. Following gene duplication, altered transcriptional control may have arisen via new regulatory elements.
Correlations between transcriptional up-regulation of CaAOX1 and CaNDB2 with photosynthesis rates during salinity stress imply that one role of these stress-responsive AP genes is in prevention of photoinhibition or protection/maintenance of photosynthesis, as seen in tobacco and Arabidopsis [18,19,56,57,58]. Interestingly, CaNDC1 also showed a positive correlation with photosynthesis, although not statistically significant. Since the Arabidopsis NDC1 ortholog affects the redox state of plastoquinone pools in plastoglobules [59], it is possible that upregulation in salt-treated chickpea may assist electron transport in photosynthesis. Other mechanisms are also important for maintaining photosynthesis in salt-exposed chickpea. For example, the ability to exclude Na from photosynthetic cell types enabled salt-tolerant Genesis836 to maintain higher rates of photosynthesis than salt-sensitive Rupali [60]. Analysis of AP gene expression not only in individual tissues, but also in specific cell types and both in the presence and absence of stress, would greatly facilitate our understanding of this pathway.

4. Conclusions

In this study we have identified all components of the alternative respiratory electron transport chain in chickpea and determined their combined activities in mitochondria purified from shoots and roots. The results point to a far greater respiratory capacity of leaves compared to roots. We have also determined the effect of salt stress on the expression of AP genes and shown that CaAOX1 and CaNDB2 expression is coordinated under these conditions, as seen in some other species. The effect of this on AP activity in intact chickpea plants requires further investigation using mass spectrometry, especially given the inherently high rates of external NADH oxidation and constitutive AOX activity in isolated mitochondria.
To further explore potential roles of the expanded alternative pathway protein family in legumes, it would be useful to determine protein abundance of the different type II NAD(P)H dehydrogenases. This will require the production of isoform-specific antibodies to the various NDB and NDA proteins. It will also be important to determine more precisely the sub-cellular location, tissue and cell-specific patterns of expression of the multiple AOX isoforms and ND proteins in chickpea and other legumes, and how they impact plant growth and performance.

5. Materials and Methods

5.1. Plant Materials and Growth Conditions

For mitochondrial isolations, C. arietinum (cv. Hattrick) plants were grown in seedling trays for 2 weeks in a 1:1 sand:vermiculite mix and watered as needed with a standard nutrient solution (1 mM MES, 1.5 mM Ca(NO3)2, 0.5 mM MgSO4, 1 mM KH2PO4, 50 µM KCl, 25 µM H3BO3, 2 µM MnSO4, 2 µM ZnSO4, 0.5 µM CuSO4, 0.5 µM Na2MoO4, 1 µM NiSO4, pH 6.5), within a controlled-temperature greenhouse. On average, light levels were 300–500 µmol m−2 s−1 (PAR), with 14-h day-lengths and temperatures ranging between 26 and 32 °C during the day and 18 and 22 °C overnight. Chickpea accessions and growth conditions for the salinity experiment were as described previously [37].

5.2. Measurement of Type II NAD(P)H Dehydrogenase Activities in Purified Mitochondria

Mitochondria were purified from leaf and root tissues using a previously described method [25,61]. Leaf tissue (10–15 g) was homogenised using a Polytron (Kinematica, Switzerland), while root tissue (up to 80 g) was homogenised in batches using a mortar and pestle and acid-washed sand. The remainder of the protocol was as reported previously. Mitochondrial integrity was measured using an assay for cytochrome C oxidase, by monitoring the oxidation of reduced cytochrome C on a spectrophotometer [62] in the presence and absence of the detergent Triton X-100 (0.01%). Purified mitochondria were assayed for NAD(P)H oxidation using a Clarke-type oxygen electrode system coupled to O2View software (Hansatech Oxygraph). Mitochondria were suspended within the chambers in a standard reaction medium (0.3 M sucrose, 10 mM TES, 10 mM KH2PO4 and 2 mM MgCl2, pH 7.2) unless stated otherwise. Assays were conducted as previously described [63]. Briefly, external NAD(P)H oxidation assays were supplemented with ADP (1 mM) and either NADH or NADPH (1 mM) and initially conducted in the presence of calcium chelator EGTA (0.25 mM), before activating with the addition of CaCl2 (1 mM). To engage matrix located NADH dehydrogenases (i.e., Complex I and the NDA enzymes), internal NADH was generated via oxidation of the NAD-linked substrates malate and glycine, which are likely to be the predominant mitochondrial substrates in leaves [1]. Mitochondria were provided with either with a combination of malate (10 mM) and glutamate (10 mM) at pH 6.8 (conditions that prevent accumulation of oxaloacetate) or glycine (10 mM) at pH 7.2. All malate and glycine assays contained NAD (1 mM) and Complex I activity was subsequently inhibited by rotenone (25 µM) to estimate the combined rate of the internal NDA enzymes. Each biological replicate was measured using a single technical replicate, although assays were repeated if the results appeared unusual.

5.3. Identification of ND Genes in Chickpea and Other Legumes

To identify candidate genes encoding CaND proteins, sequences were extracted from the C. arietinum (CDC Frontier) Annotation Release 101 (NCBI; [64]), using BLASTp searches with ND protein sequences previously characterized from A. thaliana [4]. Where possible, genes were named according to the level of amino acid identity to A. thaliana proteins. Details of gene loci were collected from NCBI and used to determine proximity of all ND genes to each other. Protein sequences were used to identify potential target peptides using online predictive tools iPSORT [65], TargetP [66], ChloroP [67], MitoProtII [68] and Predotar [69].
CaND mRNA sequences were used to query the chickpea transcriptome database CTDB [70] and the Legume Information System LIS [71] for RNA contigs with high homology. Where potential splice variants were encountered, sequences for each variant were used in BLASTn searches within the RNAseq data to determine which was most likely expressed, but primers were also designed to test for the presence of each variant using RT-PCR. The RNAseq libraries were also used to examine tissue-specific and stress-response patterns of expression of all available CaND genes. Primers unique to each CaND gene were also designed for qRT-PCR analysis.
To identify potential orthologues of ND genes in other legumes, initially the non-redundant protein database from NCBI was queried using chickpea ND mRNA sequences, then resultant RefSeq mRNA sequences were used to query specific legume databases, to confirm gene localization. Databases included: Lotus Base ([72]; https://lotus.au.dk), L. japonicas Gene Expression Atlas ([73]; ljgea.noble.org/v2/), M. truncatula Gene Expression Atlas [74]; mtgea.noble.org/v3/), Legume Information System ([71]; https://legumeinfo.org) Legume IP ([75]; plantgrn.noble.org/LegumeIP/), Chickpea Transcriptome Database ([35]; www.nipgr.res.in/ctdb.html), SoyBase ([76]; soybase.org/soyseq) and PeanutBase ([77]; peanutbase.org).

5.4. Quantitative Real-Time Reverse-Transcriptase PCR

Four plants from each accession and treatment group (four biological replicates) were randomly selected. On days 5, 9 and 15 (T5, T9 and T15) after the final salt application, the two youngest fully developed leaves were snap-frozen in liquid nitrogen, pulverized into frozen powder then used for RNA extractions using a modified Trizol-like solution [37]. Following DNase treatment (NEB Biolab, England), 2 µg of RNA was reverse transcribed by Protoscript-II Reverse Transcriptase kit (NEB Biolab, England). Samples of cDNA diluted with water (1:10) were used for qRT-PCR analyses,
For qRT-PCR expression analysis, KAPA SYBR Fast Universal Mix (KAPA Biosystems, USA), was used in a Real-Time qPCR system CFX96 (BioRad, USA) according to a previously described protocol [25]. Primers were designed to unique regions of C. arietinum ND genes and where possible flanked predicted intron splice sites (Table S7). Assays were conducted in duplicate. Expression levels of target genes were normalized relative to the geometric mean of two reference gene transcript levels: Hsp90, Heat shock protein 90 (GR406804) and Ef1α, Elongation factor 1-alpha (AJ004960) [78].

5.5. Salinity Experiment

The experiment was carried out as described previously [37]. Briefly, seeds were germinated in Petri dishes for five days and transplanted to pots (four seedlings per pot) with artificial inoculation of rhizobium (NodulAid, BASF, Australia). Plants were grown in a controlled-temperature greenhouse with 25 °C/20 °C day/night temperature and 16h LED Grow Lights (~PAR 500 µmol m−2 s−1) (Heliospectra AB, Sweden). Pots were watered to a consistent soil moisture level of 80% field capacity. For salt stress, a final concentration of 90 mM NaCl (based on available soil moisture at 80% field capacity) was applied in four increments over two days, then maintained until the end of the experiment. In control pots, an equivalent volume of water was used under the same schedule.

5.6. Gas Exchange Measurements

Estimations of leaf photosynthesis and dark respiration were made using a Li-Cor 6400 Portable Photosynthesis System equipped with the standard 6 cm2 leaf chamber and an RGB light source. Adjustable parameters were set to 400 ppm CO2 (incoming/reference line) at a flow rate of 200 µmol s−1 and a block temperature of 25 °C. IRGAs were matched each time a new leaf was clamped. Measurements of photosynthesis were conducted using the youngest fully developed leaf of the main stem (typically the 4th leaf from the apex), after equilibrating for several minutes at 500 µmol m−2 s−1. Before leaf-clamping, the plant was exposed to 500 µmol m−2 s−1 (PAR) in the glasshouse for 30 min using supplemental LED lighting (Heliospectra LX602C, Conviron, CA). Two leaflets were trimmed from the base of the leaf, to ensure that the clamp could seal firmly around the leaf stem. After photosynthesis (A) measurement, the chamber light was turned off for 6–10 min until A and stomatal conductance were steady, then a measurement of respiration in the dark was collected. Measurements were conducted on randomised plants, between 10 am and 4 pm. Three successive measurements were logged per leaf.

5.7. Statistical Analyses

IBM® SPSS v25 was used for statistical tests and data plotted using Microsoft® Excel. For comparison of root and leaf mitochondrial activities (n = 3), an independent samples Kruskal–Wallis analysis was used, with post-hoc Dunn–Bonferroni tests. For comparison of root and leaf transcript levels, Mann–Whitney U tests were applied to each gene (n = 5). To test the effect of salt treatment on gene expression levels (n = 4) and gas exchange measurements (n = 3), Mann–Whitney U tests were used except in the case of Figure 6, where a Kruskal–Wallis test was first applied to each gene at T9, to determine whether there was a significant transcriptional effect of salt, before pairwise comparisons for each cultivar were made using post-hoc Dunn–Bonferroni tests. For correlation analyses, bivariate correlations using Spearman rank tests were used.

Supplementary Materials

Supplementary Materials can be found at https://www.mdpi.com/1422-0067/21/11/3844/s1.

Author Contributions

Conceptualization and experimental design, C.S. and D.A.D.; methodology and experimentation, C.S., T.K.M., N.J.B., C.L.D.J. and Y.S.; formal analysis and data curation, C.S. and T.K.M.; original draft preparation, C.S.; review and editing, D.A.D., K.L.S., C.L.D.J. and Y.S.; project administration and funding acquisition, D.A.D. All authors have read and agreed to the published version of the manuscript.

Funding

This research was funded by the Australian Research Council and the Grains Research and Development Corporation: Industrial Transformation Research Hub IH140100013.

Conflicts of Interest

The authors declare no conflict of interest. The funders had no role in the design of the study; in the collection, analyses, or interpretation of data; in the writing of the manuscript, or in the decision to publish the results.

Abbreviations

ADPAdenosine diphosphate
ANOVAAnalysis of variance
AOXAlternative oxidase
APAlternative respiratory pathway
ATPAdenosine triphosphate
DHDehydrogenase
DNADeoxyribonucleic acid
EDTAEthylenediaminetetraacetic acid
EGTAEthylene glycol-bis(β-aminoethyl ether)-N,N,N′,N′-tetraacetic acid
ETCElectron transport chain
FADFlavin adenine dinucleotide
FPKMFragments per kilobase per million mapped reads
LEDLight emitting diode
MES2-(N-morpholino)ethanesulfonic acid
NADNicotinamide adenine dinucleotide
NADHNicotinamide adenine dinucleotide, reduced
NADPHNicotinamide adenine dinucleotide phosphate, reduced
NAD(P)HNADH and/or NADPH
NCBINational Centre for Biotechnology Information
PARPhotosynthetically active radiation
qRT-PCRQuantitative reverse-transcriptase polymerase chain reaction
RNARibonucleic acid
ROSReactive oxygen species
S.E.M.Standard error of the mean
TES2-[(2-Hydroxy-1,1-bis(hydroxymethyl)ethyl)amino]ethanesulfonic acid

References

  1. Millar, A.H.; Whelan, J.; Soole, K.L.; Day, D.A. Organization and regulation of mitochondrial respiration in plants. In Annual Review of Plant Biology; Merchant, S.S., Briggs, W.R., Ort, D., Eds.; Annual Reviews: Palo Alto, CA, USA, 2011; Volume 62, pp. 79–104. [Google Scholar]
  2. Affourtit, C.; Krab, K.; Moore, A.L. Control of plant mitochondrial respiration. Biochim. Biophys. Acta-Bioenerg. 2001, 1504, 58–69. [Google Scholar] [CrossRef] [Green Version]
  3. Moore, C.S.; Cook-Johnson, R.J.; Rudhe, C.; Whelan, J.; Day, D.A.; Wiskich, J.T.; Soole, K.L. Identification of AtNDI1, an internal non-phosphorylating NAD(P)H dehydrogenase in Arabidopsis mitochondria. Plant Physiol. 2003, 133, 1968–1978. [Google Scholar] [CrossRef] [PubMed] [Green Version]
  4. Finnegan, P.M.; Soole, K.L.; Umbach, A.L. Alternative mitochondrial electron transport proteins in higher plants. In Plant Mitochondria: From Genome to Function; Day, D.A., Millar, H., Whelan, J., Eds.; Kluwer Academic Publishers: Dordrecht, The Netherlands, 2004; pp. 163–230. [Google Scholar]
  5. Michalecka, A.M.; Agius, S.C.; Møller, I.M.; Rasmusson, A.G. Identification of a mitochondrial external NADPH dehydrogenase by overexpression in transgenic Nicotiana sylvestris. Plant J. 2004, 37, 415–425. [Google Scholar] [CrossRef] [PubMed]
  6. Hoefnagel, M.H.N.; Millar, A.H.; Wiskich, J.T.; Day, D.A. Cytochrome and alternative respiratory pathways compete for electrons in the presence of pyruvate in soybean mitochondria. Arch. Biochem. Biophys. 1995, 318, 394–400. [Google Scholar] [CrossRef] [PubMed]
  7. Vanlerberghe, G.C. Alternative oxidase: A mitochondrial respiratory pathway to maintain metabolic and signaling homeostasis during abiotic and biotic stress in plants. Int. J. Mol. Sci. 2013, 14, 6805–6847. [Google Scholar] [CrossRef]
  8. Del-Saz, N.F.; Ribas-Carbo, M.; McDonald, A.E.; Lambers, H.; Fernie, A.R.; Florez-Sarasa, I. An in vivo perspective of the role(s) of the alternative oxidase pathway. Trends Plant Sci. 2018, 23, 206–219. [Google Scholar] [CrossRef]
  9. Cvetkovska, M.; Dahal, K.; Alber, N.A.; Jin, C.; Cheung, M.; Vanlerberghe, G.C. Knockdown of mitochondrial alternative oxidase induces the “stress state” of signaling molecule pools in Nicotiana tabacum, with implications for stomatal function. New Phytol. 2014, 203, 449–461. [Google Scholar] [CrossRef]
  10. Huang, S.B.; Van Aken, O.; Schwarzlander, M.; Belt, K.; Millar, A.H. The roles of mitochondrial reactive oxygen species in cellular signaling and stress response in plants. Plant Physiol. 2016, 171, 1551–1559. [Google Scholar] [CrossRef] [Green Version]
  11. Shapiguzov, A.; Vainonen, J.P.; Hunter, K.; Tossavainen, H.; Tiwari, A.; Jarvi, S.; Hellman, M.; Aarabi, F.; Alseekh, S.; Wybouw, B.; et al. Arabidopsis RCD1 coordinates chloroplast and mitochondrial functions through interaction with ANAC transcription factors. Elife 2019, 8, 35. [Google Scholar] [CrossRef]
  12. Wang, Y.; Berkowitz, O.; Selinski, J.; Xu, Y.; Hartmann, A.; Whelan, J. Stress responsive mitochondrial proteins in Arabidopsis thaliana. Free Radic. Biol. Med. 2018, 122, 28–39. [Google Scholar] [CrossRef]
  13. Wallström, S.V.; Florez-Sarasa, I.; Araujo, W.L.; Aidemark, M.; Fernandez-Fernandez, M.; Fernie, A.R.; Ribas-Carbo, M.; Rasmusson, A.G. Suppression of the external mitochondrial NADPH dehydrogenase, NDB1, in Arabidopsis thaliana affects central metabolism and vegetative growth. Mol. Plant 2014, 7, 356–368. [Google Scholar] [CrossRef] [PubMed] [Green Version]
  14. Sieger, S.M.; Kristensen, B.K.; Robson, C.A.; Amirsadeghi, S.; Eng, E.W.Y.; Abdel-Mesih, A.; Moller, I.M.; Vanlerberghe, G.C. The role of alternative oxidase in modulating carbon use efficiency and growth during macronutrient stress in tobacco cells. J. Exp. Bot. 2005, 56, 1499–1515. [Google Scholar] [CrossRef] [PubMed]
  15. Wallström, S.V.; Florez-Sarasa, I.; Araujo, W.L.; Escobar, M.A.; Geisler, D.A.; Aidemark, M.; Lager, I.; Fernie, A.R.; Ribas-Carbo, M.; Rasmusson, A.G. Suppression of NDA-type alternative mitochondrial NAD(P)H dehydrogenases in Arabidopsis thaliana modifies growth and metabolism, but not high light stimulation of mitochondrial electron transport. Plant Cell Physiol. 2014, 55, 881–896. [Google Scholar] [CrossRef]
  16. Rasmusson, A.G.; Fernie, A.R.; van Dongen, J.T. Alternative oxidase: A defence against metabolic fluctuations? Physiol. Plant. 2009, 137, 371–382. [Google Scholar] [CrossRef] [PubMed]
  17. Dahal, K.; Vanlerberghe, G.C. Alternative oxidase respiration maintains both mitochondrial and chloroplast function during drought. New Phytol. 2017, 213, 560–571. [Google Scholar] [CrossRef] [PubMed]
  18. Dahal, K.; Martyn, G.D.; Vanlerberghe, G.C. Improved photosynthetic performance during severe drought in Nicotiana tabacum overexpressing a nonenergy conserving respiratory electron sink. New Phytol. 2015, 208, 382–395. [Google Scholar] [CrossRef]
  19. Vanlerberghe, G.C.; Martyn, G.D.; Dahal, K. Alternative oxidase: A respiratory electron transport chain pathway essential for maintaining photosynthetic performance during drought stress. Physiol. Plant. 2016, 157, 322–337. [Google Scholar] [CrossRef]
  20. Smith, C.A.; Melino, V.J.; Sweetman, C.; Soole, K.L. Manipulation of alternative oxidase can influence salt tolerance in Arabidopsis thaliana. Physiol. Plant. 2009, 137, 459–472. [Google Scholar] [CrossRef]
  21. Smith, C.; Barthet, M.; Melino, V.; Smith, P.; Day, D.; Soole, K. Alterations in the mitochondrial alternative NAD (P) H dehydrogenase NDB4 lead to changes in mitochondrial electron transport chain composition, plant growth and response to oxidative stress. Plant Cell Physiol. 2011, 52, 1222–1237. [Google Scholar] [CrossRef]
  22. Sweetman, C.; Waterman, C.D.; Rainbird, B.M.; Smith, P.M.C.; Jenkins, C.L.D.; Day, D.A.; Soole, K.L. AtNDB2 Is the main external NADH dehydrogenase in mitochondria and is important for tolerance to environmental stress. Plant Physiol. 2019, 181, 774–788. [Google Scholar] [CrossRef] [Green Version]
  23. Considine, M.J.; Holtzapffel, R.C.; Day, D.A.; Whelan, J.; Millar, A.H. Molecular distinction between alternative oxidase from monocots and dicots. Plant Physiol. 2002, 129, 949–953. [Google Scholar] [CrossRef] [PubMed] [Green Version]
  24. Costa, J.H.; McDonald, A.E.; Arnholdt-Schmitt, B.; de Melo, D.F. A classification scheme for alternative oxidases reveals the taxonomic distribution and evolutionary history of the enzyme in angiosperms. Mitochondrion 2014, 19, 172–183. [Google Scholar] [CrossRef] [PubMed]
  25. Sweetman, C.; Soole, K.L.; Jenkins, C.L.D.; Day, D.A. Genomic structure and expression of alternative oxidase genes in legumes. Plant Cell Environ. 2019, 42, 71–84. [Google Scholar] [CrossRef] [PubMed] [Green Version]
  26. Rasmusson, A.G.; Soole, K.L.; Elthon, T.E. Alternative NAD(P)H dehydrogenases of plant mitochondria. Annu. Rev. Plant Biol. 2004, 55, 23–39. [Google Scholar] [CrossRef]
  27. Carrie, C.; Murcha, M.W.; Kuehn, K.; Duncan, O.; Barthet, M.; Smith, P.M.; Eubel, H.; Meyer, E.; Day, D.A.; Millar, A.H.; et al. Type II NAD(P)H dehydrogenases are targeted to mitochondria and chloroplasts or peroxisomes in Arabidopsis thaliana. FEBS Lett. 2008, 582, 3073–3079. [Google Scholar] [CrossRef] [Green Version]
  28. Wanniarachchi, V.R.; Dametto, L.; Sweetman, C.; Shavrukov, Y.; Day, D.A.; Jenkins, C.L.D.; Soole, K.L. Alternative respiratory pathway component genes (AOX and ND) in rice and barley and their response to stress. Int. J. Mol. Sci. 2018, 19, 915. [Google Scholar] [CrossRef] [Green Version]
  29. Soole, K.L.; Dry, I.B.; Wiskich, J.T. Oxidation of NADH by plant-mitochondria - kinetics and effects of calcium-ions. Physiol. Plant. 1990, 78, 205–210. [Google Scholar] [CrossRef]
  30. Elhafez, D.; Murcha, M.W.; Clifton, R.; Soole, K.L.; Day, D.A.; Whelan, J. Characterization of mitochondrial alternative NAD(P)H dehydrogenases in Arabidopsis: Intraorganelle location and expression. Plant Cell Physiol. 2006, 47, 43–54. [Google Scholar] [CrossRef] [Green Version]
  31. Kerscher, S.J. Diversity and origin of alternative NADH: Ubiquinone oxidoreductases. Biochim. Biophys. Acta-Bioenerg. 2000, 1459, 274–283. [Google Scholar] [CrossRef] [Green Version]
  32. Michalecka, A.M.; Svensson, A.S.; Johansson, F.I.; Agius, S.C.; Johanson, U.; Brennicke, A.; Binder, S.; Rasmusson, A.G. Arabidopsis genes encoding mitochondrial type II NAD(P)H dehydrogenases have different evolutionary orgin and show distinct responses to light. Plant Physiol. 2003, 133, 642–652. [Google Scholar] [CrossRef] [Green Version]
  33. Geisler, D.A.; Broselid, C.; Hederstedt, L.; Rasmusson, A.G. Ca2+-binding and Ca2+-independent respiratory NADH and NADPH dehydrogenases of Arabidopsis thaliana. J. Biol. Chem. 2007, 282, 28455–28464. [Google Scholar] [CrossRef] [PubMed] [Green Version]
  34. Hao, M.S.; Rasmusson, A.G. The evolution of substrate specificity-associated residues and Ca2+-binding motifs in EF-hand-containing type II NAD(P)H dehydrogenases. Physiol. Plant. 2016, 157, 338–351. [Google Scholar] [CrossRef] [PubMed]
  35. Garg, R.; Patel, R.K.; Jhanwar, S.; Priya, P.; Bhattacharjee, A.; Yadav, G.; Bhatia, S.; Chattopadhyay, D.; Tyagi, A.K.; Jain, M. Gene discovery and tissue-specific transcriptome analysis in chickpea with massively parallel pyrosequencing and web resource development. Plant Physiol. 2011, 156, 1661–1678. [Google Scholar] [CrossRef] [PubMed] [Green Version]
  36. Kudapa, H.; Garg, V.; Chitikineni, A.; Varshney, R.K. The RNA-Seq-based high resolution gene expression atlas of chickpea (Cicer arietinum L.) reveals dynamic spatio-temporal changes associated with growth and development. Plant Cell Environ. 2018, 41, 2209–2225. [Google Scholar] [CrossRef] [Green Version]
  37. Sweetman, C.; Khassanova, G.; Miller, T.K.; Booth, N.J.; Kurishbayev, A.; Jatayev, S.; Gupta, N.K.; Langridge, P.; Jenkins, C.L.D.; Soole, K.L.; et al. Salt-induced expression of intracellular vesicle trafficking genes, CaRab-GTP, and their association with Na+ accumulation in leaves of chickpea (Cicer arietinum L.). BMC Plant Biol. in Press.
  38. Zhang, J.Y.; de Carvalho, M.H.C.; Torres-Jerez, I.; Kang, Y.; Allen, S.N.; Huhman, D.V.; Tang, Y.H.; Murray, J.; Sumner, L.W.; Udvardi, M.K. Global reprogramming of transcription and metabolism in Medicago truncatula during progressive drought and after rewatering. Plant Cell Environ. 2014, 37, 2553–2576. [Google Scholar] [CrossRef] [PubMed] [Green Version]
  39. Li, D.F.; Su, Z.; Dong, J.L.; Wang, T. An expression database for roots of the model legume Medicago truncatula under salt stress. BMC Genom. 2009, 10, 517. [Google Scholar] [CrossRef] [Green Version]
  40. Iyer, N.J.; Tang, Y.; Mahalingam, R. Physiological, biochemical and molecular responses to a combination of drought and ozone in Medicago truncatula. Plant Cell Environ. 2013, 36, 706–720. [Google Scholar] [CrossRef]
  41. Hogekamp, C.; Arndt, D.; Pereira, P.A.; Becker, J.D.; Hohnjec, N.; Kuster, H. Laser microdissection unravels cell-type-specific transcription in arbuscular mycorrhizal roots, including CAAT-box transcription factor gene expression correlating with fungal contact and spread. Plant Physiol. 2011, 157, 2023–2043. [Google Scholar] [CrossRef] [Green Version]
  42. Diaz, P.; Betti, M.; Sanchez, D.H.; Udvardi, M.K.; Monza, J.; Marquez, A.J. Deficiency in plastidic glutamine synthetase alters proline metabolism and transcriptomic response in Lotus japonicus under drought stress. New Phytol. 2010, 188, 1001–1013. [Google Scholar] [CrossRef]
  43. Sanchez, D.H.; Lippold, F.; Redestig, H.; Hannah, M.A.; Erban, A.; Kramer, U.; Kopka, J.; Udvardi, M.K. Integrative functional genomics of salt acclimatization in the model legume Lotus japonicus. Plant J. 2008, 53, 973–987. [Google Scholar] [CrossRef] [PubMed]
  44. Sanchez, D.H.; Pieckenstain, F.L.; Szymanski, J.; Erban, A.; Bromke, M.; Hannah, M.A.; Kraemer, U.; Kopka, J.; Udvardi, M.K. Comparative functional genomics of salt stress in related model and cultivated plants identifies and overcomes limitations to translational genomics. PLoS ONE 2011, 6, e17094. [Google Scholar] [CrossRef]
  45. Clifton, R.; Lister, R.; Parker, K.L.; Sappl, P.G.; Elhafez, D.; Millar, A.H.; Day, D.A.; Whelan, J. Stress-induced co-expression of alternative respiratory chain components in Arabidopsis thaliana. Plant Mol. Biol. 2005, 58, 193–212. [Google Scholar] [CrossRef] [PubMed]
  46. Thirkettle-Watts, D.; McCabe, T.C.; Clifton, R.; Moore, C.; Finnegan, P.M.; Day, D.A.; Whelan, J. Analysis of the alternative oxidase promoters from soybean. Plant Physiol. 2003, 133, 1158–1169. [Google Scholar] [CrossRef] [PubMed] [Green Version]
  47. Lescot, M.; Dehais, P.; Thijs, G.; Marchal, K.; Moreau, Y.; Van de Peer, Y.; Rouze, P.; Rombauts, S. PlantCARE, a database of plant cis-acting regulatory elements and a portal to tools for in silico analysis of promoter sequences. Nucleic Acids Res. 2002, 30, 325–327. [Google Scholar] [CrossRef] [PubMed]
  48. Ostaszewska-Bugajska, M.; Juszczuk, I.M. Changes in the OXPHOS system in leaf and root mitochondria of Arabidopsis thaliana subjected to long-term sulphur deficiency. Acta Physiol. Plant. 2016, 38, 141. [Google Scholar] [CrossRef] [Green Version]
  49. Day, D.A.; Dry, I.B.; Soole, K.L.; Wiskich, J.T.; Moore, A.L. Regulation of alternative pathway activity in plant-mitochondria—Deviations from Q-pool behavior during oxidation of NADH and quinols. Plant Physiol. 1991, 95, 948–953. [Google Scholar] [CrossRef] [Green Version]
  50. Geisler, D.A.; Johansson, F.I.; Svensson, A.S.; Rasmusson, A.G. Antimycin A treatment decreases respiratory internal rotenone-insensitive NADH oxidation capacity in potato leaves. BMC Plant Biol. 2004, 4, 8. [Google Scholar] [CrossRef] [Green Version]
  51. Douce, R. Mitochondria in Higher Plants; Academic Press: Orlando, FL, USA, 1985. [Google Scholar]
  52. Walker, J.L.; Oliver, D.J. Light-induced increases in the glycine decarboxylase multienzyme complex from pea leaf mitochondria. Arch. Biochem. Biophys. 1986, 248, 626–638. [Google Scholar] [CrossRef]
  53. Day, D.A.; Millar, A.H.; Wiskich, J.T.; Whelan, J. Regulation of alternative oxidase activity by pyruvate in soybean mitochondria. Plant Physiol. 1994, 106, 1421–1427. [Google Scholar] [CrossRef] [Green Version]
  54. Khan, H.A.; Siddique, K.H.M.; Colmer, T.D. Salt sensitivity in chickpea is determined by sodium toxicity. Planta 2016, 244, 623–637. [Google Scholar] [CrossRef]
  55. Vadez, V.; Krishnamurthy, L.; Serraj, R.; Gaur, P.M.; Upadhyaya, H.D.; Hoisington, D.A.; Varshney, R.K.; Turner, N.C.; Siddique, K.H.M. Large variation in salinity tolerance in chickpea is explained by differences in sensitivity at the reproductive stage. Field Crop. Res. 2007, 104, 123–129. [Google Scholar] [CrossRef] [Green Version]
  56. Yamada, S.; Ozaki, H.; Noguchi, K. The mitochondrial respiratory chain maintains the photosynthetic electron flow in arabidopsis thaliana leaves under high-light stress. Plant Cell Physiol. 2020, 61, 283–295. [Google Scholar] [CrossRef]
  57. Jiang, Z.X.; Watanabe, C.K.A.; Miyagi, A.; Kawai-Yamada, M.; Terashima, I.; Noguchi, K. Mitochondrial AOX supports redox balance of photosynthetic electron transport, primary metabolite balance, and growth in Arabidopsis thaliana under high light. Int. J. Mol. Sci. 2019, 20, 3067. [Google Scholar] [CrossRef] [PubMed] [Green Version]
  58. Dahal, K.; Wang, J.; Martyn, G.D.; Rahimy, F.; Vanlerberghe, G.C. Mitochondrial alternative oxidase maintains respiration and preserves photosynthetic capacity during moderate drought in Nicotiana tabacum. Plant Physiol. 2014, 166, 1560–1574. [Google Scholar] [CrossRef] [PubMed] [Green Version]
  59. Piller, L.E.; Besagni, C.; Ksas, B.; Rumeau, D.; Brehelin, C.; Glauser, G.; Kessler, F.; Havaux, M. Chloroplast lipid droplet type II NAD(P)H quinone oxidoreductase is essential for prenylquinone metabolism and vitamin K-1 accumulation. Proc. Natl. Acad. Sci. USA 2011, 108, 14354–14359. [Google Scholar] [CrossRef] [Green Version]
  60. Kotula, L.; Clode, P.L.; Jimenez, J.D.; Colmer, T.D. Salinity tolerance in chickpea is associated with the ability to ‘exclude’ Na from leaf mesophyll cells. J. Exp. Bot. 2019, 70, 4991–5002. [Google Scholar] [CrossRef]
  61. Day, D.A.; Neuburger, M.; Douce, R. Biochemical-characterization of chlorophyll-free mitochondria from pea leaves. Aust. J. Plant Physiol. 1985, 12, 219–228. [Google Scholar] [CrossRef]
  62. Wigge, B.; Gardeström, P. The effects of different ionic-conditions on the activity of Cytochrome C-oxidase in purified plant mitochondria. In Plant Mitochondria; Moore, A.L., Beechey, R.B., Eds.; Springer: Boston, MA, USA, 1987. [Google Scholar]
  63. Soole, K.L.; Smith, C.A. Analysis of Type II NAD(P)H Dehydrogenases. In Plant Mitochindria; Whelan, J., Murcha, M.W., Eds.; Humana Press: New York, NY, USA, 2015; Volume 1305. [Google Scholar]
  64. Varshney, R.K.; Song, C.; Saxena, R.K.; Azam, S.; Yu, S.; Sharpe, A.G.; Cannon, S.; Baek, J.; Rosen, B.D.; Tar’an, B.; et al. Draft genome sequence of chickpea (Cicer arietinum) provides a resource for trait improvement. Nat. Biotechnol. 2013, 31, 240–246. [Google Scholar] [CrossRef] [Green Version]
  65. Bannai, H.; Tamada, Y.; Maruyama, O.; Nakai, K.; Miyano, S. Extensive feature detection of N-terminal protein sorting signals. Bioinformatics 2002, 18, 298–305. [Google Scholar] [CrossRef] [Green Version]
  66. Emanuelsson, O.; Brunak, S.; von Heijne, G.; Nielsen, H. Locating proteins in the cell using TargetP, SignalP and related tools. Nat. Protoc. 2007, 2, 953–971. [Google Scholar] [CrossRef]
  67. Emanuelsson, O.; Nielsen, H.; Von Heijne, G. ChloroP, a neural network-based method for predicting chloroplast transit peptides and their cleavage sites. Protein Sci. 1999, 8, 978–984. [Google Scholar] [CrossRef] [PubMed] [Green Version]
  68. Claros, M.G.; Vincens, P. Computational method to predict mitochondrially imported proteins and their targeting sequences. Eur. J. Biochem. 1996, 241, 779–786. [Google Scholar] [CrossRef] [PubMed]
  69. Small, I.; Peeters, N.; Legeai, F.; Lurin, C. Predotar: A tool for rapidly screening proteomes for N-terminal targeting sequences. Proteomics 2004, 4, 1581–1590. [Google Scholar] [CrossRef]
  70. Verma, M.; Kumar, V.; Patel, R.K.; Garg, R.; Jain, M. CTDB: An integrated chickpea transcriptome database for functional and applied genomics. PLoS ONE 2015, 10, e0136880. [Google Scholar] [CrossRef] [PubMed]
  71. Dash, S.; Campbell, J.D.; Cannon, E.K.S.; Cleary, A.M.; Huang, W.; Kalberer, S.R.; Karingula, V.; Rice, A.G.; Singh, J.; Umale, P.E.; et al. Legume information system (LegumeInfo.org): A key component of a set of federated data resources for the legume family. Nucleic Acids Res. 2016, 44, D1181–D1188. [Google Scholar] [CrossRef] [PubMed] [Green Version]
  72. Mun, T.; Bachmann, A.; Gupta, V.; Stougaard, J.; Andersen, S.U. Lotus Base: An integrated information portal for the model legume Lotus japonicus. Sci. Rep. 2016, 6, 39447. [Google Scholar] [CrossRef] [PubMed] [Green Version]
  73. Verdier, J.; Torres-Jerez, I.; Wang, M.Y.; Andriankaja, A.; Allen, S.N.; He, J.; Tang, Y.H.; Murray, J.D.; Udvardi, M.K. Establishment of the Lotus japonicus Gene Expression Atlas (LjGEA) and its use to explore legume seed maturation. Plant J. 2013, 74, 351–362. [Google Scholar] [CrossRef]
  74. Benedito, V.A.; Torres-Jerez, I.; Murray, J.D.; Andriankaja, A.; Allen, S.; Kakar, K.; Wandrey, M.; Verdier, J.; Zuber, H.; Ott, T.; et al. A gene expression atlas of the model legume Medicago truncatula. Plant J. 2008, 55, 504–513. [Google Scholar] [CrossRef]
  75. Li, J.; Dai, X.; Liu, T.; Zhao, P.X. LegumeIP: An interactive database for comparative genomics and transcriptomics of model legumes. Nucleic Acids Res. 2012, 40, D1221–D1229. [Google Scholar] [CrossRef] [Green Version]
  76. Grant, D.; Nelson, R.T.; Cannon, S.B.; Shoemaker, R.C. SoyBase, the USDA-ARS soybean genetics and genomics database. Nucleic Acids Res. 2010, 38, D843–D846. [Google Scholar] [CrossRef] [PubMed]
  77. Dash, S.; Cannon, E.K.S.; Kalberer, S.R.; Farmer, A.D.; Cannon, S.B. PeanutBase and Other Bioinformatic Resources for Peanut. In Peanuts Genetics, Processing, and Utilization; Stalker, H.T., Wilson, R.F., Eds.; AOCS Press: Waltham, MA, USA, 2016; pp. 241–252. [Google Scholar]
  78. Garg, R.; Sahoo, A.; Tyagi, A.K.; Jain, M. Validation of internal control genes for quantitative gene expression studies in chickpea (Cicer arietinum L.). Biochem. Biophys. Res. Commun. 2010, 396, 283–288. [Google Scholar] [CrossRef] [PubMed]
Figure 1. Activities of NAD(P)H dehydrogenases in chickpea leaf and root mitochondria. (A) External-facing NADH and NADPH dehydrogenase activities and their activation by calcium. (B) Internal-facing NADH dehydrogenase activities and their sensitivity to rotenone. Internal NADH was generated via the oxidation of the substrates, malate or glycine. Statistically significant differences indicated by differing letters, based on Kruskal–Wallis tests with post-hoc Dunn–Bonferroni tests (p < 0.05) (n = 3 ± S.E.M.).
Ijms 21 03844 g001
Figure 2. Expression of chickpea alternative pathway (AP) genes in leaf and root samples, using qRT-PCR. Transcripts are expressed (A) in leaf samples relative to transcript levels of two reference genes and (B) for root samples as a proportion of leaf samples. Statistical significance indicated by * (p < 0.05) and ** (p < 0.005) based on Mann–Whitney U tests between leaf and root samples, for each gene. (n = 5 ± S.E.M.).
Ijms 21 03844 g002
Figure 3. Expression of AP genes in control conditions and in response to salt treatment. Transcriptional patterns were expressed relative to reference genes for control samples in order to look for expression level differences between genes (A,B) and as fold change of salt-treated compared to untreated samples so that all genes could be visible on the same axis (C,D). Data were plotted from a single timepoint for clarity, at 9 days after salt treatment. This captured the peak response for most genes and cultivars. Data from 5 and 15 days after salt treatment showed similar patterns between control samples but some varying responses in salt-treatment (Figure S1). Statistical significance indicated by * (p < 0.05) based on Kruskal–Wallis tests between control and salt-treated samples, with post-hoc Dunn–Bonferroni tests for individual cultivars. (n = 4 ± S.E.M.).
Ijms 21 03844 g003
Figure 4. Transcriptional response of AP genes in cultivars with high or low leaf Na accumulation. Cultivars were grouped into low Na accumulators (Genesis836, Rupali and Yubileiny) and high Na accumulators (Hattrick, ICC12726 and Slasher), and compared for (A) Na:K and shoot biomass (n = 8) after 1 month of salt treatment and (B) fold change of AP genes relative to control plants (n = 4) at 15 days after salt treatment. Statistical significance indicated by * (p < 0.05) based on Mann–Whitney U tests between low and high Na accumulators.
Ijms 21 03844 g004
Figure 5. Co-ordinated expression of AOX1 and NDB2 in response to salinity stress in six chickpea cultivars over three timepoints. Comparisons were made based on relative transcript level data (AC) and as a fold change of salt-treated plants relative to controls (DF) at three different timepoints T5 (A,D), T9 (B,E) and T15 (C,F), using a Spearman correlation analysis in SPSS (v25, IBM). Means (n = 4 ± S.E.M.) plotted using Excel (Microsoft).
Ijms 21 03844 g005
Figure 6. Effect of 2-week (A,B)and 4-week (C,D) salt exposure on leaf gas exchange parameters. Photosynthesis (A,C) was measured at 500 PAR and respiration (B,D) after 10 min equilibration in the dark. All measures were taken with 400 ppm CO2 in the reference line, block temperature of 25 °C and flow rate of 200 µmol s−1, using a LiCor 6400. Statistical significance indicated by * (p < 0.05) based on Mann–Whitney U tests between control and salt-treated plants. (n = 3 ± S.E.M.).
Ijms 21 03844 g006
Table 1. Summary of chickpea type 2 NAD(P)H dehydrogenase (ND) gene nomenclature, accessions, gene locations and identities to the Arabidopsis orthologues.
Gene NameChromosomeGenome LocationLocus TagmRNA AccessionArabidopsis Ortholog (% Identity)
CaNDA1Ca525473001..25476933 complementLOC101503077XM_004500217AtNDA1 and 2 (72.9 and 73.7)
CaNDA2
[CaNDA5]
Ca225573447..25583926 complementLOC101505730XM_004490552
[XM_004490553]
AtNDA1 and 2 (72.4 and 73.0)
[AtNDA1 and 2 (70.5)]
CaNDA3Ca616203497..16207730LOC101510826XM_004504931AtNDA1 and 2 (65.7 and 66.1)
CaNDA4Ca431223913..31228505LOC101502969XM_004497885AtNDA1 and 2 (65.9 and 65.8)
CaNDB1Ca655894321..55900219LOC101508266XM_004507164AtNDB1 (69.5)
CaNDB2Ca11865091..1871364 complementLOC101508897XM_012713291AtNDB2 and 3 (71.6 and 70.6)
CaNDB3Ca615947443..15953377 complementLOC101502575XM_012717034AtNDB2 and 3 (71.3 and 71.0)
CaNDB4Ca655911093..55914789LOC101508589XM_004507165AtNDB2-4 (66.3–67.5)
CaNDC1Ca66799526..6805435 complementLOC101503757XM_004503838AtNDC1 (67.8)
Table 2. CaND expression in shoot (or leaf) vs. root tissues. Data presented as raw FPKM from RNAseq transcriptomic datasets. Full datasets for other tissues can be seen in Table S2. Veg = vegetative stage, Rep = reproductive stage, Sen = senescence stage.
Gene NameGarg et al. [35], FPKMKudapa et al. [36], FPKM
15 d.o. Shoot15 d.o. RootVeg. LeafVeg. RootRep. LeafRep. RootSen. LeafSen. Root
CaNDA1810540.4690.3730
CaNDA21324163917262225
CaNDA3--------
CaNDA4001428692
CaNDB163020938174926
CaNDB2--------
CaNDB31252607710556596547
CaNDB4--------
CaNDC1470715496455

