Article

DEAD-Box Protein RNA-Helicase DDX6 Regulates the Expression of HER2 and FGFR2 at the Post-Transcriptional Step in Gastric Cancer Cells

1
Department of Surgical Oncology, Graduate School of Medicine, Gifu University, 1-1 Yanagido, Gifu 501-1194, Japan
2
Department of General and Gastroenterological Surgery, Osaka Medical College, 2-7 Daigaku-machi, Takatsuki, Osaka 569-8686, Japan
3
Translational Research Program Osaka Medical College, 2-7 Daigaku-machi, Takatsuki, Osaka 569-8686, Japan
4
United Graduate School of Drug Discovery and Medical Information Sciences, Gifu University, 1-1 Yanagido, Gifu 501-1193, Japan
5
Division of Biomarker Discovery, Exploratory Oncology and Clinical Trial Center, National Cancer Center, 6-5-1 Kashiwa, Chiba 277-8577, Japan
*
Author to whom correspondence should be addressed.
Int. J. Mol. Sci. 2018, 19(7), 2005; https://doi.org/10.3390/ijms19072005
Submission received: 3 June 2018 / Revised: 3 July 2018 / Accepted: 6 July 2018 / Published: 9 July 2018
(This article belongs to the Special Issue Targeting Cancer through RNA Biology)

Abstract

:
The human DEAD/H-box RNA helicase DDX6 (RCK/p54) is a protein encoded by the fusion gene from the t(11;14)(q23;q32) chromosomal translocation observed in human B-cell lymphoma cell line RC-K8. DDX6 has a variety of functions such as translation initiation, pre-mRNA splicing, and ribosome assembly. However, details of the regulatory mechanism governing DDX6 and the functions of DDX6 are largely unknown. Previously, we reported that DDX6 is overexpressed in most malignant cell lines and clinical colorectal tumor samples and that DDX6 positively contributes to the pathogenesis of various cancers. In the current study, we aimed at revealing the function of DDX6 in HER2 and FGFR2 related human gastric cancer (GC) by using clinical samples and GC cell lines. DDX6 protein was overexpressed in about 60% of the clinical samples; HER2, in 35%; and FGFR2, in 30%, (n = 20). Interestingly, the DDX6 protein was overexpressed in all HER2-positive samples (n = 7), and in 83% (5 of 6) of the FGFR2-positive samples, which could reflect the contribution of DDX6 to the expression of HER2 and FGFR2. In the GC cell line MKN7, which has HER2 amplification, the knockdown of DDX6 by siR-DDX6 led to the decreased expression of the HER2 protein. On the other hand, the knockdown of HER2 did not influence the DDX6 expression. Similar results were also obtained for the KATO-III and HSC39 cell lines having amplified FGFR2 expression. The increased expression of DDX6 induced a significantly increased expression of the HER2 protein without increasing the mRNA expression. The results of an RNP Immunoprecipitation (RIP)-assay using GC cells indicated that the DDX6 protein acted as an RNA-binding protein for HER2 and FGFR2 mRNAs and positively regulated their post-transcriptional processes. These findings demonstrated that DDX6 was an upstream molecule that positively regulated the expression of HER2 and FGFR2 at the post-transcriptional step in GC cells.

1. Introduction

Gastric cancer (GC) is the fifth most common cancer and third most common cause of cancer-related deaths worldwide. More than 720,000 deaths are attributed to GC annually [1]. Nowadays, GC is diagnosed in its early stages owing to improvements in endoscopy. However, many cases are still first found in the advanced stage [1,2]. Therefore, the efficacy of chemotherapy determines their prognosis. In chemotherapy against GC, we use traditional drugs, such as 5-fluorouracil, cisplatin, and taxans, as well as molecular targeting drugs, such as trastuzumab (an anti-human epidermal growth factor receptor 2 (HER2) antibody) and ramucirumab (the anti-vascular endothelial growth factor receptor 2 (VEGFR2) monoclonal antibody). Recently, an immune checkpoint inhibitor, nivolumab, has become available [3]. However, advanced GC is still considered to be a fatal disease. The efficacy of chemotherapy for advanced or recurrent GC is not satisfactory because the median survival time of patients having undergone chemotherapy without an immune checkpoint inhibitor is reported to be only 6 to 13 months in some trials [4]. Thus, there is a need for the identification of new therapeutic target molecules and novel biomarkers for individualized therapy and early diagnosis. Nowadays, details about the genetic abnormalities in human GC, such as mutations, amplifications, and rearrangements, are being revealed [5]. However, no molecular targets for GC therapy have yet been suggested.
In such a situation, we tried to clarify what mechanism works in the pathogenesis involving the gene abnormalities of HER2, KRAS, FGFR2, MET, EGFR, PI3K, BRAF, and so on in GC. Interestingly, the amplifications of such genes are observed frequently (41%) in GC [5].
DDX6 (also termed RCK/p54) belongs to the family of human DEAD/H-box RNA helicases, and more from the t(11;14)(q23;q32) chromosomal translocation observed in human B-cell lymphoma cell line RC-K8. DDX6 has many functions such as translation initiation, pre-mRNA splicing, ribosome assembly by acting as an RNA-binding protein. Additionally, DDX6 contributes to the proliferation and differentiation in the stem and progenitor cells [6]. However, details regarding the mechanism of action and functions of DDX6 are largely unknown.
Previously, we reported that the DDX6 is overexpressed in most malignant cell lines and clinical colorectal tumor samples examined [7], and that DDX6 positively contributes to c-Myc expression at the translation initiation step in various cancers [8]. In the current study, we sought to clarify the role of DDX6 in the overexpression of HER2 and FGFR2 seen in GC cells.

2. Results

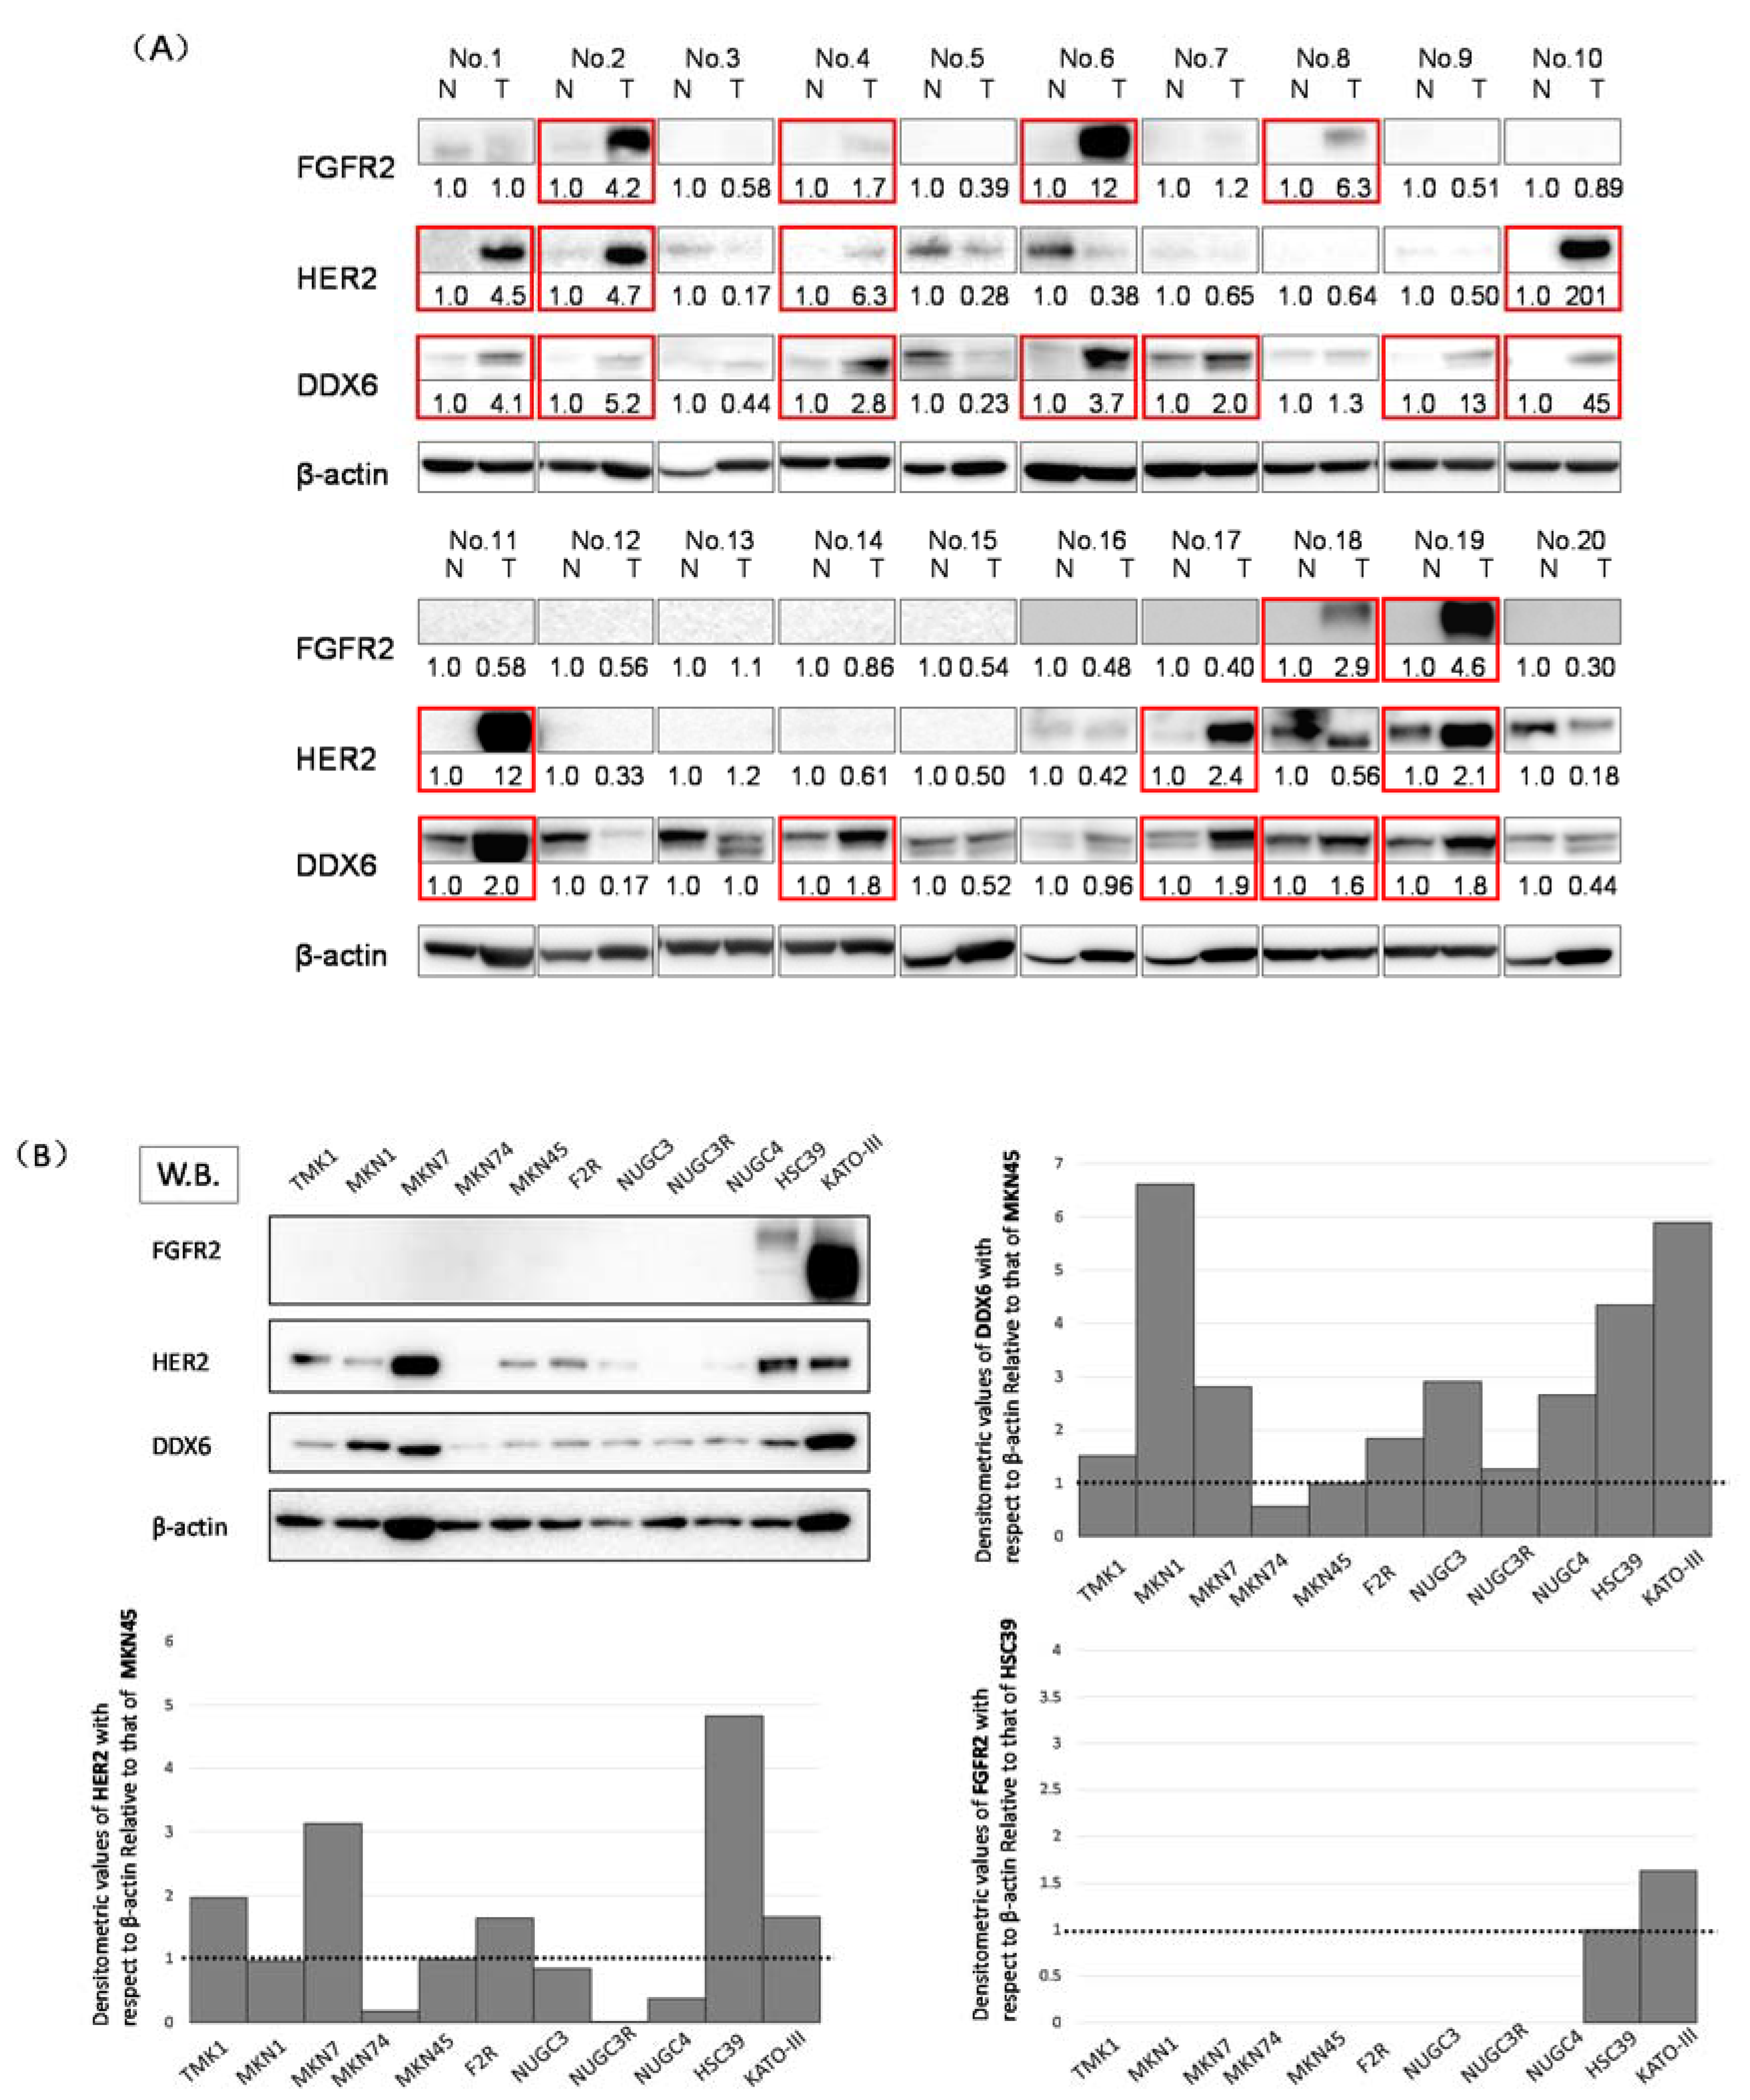
2.1. Expression Levels of DDX6, HER2, and FGFR2 in GC Clinical Tumor Samples

First, we used Western blotting to investigate the expression levels of DDX6, HER2, and FGFR2 in 20 GC clinical tumor samples. The expression levels of DDX6, HER2, and FGFR2 in these samples were increased in 12 (60%), 7 (35%), and 6 (30%) samples, respectively; 9 of 10 (90%) patients with the high expression levels of FGFR2 and/or HER2 also showed DDX6 overexpression (Figure 1B). These results suggested to us that RNA helicase DDX6 may be related to the expression of HER2 and FGFR2.

2.2. Expression Levels of DDX6, HER2, and FGFR2 in GC Cell Lines

We also investigated the expression levels of DDX6, HER2, and FGFR2 in TMK1, MKN7, MKN74, MKN45, F2R, NUGC3, NUGC3/5-FU, NUGC4, HSC39, and KATO-III cells by using Western blotting (Figure 1A). The expression levels of FGFR2 in HSC39 and KATO-III cells, which have FGFR2 gene amplification, were increased compared with those of the other cell lines tested. Additionally, the expression levels of HER2 in MKN7 cells, which amplified the expression of the HER2 gene, and those in the HSC39 and KATO-III cells, were increased compared with those of the other cell lines. Interestingly, the expression levels of DDX6 were significantly increased in MKN1, MKN7, HSC39, and KATO-III cells, which overexpressed FGFR2 and/or HER2. We selected the MKN7, MKN45, KATO-III, and HSC39 cell lines because HER2 and/or FGFR2 amplification and their overexpression were observed in these cell lines. MKN45 that expresses low levels of DDX6 and HER2 proteins was used as a control cell line (Figure 1B).

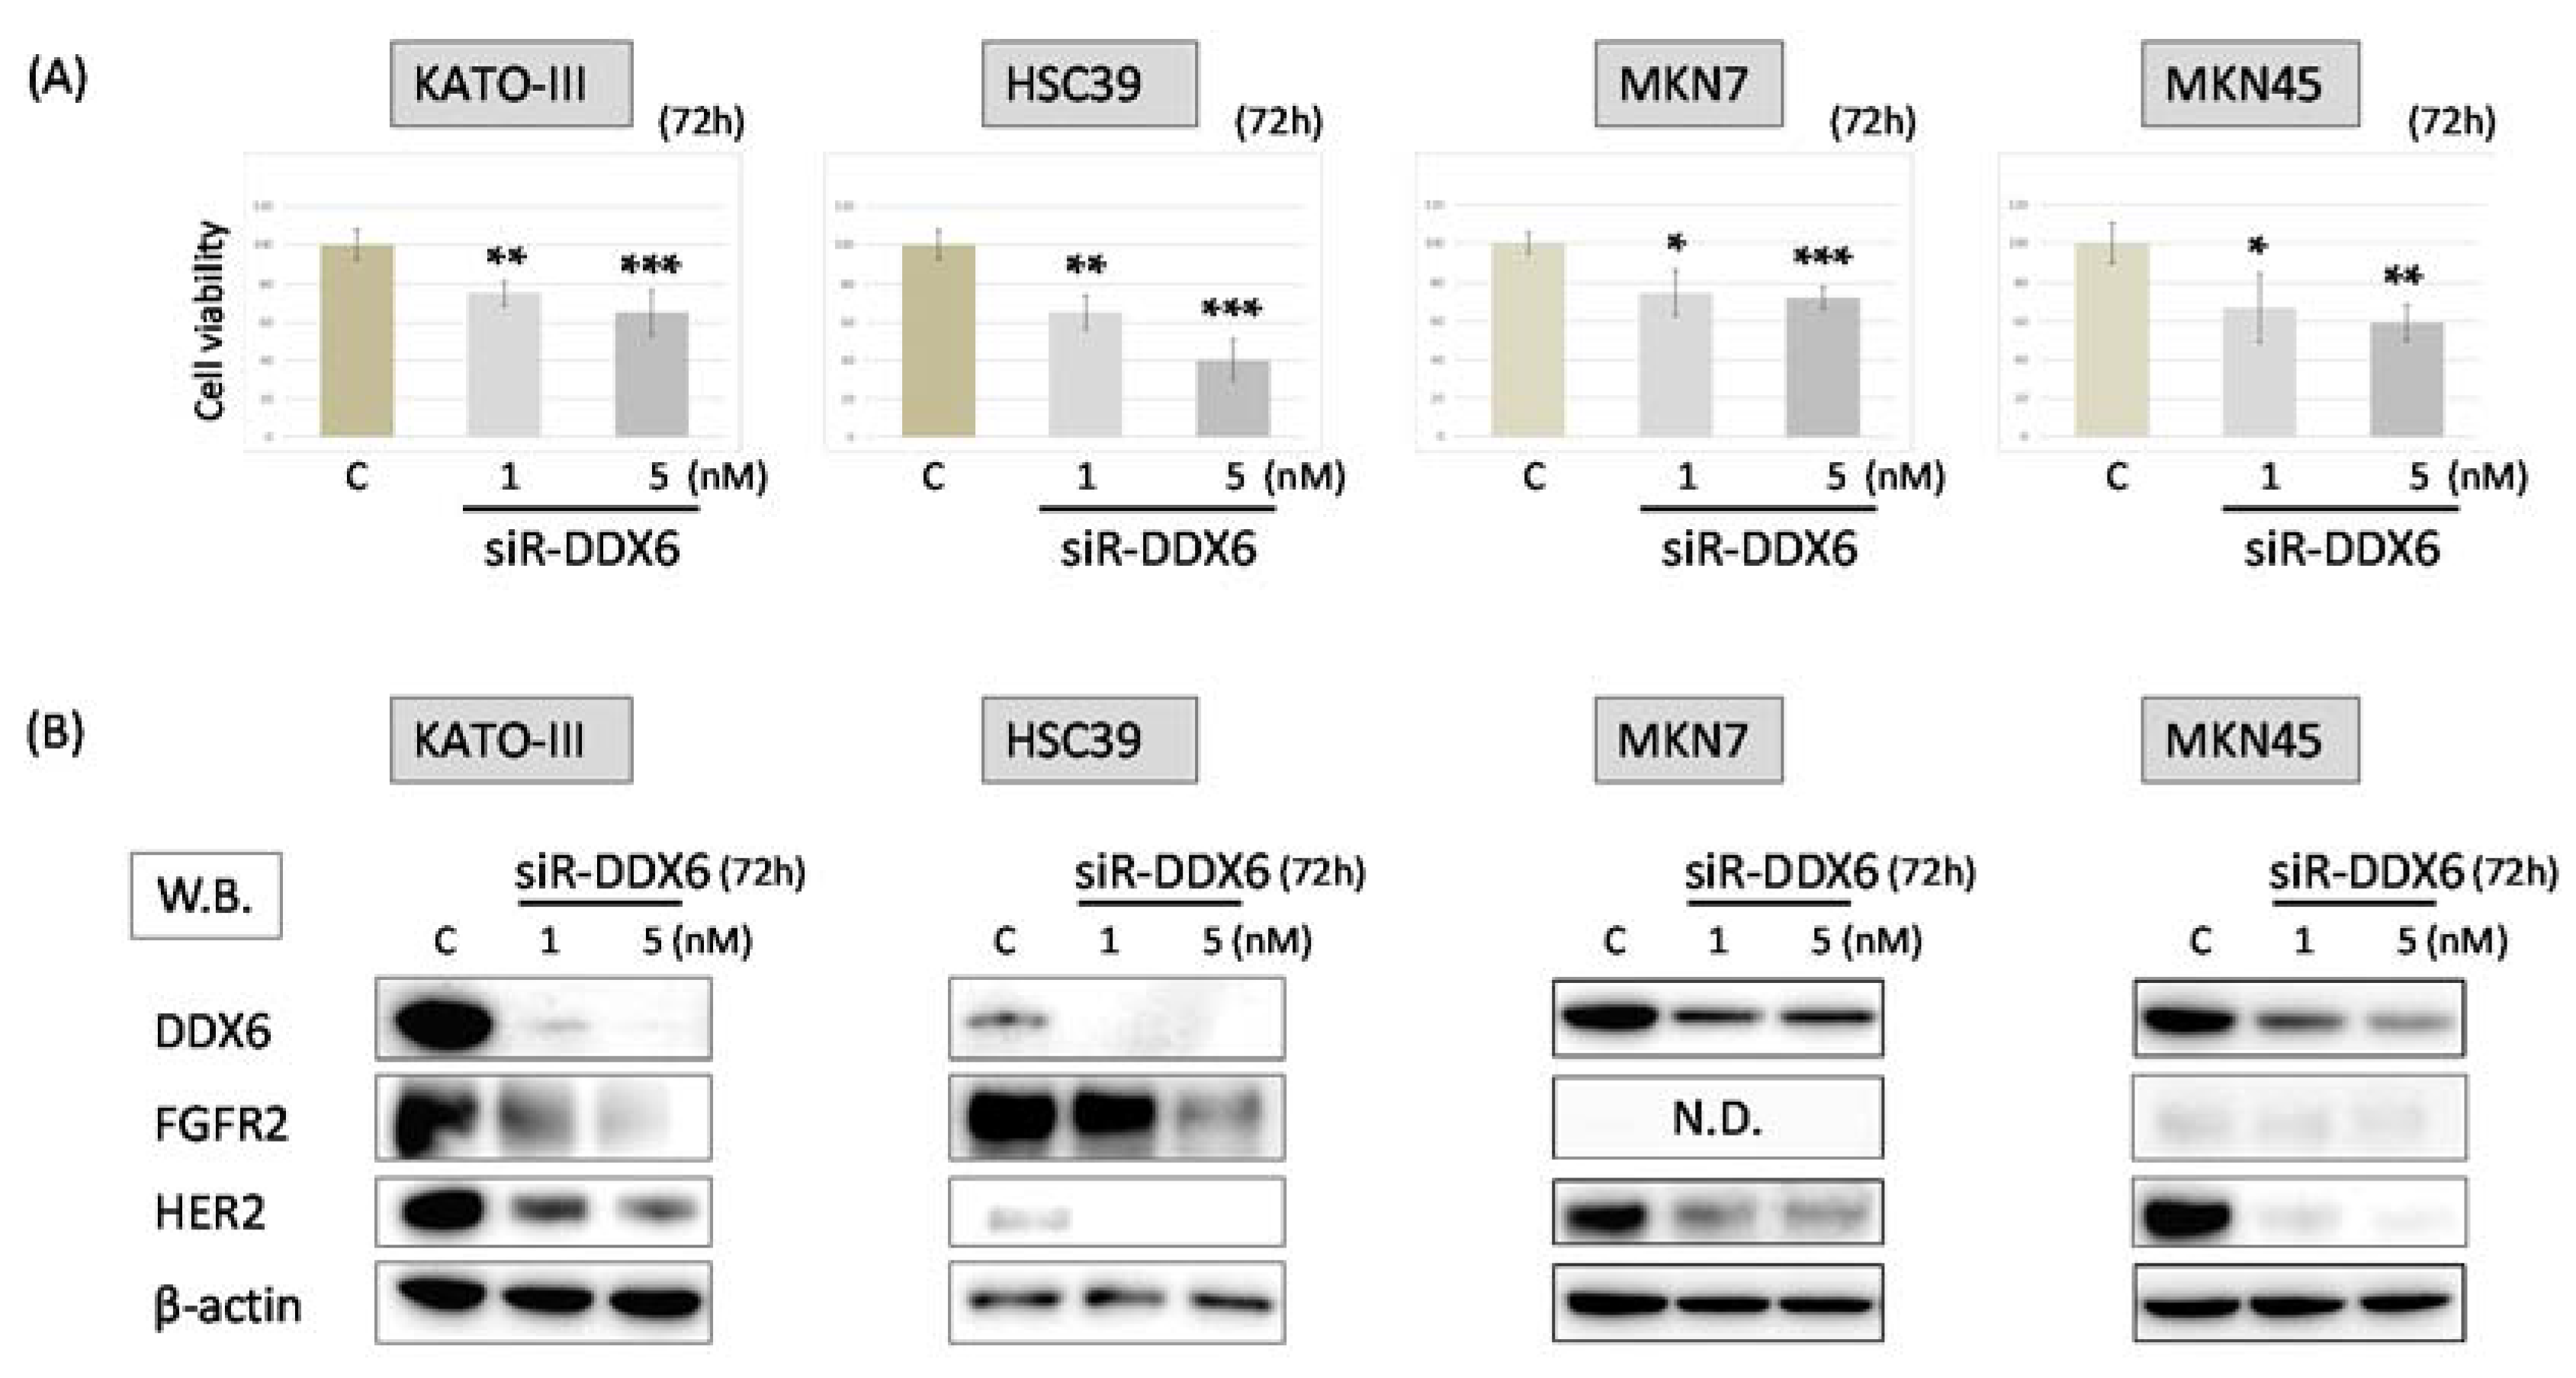
2.3. Effect of Knockdown of DDX6 on Expression of FGFR2 and HER2 in MKN7, MKN45, HSC39, and KATO-III Cells

In order to elucidate the relationship between DDX6 and the expression of HER2 and FGFR2, we examined the cell viability of MKN7, MKN45, HSC39, and KATO-III cells and the expression of FGFR2 and HER2 in them after the knockdown of DDX6 by use of siRNA for DDX6 (siR-DDX6). The number of viable cells in all cell lines tested was significantly reduced at 72 h after post transfection, even at the concentration of 1 nM siR-DDX6 (Figure 2A). Additionally, the knockdown of DDX6 led to decreased expression levels of HER2 and FGFR2 in these cells. These results indicated that DDX6 positively regulated the expression of HER2 and FGFR2 (Figure 2B).

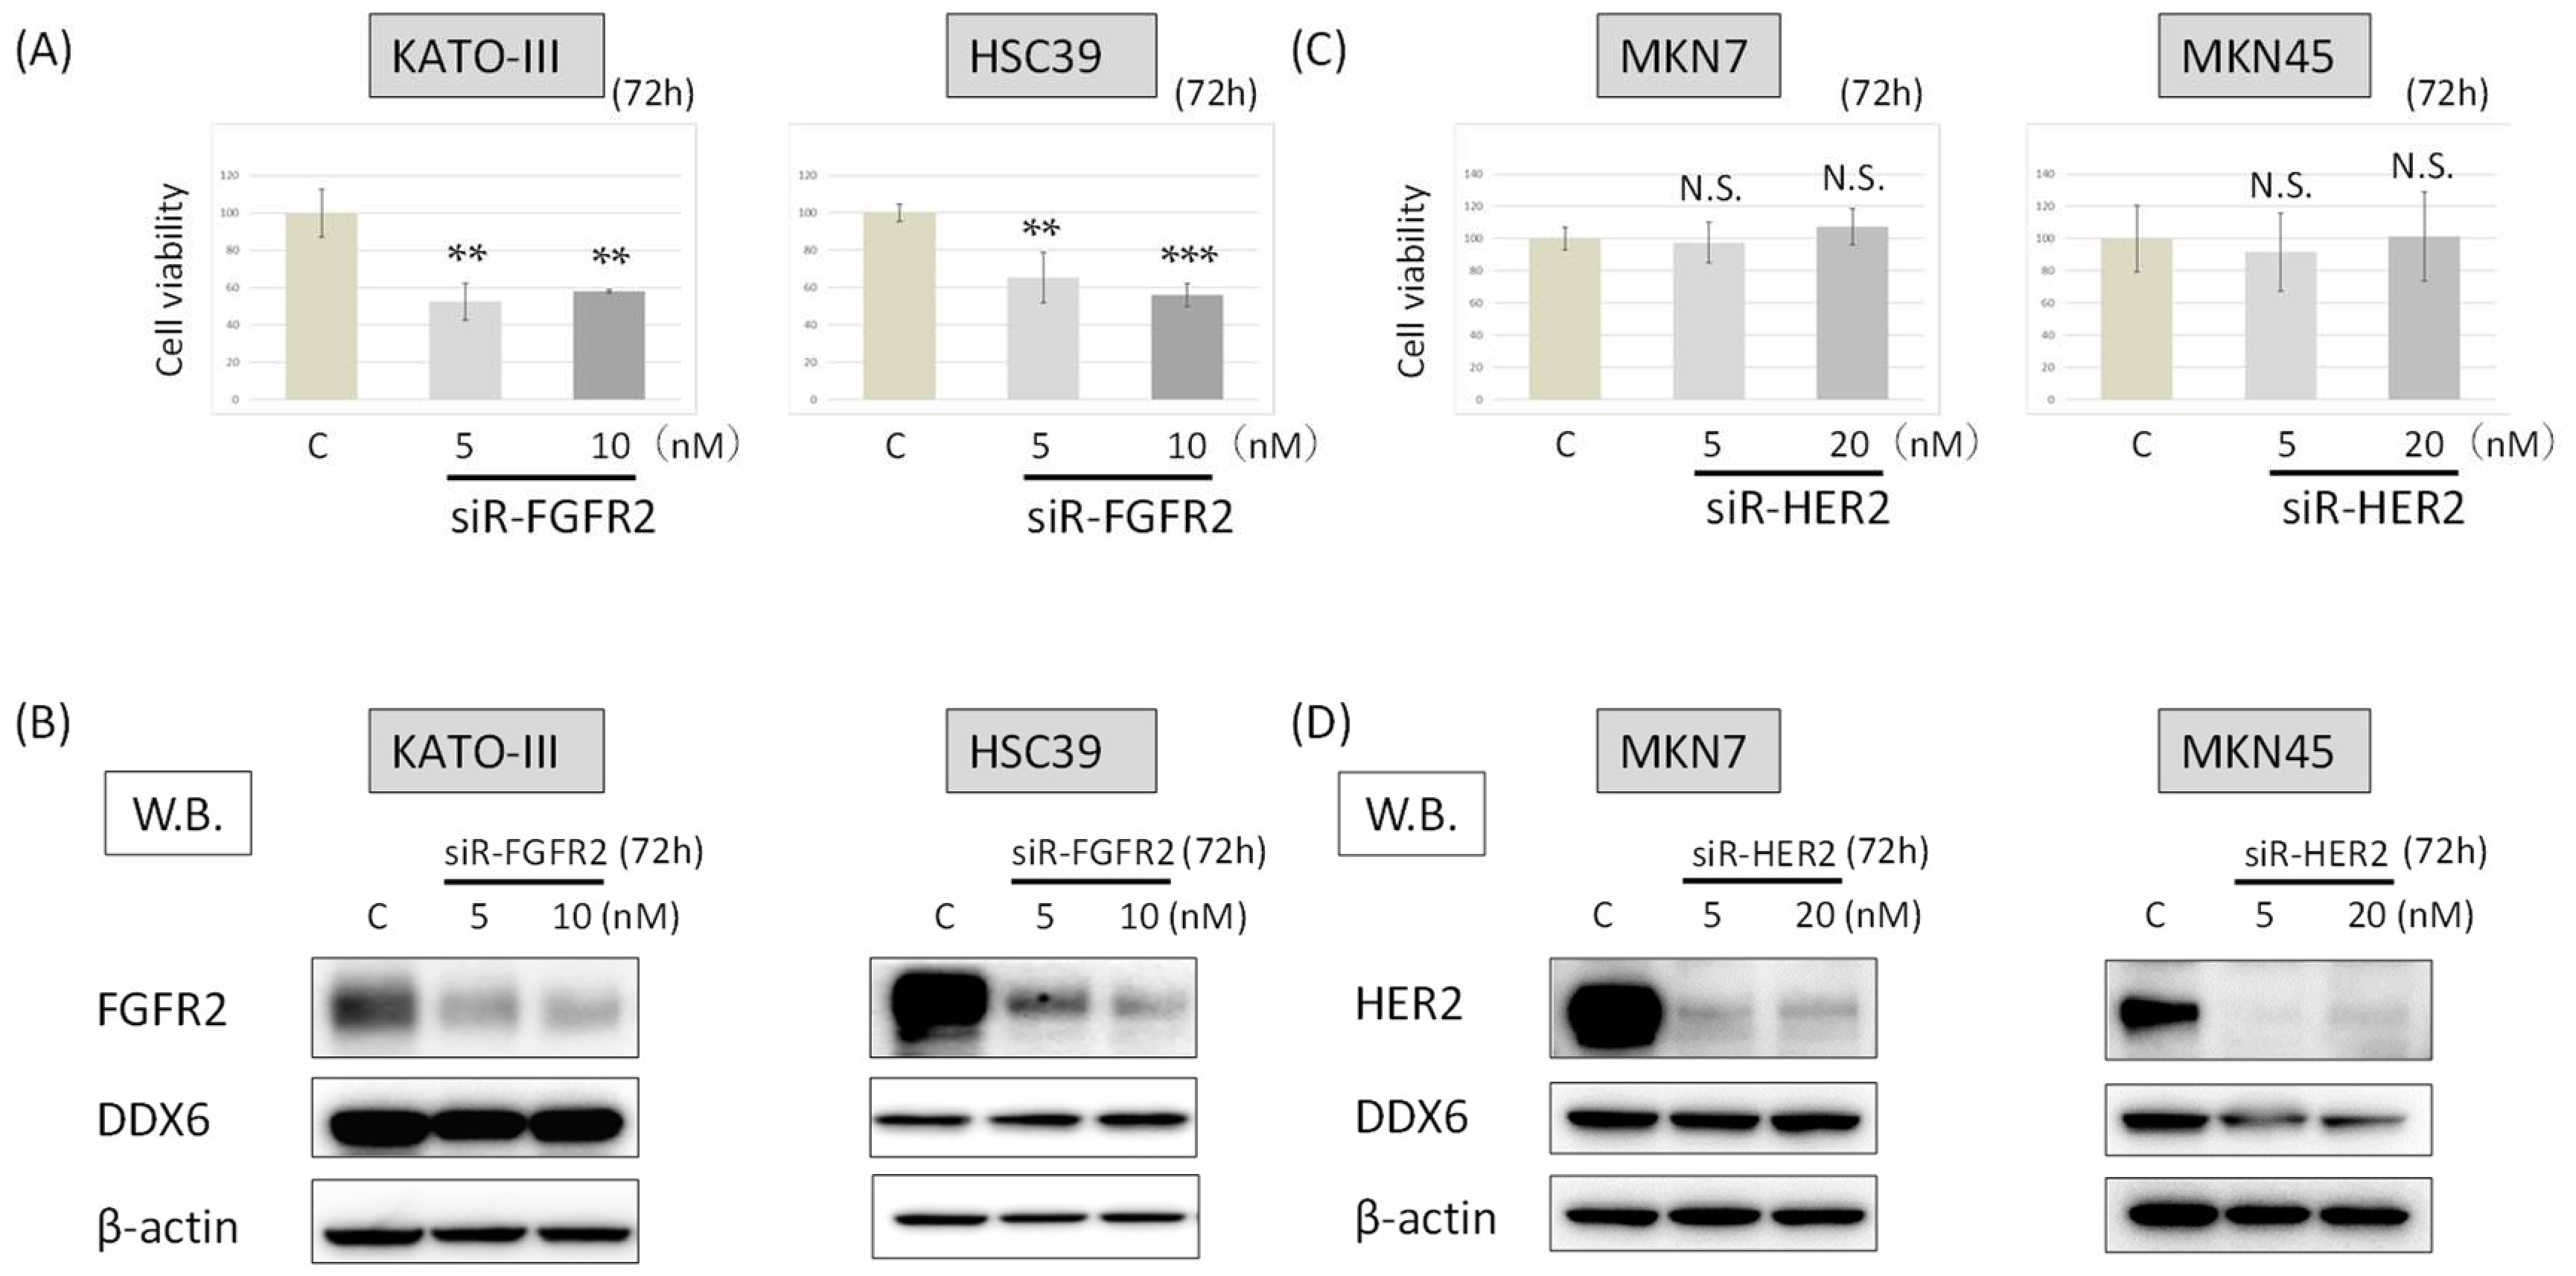
2.4. DDX6 Expression after the Knockdown of FGFR2 in HSC39 and KATO-III Cells

Next, we examined the growth of HSC39 and KATO-III cells and their expression of DDX6 at 72 h after FGFR2 silencing (siR-FGFR2), the cell viability for both cell types was significantly reduced to about 40–50% of the control (Figure 3A). On the other hand, the knockdown of FGFR2 did not change the expression levels of DDX6 in HSC39 or KATO-III cells (Figure 3B). These results suggested that DDX6 acted upstream of FGFR2 to regulate the FGFR2 expression.

2.5. DDX6 Expression after the Knockdown of HER2 in MKN7 and MKN45 Cells

We also examined whether knockdown of HER2 with siRNA for HER2 (siR-HER2) would influence the expression level of DDX6 in and viability of MKN7 and MKN45 cells. The numbers of viable cells remained almost unchanged compared with that of the control cells at 72 h after the knockdown of HER2 (Figure 3C). Additionally, the knockdown of HER2 did not affect the expression levels of DDX6 in either cell type (Figure 3D).
These results indicated that DDX6 also functioned upstream of HER2 to regulate the expression of HER2.

2.6. HER2 and FGFR2 mRNA Levels after Knockdown of DDX6 in MKN7, MKN45, HSC39, and KATO-III Cells

Furthermore, we used real-time RT-PCR to examine the mRNA levels of HER2, FGFR2, and DDX6 in siR-DDX6-transfected MKN7, MKN45, HSC39, and KATO-III cells (Figure 4). We confirmed that the expression level of DDX6 mRNA was extremely decreased in all siR-DDX6-treated cells (Figure 4A–D). Interestingly, the levels of HER2 and FGFR2 mRNAs in DDX6-silenced cells were slightly increased in a concentration-dependent manner compared with those of the control, whereas the protein expression levels of both FGFR2 and HER2 were significantly down-regulated in KATO-III and HSC39 cells (Figure 2B). Additionally, similar expression profiles were observed in the cases of MKN7 and MKN45 cell lines (Figure 2B and Figure 4C,D). These results suggested that DDX6 acted at a post-transcriptional step for the expression of HER2 and FGFR2.

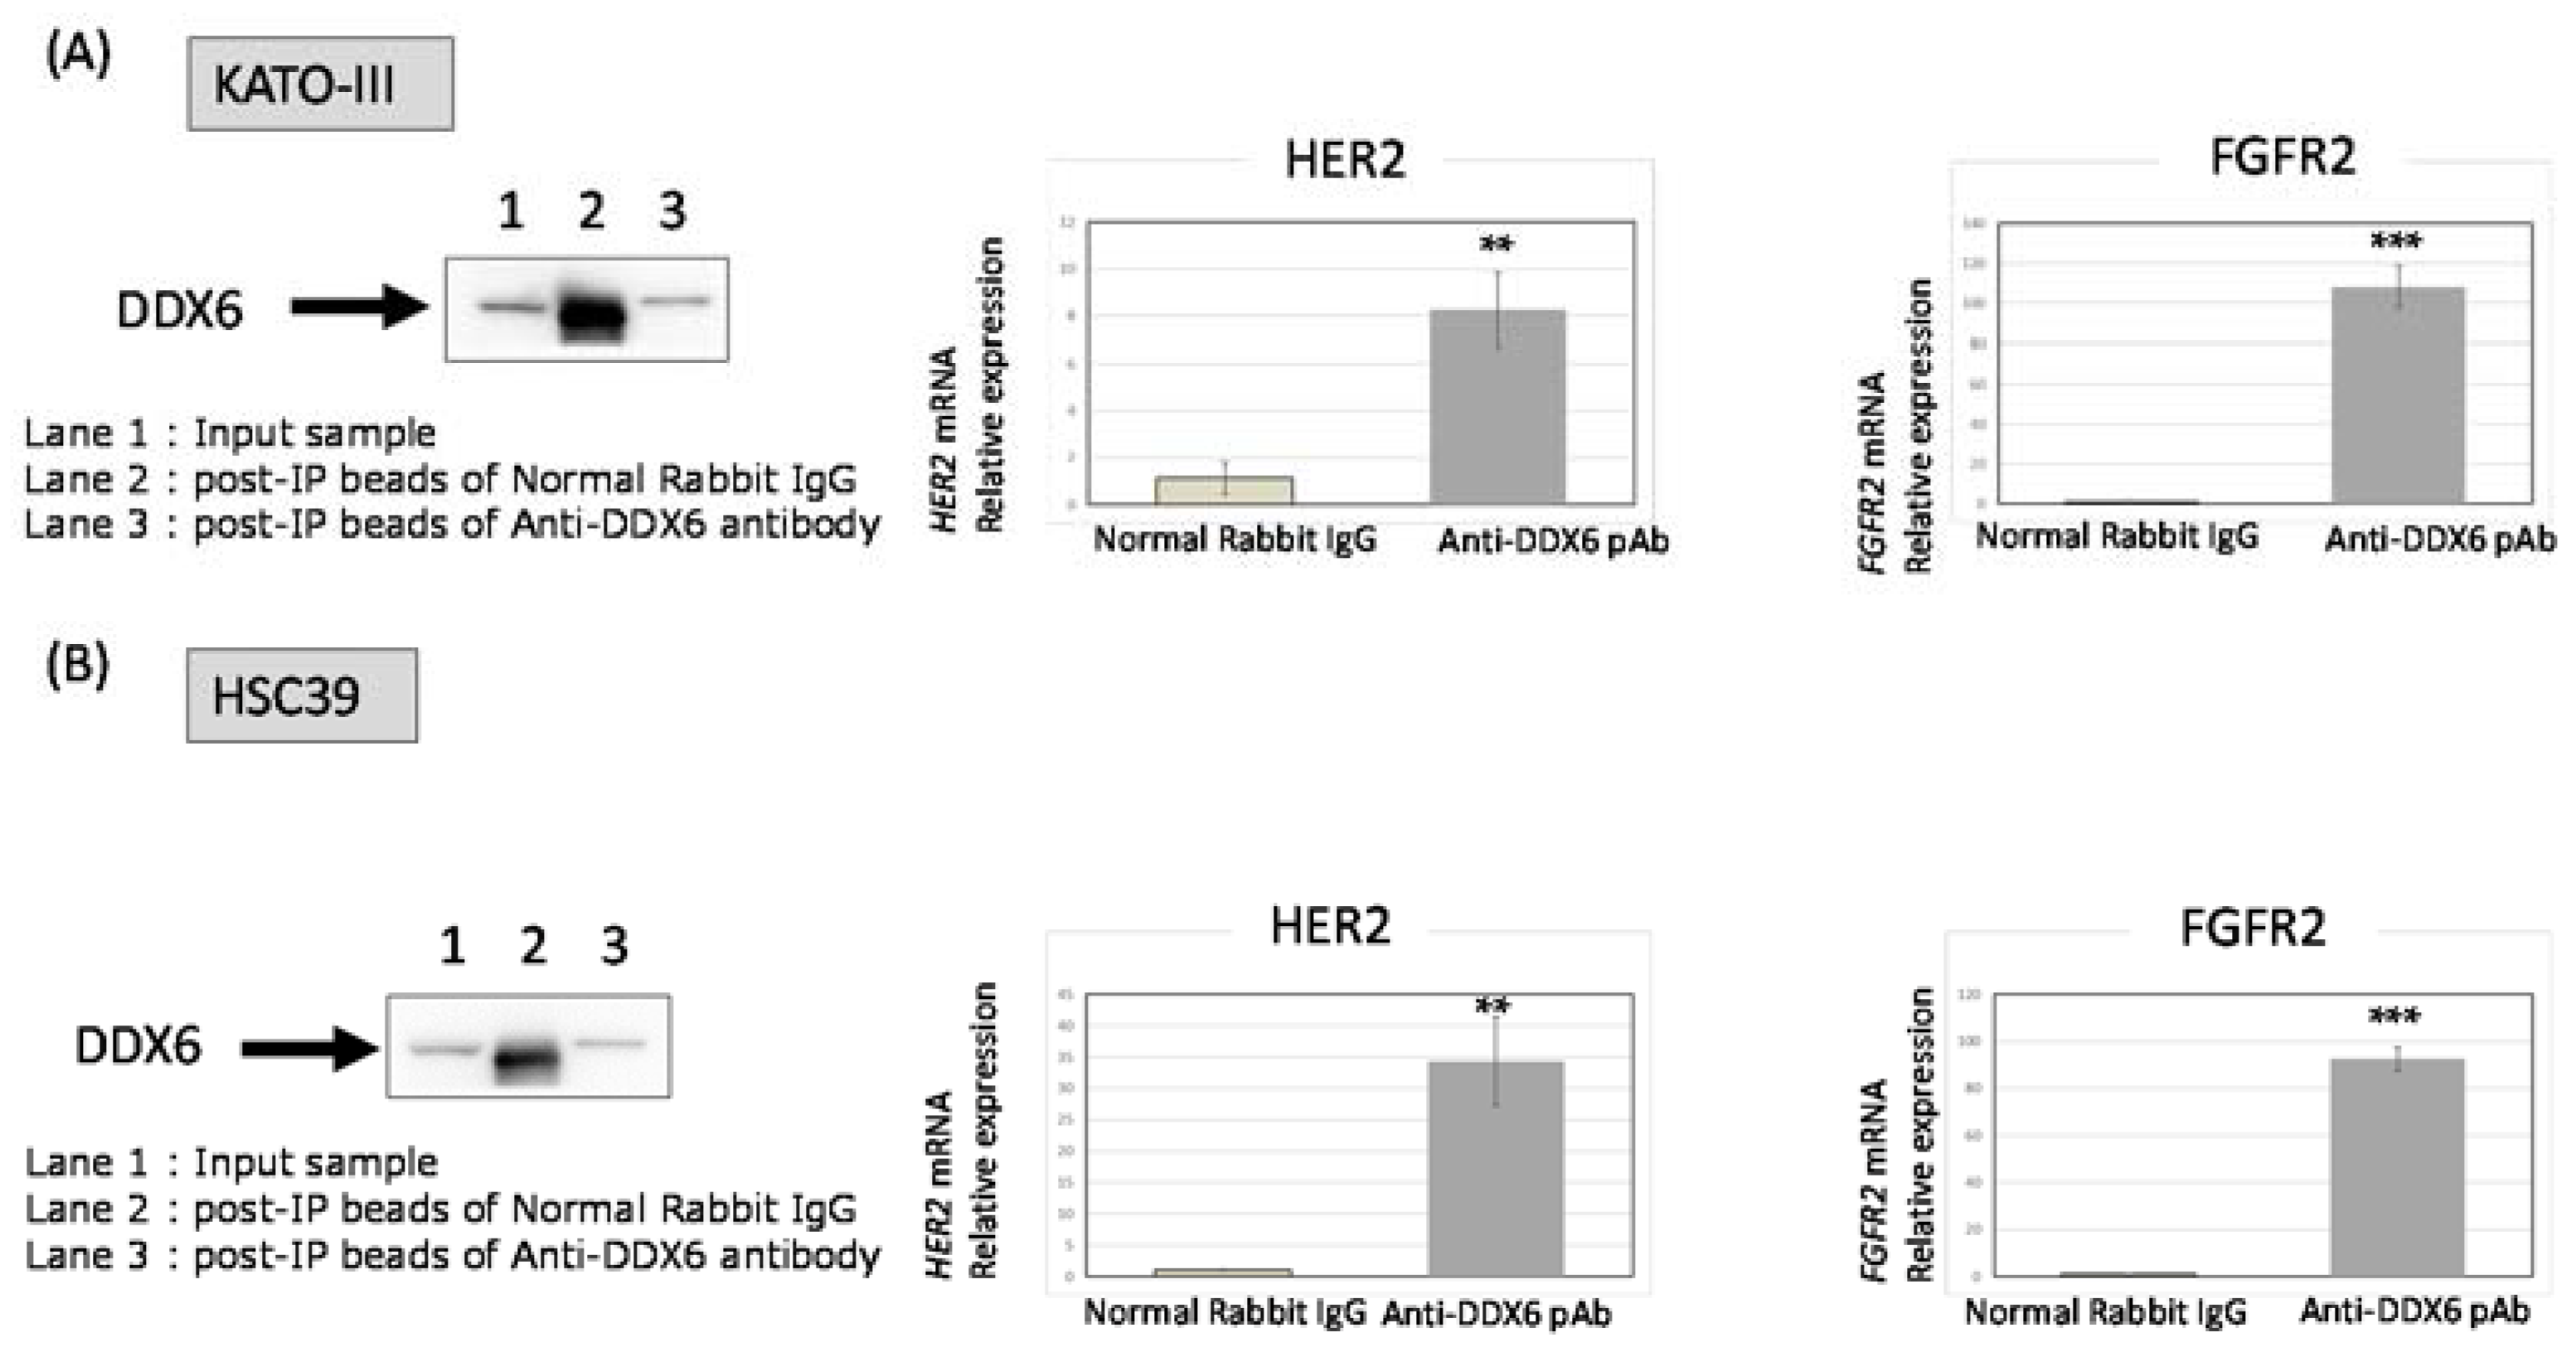
2.7. RNA Immunoprecipitation (RIP)-Assay Using GC Cells

In order to validate the role of DDX6 in the translational step of HER2 and FGFR2 expression, we performed a RIP-assay. Its results clearly indicated that the DDX6 protein acted as an RNA-binding protein for HER2 and FGFR2 mRNAs and it positively regulated the translational process (Figure 5).

3. Discussion

Previously, we reported that oncogenic RNA helicase DDX6 was highly overexpressed in most of the malignant cell lines and clinical colorectal tumors that we had tested [7,8]. We also showed that DDX6 expression is linked to the regulation of translation of c-myc mRNA through the internal ribosome entry site (IRES) [9]. In addition, the DDX6 protein is most likely to interact with the 5-cap-structure binding protein eIF4E [6,10], which is a rate-limiting factor serving as a translation regulator for initiating translation. In GC, more than 50% of the clinical GC samples we examined showed the increased expression of DDX6 compared with the normal samples from the same patients. Most of the DDX6-overexpressed samples also showed HER2 and/or FGFR2 overexpression, as estimated by Western blot analysis. Similar findings were also made for the cell lines tested. Based on such findings, we speculated that DDX6 might be involved in the overexpression of HER2 and FGFR2 proteins, which is due to the gene amplifications observed in GC. Thus, we determined that DDX6 was positively associated with translational initiation for HER2 and FGFR2 mRNAs, validated by the results of the RIP-assay and by the experiments using siRNAs for DDX6, HER2, and FGFR2 (Figure 4, Figure 5 and Figure 6). We also found the feedback system of the DDX6-HER2 and DDX6-FGFR2 translational process because the down-regulation of HER2 and FGFR2 protein expression by silencing DDX6 induced the up-regulation of their mRNA levels. It is clear that DDX6 contributed to the maintenance of overexpression of HER2 and FGFR2 even in the presence of genetic aberrations. However, when we introduced the DDX6 expression vector into MKN74, which barely expressed HER2 and FGFR2, their protein expression levels were not increased (data not shown). DDX6 might work to efficiently express the amplified HER2 and FGFR2. It is speculated that DDX6 is necessary to maintain the higher protein levels of these amplified HER2 and FGFR2. RIP-assay showed that the DDX6 protein directly or indirectly influences the post-transcriptional step of HER2 and FGFR2. High-throughput sequencing of RNA isolated by crosslinking immunoprecipitation (HITS-CLIP) or photoactivatable-ribonucleoside-enhanced crosslinking and immunoprecipitation (PAR-CLIP) may directly indicate the RBP binding motif.
HER2 belongs to the EGFR family and plays a key role in cell survival and proliferation [11,12]. Amplification of the HER2 gene causes the overexpression of the HER2 protein, which causes cancer cell survival, growth, and proliferation through the activation of the PI3K-AKT and MAPK-ERK pathways [13,14]. HER2 overexpression is observed to range from 9 to 38% of study samples, depending on the location of the cancers and their histology [13,15,16,17,18,19]. In our study, the frequency of overexpression of HER2 was almost 35%, being in the higher part of the range. The role of HER2 as a prognostic biomarker of GC is still controversial. Some studies have reported a positive correlation between HER2 overexpression and the clinical features of the tumor, such as tumor size, lymph node metastasis, local invasion, and cancer stage; whereas other studies insisted no relationship between them [20,21,22,23,24,25,26]. HER2 overexpression has become a very important biomarker because the ToGa clinical phase 3 trial indicated that HER2-positive patients can get survival benefits by treatment with trastuzumab [27].
The FGFR2 gene at human chromosome 10q26 encodes FGFR2b and FGFR2c isoforms that function as FGF receptors by separate expression domains and ligand specificity. Overexpression of FGFR2 was reported to be oncogenic and associated with chemoresistant in tumor cells. Single-nucleotide polymorphisms (SNPs) within intron 2 of the FGFR2 gene are associated with breast cancer through allelic FGFR2 upregulation [28]. A missense mutation or increased copy number of the FGFR2 gene is present in breast cancer and GC to activate FGFR2 signaling. It is reported that an FGFR2 copy number gain is detected in 9% of whole cancers. In GC, FGFR2 gene amplification ranges from 4 to 10% of samples; and FGFR2 protein is overexpressed in 30–40% of cases as judged by immunohistochemistry (IHC) [29,30]. When we estimated the expression of the FGFR2 protein by Western blotting, the rate of FGFR2 overexpression was almost 30%, similar to that observed in other studies. One important question is to ask what character of mRNA does DDX6 specifically affects in the translation initiation step. We considered that DDX6 might recognize the IRES structure of the 3’ UTR of mRNAs, serving as an RNA-binding protein (RBP) at the IRES structure by binding motifs of DDX6, possibly its N-terminal motif Ia and Ib, and C-terminal IV and V. It is reported that the IRES requires an oligopyrimidine and AUG unit structure (Figure 6A) [31]. We examined whether HER2 and FGFR2 have such an IRES structure by conducting a Centroidfold scan. Centroidfold is a web-available software that can predict and visualize RNA 2D structure (http://rtools.cbrc.jp/centroidfold/). As a result, we predicted that HER2 and FGFR2 might have the IRES structure (Figure 6A). Our results indicated that DDX6 RNA helicase promoted the translation of FGFR2 and HER2 mRNAs, which are frequently mutated or over-expressed in GC cells (Figure 6B), and functioned upstream of their expression pathways.

4. Materials and Methods

4.1. Clinical Samples

All clinical samples were obtained from patients who had undergone surgery for resection at the Department of Surgical Oncology, Gifu University Hospital (Gifu, Japan). Whether the tissue was tumorous or not was determined by the surgeon. All samples were immediately snap-frozen in liquid nitrogen and stored at −80 °C until RNA or protein extraction could be performed. All samples were histopathologically confirmed by H&E staining. The pathologic tumor staging was determined according to the Japanese Gastric Cancer Association (2011; see Table 1).
This study and collection and distribution of the samples were conducted in accordance with the principles of the 1975 Declaration of Helsinki after receiving approval from the Institutional Review Board of the Gifu University Graduate School of Medicine. (Approval number: 28–508 (23 March 2017)).

4.2. Cell Culture and Cell Viability

The TMK1, MKN1, MKN7, MKN45, MKN74, NUGC3, NUGC4, and KATO-III cells were obtained from the JCRB (Japanese Collection of Research Bioresources, Tokyo, Japan) Cell Bank. They were cultured in RPMI-1640 medium supplemented with 10% (v/v) heat-inactivated fetal bovine serum (FBS, Sigma-Aldrich Co., St. Louis, MO, USA) and 2 mm l-glutamine under an atmosphere of 95% air and 5% CO2 at 37 °C. The number of viable cells was determined by performing the trypan-blue dye-exclusion test. F2R, NUGC3 (5-FUresistance), and HSC39 were established cell lines [32,33,34].

4.3. Transfection Experiments

MKN7, MKN45, HSC39, and KATO-III cells were seeded into 6-well plates at a concentration of 0.5 × 10⁵ per well (10–30% confluence) on the day before the transfection. The sequence of siR-DDX6 was the following:
5′-GGAUAUUAUUCUCACGCUACCUAAA-3′. siR-HER2 and siR-FGFR2 were obtained from Invitrogen. They were used for the transfection of the cells, which was achieved by using cationic liposomes and Lipofectamine RNAiMAX (Invitrogen, Carlsbad, CA, USA), according to the manufacturer’s Lipofection protocol. The nonspecific control RNA (HSS, Hokkaido, Japan) sequence was: 5’-GUAGGAGUAGUGAAAGGCC-3’, which was used as a control for nonspecific effects [35].

4.4. Western Blot Analysis

Protein extraction and Western blot analysis were performed as described in previous reports [36,37]. The following primary antibodies were used: anti-FGFR2 and anti-HER2 (Cell Signaling Technology, Inc., Danvers, MA, USA), anti-DDX6 (RCK) (Santa Cruz Biotechnology (Dallas, TX, USA); sc-376433 K1414), and anti-β-actin (Sigma-Aldrich, St. Louis, MO, USA). HRP-conjugated goat anti-rabbit and horse anti-mouse IgG (Cell Signaling Technology, Danvers, MA, USA) were used as secondary antibodies. β-actin served as an internal control.
We used the web-available soft Image J in the case of calculating densitometric values.

4.5. Real-Time Reverse Transcription PCR

Total RNA was isolated from cultured cells by using a NucleoSpin (TaKaRa, Otsu, Japan 740955). For determination of the expression levels of DDX6, HER2, FGFR2, and GAPDH mRNAs, total RNA was reverse-transcribed with a PrimeScriptH RT reagent Kit (TaKaRa). RT-PCR was then performed with primers specific for them by using THUNDERBIRD SYBR qPCR Mix (TOYOBO, Osaka, Japan). The primers for DDX6, HER2, FGFR2, c-Myc, and GAPDH were the following:
DDX6-sense, 5′-GACACAGCAACAGATGAACC-3′ and DDX6-antisense, 5′-TGTCCTTCTT CAGGTCTAGC-3′ HER2-sense, 5′-CTGATGGGTTAATGAGCAAACTGA-3′ and HER2-antisense, 5′-CCAAATTCTGTGCTGGAGGTAGAG-3′ FGFR2-sense, 5′-AGTGCCCTCCCAGAGACCAA-3′ and FGFR2-antisense, 5′-CCCAGTTTCTCAATGAAGCCATAAA-3′ GAPDH-sense, 5′-CCACCCATGG CAAATTCCATGGCA-3′ and GAPDH-antisense, 5′-TCTAGACGGCAGGTCAGGTCCACC-3′.

4.6. RIP-Assay

The RIP-assay was performed by using a RIP-Assay kit (MBL, MEDICAL and BIOLOGICAL LABORATORIES CO., Nagoya, Japan). Cell lysates were derived from treated cells and reacted with beads labeled with the anti-DDX6 antibody. The target protein bound to the beads was then isolated, and the mRNAs binding the target protein were measured by qRT-PCR following the manufacturer’s procedures.

4.7. Statistics

Each examination was performed in triplicate. Statistical significances of differences were evaluated by performing the two-sided Student’s t-test. The values were presented as the mean ± standard deviation. A p-value < 0.05 was considered to be statistically significant.

5. Conclusions

Our results afforded the conclusion that DDX6 acted as an upstream molecule that positively regulated the expression of HER2 and FGFR2 at the post-transcriptional step in GC cells. Therefore, a DDX6 inhibitor such as a low-molecular agent and a siRNA targeting DDX6 would be promising drugs for HER2 and FGFR2-positive GCs.

Author Contributions

Writing—Original draft: T.T., Data curation: K.T., Investigation: Y.T., Methodology: N.S., K.Y., Supervision: N.M., M.F., Writing—review & editing: Y.A., Project administration: K.Y.

Funding

This research received no external funding.

Acknowledgments

The authors acknowledge Ryuichirou Mori, Ayako Iwatsuki, Yuki Kuranaga, Haruka Shinohara, Kaoru Shizu, and Kaori Enya for their assistance with the preparation of the manuscript. Additionally, the authors express their strong appreciation to the Reviewers for their comments on this manuscript. We are convinced the comments have helped us significantly improve this manuscript.

Conflicts of Interest

The authors have no conflict of interest to declare.

References

  1. Torre, L.A.; Bray, F.; Siegel, R.L.; Ferlay, J.; Lortet-Tieulent, J.; Jemal, A. Global cancer statistics, 2012. CA Cancer J. Clin. 2015, 65, 87–108. [Google Scholar] [CrossRef] [PubMed]
  2. Karim-Kos, H.E.; de Vries, E.; Soerjomataram, I.; Lemmens, V.; Siesling, S.; Coebergh, J.W. Recent trends of cancer in Europe: A combined approach of incidence, survival and mortality for 17 cancer sites since the 1990s. Eur. J. Cancer 2008, 44, 1345–1389. [Google Scholar] [CrossRef] [PubMed]
  3. Kang, Y.K.; Boku, N.; Satoh, T.; Ryu, M.H.; Chao, Y.; Kato, K.; Chung, H.C.; Chen, J.S.; Muro, K.; Kang, W.K.; et al. Nivolumab in patients with advanced gastric or gastro-oesophageal junction cancer refractory to, or intolerant of, at least two previous chemotherapy regimens (ONO-4538-12, ATTRACTION-2): A randomised, double-blind, placebo-controlled, phase 3 trial. Lancet 2017, 390, 2461–2471. [Google Scholar] [CrossRef]
  4. Japanese Gastric Cancer Association. Japanese gastric cancer treatment guidelines 2014 (ver. 4). Gastric Cancer 2017, 20, 1–19. [Google Scholar]
  5. Lee, J.; Ou, S.H. Towards the goal of personalized medicine in gastric cancer—Time to move beyond HER2 inhibition. Part I: Targeting receptor tyrosine kinase gene amplification. Discov. Med. 2013, 15, 333–341. [Google Scholar] [PubMed]
  6. Wang, Y.; Arribas-Layton, M.; Chen, Y.; Lykke-Andersen, J.; Sen, G.L. DDX6 Orchestrates Mammalian Progenitor Function through the mRNA Degradation and Translation Pathways. Mol. Cell 2015, 60, 118–130. [Google Scholar] [CrossRef] [PubMed]
  7. Nakagawa, Y.; Morikawa, H.; Hirata, I.; Shiozaki, M.; Matsumoto, A.; Maemura, K.; Nishikawa, T.; Niki, M.; Tanigawa, N.; Ikegami, M.; et al. Overexpression of rck/p54, a DEAD box protein, in human colorectal tumours. Br. J. Cancer 1999, 80, 914–917. [Google Scholar] [CrossRef] [PubMed] [Green Version]
  8. Hashimoto, K.; Nakagawa, Y.; Morikawa, H.; Niki, M.; Egashira, Y.; Hirata, I.; Katsu, K.; Akao, Y. Co-overexpression of DEAD box protein rck/p54 and c-myc protein in human colorectal adenomas and the relevance of their expression in cultured cell lines. Carcinogenesis 2001, 22, 1965–1970. [Google Scholar] [CrossRef] [PubMed] [Green Version]
  9. Taniguchi, K.; Iwatsuki, A.; Sugito, N.; Shinohara, H.; Kuranaga, Y.; Oshikawa, Y.; Tajirika, T.; Futamura, M.; Yoshida, K.; Uchiyama, K.; et al. Oncogene RNA helicase DDX6 promotes the process of c-Myc expression in gastric cancer cells. Mol. Carcinog. 2018, 57, 579–589. [Google Scholar] [CrossRef] [PubMed]
  10. Akao, Y.; Matsumoto, K.; Ohguchi, K.; Nakagawa, Y.; Yoshida, H. Human DEAD-box/RNA unwindase rck/p54 contributes to maintenance of cell growth by affecting cell cycle in cultured cells. Int. J. Oncol. 2006, 29, 41–48. [Google Scholar] [CrossRef] [PubMed]
  11. Duraes, C.; Almeida, G.M.; Seruca, R.; Oliveira, C.; Carneiro, F. Biomarkers for gastric cancer: Prognostic, predictive or targets of therapy? Virchows Arch. 2014, 464, 367–378. [Google Scholar] [CrossRef] [PubMed]
  12. Normanno, N.; Bianco, C.; Strizzi, L.; Mancino, M.; Maiello, M.R.; De Luca, A.; Caponigro, F.; Salomon, D.S. The ErbB receptors and their ligands in cancer: an overview. Curr. Drug Targets 2005, 6, 243–257. [Google Scholar] [CrossRef] [PubMed]
  13. Gravalos, C.; Jimeno, A. HER2 in gastric cancer: A new prognostic factor and a novel therapeutic target. Ann. Oncol. 2008, 19, 1523–1529. [Google Scholar] [CrossRef] [PubMed]
  14. Gallardo, A.; Lerma, E.; Escuin, D.; Tibau, A.; Munoz, J.; Ojeda, B.; Barnadas, A.; Adrover, E.; Sanchez-Tejada, L.; Giner, D.; et al. Increased signalling of EGFR and IGF1R, and deregulation of PTEN/PI3K/Akt pathway are related with trastuzumab resistance in HER2 breast carcinomas. Br. J. Cancer 2012, 106, 1367–1373. [Google Scholar] [CrossRef] [PubMed]
  15. Dragovich, T.; McCoy, S.; Fenoglio-Preiser, C.M.; Wang, J.; Benedetti, J.K.; Baker, A.F.; Hackett, C.B.; Urba, S.G.; Zaner, K.S.; Blanke, C.D.; et al. Phase II trial of erlotinib in gastroesophageal junction and gastric adenocarcinomas: SWOG 0127. J. Clin. Oncol. 2006, 24, 4922–4927. [Google Scholar] [CrossRef] [PubMed]
  16. Okines, A.F.; Cunningham, D. Trastuzumab in gastric cancer. Eur. J. Cancer 2010, 46, 1949–1959. [Google Scholar] [CrossRef] [PubMed]
  17. Phillips, B.E.; Tubbs, R.R.; Rice, T.W.; Rybicki, L.A.; Plesec, T.; Rodriguez, C.P.; Videtic, G.M.; Saxton, J.P.; Ives, D.I.; Adelstein, D.J. Clinicopathologic features and treatment outcomes of patients with human epidermal growth factor receptor 2-positive adenocarcinoma of the esophagus and gastroesophageal junction. Dis. Esophagus 2013, 26, 299–304. [Google Scholar] [CrossRef] [PubMed]
  18. Chan, D.S.; Campbell, F.; Edwards, P.; Jasani, B.; Williams, G.T.; Lewis, W.G. Relative Prognostic Value of Human Epidermal Growth Factor Receptor 2 (HER2) Expression in Operable Oesophagogastric Cancer. ISRN Surg. 2012, 2012, 804891. [Google Scholar] [CrossRef] [PubMed]
  19. Okines, A.F.; Thompson, L.C.; Cunningham, D.; Wotherspoon, A.; Reis-Filho, J.S.; Langley, R.E.; Waddell, T.S.; Noor, D.; Eltahir, Z.; Wong, R.; et al. Effect of HER2 on prognosis and benefit from peri-operative chemotherapy in early oesophago-gastric adenocarcinoma in the MAGIC trial. Ann. Oncol. 2013, 24, 1253–1261. [Google Scholar] [CrossRef] [PubMed]
  20. Kim, M.A.; Jung, E.J.; Lee, H.S.; Lee, H.E.; Jeon, Y.K.; Yang, H.K.; Kim, W.H. Evaluation of HER-2 gene status in gastric carcinoma using immunohistochemistry, fluorescence in situ hybridization, and real-time quantitative polymerase chain reaction. Hum. Pathol. 2007, 38, 1386–1393. [Google Scholar] [CrossRef] [PubMed]
  21. Bilous, M.; Osamura, R.Y.; Ruschoff, J.; van de Vijver, M.; Hanna, W.; Penault-Llorca, F.; Roche, P. HER-2 amplification is highly homogenous in gastric cancer. Hum. Pathol. 2010, 41, 304–305. [Google Scholar] [CrossRef] [PubMed]
  22. Yan, S.Y.; Hu, Y.; Fan, J.G.; Tao, G.Q.; Lu, Y.M.; Cai, X.; Yu, B.H.; Du, Y.Q. Clinicopathologic significance of HER-2/neu protein expression and gene amplification in gastric carcinoma. World J. Gastroenterol. 2011, 17, 1501–1506. [Google Scholar] [CrossRef] [PubMed]
  23. Moelans, C.B.; Milne, A.N.; Morsink, F.H.; Offerhaus, G.J.; van Diest, P.J. Low frequency of HER2 amplification and overexpression in early onset gastric cancer. Cell. Oncol. 2011, 34, 89–95. [Google Scholar] [CrossRef] [PubMed] [Green Version]
  24. Zhou, F.; Li, N.; Jiang, W.; Hua, Z.; Xia, L.; Wei, Q.; Wang, L. Prognosis significance of HER-2/neu overexpression/amplification in Chinese patients with curatively resected gastric cancer after the ToGA clinical trial. World J. Surg. Oncol. 2012, 10, 274. [Google Scholar] [CrossRef] [PubMed] [Green Version]
  25. Tanner, M.; Hollmen, M.; Junttila, T.T.; Kapanen, A.I.; Tommola, S.; Soini, Y.; Helin, H.; Salo, J.; Joensuu, H.; Sihvo, E.; et al. Amplification of HER-2 in gastric carcinoma: Association with Topoisomerase IIalpha gene amplification, intestinal type, poor prognosis and sensitivity to trastuzumab. Ann. Oncol. 2005, 16, 273–278. [Google Scholar] [CrossRef] [PubMed]
  26. Park, D.I.; Yun, J.W.; Park, J.H.; Oh, S.J.; Kim, H.J.; Cho, Y.K.; Sohn, C.I.; Jeon, W.K.; Kim, B.I.; Yoo, C.H.; et al. HER-2/neu amplification is an independent prognostic factor in gastric cancer. Dig. Dis. Sci. 2006, 51, 1371–1379. [Google Scholar] [CrossRef] [PubMed]
  27. Bang, Y.J.; Van Cutsem, E.; Feyereislova, A.; Chung, H.C.; Shen, L.; Sawaki, A.; Lordick, F.; Ohtsu, A.; Omuro, Y.; Satoh, T. Trastuzumab in combination with chemotherapy versus chemotherapy alone for treatment of HER2-positive advanced gastric or gastro-oesophageal junction cancer (ToGA): A phase 3, open-label, randomised controlled trial. Lancet 2010, 376, 687–697. [Google Scholar] [CrossRef]
  28. Katoh, Y.; Katoh, M. FGFR2-related pathogenesis and FGFR2-targeted therapeutics (Review). Int. J. Mol. Med. 2009, 23, 307–311. [Google Scholar] [CrossRef] [PubMed] [Green Version]
  29. Hattori, Y.; Itoh, H.; Uchino, S.; Hosokawa, K.; Ochiai, A.; Ino, Y.; Ishii, H.; Sakamoto, H.; Yamaguchi, N.; Yanagihara, K.; et al. Immunohistochemical detection of K-sam protein in stomach cancer. Clin. Cancer Res. 1996, 2, 1373–1381. [Google Scholar] [PubMed]
  30. Toyokawa, T.; Yashiro, M.; Hirakawa, K. Co-expression of keratinocyte growth factor and K-sam is an independent prognostic factor in gastric carcinoma. Oncol. Rep. 2009, 21, 875–880. [Google Scholar] [PubMed]
  31. Matsui, T.; Hogetsu, K.; Usukura, J.; Sato, T.; Kumasaka, T.; Akao, Y.; Tanaka, N. Structural insight of human DEAD-box protein rck/p54 into its substrate recognition with conformational changes. Genes Cells Devoted Mol. Cell. Mech. 2006, 11, 439–452. [Google Scholar] [CrossRef] [PubMed] [Green Version]
  32. Yanagihara, K.; Seyama, T.; Tsumuraya, M.; Kamada, N.; Yokoro, K. Establishment and characterization of human signet ring cell gastric carcinoma cell lines with amplification of the c-myc oncogene. Cancer Res. 1991, 51, 381–386. [Google Scholar] [PubMed]
  33. Tsutani, Y.; Yoshida, K.; Sanada, Y.; Wada, Y.; Konishi, K.; Fukushima, M.; Okada, M. Decreased orotate phosphoribosyltransferase activity produces 5-fluorouracil resistance in a human gastric cancer cell line. Oncol. Rep. 2008, 20, 1545–1551. [Google Scholar] [PubMed]
  34. Mori, R.; Yoshida, K.; Tanahashi, T.; Yawata, K.; Kato, J.; Okumura, N.; Tsutani, Y.; Okada, M.; Oue, N.; Yasui, W. Decreased FANCJ caused by 5FU contributes to the increased sensitivity to oxaliplatin in gastric cancer cells. Gastric Cancer 2013, 16, 345–354. [Google Scholar] [CrossRef] [PubMed]
  35. Akao, Y.; Nakagawa, Y.; Hirata, I.; Iio, A.; Itoh, T.; Kojima, K.; Nakashima, R.; Kitade, Y.; Naoe, T. Role of anti-oncomirs miR-143 and -145 in human colorectal tumors. Cancer Gene Ther. 2010, 17, 398–408. [Google Scholar] [CrossRef] [PubMed] [Green Version]
  36. Noguchi, S.; Iwasaki, J.; Kumazaki, M.; Mori, T.; Maruo, K.; Sakai, H.; Yamada, N.; Shimada, K.; Naoe, T.; Kitade, Y.; et al. Chemically modified synthetic microRNA-205 inhibits the growth of melanoma cells in vitro and in vivo. Mol. Ther. J. Am. Soc. Gene Ther. 2013, 21, 1204–1211. [Google Scholar] [CrossRef] [PubMed]
  37. Yamada, N.; Tsujimura, N.; Kumazaki, M.; Shinohara, H.; Taniguchi, K.; Nakagawa, Y.; Naoe, T.; Akao, Y. Colorectal cancer cell-derived microvesicles containing microRNA-1246 promote angiogenesis by activating Smad 1/5/8 signaling elicited by PML down-regulation in endothelial cells. Biochim. Biophys. Acta 2014, 1839, 1256–1272. [Google Scholar] [CrossRef] [PubMed]
Figure 1. The expression levels of DDX6, HER2, and FGFR2 in gastric cancer (GC) cell lines and GC clinical samples. (A) Western blots of the 20 clinical samples. The overexpression of DDX6, HER2, and FGFR2 in tumor samples is highlighted by red-boxes. N: normal, T: tumor in the same patient. Details of the characteristics of the patients are given in Table 1. Densitometric values of DDX6, HER2, and FGFR2 with respect to β-actin of each sample were calculated and the values are shown with each normal sample taken as 1.0. Densitometric values more than 1.5 are regarded as overexpressed. The cases that overexpressed DDX6, HER2, and FGFR2 are highlighted by red boxes; (B) Western blotting (W.B.) of the steady-state levels of DDX6, HER2, and FGFR2 in GC cell lines. Cell lines including TMK1, MKN1, MKN7, MKN74, MKN45, F2R (MKN45-5FU resistant [5FUR]), NUGC3, NUGC3-5FUR, NUGC4, HSC39, and KATO-III. In the expression levels of HER2 and DDX6, densitometric values of DDX6 with respect to β-actin of each sample were calculated and the values are shown with MKN45 taken as 1.0. In the case of FGFR2, the values are shown with HSC39 taken as 1.0.
Ijms 19 02005 g001
Figure 2. The knockdown of DDX6 in MKN7, MKN45, HSC39, and KATO-III cells by siRNA treatment. (A) Cell viability at 72 h after transfection of KATO-III, HSC39, MKN7, and MKN45 with siR-DDX6. C: control RNA, 5 nM. Controls are indicated as “100”; (B) Western blots of FGFR2, HER2, and DDX6 expression in KATO-III, HSC39, MKN7, and MKN45 cells at 72 h after transfection with control or siR-DDX6. The levels of controls are indicated as “1”. N.D.: not detected. Results are presented as the mean ± SD. * p < 0.05; ** p < 0.01; *** p < 0.001.
Ijms 19 02005 g002
Figure 3. The DDX6 expression after the knockdown of FGFR2 or HER2. (A) Cell viability at 72 h after transfection of KATO-III and HSC39 cells with siR-FGFR2. (control RNA, 10 nM); (B) Western blots of FGFR2 and DX6 expression in KATO-III and HSC39 cells at 72 h after transfection with control or siR-FGFR2; (C) Cell viability at 72 h after transfection of MKN7 and MKN45 with siR-HER2. (control RNA, 20 nM); (D) Western blots of HER2 and DDX6 expression in MKN7 and MKN45 cells at 72 h after transfection with control or siR-HER2. The levels of controls are indicated as “1.” Results are presented as the mean ±SD. ** p < 0.01; *** p < 0.001. N.S., not significant.
Ijms 19 02005 g003
Figure 4. The HER2 and FGFR2 mRNA levels in MKN7, MKN45, HSC39, and KATO-III cells after knockdown of DDX6 in the cells. (A,B) The expression levels of DDX6 (a), HER2 (b), and FGFR2 (c) mRNAs at 72 h after transfection of KATO-III (A) and HSC39 (B) cells with siR-DDX6; (C): control RNA, 5 nM; (C,D) Expression levels of DDX6 (a) and HER2 (b) mRNAs at 72 h after transfection of MKN7 (C) and MKN45 (D) cells with siR-DDX6. (C: control RNA, 5 nM) The levels of controls are indicated as “1.” Results are presented as the mean ± SD. * p < 0.05; ** p < 0.01; *** p < 0.001.
Ijms 19 02005 g004
Figure 5. The RIP-assay for KATO-III and HSC39 cells by use of the DDX6 antibody. Immunoprecipitants formed by the anti-DDX6 antibody in the case of KATO-III (A) and HSC39 (B) cells were evaluated by W.B. for DDX6. Lane 1: Input sample; Lane 2: post-IP beads with normal rabbit IgG; Lane 3: post-IP beads with the anti-DDX6 antibody. Anti-rabbit IgG was used as a negative control. The expression levels of HER2 (left) and FGFR2 (right) mRNA in DDX6-RNA complexes were evaluated by RT-PCR in KATO-III (A) and HSC39 (B) cells. The levels of controls are indicated as “1”. The results are presented as the mean ± SD. ** p < 0.01; *** p < 0.001.
Ijms 19 02005 g005
Figure 6. Predicted IRES structure of the HER2 and FGFR2 mRNAs. (A) IRES structure in the 5′ UTR of HER2 and FGFR2 mRNAs as predicted by Centroidfold (http://rtools.cbrc.jp/centroidfold/); (B) The scheme of DDX6 regulation of HER2 and FGFR2 in the translational step.
Ijms 19 02005 g006
Table 1. Patient characteristics.
CaseAgeSexSiteFormPathological FindingsUICC/TNMTNMStage
171MLType3tub2T3N0M0IIA
291FLType2tub2T4bN2M0IIIC
372MLType3tub1T4aN3aM0IIIC
461MLType2tub2T4aN3aM0IIIC
583MLType2por1T3N0M0IIA
677MUMType3muc > tub2T3N1M0IIB
766FLMType1tub2T2N2M0IIB
884MMLDType3tub2T4aN3aM0IIIC
985FMType2por2 > tub1T3N0M0IIA
1072MMLType1tub1 > papT1bN0M0IA
1164MUType1tub2T3N0M0IIA
1278MLMType2por1T4bN3aM0IIIC
1364FGEType2pap > mucT3N0M0IIA
1473MMType1tub1 (>tub2)T1aN0M0IA
1585FMType3por1 > tub1T2N2M0IIB
1673MLMUType4por2 > mucT4aN3aM0IIIC
1780MUEType2tub2T3N0M0IIA
1893MMLType3tub2T4aN0M0IIB
1965FLType2tub2 > tub1T2N0M0IB
2074FUType3por2 > sig > mucT4aN3aM0IIIC
SEX; M, male; F, female. Site; Location of tumor; U, upper; M, middle; L, lower; R, residual gastric cancer. Form; Macroscopic classification: Type 1, mass type; Type 2, localized ulcerative type; Type 3, infiltrative ulcerative type; Type 4, diffuse infiltrating type; Type 5, unclassifiable. Pathological findings: pap, papillary adenocarcinoma; tub 1, well-differentiated tubular adenocarcinoma; tub 2, moderately differentiated; por 1, poorly differentiated adenocarcinoma (solid type); por 2, (non-solid type); ⃞ sig, signet-ring cell carcinoma; muc, mucinous adenocarcinoma. T; Depth of tumor invasion: T1a, mucosa; T1b, submucosa; T2, mucosa propria; T3, Subserosa; T4a, Serosa exposure; T4b, Serosa invasion. N;Lymph node metastases: N0, no metastases; N1, 1–2 metastases; N2, 3–6 metastases; N3, more than 7 metastases M; Distant metastases: M0, no metastases; M1, metastases. Stage; UICC/TNM 7th edition

