1. Introduction
Chaperonins are essential molecular chaperones with a characteristic double-ring structure composed of subunits with a molecular weight of approximately 60 kDa [
1,
2]. Chaperonin captures an unfolded protein and folds it in an ATP-dependent manner. Chaperonins are divided into two groups (I and II) based on their structure and amino acid sequences [
3,
4]. Group I chaperonins, which are known as Hsp60 or GroEL, exist in bacteria, mitochondria, and chloroplasts. They function with a co-chaperonin, Hsp10 or GroES, which constitutes the lid of the folding cage. The chaperonins of archaea or the eukaryotic cytosol belong to the group II chaperonins which have the built-in lids formed by helical protrusions in the apical domain [
5,
6,
7].
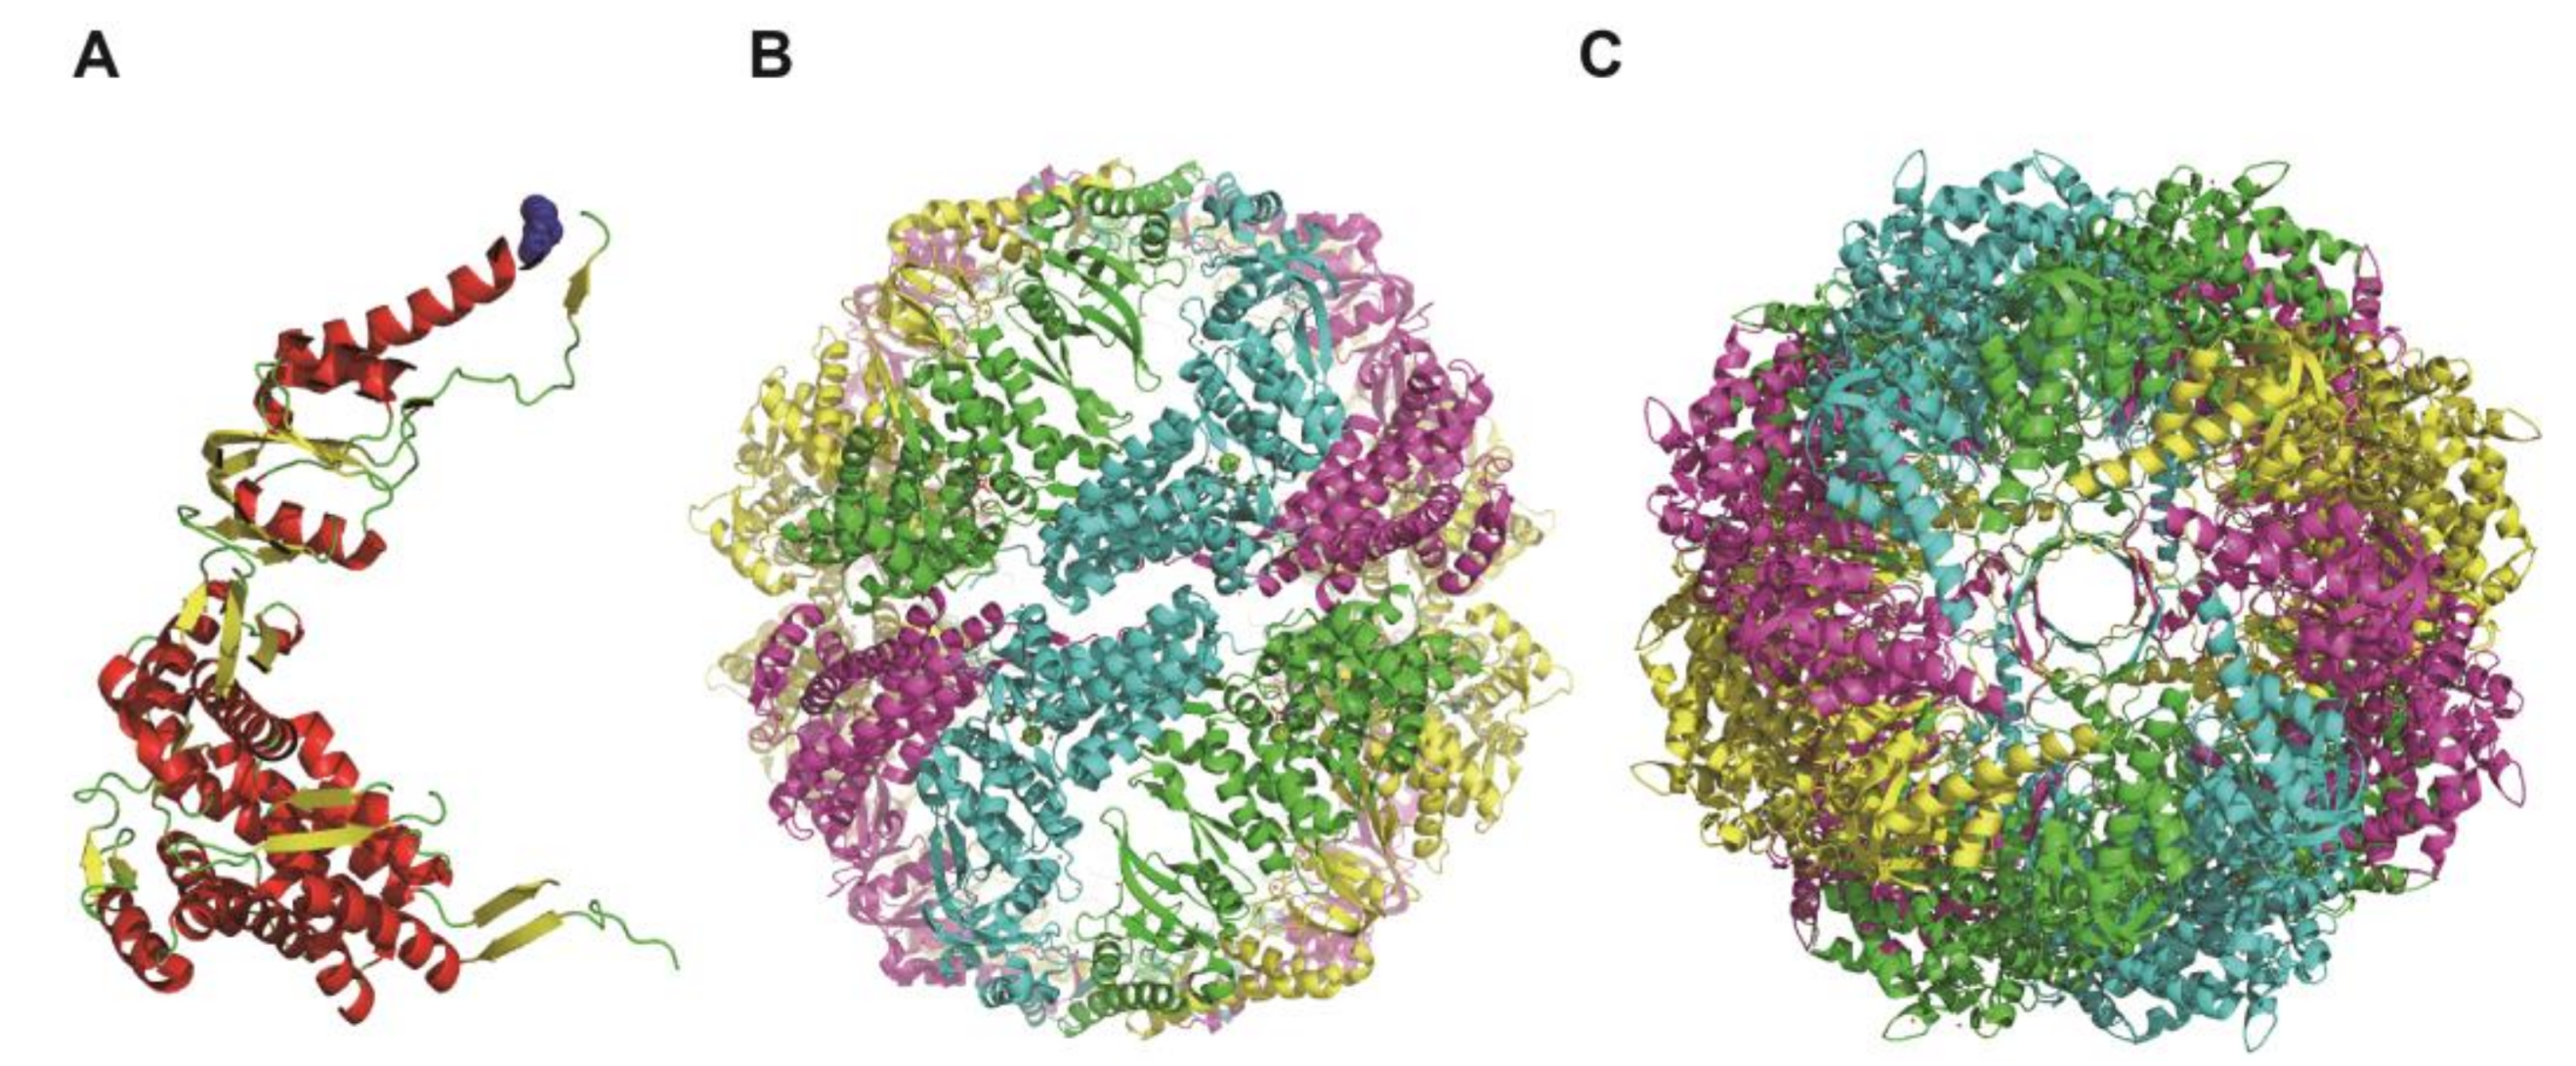
Group II chaperonins capture an unfolded protein in the central cavity of a ring in the open state, and folding is mediated by the ATP-dependent closure of the lid [
8,
9]. Structural studies suggested that the ring structure of the chaperonin twists to seal off the central cavity [
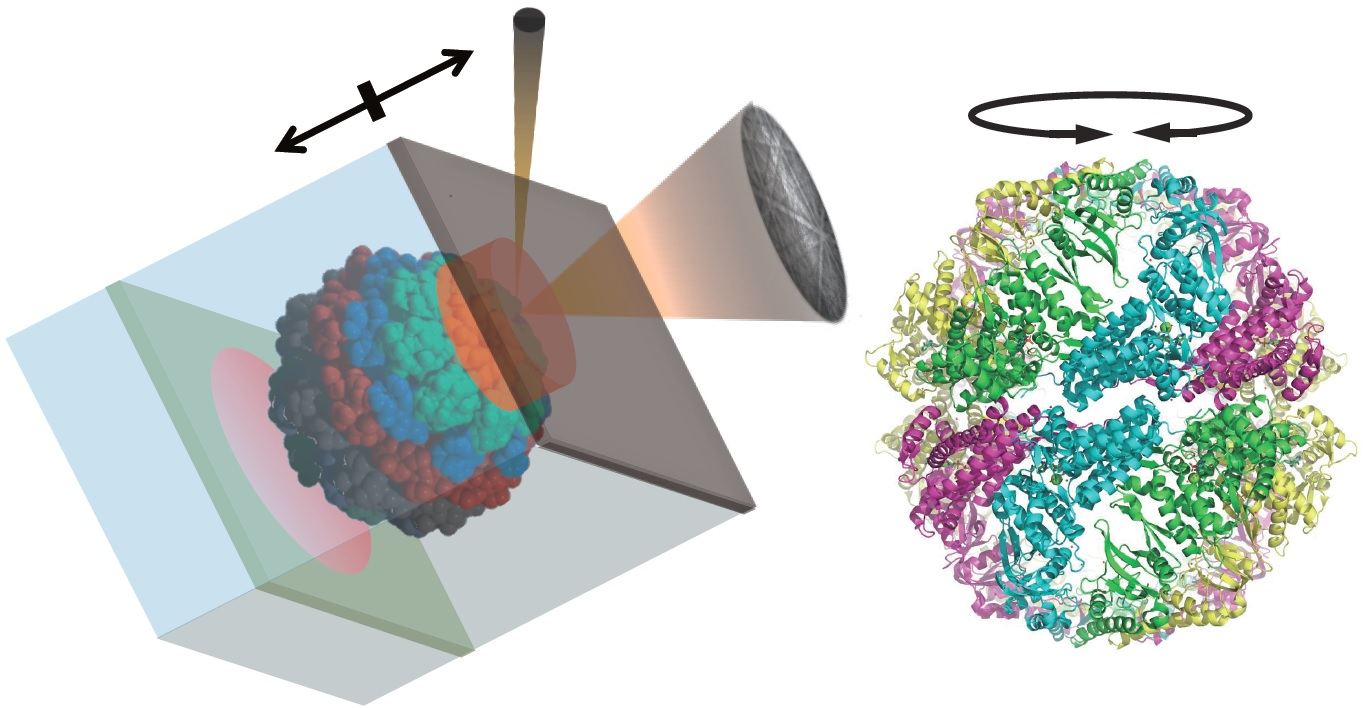
10]. We analyzed the ATP-dependent dynamics of the archaeal group II chaperonin at the single-molecule level by diffracted X-ray tracking (DXT) and revealed ATP dependent rotational motion [
11]. DXT allows direct picometer-scale observation of individual biomolecules in both real time and real space [
12,
13]. The results have clearly shown that DXT is a powerful tool for analyzing protein motions. However, there are some disadvantages. The method requires a strong X-ray source, such as that at synchrotron radiation facilities. Therefore, for the tracking method to be more available to ordinary biochemical researchers, we have developed diffracted electron tracking (DET) [
14,
15]. In DET, the orientation of a nanocrystal linked to a single protein molecule is analyzed by monitoring an electron back scattering diffraction pattern (EBSP) using a wet-scanning electron microscope (SEM). Electron beams have scattering cross-sections that are 1000 times larger than those of X-rays. The use of X-rays in DXT necessitates the use of a perfect crystal. On the contrary, DET can use commercially available gold nanoparticles because the electron probe is only sensitive to their surface structure. The EBSP presents a line pattern, which is in contrast to the spot pattern of the diffraction phenomena of X-rays. This trait enables DET to observe the high-speed anisotropic motion of an individual gold nanoparticle in three-dimension at the picometer scale.
To examine the motion in aqueous solution, an environmental cell (EC) was used in wet-SEM. The ECs were covered with a 150 µm diameter single-hole grid for windows to allow the passage of electrons. These windows were sealed with a carbon film (20 nm in thickness). The carbon film acted as a barrier against atmospheric air pressure from the high-vacuum conditions of the SEM column. In our previous study, the gold nanoparticles were attached to the carbon film. We were able to collect time-resolved, 3D, super-accurate (picometer scale) motion tracking data on single nanoparticles under vacuum and in solution [
14].
In this study, we examined the ATP-dependent motion of group II chaperonin by DET. In our previous studies, we used the group II chaperonin from a hyperthermophilic archaeon,
Thermococcus sp. strain KS1 (TKS1-Cpn) because TKS1-Cpn exhibits high protein folding ability and ATP-dependent mobility [
16,
17]. The disadvantage of TKS1-Cpn is that it can function only at high temperatures (greater than 50 °C). We can perform DXT experiments at an elevated temperature because the cell for DXT is completely sealed. On the contrary, we must perform the DET experiment at room temperature because of the lack of a heating system in our system and the relative fragility of the thin carbon film of the EC. Therefore, we selected the group II chaperonin of the mesophilic archaeon
Methanococcus maripaludis (MmCpn), which functions and exhibits conformational change at room temperatures (
Figure 1) [
18,
19].
MmCpn is also the most-studied group II chaperonin. Its ATP-dependent conformational change has been studied in detail [
10,
20,
21]. In this study, we compared the results of DXT and DET using MmCpn as a model protein. The results clearly showed the advantage of DET.
2. Results
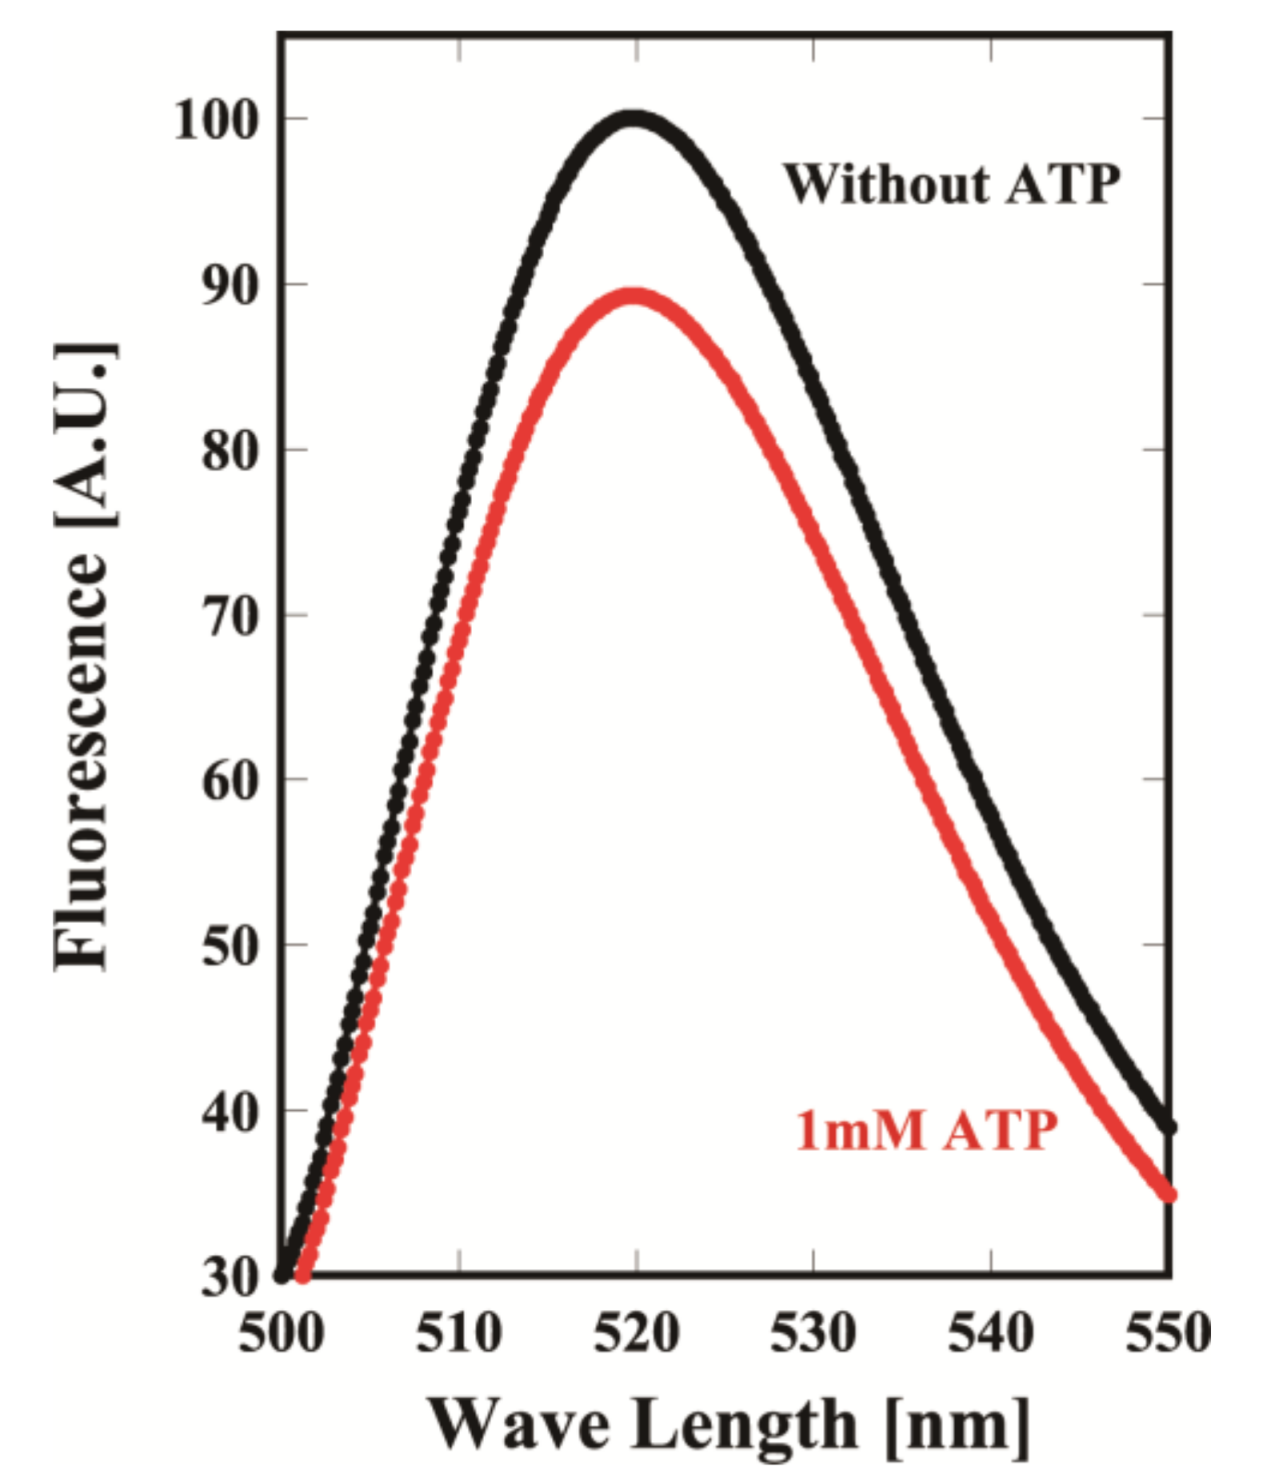
To perform DXT and DET experiments, a Cys residue was added to the tip of the helical protrusion for binding with a gold nanoparticle and immobilization. In addition, to avoid nonspecific binding with gold nanoparticles, other Cys residues were removed. For that purpose, Pro255 or Lys256 of the Cys-less mutant of MmCpn was changed to Cys (MmCpnK256C, MmCpnP255C). The final versions contain the amino acid replacements C140M, C237E, P255C, C286V, C359V, C393S, C470Y and C484T in addition to K256C or P255C. The mutants were expressed and purified using nearly the same procedure as for the wild type [
21]. They were purified to homogeneity in SDS-PAGE. To examine whether the mutants could change the conformation in an ATP-dependent manner, MmCpnK256C was labeled with fluorescein at Cys256 and used in a fluorescence intensity assay with or without ATP. The fluorescence of fluorescein decreased when ATP was added (
Figure 2). The results clearly showed that MmCpnK256C changed from the opened to closed conformation in an ATP-dependent manner. Thus, we used the mutants for DXT and DET analyses.
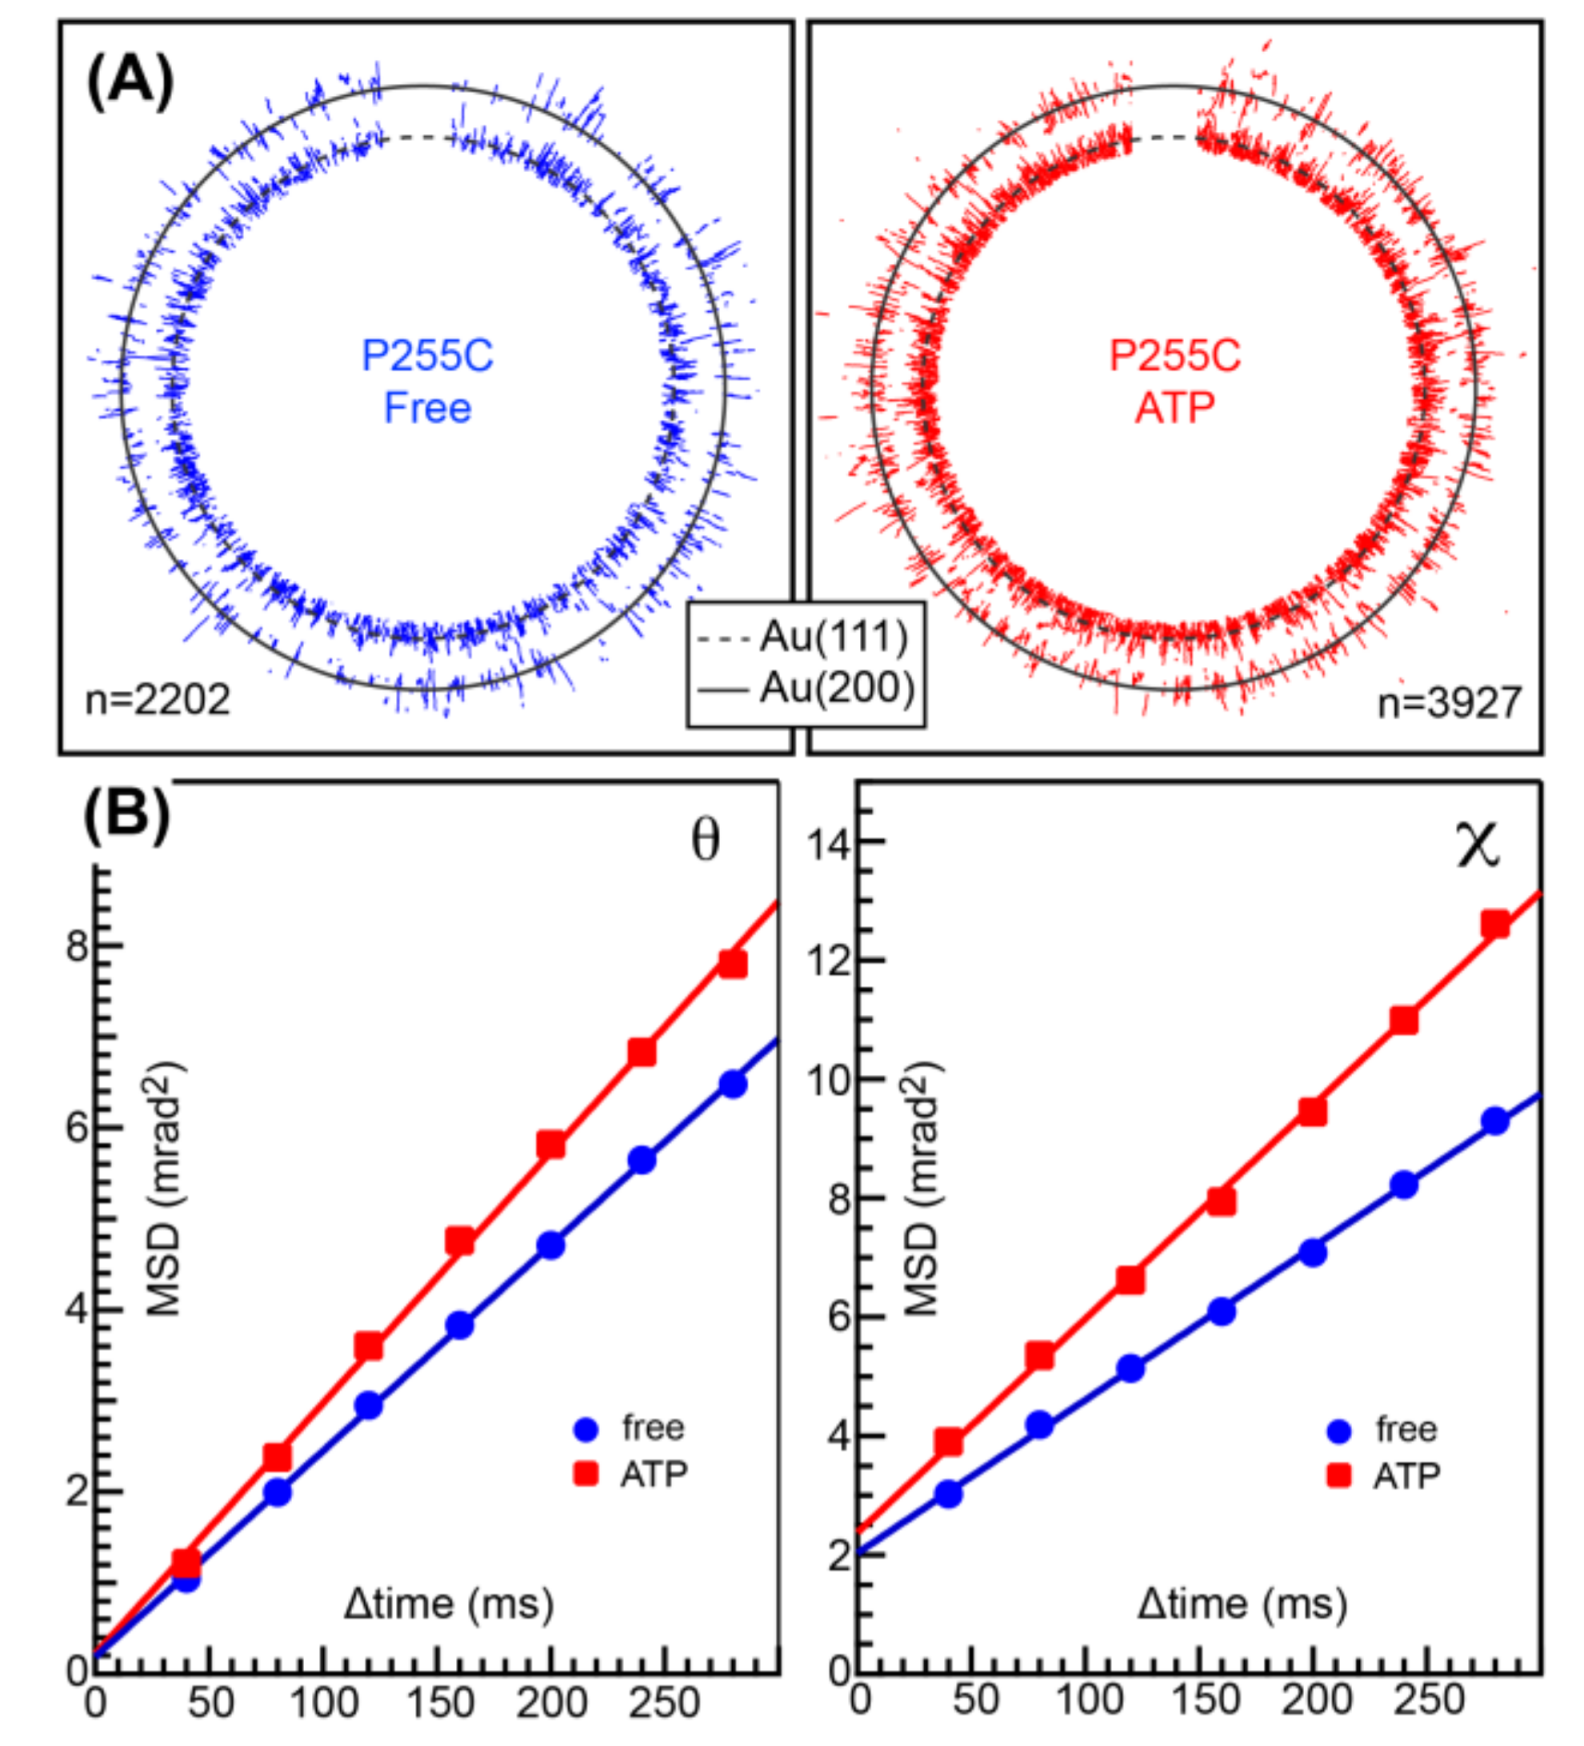
MmCpnP255C or MmCpnK256C was immobilized on a gold-coated substrate surface by the gold-thiol bond. Then, a gold nanocrystal (nanoparticle) was attached to the other side of the double ring. Because MmCpnP255C showed better results compared to MmCpnK256C in the preliminary experiment, we used MmCpnP255C for further studies. The twisting and tilting of MmCpnP255C corresponded to Laue spots from the gold nanocrystals in the concentric circle (
χ) and radial (
θ) directions, respectively.
Figure 3A shows traces of Laue spots from gold nanocrystals on MmCpnP255C in the absence (left) or presence of 2 mM ATP (right). Compared with previous observation on TKS1-Cpn, the concentric circle motion was not clearly observed. Then, we compared the mean square angular displacement (MSD) in the
θ and
χ directions as a function of the time interval (
Δtime) in the presence and absence of ATP (
Figure 3B). MSDs represent the deviations of the value with respect to a reference value over time. The MSD curve showed the slight activation of MmCpnP255C motion both in tilting (
θ) and twisting (
χ). The differences are also shown by the angular/rotational diffusion constants (
Table 1). However, compared with our previous results for TKS1-Cpn, the activation was modest [
11].
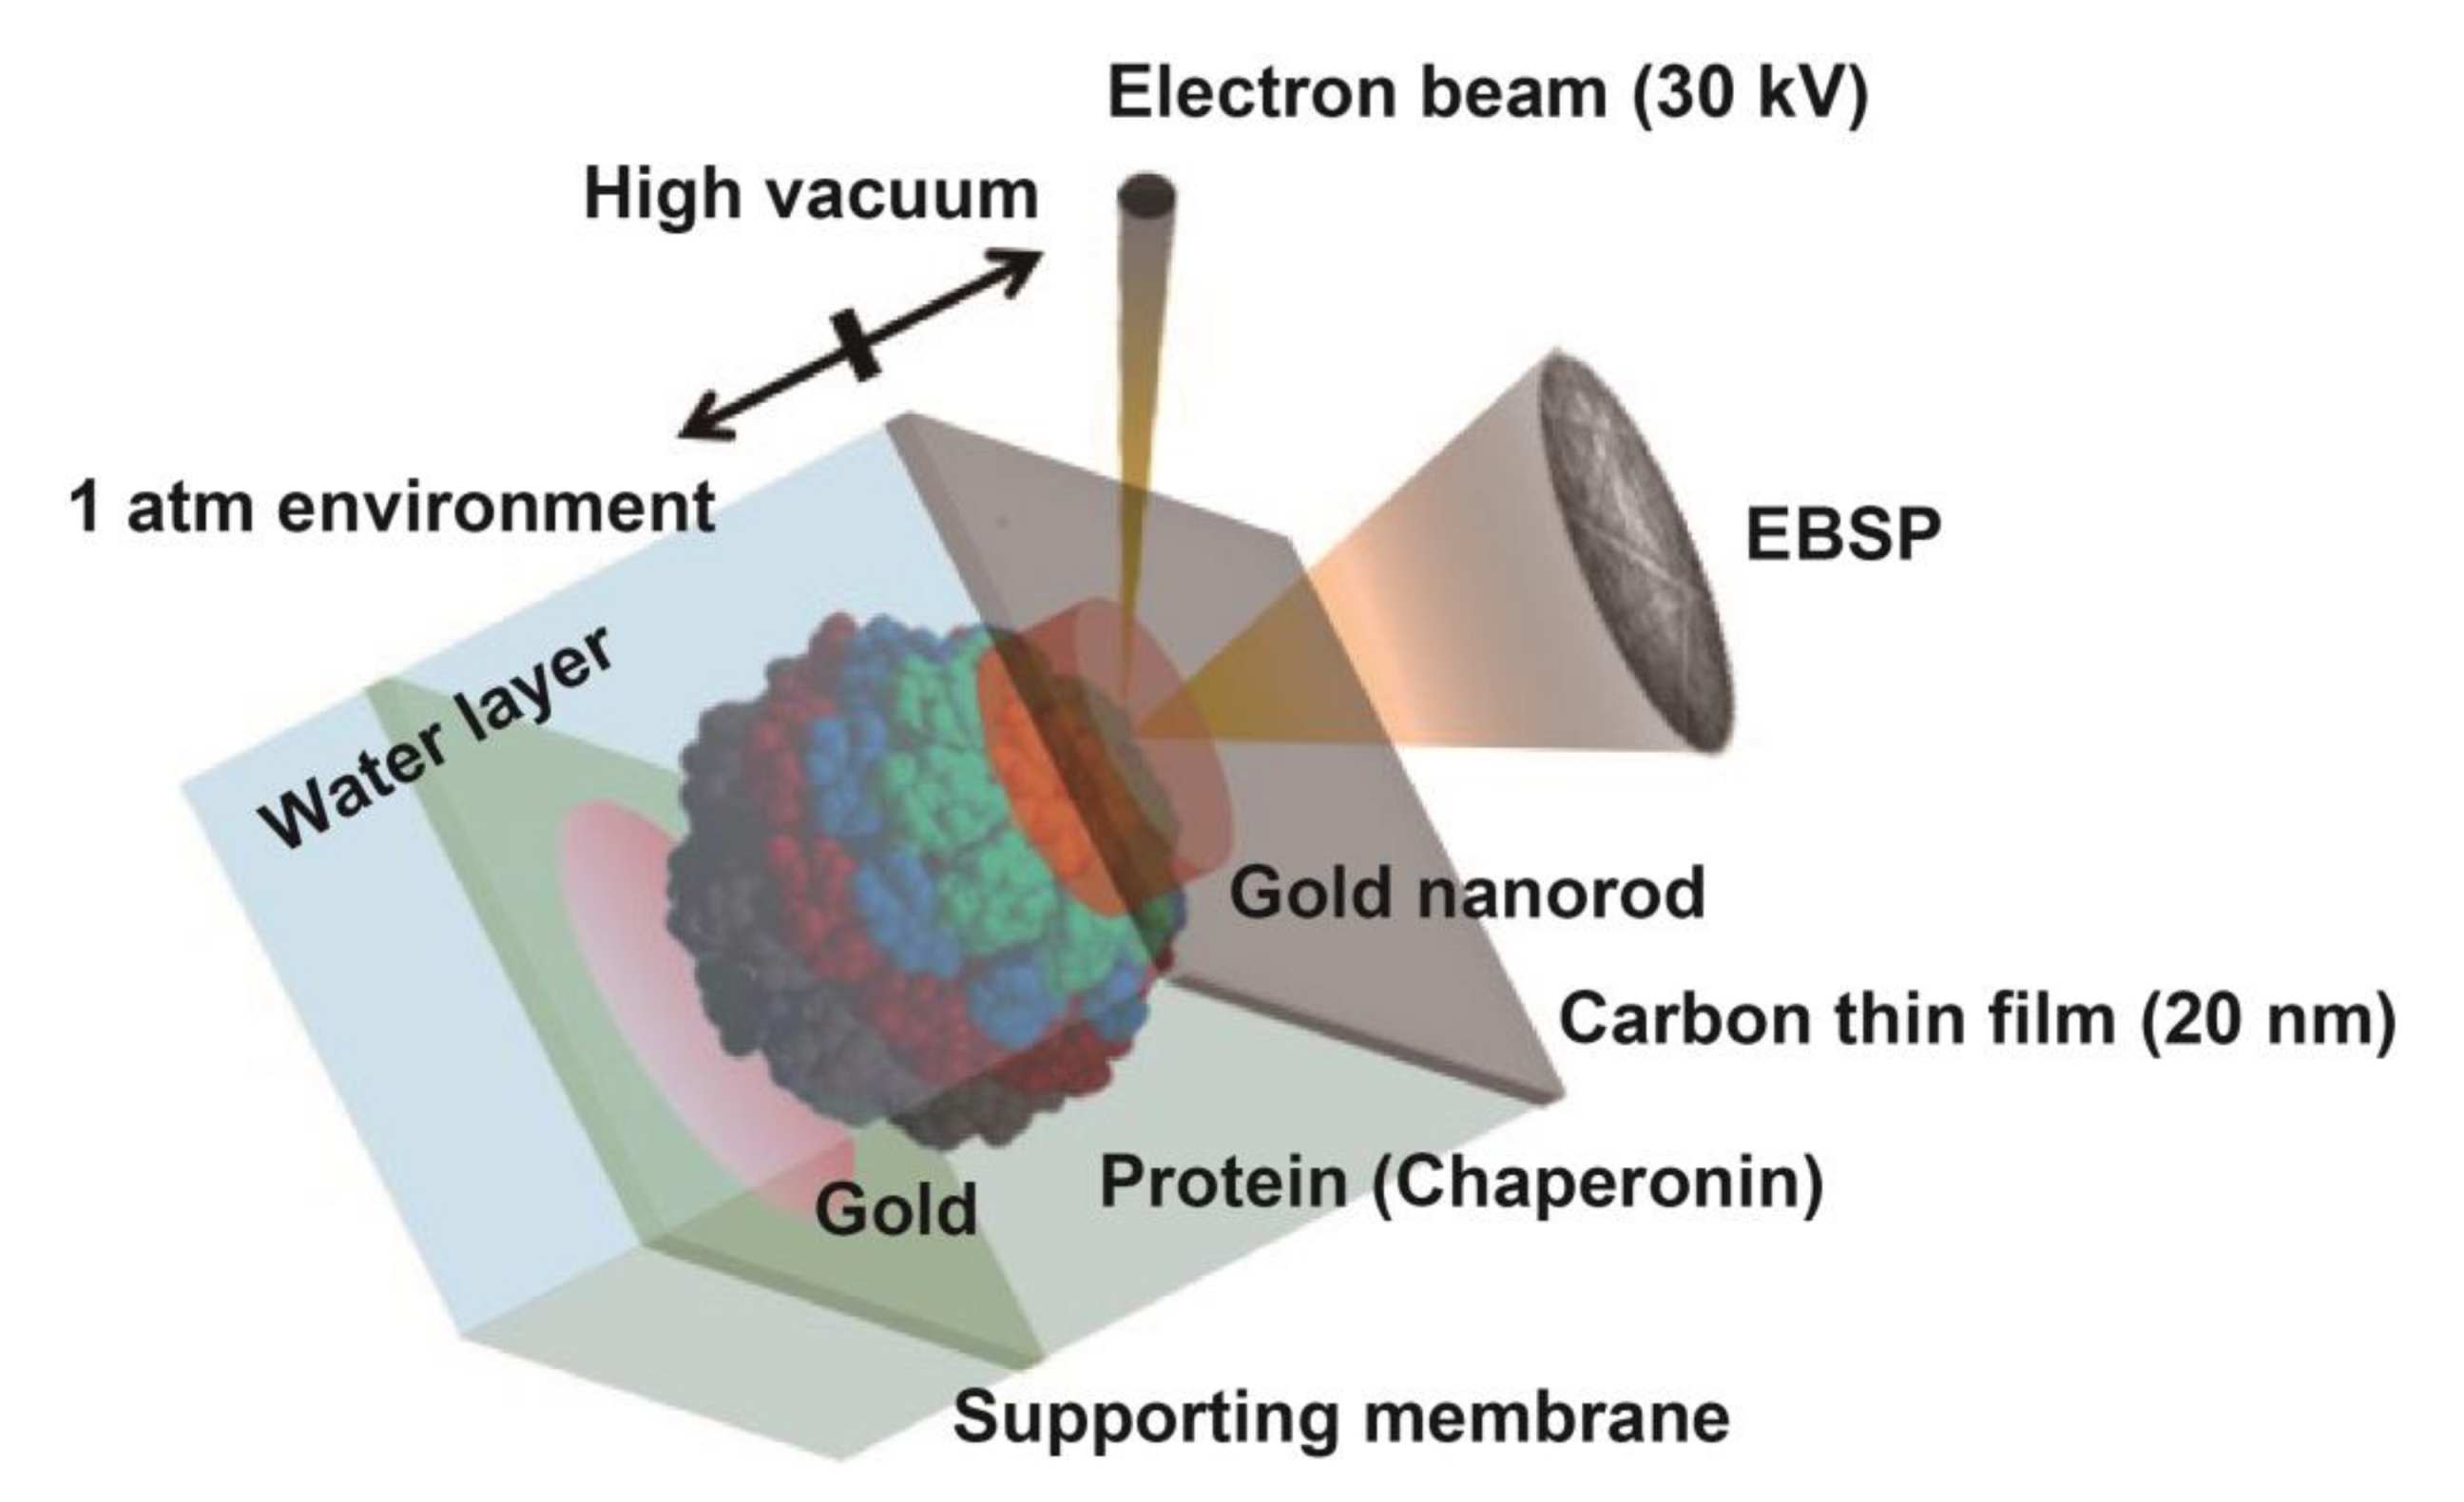
Then, we tried to analyze the motion by DET. In our previous experiment, gold nanoparticles were immobilized on a carbon sealing film via triacetyl cellulose (TAC) support. When we immobilized MmCpnP255C on the carbon sealing film, the gold nanoparticle was located on the other side of the carbon film. In such condition, the electron beam would irradiate the gold nanoparticle through MmCpnP255C, which would cause severe electron beam damage to MmCpnP255C. Therefore, we immobilized MmCpnP255C on the TAC support, and gold nanorods were attached to MmCpnP255C. Thus, a prepared TAC support was placed in the EC containing TKM buffer (50 mM Tris-HCl, pH 7.5, 100 mM KCl, and 25 mM MgCl
2) with or without 1 mM ATP (
Figure 4). Then, the EC was covered with a carbon thin film. The electron beam passed though the carbon thin film and buffer and then irradiated the gold nanorod. The effect of the electron beam on MmCpnP255C should be a slight one.
From the EBSP dynamics, the orientation of the crystallographic axis of the gold nanorod was determined. For adjacent frames, we measured the rotation angles
α,
β, and
γ of the principal lattice vectors
a,
b, and
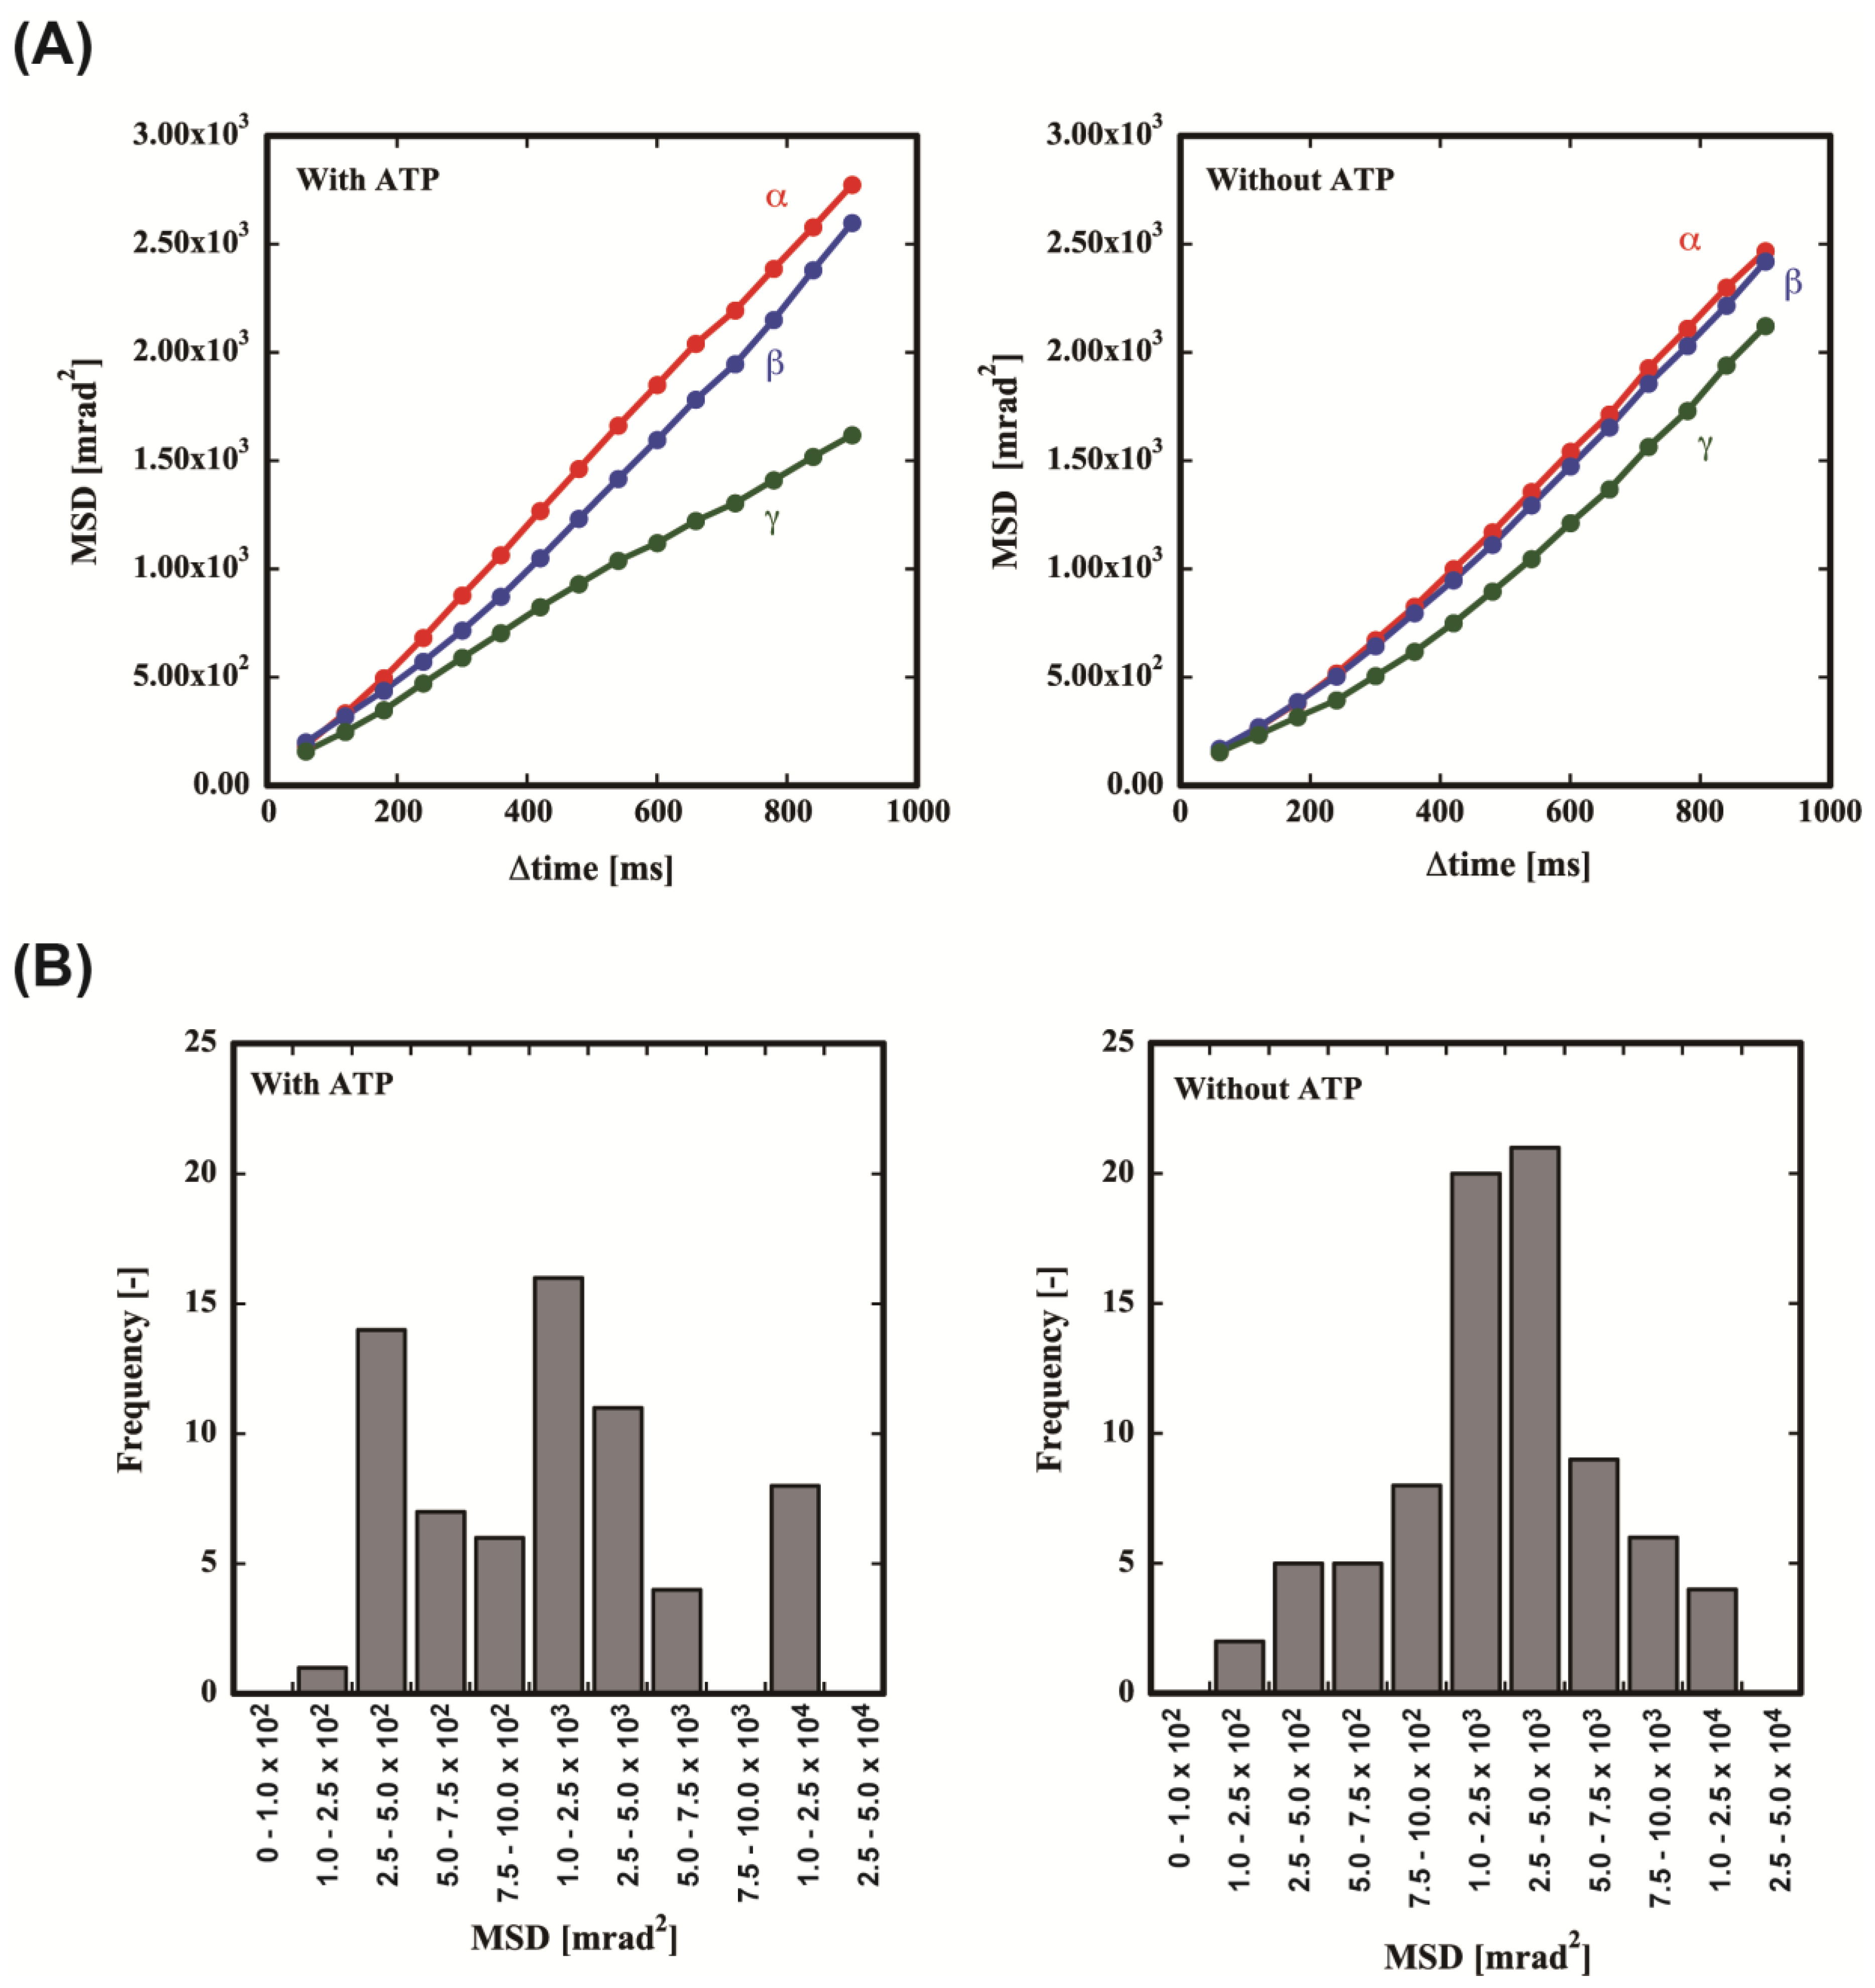
c, respectively, of each gold nanorod. To analyze the motion of the gold nanorod, we plotted the amplitude mean-square displacement (MSD) curves of the values of
α,
β, and
γ as a function of the time interval (
Δtime) with or without ATP (
Figure 5A). Without ATP, almost uniform rotational motion was observed in all axes. On the contrary, ATP induced significant asymmetry in the motion. The rotational motion for the
α and
β axes was significantly enhanced. However, the motion along the
γ axis was almost the same as that without ATP. This result means that the motion without ATP is Brownian motion and ATP induces the rotational motion of MmCpnP255C.
The amplitude of the rotation angle (ω) is calculated from the orientation matrix g, which is defined as follows.
The single-axis rotation between the
ith and
jth time step (
ωij) is calculated as follows.
The MSD of
ω indicated a slight increase in mobility in the presence of ATP. A significant difference was observed in the histograms (
Figure 5B). Without ATP, the frequency seems to follow a Gaussian distribution. On the contrary, the frequencies for the high and low mobility were significantly increased in the presence of ATP. This result clearly demonstrates that the motion is not only random, but also includes ATP-dependent motion (
Figure 5B).
4. Materials and Methods
4.1. Expression and Purification of MmCpnK256C and MmCpnP255C
The genes for MmCpnK256C and MmCpnP255C were made by site-directed mutagenesis of the gene of the Cys-less mutant of MmCpn. The MmCpn variants were overproduced in E. coli strain Rosetta (DE3) pLysS using a pET21 vector (Merck Millipore; Billerica, MA, USA). The cells were harvested by centrifugation, suspended in buffer A (50 mM Tris-HCl (pH 7.5), 5 mM MgCl2, and 1 mM dithiothreitol) and disrupted by sonication. The lysate was centrifuged at 15,000× g for 30 min to pellet the cell debris. The supernatant was loaded on a TOYOPEARL SuperQ-650 column (TOYOBO; Osaka, Japan) equilibrated with buffer A. Bound proteins were eluted by a NaCl gradient ranging from 0 to 500 mM. Fractions containing MmCpn variants were pooled and loaded on an AF-Heparin HC-650M (TOYOBO) equilibrated in buffer A with 0.28 M NaCl. Bound proteins were eluted by a NaCl gradient ranging from 0.28 to 1 M. Fractions containing MmCpn variants were pooled and concentrated using an Amicon Ultra-15 10K concentrator (Merck Millipore). Then, the oligomers of MmCpn variants were purified by size exclusion chromatography using a HiLoad 26/60 Superdex200 pg (GE Healthcare, Buckinghamshire, UK) with Buffer B (buffer A + 150 Mm NaCl). Fractions containing the oligomers of MmCpn variants were collected.
4.2. Fluorescence Intensity Assay
Cys256 of MmCpnK256C was labeled with fluorescein 5-maleimide (Invitrogen; Carlsbad, CA, USA). The fluorescence spectra were measured at 29 °C with a FP-6500 Spectrofluorometer (JASCO; Tokyo, Japan). MmCpnK256C complexes (50 nM) in TKM buffer were pre-incubated with or without ATP (1 mM) at 29 °C. The excitation wavelength was set at 493 nm, and the fluorescence was recorded from 500 to 650 nm.
4.3. DXT Measurement
A gold substrate was prepared by vapor deposition coating of a 50-μm thick polyimide film (Kapton®, Du Pont-Toray; Tokyo, Japan) with chromium (10 nm) and gold (25 nm). An aliquot of MmCpnP255C solution (0.2 mg/mL) in MOPS buffer (50 mM MOPS, 100 mM KCl, and 5 mM MgCl2, pH 7.0) was applied to the gold substrate for 2 h at 4 °C. Thus, prepared MmCpn modified substrate was reacted with the gold nanocrystal solution for 1–2 h at 4 °C. After removal of the excess gold nanocrystals by the rinse with MOPS buffer, the gold nanocrystal-modified MmCpn substrate was stored in the MOPS buffer until use. An experimental chamber was constructed of the sample substrate film with a spacer of a 50-μm thick polyimide film. The chamber was filled with MOPS buffer with or without 1 mM ATP for DXT measurement.
X-rays of 14.0–16.5 keV (Undulator ID gap = 31.0 mm) from beam line BL40XU (SPring-8; Sayo, Japan) were used to record the Laue diffraction spots from the gold nanocrystals on chaperonins. The sizes of the X-ray beam on the sample were 50 µm (vertical) and 50 µm (horizontal). The time-resolved diffraction images were monitored using an X-ray image intensifier (V5445P, Hamamatsu Photonics, Hamamatsu, Japan) and a CMOS camera (C11440-10C, Hamamatsu Photonics) with a 40 ms/f frame rate for 3.6 s. The distance between the sample substrate and the detector was approximately 100 mm and calibrated by diffraction from a gold film. The sample temperature during DXT was controlled to approximately 30 °C by hot air blowers (TRIAC PID; Leister, Kaegiswil, Switzerland). Gold nanocrystals were prepared as described previously [
11]. The average diameter of the gold nanocrystals was estimated to be 40 nm and confirmed by AFM images. Custom software written for IGOR Pro (Wavemetrics; Lake Oswego, OR, USA) was used to analyze the diffracted spot tracks and trajectories.
4.4. Sample Preparations for DET
A film of triacetyl cellulose (TAC) was used to support the MmCpnP255C. A 1% (w/v) TAC (Okenshoji Ltd., Tokyo, Japan) solution was prepared by dissolving TAC in a mixed solvent of 90% (v/v) 1,2-dichloroethane and 10% (v/v) methanol. A glass slide was soaked in the TAC solution and extracted at 2.5 mm/s. The TAC film was removed from the glass slide on the surface of the water and placed on the 50-µm thick polyimide film (Kapton®, Du Pont-Toray, Tokyo, Japan) ring (outer diameter 1.5 mm, inner diameter 1 mm). The polyamide ring with the TAC film was removed from the water and dried. Then, thin gold islands (several Å) were prepared on the TAC film by vapor deposition. Two microliters of MmCpnP255C in TKM buffer (5 µg/mL) was dropped onto the TAC film and incubated for 2 h at 4 °C. After two washes with TKM buffer, 2 µL of the gold nanorod (Axial Diameter 25 nm, Longitudinal Size 34 nm, Strem Chemicals Inc.; Newburyport, MA, USA) suspension in TKM buffer was dropped. After further incubation for 2 h at 4 °C, excess gold nanorod was removed by washing with TKM buffer twice. Finally, TKM buffer with or without 1 mM ATP was dropped on the thus prepared TAC support with samples, and then the support was placed into the EC. The EC was assembled from a 150-m diameter single-hole grid (Agar Scientific; Essex, UK) and an O-ring (inner diameter 2.0 mm, thickness 0.45 mm) at the top of the EC holder.
4.5. DET Measurement
A JSM-7001F SEM system (JEOL, Tokyo, Japan), equipped with a Schottky-type field emission electron gun was used in the DET experiment. To obtain the EBSP signal, we used an electron beam of 30 keV accelerating voltage, an 87 pA beam current, and a 17 mm working distance at a 70-degree angle relative to the EC sample stage. We detected EBSDs by the EBSD detector on the JSM-7001F system, which was custom designed by TSL Solutions (DVC1412-FW-T1-EX, TSL Solutions; Sagamihara, Japan). The detector included an image intensifier (V8070U-74, Hamamatsu Photonics; Hamamatsu, Japan). Each spot was irradiated with the electron beam for 1.5 s. The EBSP was obtained on the phosphor screen of the detector, intensified, and recorded with a CCD camera using a 60 ms shutter speed. The Euler angles, which indicate the rotational relationship between the sample stage coordinate system and the crystal lattice coordinate system of the gold nanorod, were obtained from the EBSP using OIM Analysis (EDAX Inc.; Mahwah, NJ, USA). From the Euler angles of adjacent EBSP frames, the single-axis rotation angle ω and the angles
α,
β, and
γ of the principal lattice vectors
a,
b, and
c, were calculated as described previously [
15].


 ,
, 


