Structure-Fluorescence Relationships in Antimicrobial Fluoroquinolones (AMFQs)

Abstract
:Introduction
| Compound | R1 | R′4 | 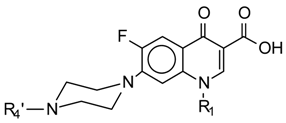 |
| I | -C2H5 | H | |
| II | c-C3H5 | H | |
| III | -C2H5 | -I-(CH3)2 | |
| IV | -C2H5 | -CO-CH3 | |
| V | -C2H5 | SO2-C6H4-NH2 | |
| VI | -C2H5 | SO2-C6H4-NH-CH3 | |
| VII | -C2H5 | SO2-C6H4-N-(CH3)2 | |
| VIII | c-C3H5 | SO2-C6H4-NH2 | |
| IX | c-C3H5 | SO2-C6H4-NH-CH3 | |
| X | -C2H5 | SO2-C6H4- CH3 | |
| XI | c-C3H5 | SO2-C6H4- CH3 |
Results and Discussions
| Compound | Excitation | Emission | U.V. Absortion Coeficients | |||
| λmax (pH= 4,8 -8) | Intensity (pH =4,8) | λ Max (pH = 4,8) | Intensity (pH = 8,0) | λ max (pH =8,0) | ξ (L.mol-1.cm-1) | |
| I | 272 nm | 5040 | 444 nm | 2402 | 415 nm | 32400 |
| II | 270 nm | 5885 | 447 nm | 3074 | 417 nm | 28800 |
| III | 278 nm | 6968 | 440 nm | 2634 | 409 nm | 33846 |
| IV | 272 nm | 600.0 | 443 nm | 3085 | 435 nm | 35733 |
| V | 272 nm | 540.3 | 445 nm | 2178 | 427 nm | 54900 |
| VI | 274 nm | 664.0 | 440 nm | 833.5 | 424 nm | 53430 |
| VII | 272 nm | 589.7 | 443 nm | 625.2 | 420 nm | 49252 |
| VIII | 272 nm | 659.8 | 442 nm | 1788 | 431 nm | 41000 |
| IX | 270 nm | 874.9 | 444 nm | 763.8 | 426 nm | 48700 |
| X | 274 nm | -------- | --------- | 3388 | 428 nm | 33900 |
| XI | 276 nm | -------- | --------- | 3950 | 431 nm | 42200 |
References and Notes
- Huang, Zuyun; Huang, Houping; Takashi, Zhinin Lin; Zeng, Korenaga Yu-e. Analytical Science 1997, 13 (supple), 77.
- Schimer, Roger E. Fluorometric Analysis. In Orden Methods of Pharmaceutical Analysisde CRC. Press; Vol I, 2nd ed; pp. 213–271.
- Asuquio, L.J.; Piddok. J. Antimicob. Chemother. 1993, 31, 865.
Share and Cite
Vilches, A.P.; Nieto, M.J.; Mazzieri, M.R.; Manzo, R.H. Structure-Fluorescence Relationships in Antimicrobial Fluoroquinolones (AMFQs). Molecules 2000, 5, 398-400. https://doi.org/10.3390/50300398
Vilches AP, Nieto MJ, Mazzieri MR, Manzo RH. Structure-Fluorescence Relationships in Antimicrobial Fluoroquinolones (AMFQs). Molecules. 2000; 5(3):398-400. https://doi.org/10.3390/50300398
Chicago/Turabian StyleVilches, Ana P., Marcelo J. Nieto, María R. Mazzieri, and Ruben H. Manzo. 2000. "Structure-Fluorescence Relationships in Antimicrobial Fluoroquinolones (AMFQs)" Molecules 5, no. 3: 398-400. https://doi.org/10.3390/50300398
APA StyleVilches, A. P., Nieto, M. J., Mazzieri, M. R., & Manzo, R. H. (2000). Structure-Fluorescence Relationships in Antimicrobial Fluoroquinolones (AMFQs). Molecules, 5(3), 398-400. https://doi.org/10.3390/50300398