Abstract
Three new 2,3-disubstituted quinazolin-4(3H)-one derivatives (5a–c) were synthesized by the nucleophilic S-alkylation of 2-mercaptoquinazolin-4(3H)-one derivatives (3a–c) with 5-(2-bromoacetyl)-2-hydroxybenzamide (4) in alkaline conditions. The final compounds were characterized by recording the IR, MS, 1H-NMR, and 13C-NMR spectra. The new synthesized compounds 5a–c were evaluated in vitro for their cytotoxic activity using one normal cell line, human foreskin fibroblasts (BJ), and one cancerous cell line, derived from human hepatocellular carcinoma (HepG2). Sorafenib was used as a reference. The obtained results from the in vitro examination suggested that compound 5a had lower cytotoxic effects on the BJ cells than the positive standard, and compound 5b exhibited the strongest cytotoxic potential against the HepG2 cell line, being less effective compared to sorafenib. In order to evaluate their pharmacological profiles, the compounds were assessed in vitro and in silico by lipophilicity studies, targeted VEGFR-2 molecular docking, molecular dynamics, and MM-PBSA studies. Additionally, the electronic properties were evaluated by an in silico study of the HOMO and LUMO parameters. Compound 5b exhibited the most interesting pharmacological profile in comparison with the other compounds due to its bulkier substituent from position 3 of the quinazolinone core.
1. Introduction
Hepatocellular carcinoma (HCC) is the most predominant cancer subtype among all liver cancers, often diagnosed in an advanced stage of the disease [1]. Numerous risk factors contribute to the exacerbation of liver cancer, the most common of them being cirrhosis; hepatitis B and C; overweight or obesity; type 2 diabetes, often linked to metabolic-dysfunction-associated steatotic liver disease (MASLD); or exposure to aflatoxins. HCC is an example of a hypervascular tumor; thus, angiogenesis plays a crucial role in its progression [1,2,3].
Receptor tyrosine kinases (RTKs) are key regulators of membrane-bound receptors that control cellular functions such as proliferation and survival. The expression of RTK is typically upregulated in many types of cancer (non-small-cell lung cancer, colorectal cancer, gastrointestinal cancer, thyroid cancer, renal cell carcinoma, etc.).
One of the main RTK families is the vascular endothelial growth factor receptors (VEGFR) family, composed of VEGFR-1, VEGFR-2, and VEGFR-3 isoforms [4]. Vascular endothelial growth factor (VEGF) is a proangiogenic factor involved in HCC, and its overexpression in tumor tissues can be a useful prognostic factor after treatment, in patients with HCC. The latest reported evidence suggests that VEGF/VEGFR-2 signaling pathways are involved in the proliferation, migration, survival, and permeability of vascular endothelial cells.
The design and development of new anti-HCC medication can lead to anti-angiogenesis effects through attractive targets, such as the blockade of the VEGF/VEGFR-2 pathway [3]. Sorafenib, a small molecule, is a well-known VEGFR-2 inhibitor approved by the U.S. Food and Drug Administration (FDA) for HCC chemotherapy. It is composed of some common pharmacophoric fragments that interact with VEGFR-2 (Figure 1): (a) a hinge-binding “head” group, represented by an aromatic heterocycle containing a N atom—which fits into the adenine region in the ATP-binding pocket and forms hydrogen bonds—at least one H-bond acceptor (HBA), and/or a H-bond donor (HBD), with Cys919; (b) a “linker”, which spans the gatekeeper residue, occupying the space between the ATP-binding domain and the DFG domain. The linker used here contains an ether-phenyl moiety, where the phenyl interacts with the hydrophobic site (Lys868) in the hinge region; (c) a pharmacophore, which is described as a urea moiety, forming a H-bond acceptor through the C=O group with Asp1046 in the conserved DFG (Asp-Phe-Gly) motif, and two H-bond donors through NH groups with Glu885 of the αC helix (these interactions stabilize the inactive DFG-out conformation of the kinase, which is necessary for the inhibitor drug to bind); (d) a “tail” segment, usually comprising a hydrophobic group, that occupies the allosteric hydrophobic back pocket displayed by the DFG-out conformation [4,5,6]. However, the clinical application of sorafenib is limited because of its side effects during treatment administration, such as anorexia, diarrhea, or heart attack. Moreover, this compound has an unfavorable pharmacokinetic profile, characterized by a low level of solubility and permeability, which increases cytotoxicity and the development of resistance to the drug treatment in cancer cells [7].
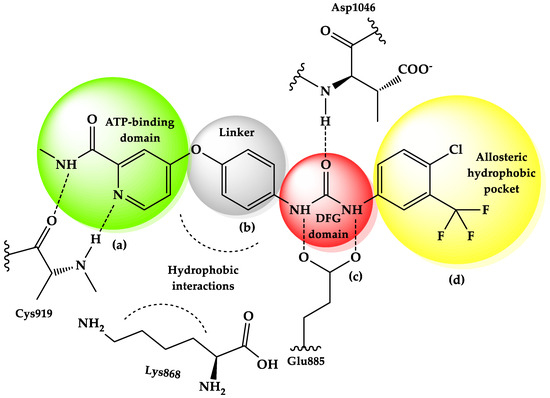
Figure 1.
Sorafenib—representation of the active site of VEGFR-2 (a = “head” group; b = linker; c = DFG domain; d = tail segment) [4,5,6].
Today, in silico studies that can predict the drug-likeness properties are essential for drug discovery and development, determining the safety, efficacy, and overall behavior of potential drug candidates in humans. Drug-likeness, as a concept, involves Lipinski’s rule of five and other additional descriptors, such as solubility, permeability, and stability, that predict the potential of a candidate to become a successful drug [8,9,10,11,12].
N-heterocyclic systems, such as quinolines, quinazolines, quinazolinones, and quinazolindione, represent important scaffolds in the design of antitumor drugs [13,14,15,16,17,18,19,20,21], as well as other heterocycles reported in the literature [8,9]. Small molecules with a 2,3-disubstituted quinazolinone heterocycle structure were studied in various cancer cell lines, including the human hepatocellular carcinoma cell line (HepG2). This heterocycle is widely studied in medicinal chemistry research due to a variety of substituents containing different functional groups that can improve its biological activities (Figure 2) [16,17,18,22,23].
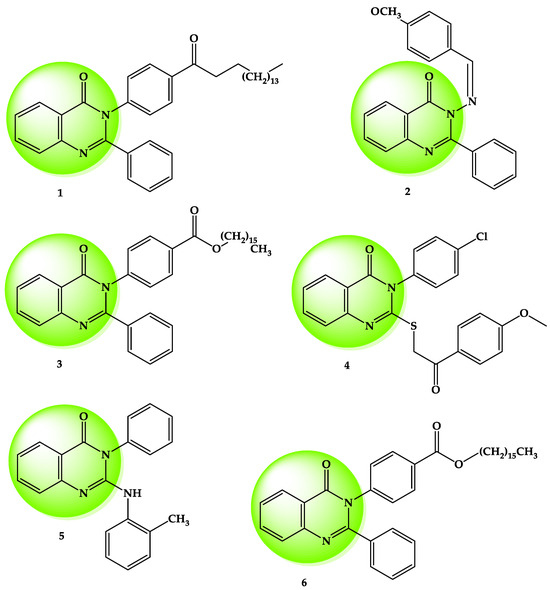
Figure 2.
Biologically active compounds with the 2,3-disubstituted quinazolin-4(3H)-one scaffold reported in the literature [16,17,18,22,23].
Our hypothesis was derived from structure–activity relationship (SAR) studies on sorafenib, which indicated the existence of 2–3 essential regions that interacted with VEGFR-2. Based on these observations, we conducted a preliminary molecular docking study and selected three quinazolinone derivatives with different substituents in the third position. The hetero-aromatic moiety is crucial to enhancing affinity towards the ATP-binding domain [24]. A substitution of the third position from the quinazolinone core was made with some variation in the flexibility of fragments, like allyl, benzyl, or ethyl. We assumed that through higher flexibility, the compounds can be better fixed to the ATP-binding domain and DFG motif, moving away from the distal hydrophobic pocket during the conformational change of DFG-in to DFG-out. Another modification consisted of extending the linker between the ATP-binding domain and DFG motif by changing the O-phenyl with a thioether, S-acetyl-phenyl spacer. Furthermore, the phenyl ring spacer should enable hydrophobic interactions with the surrounding amino acids from the gate area. The linker connects the quinazoline core to other functional groups, significantly impacting the drug’s binding, solubility, and metabolism [25]. The substitution of the phenyl with a hydroxyl group should increase the capacity to bind to the key amino acids at the active site of VEGFR-2, Glu885 and Asp1046, as well as their hydrophobic interactions with the hydrophobic pockets of the receptor. Also, it was noted to improve the antiangiogenic activity of the reported compounds (Figure 3) [4,5,6,26]. The last modification was represented by the replacement of the urea motif from sorafenib with the more stable carbamide group. Amide or urea groups are crucial linkers on many VEGFR inhibitor drugs that interact with the DFG motif. These groups typically can form two key hydrogen bonds with the backbone of the kinase domain. One hydrogen bond can be with the backbone NH of the aspartate residue in the DFG motif itself (e.g., Asp1046 in VEGFR-2), and the other can be with Glu885, another crucial amino acid localized in the C-helix. These interactions stabilize the inactive DFG-out conformation of the kinase, which is necessary for the inhibitor drug to bind.
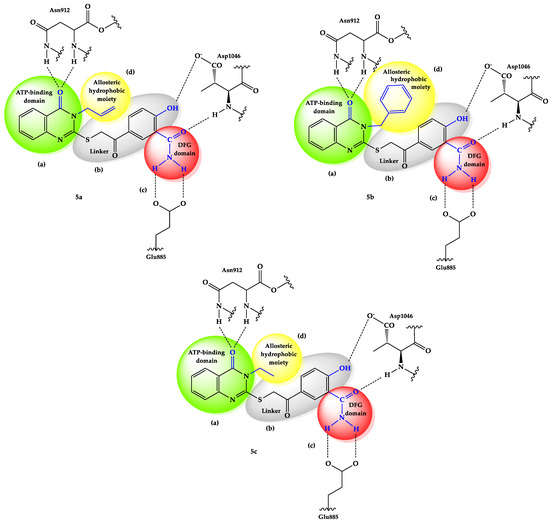
Figure 3.
Computational design of 5a–c compounds. (a = “head” group; b = linker; c = DFG domain; d = tail segment) [4,5,6].
The desired compounds 5a–c were synthesized and subjected to a series of in silico studies to validate the proposed mechanism of action and to evaluate the drug-likeness properties. Furthermore, in vitro studies were conducted on the cytotoxicity of the compounds on a healthy human foreskin fibroblast cell line (BJ) and on a human hepatocellular carcinoma cell line (HepG2), and the lipophilicity of compounds 5a–c was evaluated.
2. Results and Discussion
2.1. Chemical Synthesis
After a preliminary molecular docking study, chemical synthesis of our compounds was performed. Based on the obtained binding energies, we synthesized three compounds, 5a–c, with different structural profiles.
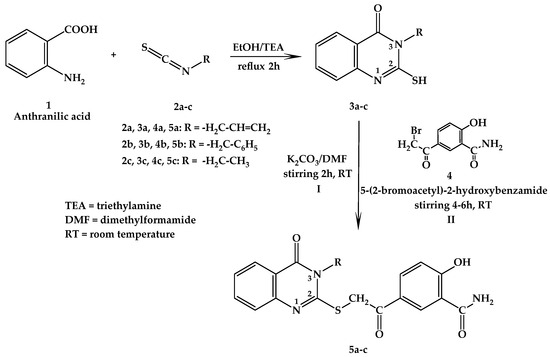
The first step of the synthesis was represented by the reaction of anthranilic acid (1) through a nucleophilic addition with three different isothiocyanates (2a–c)—in alkaline conditions achieved using triethylamine (TEA) in refluxing ethanol—followed by a cyclization reaction, in order to obtain the intermediate 4(3H)-quinazolinone compounds (3a–c) [27,28]. Compounds 5a–c were synthesized via nucleophilic S-alkylation of 3-allyl-2-mercaptoquinazolin-4(3H)-one (3a), 3-benzyl-2-mercaptoquinazolin-4(3H)-one (3b), or 3-ethyl-2-mercaptoquinazolin-4(3H)-one (3c) with 5-(2-bromoacetyl)-2-hydroxybenzamide (4), with considerable yields, by stirring at room temperature (RT), in alkaline conditions achieved by adding K2CO3 in DMF (Scheme 1).
Scheme 1.
Chemical synthesis of the 5a−c compounds.
2.2. Molecular Docking
We started our study with a preliminary screening through in silico molecular docking on VEGFR-2. Because molecular docking is prone to algorithm-specific biases, reporting convergent trends across two distinct engines strengthens confidence in the predicted binding modes. In our study, despite numerical differences, both methods identified similar binding orientations and consistent relative ranking among compounds. This consistency supports the reliability of the findings and reduces the risk that the conclusions depend on a single docking protocol.
The binding affinities of compounds 5a–c and sorafenib to the ATP-binding site of VEGFR-2 are presented in Table 1. The re-docking of sorafenib to the targeted site resulted in a superposable conformation with the crystallized sorafenib, with the coordinates of the heavy atoms reaching an 1.22 Å RMSD [29,30].

Table 1.
The binding affinities (ΔG) of compounds 5a–c and sorafenib to the ATP-binding site from VEGFR-2 (kcal/mol).
The compound with the highest binding affinity was found to be 5b (ΔG = −9.3 kcal/mol, when using AutoDock Vina and ΔG = −10.19 kcal/mol when using AutoDock), while compounds 5a and 5c had significantly lower binding affinities. All compounds had lower binding affinities to VEGFR-2 when compared to sorafenib. Even though the two pieces of software have different working principles [31,32,33,34], upon analyzing the overall results, a good correlation was found (R2 = 0.92).
Graphical depictions of the interactions between the compounds and VEGFR-2 are presented in Figure 4, Figure 5, Figure 6 and Figure 7. An identical binding pattern was identified for all of the top predicted binding conformations of compounds 5a–c, where the oxygen atom from quinazolinone was predicted to interact with the positively charged sidechain of Arg1027, while the hydroxyl group from the salicylamide moiety was predicted to be involved in a hydrogen bond as donor (HBD) with the Val867-Ala866 peptide bridge. The variable hydrophobic substituent found in position 3 of the quinazolinone core of compounds 5a–c fitted well in the hydrophobic pocket surrounded by the sidechains of Ile892, Val898, Val899, Leu1019, and Ile1044.
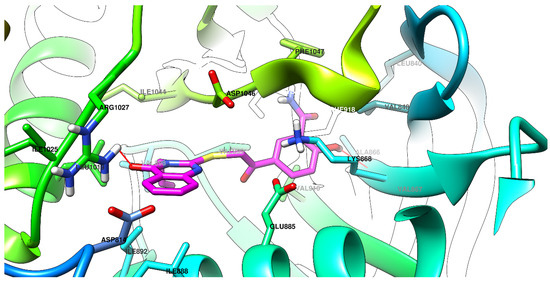
Figure 4.
The top binding conformation of 5a at the ATP-binding site of VEGFR-2 (carbon atoms in magenta, oxygen atoms in red, hydrogen atoms in white, nitrogen atoms in blue, sulfur atom in yellow).
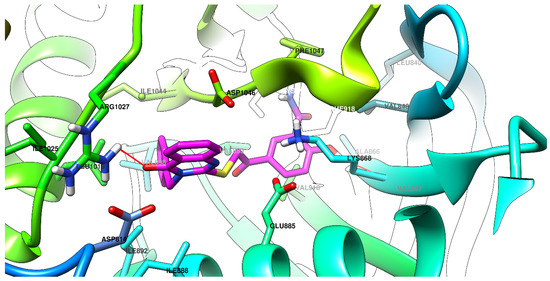
Figure 5.
The top binding conformation of 5b at the ATP-binding site of VEGFR-2 (carbon atoms in magenta, oxygen atoms in red, hydrogen atoms in white, nitrogen atoms in blue, sulfur atom in yellow).
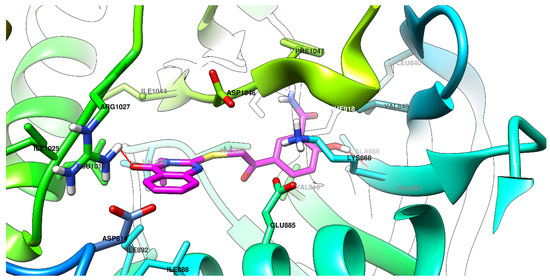
Figure 6.
The top binding conformation of 5c at the ATP-binding site of VEGFR-2 (carbon atoms in magenta, oxygen atoms in red, hydrogen atoms in white, nitrogen atoms in blue, sulfur atom in yellow).
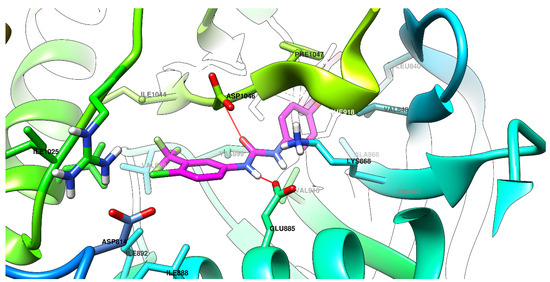
Figure 7.
The top binding conformation of sorafenib at the ATP-binding site of VEGFR-2 (carbon atoms in magenta, oxygen atoms in red, hydrogen atoms in white, nitrogen atoms in blue, sulfur atom in yellow).
Graphical depictions of the interactions between compound 5b superimposed with sorafenib and VEGFR-2 are presented in Figure 8. For the other two compounds, 5a and 5c, these interactions are presented in Figures S13 and S14 in the Supplementary Materials. The main highlighted interactions were the same, as shown in Figure 4, Figure 5, Figure 6 and Figure 7. Sorafenib is known as a target tyrosine kinase inhibitor, and can negatively influence antitumoral activity because of its severe side effects and the rapid development of tumor resistance [35]. A different method of binding at the VEGFR-2 active site can also influence the capacity of compounds 5a–c to mitigate side effects and tumor resistance.
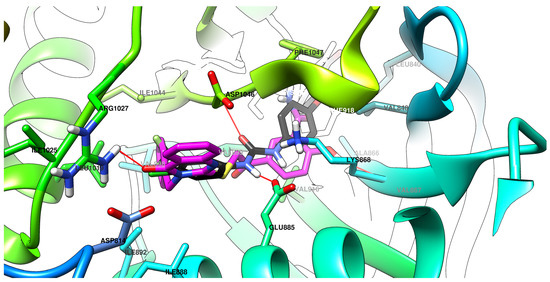
Figure 8.
The top superposing binding conformation of compound 5b and sorafenib at the ATP-binding site of VEGFR-2 (carbon atoms in magenta for compound 5b and in black for sorafenib, oxygen atoms in red, hydrogen atoms in white, nitrogen atoms in blue, sulfur atom in yellow).
In line with the SAR hypothesis, the most important functional groups remained the oxygen atom from quinazolinone, the hydroxyl group from the salicylamide moiety, and the bulkier hydrophobic substituent found on position 3 of the quinazolinone heterocycle.
2.3. Molecular Dynamics
Performing molecular dynamics simulations after molecular docking is crucial for validating the docking results and gaining a more realistic, dynamic understanding of the ligand–protein interaction [36].
After performing molecular dynamics studies on the constructed complexes of compounds 5a–c and sorafenib, their trajectories were studied, with the generated summary of data being presented in Table 2. The plotted data resulting from the analysis are also presented (Figure 9, Figure 10, Figure 11 and Figure 12).
Table 2.
Summary of molecular dynamics analyses, including backbone RMSD of VEGFR-2 (RMSD-protein), RMSF of amino acid sidechains and alpha carbons, RMSD of ligand heavy atoms (RMSD-ligand), receptor radius of gyration (Rg), and average number of hydrogen bonds (NoHB) between ligand and VEGFR-2.
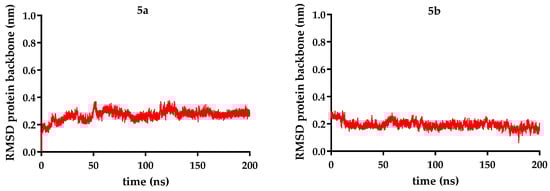
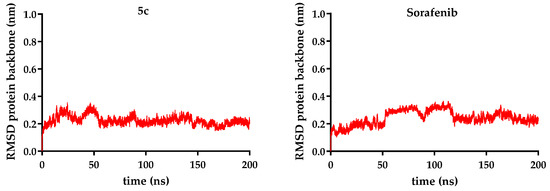
Figure 9.
RMSD (root-mean-square deviation) protein backbone (nm) is represented for each of compounds 5a–c over 200 ns, compared to sorafenib.
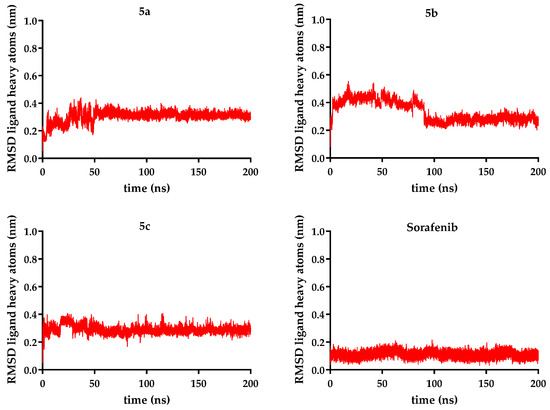
Figure 10.
RMSD (root-mean-square deviation) for ligand heavy atoms (nm) is represented for each of compounds 5a–c over 200 ns, compared to sorafenib.
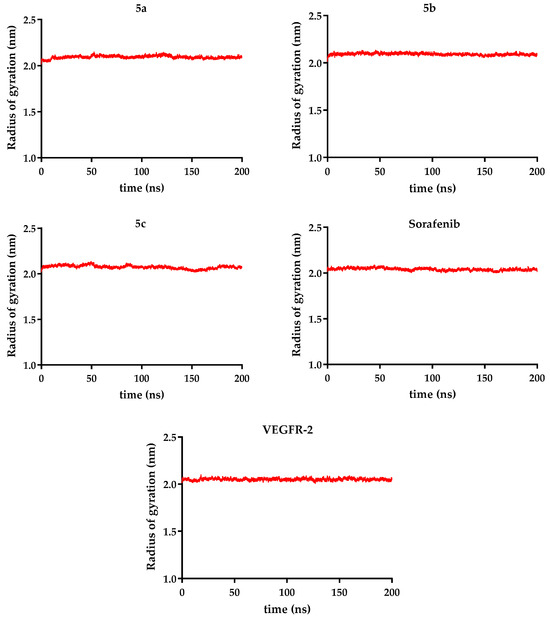
Figure 11.
Counting of hydrogen bonds (1 ns moving average) between compounds 5a–c and VEGFR-2 over 200 ns, compared to sorafenib.
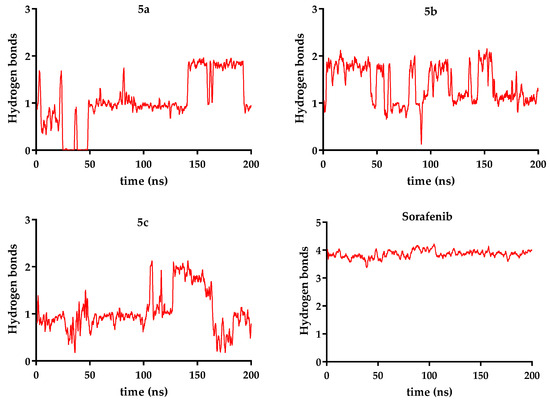
Figure 12.
Hydrogen bonds are presented for compounds 5a–c over 200 ns, compared to sorafenib.
The molecular dynamics simulations revealed that all VEGFR-2 complexes maintained structural stability during the simulation period. The backbone RMSD values for the receptor ranged from 0.19 to 0.26 nm, indicating minimal deviation from the starting conformation, with an RMSD of 0.19 nm in the case of the complex with compound 5b, the lowest RMSD in the current series. Similarly, the receptor’s radius of gyration (2.04–2.09 nm) remained constant across all systems, suggesting that ligand binding did not induce significant protein compaction or expansion.
Root-mean-square fluctuations of α-carbons (0.11–0.12 nm) and amino acid sidechains (0.16–0.17 nm) were comparable among all complexes, implying that local flexibility was not substantially altered upon ligand binding.
Ligand stability within the binding site varied more noticeably. Sorafenib exhibited the lowest ligand RMSD (0.11 nm), confirming its highly stable positioning. In contrast, the novel analogs showed higher fluctuations: compound 5c (R = ethyl − 0.28 nm) was the most stable of them, while compound 5b (R = benzyl − 0.33 nm) was the most mobile, when the data were analyzed as an overall average. Taking a deeper look into the trajectory of the ligand, it can be seen that the average did not correctly describe its stability. After significant movement in the first part of the simulation (the first 90 ns), a period when compound 5b exhibited significant conformational changes, a plateau state was reached in a stable conformation, with a ligand RMSD of 0.27 nm (Figure 9, Figure 10 and Figure 11).
Hydrogen bonding patterns further highlight sorafenib’s superior binding performance, forming an average of 3.86 hydrogen bonds/ns, exceeding the values observed for compound 5a (R = allyl − 1.05), compound 5b (R = benzyl − 1.37), and compound 5c (R = ethyl − 1.04) (Figure 12). Additionally, a supplementary table (Table S1) presenting the number of hydrogen bonds between VEGFR-2 and compounds 5a–c, reported every 10 ns for each compound compared to sorafenib, is included in the Supplementary Materials.
These findings suggest that although compounds 5a–c can stably associate with VEGFR-2 without destabilizing the receptor, they establish fewer hydrogen bonds and display greater mobility compared to sorafenib. Among the tested analogs, compound 5b demonstrates the most promising interaction profile based on its combination of low receptor RMSD and moderate hydrogen bonding. Further structural optimization is needed to enhance binding stability and affinity.
2.4. Molecular Mechanics–Poisson–Boltzmann Surface Area (MM-PBSA)
The Molecular Mechanics–Poisson–Boltzmann Surface Area (MM-PBSA) method is a powerful and widely used computational technique for calculating the binding free energy of molecular complexes, such as a protein–ligand pair. It is often used to refine and validate results from initial molecular docking experiments by providing a more accurate and comprehensive energetic estimate of the binding interaction [37].
To gain deeper insight into the interactions between the 5a–c series and the VEGFR-2 kinase domain (DFG-out conformation), an MM-PBSA analysis was performed on the final 200 ns of the molecular dynamics simulations, and the resulting predicted values are summarized in Table 3.
Table 3.
The binding free energy of compounds 5a–c and sorafenib to VEGFR-2 and their decomposition with different types of interaction (kcal/mol).
Among the new derivatives, compound 5b displayed the most favorable ΔG (−35.33 kcal/mol), primarily due to its strong van der Waals component. This was the only compound with an aromatic substituent represented by a phenyl ring linked through a methylene group at position 3 of the quinazolinone core (−53.01 kcal/mol), providing flexibility to the molecule to achieve better interaction with the active site of VEGFR-2. However, its electrostatic contribution could be attributed to the bulkier substituent from position 3 of the quinazolinone heterocycle, where the π electrons were delocalized, leading to a significantly weaker value (−7.32 kcal/mol) than sorafenib’s (−39.67 kcal/mol). Compounds 5a and 5c showed comparable binding energies (−32.29 and −32.64 kcal/mol, respectively), with van der Waals terms (−45.45 kcal/mol each) and moderate electrostatic contributions (−17.35 and −14.81 kcal/mol), due to the smaller substituents in position 3 of the quinazolinone nucleus (allyl and ethyl), where effects of π electron delocalization from an aromatic ring did not occur.
The reference inhibitor sorafenib exhibited a markedly stronger binding affinity (ΔG = −69.39 kcal/mol) compared with the novel compounds 5a–c (−32.29 to −35.33 kcal/mol). The decomposition of energetic contributions revealed that sorafenib benefited from both more favorable van der Waals interactions (−59.19 kcal/mol) and substantially enhanced electrostatic interactions (−39.67 kcal/mol) relative to 5a–c.
The solvation energies for compounds 5a–c (25.00–30.51 kcal/mol) were similar to that of sorafenib (29.47 kcal/mol), suggesting that solvent effects did not significantly differentiate their binding profiles.
To further elucidate the specific interactions involving amino acids located within 5 Å of the ligands in the complexes, an energy decomposition analysis was carried out, and the corresponding graphical representations are shown in Figure 13, Figure 14, Figure 15 and Figure 16.
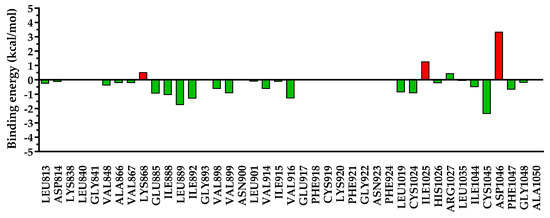
Figure 13.
The energy decomposition for amino acids found within 5 Å of 5a. In green are depicted the favorable interactions, while in red are depicted the unfavorable interactions.
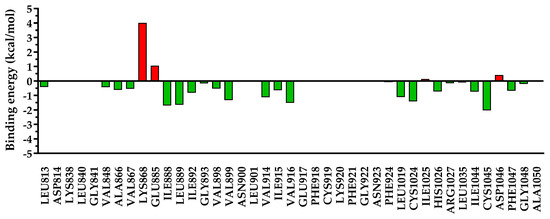
Figure 14.
The energy decomposition for amino acids found within 5 Å of 5b. In green are depicted the favorable interactions, while in red are depicted the unfavorable interactions.
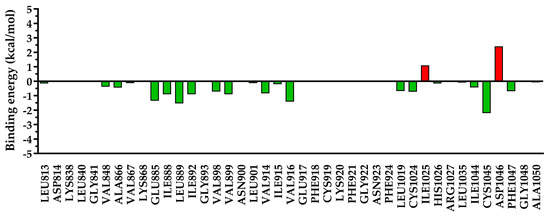
Figure 15.
The energy decomposition for amino acids found within 5 Å of 5c. In green are depicted the favorable interactions, while in red are depicted the unfavorable interactions.
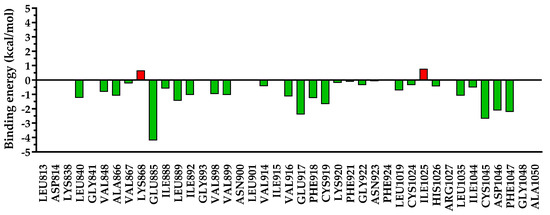
Figure 16.
The energy decomposition for amino acids found within 5 Å of sorafenib. In green are depicted the favorable interactions, while in red are depicted the unfavorable interactions.
Due to the different substitutions of compounds 5a–c, a clear difference could be observed after the decomposition of the interaction energy with the nearby amino acids, especially for undesired repulsive interactions. In the case of compounds 5a and 5c, which had a smaller residue in position 3 of the quinazolinone core, a significant repulsion was found with Ile1025 and Asp1046, and a low-to-negligible repulsion with Lys868. On the other hand, in the case of compound 5b with a bulkier substituent in position 3 of the quinazolinone, the repulsion with Ile1025 and Asp1046 was almost negligible, but it heavily increased the repulsion with Lys868 and moderately increased that with Glu885. In the case of sorafenib, used as a reference agent, only two minor repulsions were identified—with Lys868 (+0.67 kcal/mol) and Ile1025 (+0.78 kcal/mol).
2.5. Density Functional Theory (DFT)
In drug design, the electronic properties of newly synthesized compounds play a critical role in determining their chemical reactivity, stability, and potential interactions with biological targets. Among these properties, the energies of the highest occupied molecular orbital (HOMO) and lowest unoccupied molecular orbital (LUMO) are of particular importance. Evaluating the HOMO and LUMO energies of candidate molecules offers valuable predictive information for their pharmacological potential, guiding SAR studies and optimizing lead compounds for therapeutic use. Additionally, the choice of solvent can significantly influence HOMO and LUMO energies by altering the electronic environment through solvation effects, polarization, and stabilization of specific molecular orbitals [38,39].
The HOMO and LUMO energies of compounds 5a–c were evaluated under four dielectric environments—a vacuum, a nonpolar solvent (ε = 7.43), a polar solvent (ε = 37.22), and water—to assess the influence of solvation on their electronic structures (Table 4).
Table 4.
The energy levels of the frontier molecular orbitals (eV).
For all three compounds, the HOMO energies showed consistent and modest stabilization as solvent polarity increased. For compound 5a, the HOMO shifted from –6.18 eV in the vacuum to −6.28 eV in water, and compounds 5b and 5c displayed similar trends (−6.19 to −6.26 eV and −6.15 to −6.27 eV, respectively). These shifts, although small (≤0.12 eV), indicated dielectric screening by the solvent, which stabilized the electron-rich frontier orbital.
The LUMO energies also exhibited minor solvent-dependent changes. For compound 5a, the LUMO increased slightly from −1.82 eV (vacuum) to −1.75 eV (water), suggesting weak destabilization with rising polarity. Compounds 5b and 5c showed analogous patterns, with LUMO values varying within ~0.09 eV across all conditions. Importantly, the absence of abrupt changes or anomalies implied that solvation effects were uniform and predictable for this compound series.
The HOMO–LUMO gaps remained narrow and stable, ranging from ~4.43 to 4.53 eV, regardless of the solvent environment. This invariance suggests that the electronic reactivity, redox potential, and overall stability of these molecules were largely unaffected by dielectric constant—an advantageous property for potential pharmaceutical applications, where compounds encounter diverse environments (e.g., hydrophobic binding pockets versus aqueous environment). The slight stabilization of the HOMO levels likely arose from nonspecific dielectric polarization rather than strong solute–solvent interactions such as hydrogen bonding.
In all 5a–c compounds, HOMO was found over the quinazolinone region of the compounds, while LUMO was found over the salicylamide region of the compounds (Figures S15–S20 from Supplementary Materials). The distribution of the electrons across the molecules was similar across compounds 5a–c, with electron-rich regions near oxygen atoms, with these electrons able to participate in hydrogen bonding as acceptors or nucleophilic interactions, while electron-deficient regions appeared around amide hydrogen atoms, indicating a potential site for an electrophilic attack or hydrogen-bond donation. The predominance of green across the aromatic rings suggested a largely nonpolar, hydrophobic character in these areas, which might favor π–π stacking, π–cation interactions, or van der Waals interactions, important types of noncovalent interactions with biological targets [40,41,42] (Figures S21–S23 from Supplementary Materials). Overall, the molecular electrostatic potential (MEP) map suggests a molecule with localized polar sites suitable for specific binding interactions, combined with extensive hydrophobic surfaces that could stabilize binding within nonpolar pockets of a receptor or enzyme. This distribution supported the balance of polarity and lipophilicity inferred from the LogP and TPSA values, reinforcing the compound’s potential as a drug-like candidate.
The obtained results demonstrated that compounds 5a–c maintained robust electronic characteristics across media of varying polarity. This electronic resilience supported their candidacy as drug-like molecules, as their electronic properties—and thus, their reactivity and potential biological interactions—were unlikely to fluctuate significantly under physiological conditions.
The conformations that represent the HOMO and the LUMO parameters for each compound, as well as an electrostatic potential map of them, are presented in the Supplementary Materials (Figures S13–S21).
Some important molecular properties were computed and are presented in Table 5. The molecular surface area and volume followed a similar trend, with compound 5b exhibiting the largest values (438.03 Å2 and 425.95 Å3), implying a bulkier structure that could influence steric fit in biological targets.
Table 5.
Some molecular descriptors important for compounds 5a–c.
Notably, compound 5c showed the highest dipole moment (2.60 D), indicating increased polarity that might enhance specific interactions with polar residues at a binding site.
Together with the frontier orbital data, these parameters suggested that compound 5b could prefer hydrophobic regions, compound 5a had an intermediate profile, while compound 5c might benefit from stronger electrostatic interactions due to its higher dipole moment.
These combined electronic and physicochemical characteristics were essential for predicting pharmacokinetic behavior and target engagement, reinforcing the potential of compounds 5a–c as drug-like candidates with distinct yet complementary properties.
2.6. Cytotoxicity Assay
The cytotoxic effects of 5a–c were evaluated on normal fibroblast cells (BJ) and against one cancer cell line, human hepatocellular carcinoma (HepG2), at 48 h after cell exposure. Sorafenib was used as a reference agent. The IC50 values (μM) and the selectivity index (SI) are presented in Table 6. The relative cell viability (%) is depicted in Figure 17.
Table 6.
Calculated IC50 values (μM) at 48 h after exposure of the human normal foreskin fibroblasts (BJ) and human hepatocellular carcinoma (HepG2) to 5a–c and sorafenib, and the selectivity indexes (SI).
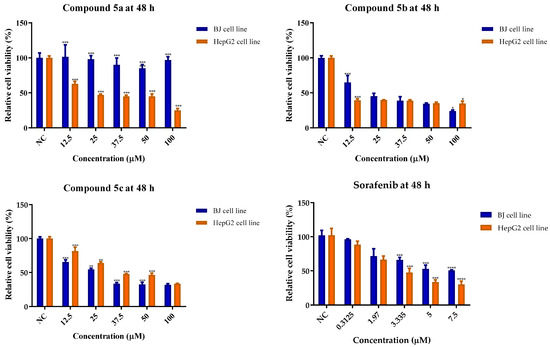
Figure 17.
The cytotoxic effects of 5a–c and sorafenib on BJ and against HepG2 cells, after 48 h of cell exposure. The results are presented as relative means ± standard deviations (SD) of three biological replicates (six technical replicates for each biological replicate). Viability data are expressed as relative values, where the negative control (NC) was set at 100%. * p < 0.05, ** p < 0.01, and *** p < 0.001, **** p < 0.0001, compared to the negative control (NC) group.
Concerning the BJ cell line, no IC50 value could be calculated in the range of tested concentrations for the 5a compound. It could be considered less cytotoxic or non-cytotoxic on this cell line. The second compound, 5b, had the lowest IC50 value, exhibiting moderate cytotoxicity and affecting the BJ cells less than sorafenib. The third compound, 5c, was less harmful to healthy cells than 5b and the positive standard, also indicating a moderate cytotoxicity effect.
As in the previous case, the IC50 values corresponding to 5a could not be determined based on the results obtained on the HepG2 cell line. This could indicate that it might not possess antitumor activity against hepatocellular carcinoma. Compound 5b exhibited the highest potency against HepG2 cells, but did not have better IC50 values than sorafenib. Compound 5c showed less cytotoxic potential than 5b and sorafenib. Both 5b and 5c exhibited antitumor activity against the HepG2 cell line, demonstrating higher cytotoxicity compared to 5a, as indicated by the IC50 values.
Sorafenib, the reference agent, was more cytotoxic on both BJ and HepG2 cell lines than the synthesized compounds. Its antitumoral activity on HepG2 cells is well-documented in the literature, and it is used as a first-line treatment for hepatocellular carcinoma [43].
The obtained SI values for compounds 5b and 5c were superior to that for sorafenib. Neither of them was greater than 2, which is considered suitable in the literature [30].
Regarding the relative cell viability values after 48 h of cell exposure, compound 5a had lower cytotoxicity on the BJ cell line at all tested concentrations, and had a better profile than sorafenib. Compound 5b decreased the cell viability by more than 50%, especially at concentrations over 25 µM, but reduced the viability values by more than 35% at concentrations higher than 50 and 100 µM. The obtained results for 5c were significantly unfavorable over 37.5 µM. Sorafenib did not reduce relative cell viability by more than 50% at any of the tested concentrations.
With regard to cellular viability on the HepG2 line, compound 5a affected it by at least 50% starting from a concentration of 25 µM, but was not as potent as sorafenib at 5 µM. Compound 5b influenced viability by more than 50% over a concentration of 12.5 µM; while it was not superior to sorafenib, it was the most active compound against this cell line. Compound 5c led to an important reduction in cell viability over a concentration of 37.5 µM, being less active on HepG2 cells. Sorafenib showed cell viability levels below 50% at concentrations exceeding 5 µM.
In the context of evaluating antitumor activity on the HepG2 cell line, structure–activity relationship (SAR) analysis revealed that the introduction of an aliphatic substituent (5a, R = allyl, or 5c, R = ethyl) in the third position of the quinazolin-4-one scaffold had an unfavorable impact on cytotoxicity. In contrast, replacement with a bulkier substituent (5b, R = benzyl) in the same position led to increased cytotoxicity. All the tested compounds had a thioether and a ketone group in the second position of the quinazolin-4-one heterocycle, which was included in a linker, and continued with a salicylamide moiety [5,6,16].
The unsaturated aliphatic substituent in position 3 (compound 5a, R = -H2C-CH=CH2, a derivative from garlic essential oil known to have antitumor properties [44], and more reactive than ethyl due to the alkene`s presence) exhibited no cytotoxic effects on BJ cells, and did not have the highest potency against the HepG2 cell line. Cytotoxicity was notably influenced by the presence of the benzyl residue in position 3 (compound 5b, R = -H2C-C6H5, an aromatic moiety with higher flexibility than phenyl), for both cell lines. A saturated aliphatic fragment in position 3 (compound 5c, R = -H2C-CH3) showed moderate cytotoxic effects on BJ cells compared to the benzyl residue, and higher cytotoxic effects than the allyl fragment. Against HepG2 cells, the effect of the ethyl residue was superior to that of allyl, but inferior to that of benzyl residue.
2.7. ADME Studies
2.7.1. In Silico
In silico models assess a drug’s “drug-likeness” and pharmacokinetic profile, providing insights into its potential bioavailability, metabolic stability, and ability to reach its target [45].
The computed in silico physicochemical descriptors for compounds 5a–c are shown in Table 7. Each compound had a molecular weight between 383.09 and 445.11 g/mol. All three compounds had six or seven rotatable bonds, seven hydrogen bond acceptors, and three hydrogen bond donors. The value of the topological polar surface area (TPSA) was 115.28 Å in all three cases. Additionally, the logP value for each compound was between 2.419 and 3.14, and the logS value was between −4.313 and −4.036. None of the compounds had violations of Lipinski’s rule of five (MW ≤ 500, logP ≤ 5, No. HA ≤ 10, and No. HD ≤ 5) [2,19,27,28].
Table 7.
The computed in silico physicochemical descriptors for compounds 5a–c.
In silico pharmacokinetic (absorption, distribution, metabolism, and elimination) descriptors are presented in Table 8. The Caco-2 permeability log values for all compounds ranged from −5.467 to −5.380. None of the compounds were predicted to be P-gp substrates or to cross the blood–brain barrier (BBB), but a high plasma protein-binding (PPB) potential was predicted, between 97.9 and 98.7%. The computed metabolization descriptors indicated that all compounds were highly predicted to be CYP2C19 inhibitors. A similar finding was observed for CYP2C9 inhibition, except for compound 5a, which exhibited a lower probability compared to compounds 5b and 5c. Moreover, compounds 5a and 5c were found to have a moderate probability of being CYP3A4 inhibitors. No compounds were found to be CYP2D6 inhibitors. Promising human liver microsomal (HLM) stability was predicted only for compound 5c. The plasma clearance of all three compounds ranged from 4.109 to 4.889 mL/min/kg, while their half-lives was between 0.474 and 0.529 h.
Table 8.
The computed in silico pharmacokinetic descriptors for compounds 5a–c.
All compounds were predicted to have good druggability properties since they had no violations of Lipinski’s rule of five. The grafted substituents (allyl for 5a, benzyl for 5b, and ethyl for 5c) did not influence the No. HA or No. HD descriptors. The topological polar surface area (TPSA) values were similar for all three molecules (115.28 Å2), suggesting comparable hydrogen-bonding capacities and membrane permeability. However, ethyl substitution decreased the No. RB, logP, and MW values, while benzyl substitution increased them. Despite its lower lipophilicity, compound 5c could be involved in strengthening electrostatic interactions, as our analysis indicated that it has a higher dipole moment.
The pharmacokinetic profile of the proposed compounds was characterized using specific descriptors for all four phases of pharmacokinetics. Concerning absorption, compounds 5a–c were predicted to be poorly absorbed from the gastrointestinal tract, since they were predicted to have low Caco-2 permeability (log value lower than −5.150), and they were not predicted to be P-gp substrates [46]. Additionally, the predicted low absorption is also supported by the values of logS, which indicate that these compounds are only slightly soluble or insoluble in water [47].
Compounds 5a–c were predicted to alter the metabolism of other drugs by inhibiting the most prevalent CYP450 isoenzymes in metabolic processes, specifically CYP3A4, 2C19, and 2C9. A noticeable distinction between the compounds was observed in the case of the HLM stability descriptor. Compound 5c was the only one predicted to have higher metabolic stability, surpassing the threshold of 30 min, when metabolized by HLM.
Based on the predicted plasma clearance values, all three compounds appeared to have low clearance (<5 mL/min/kg). The predicted half-life values suggested that all three compounds may be drugs with intermediate ultra-short half-lives (under 1 h).
2.7.2. In Vitro Lipophilicity
Lipophilicity is an essential physicochemical descriptor, correlated with both pharmacodynamic and pharmacokinetic properties. It significantly influences membrane permeability, binding to plasma proteins, and interaction with receptors at the active site of action. Therefore, it is considered a key parameter in predicting the biological activity of pharmaceutical compounds. From a physicochemical perspective, lipophilicity is expressed by the logarithmic distribution coefficient between n-octanol and water (logP) [48].
The experimental determination of lipophilicity was carried out using two types of chromatography: reverse-phase thin-layer chromatography (RP-TLC) and reverse-phase high-performance liquid chromatography (RP-HPLC). The values of the retention parameters Rf and RM at five different concentrations of isopropanol–water (v:v %) for compounds 5a–c are presented in Table 9.
Table 9.
The values of the retention parameters Rf and RM for compounds 5a–c.
The results obtained for the retention parameters (mRM and RM0) and for the regression line parameters (RM = f(c)), achieved through RP-TLC, along with the values for the capacity factor log k, acquired via RP-HPLC, are presented in Table 10.
Table 10.
The values of mRM, RM0, b, R2, and log k for compounds 5a–c.
Starting from the hypothesis that a compound with higher lipophilicity has a greater affinity for the non-polar stationary phase, its profile is characterized by the exhibition of lower Rf values and, consequently, higher RM values. The organic modifier used to change the polar mobile phase was isopropanol. It was employed to give a hydrophobic nature to the studied compounds by accelerating the elution and reducing their retention at the stationary phase. Suitable linear dependence (R2 > 0.93) was achieved by analyzing the graphical representation of RM values, used as a function of the isopropanol concentrations in the mobile phase (Figure 18). Therefore, based on the line equation corresponding to each compound, the lipophilicity parameter RM0 and the slope b were determined (Table 9).
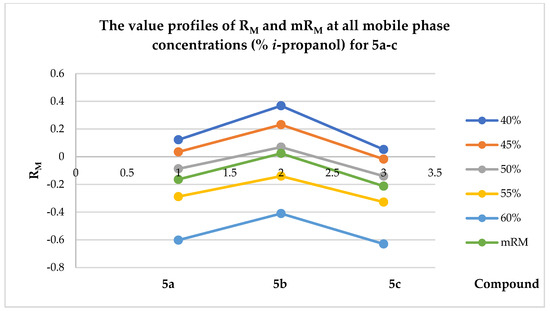
Figure 18.
The graphical interpretation of the values of RM and mRM at all mobile-phase concentrations (% i-propanol) for compounds 5a–c.
As the values of the i-propanol fraction in the mobile-phase composition increased, a decrease in the RM values was observed. Moreover, a similar retention mechanism was highlighted for the quinazolin-4(3H)-one derivatives, as evidenced by a good correlation (R2 > 0.93) between the RM0 values and the slope b. From Figure 18, it is clear that compound 5b was the most lipophilic, while compound 5c was the least lipophilic. These results were correlated with those obtained by in silico evaluation (Table 7), thus exhibiting the same profile of lipophilicity for the tested compounds.
The principal component analysis (PCA) method was applied to the initial dataset, including the RM values for all five applied mobile phases, in order to reduce the large number of variables to those that retain the initial information. Lipophilicity maps were obtained to graphically represent the information obtained from the two principal components (Figure 19). Concerning final compounds 5a–c, the first principal component PC1 accounted for 91.34% of the data variability, while the second principal component PC2 represented an additional 0.16% [49].
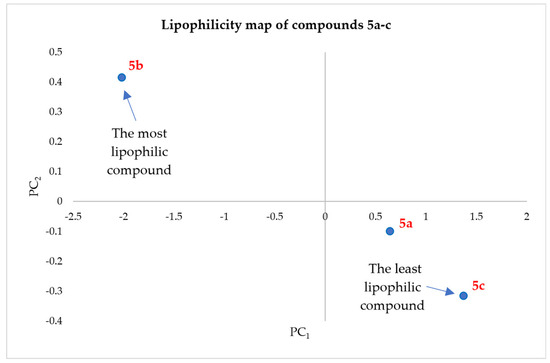
Figure 19.
Lipophilicity map of compounds 5a–c, according to PC1 and PC2 values.
The values of the two parameters PC1 and PC2 for compounds 5a–c are presented in Table 11. A lower value of the PC1 parameter suggests a more lipophilic compound. Through the obtained results, a good linear correlation was established between RM0 and PC1 for the quinazolin-4(3H)-one derivatives 5a–c (R2 = 0.979).
Table 11.
The scores obtained for the first two principal components.
In the case of compounds 5a–c, the most lipophilic compound was 5b, in which the quinazolin-4(3H)-one heterocycle was substituted with a benzyl radical in position 3, and the last lipophilic compound was 5c, in which the quinazolin-4(3H)-one heterocycle was substituted with an ethyl radical in position 3. Both compounds were substituted in position 2 of the heterocycle with the N-thioacetyl-2-hydroxybenzamide residue. Therefore, the lipophilicity was influenced by the substituent from position 3, an aromatic residue such as a benzyl, which is more hydrophobic than an unsaturated aliphatic allyl fragment or a saturated aliphatic ethyl moiety.
The log k parameter was calculated for compounds 5a–c using the retention time values determined by the RP-HPLC method, and the results are presented in Table 9 [49].
The highest retention time values were recorded for compound 5b, which contains a benzyl moiety in position 3 of the quinazolin-4(3H)-one heterocycle, and the lowest values were recorded for compound 5c, which holds an ethyl residue in the same position.
The results obtained by RP-HPLC were consistent with those obtained by the RP-TLC method. For final compounds 5a–c, values of lipophilicity followed the obtained values for the LogP parameter on the ADMETlab 3.0 online platform [50]. Both applied calculation methods showed that the lowest values of the lipophilicity parameters were obtained for compound 5c, and the highest values for compound 5b.
The correlation between the experimental and theoretical values of the lipophilicity parameters was analyzed for compounds 5a–c (Table 12).
Table 12.
Correlation coefficient values (R2) between experimental (mRM, RM0, PC1, log k) and theoretical values of lipophilicity parameter (logP) for compounds 5a–c.
The calculated correlation coefficients ranged from −0.97 to 0.99. The correlation between the obtained in silico logP values and the experimentally determined lipophilicity parameters was in the range of −0.99 to 0.99. A high correlation was found between the experimentally examined parameters RM0 and PC1 (0.97). Additionally, the values of the correlation coefficients between log k, obtained by RP-HPLC determinations, and mRM, RM0, and PC1, determined by the RP-TLC method, are 0.99, −0.98, and −0.99, respectively.
3. Materials and Methods
3.1. Chemical Synthesis
For the chemical synthesis, purification, structural analysis, and in vitro cytotoxicity evaluation, reagents were purchased from local suppliers and Merck KGaA (Darmstadt, Germany), and used according to the instructions.
Analytical thin-layer chromatography (TLC) was performed on Silica Gel 60 F254 sheets to monitor the reaction progress and to verify the purity of the tested compounds. The elution system employed was a mixture of ethyl acetate and n-hexane in a 3:1 ratio. The visualization was carried out with UV light at 254 nm.
Based on the glass capillarity method, melting points were measured using a melting point device MPM-H1 (Schorpp Gerätetechnik, Überlingen, Germany).
The structures of compounds 5a–c were confirmed by recording and examining the IR, MS, 1H-NMR, and 13C-NMR spectra. The IR spectra were recorded with an FT/IR 6100 spectrometer (Jasco, Cremella, Italy) using KBr pellets. To record the MS spectra, an Agilent Ion Trap SL mass spectrometer instrument (Agilent Technologies, Santa Clara, CA, USA) was used in positive ionization mode for final compounds 5a–c. 1H-NMR and 13C-NMR spectra, operating at 500 MHz and 125 MHz, were recorded using an Avance NMR spectrometer (Bruker, Karlsruhe, Germany) in dimethylsulfoxide-d6 (DMSO-d6), and calibration of the spectrometer was carried out using tetramethylsilane (TMS). The chemical shift (δ) values are described in parts per million (ppm). The following abbreviations for peak patterns were used to identify the multiplicity of the signals in the 1H-NMR spectra: s—singlet, d—doublet, dd—doublet, td—triplet of doublets, and m—multiplet. For the signals given by the hydrogen or carbon atoms, to describe the location of the atom in a specific region of the molecule, the following abbreviations are used: Q—quinazolin-4(3H)-one and Ar—hydroxybenzamide ring.
General procedure for the synthesis of intermediate compounds 3a–c
Compounds 3a–c were synthesized using a protocol previously reported by our group and presented in Scheme 1 [27,28].
General procedure for the synthesis of final compounds 5a–c
In a glass flask, 3 mmol of compounds 2a–c and 2 mmol of potassium carbonate were added to 5 mL of dimethylformamide (DMF). The mixture was stirred at room temperature (RT) for 2 h. A total of 3 mmol of 5-(2-bromoacetyl)-2-hydroxybenzamide was added. The mixture was stirred at room temperature for 4–6 h until TLC indicated total consumption of intermediate compounds 3a–c. The resulting precipitate was obtained by pouring water on it and neutralizing it with a 10% hydrochloric acid solution. Final compounds 5a–c were filtered under vacuum conditions, dried, and crystallized from dioxane.
The structural assignments of 5a–c were determined using their IR, MS, 1H-NMR, and 13C-NMR spectral data.
5-(2-((3-allyl-4-oxo-3,4-dihydroquinazolin-2-yl)thio)acetyl)-2-hydroxybenzamide (5a): white solid; mp = 227 °C; yield = 78%; FT IR (KBr) νmaxcm−1: 1688.37, 1678.73, 1659.45 (str C=O), 1618.95 (N-H), 1550.49 (C=N), 1319.07 (Ar-OH), 1209.63 (C-N); MS: m/z = 396.30 [M+H+]; 1H-NMR (DMSO-d6, 500 MHz) δ: 8.76 (d, 2H, Ar-CONH2, 2JH-H = 2.00 Hz), 8.14 (dd, 2H, H-2, H-6, Ar, 1JH-H = 8.50 Hz, 2JH-H = 2.50 Hz), 8.04 (dd, 1H, H-5, Q, 1J = 8.00 Hz, 1JH-H = 1.00 Hz), 7.67 (td, 1H, H-6, Q, 1JH-H = 7.75 Hz, 1JH-H = 1.75 Hz), 7.39 (td, 1H, H-7, Q, 1JH-H = 7.75 Hz, 1JH-H = 2.50 Hz), 7.06 (d, 1H, H-3, Ar, 1JH-H = 9.00 Hz), 7.03 (d, 1H, H-8, Q, 1JH-H = 8.00 Hz), 6.02–5.94 (m, 1H, -CH=), 5.26 (dd, 1H, =CH2, 1JH-H = 10.25 Hz, 1JH-H = 1.25 Hz), 5.17 (dd, 1H, =CH2, 1JH-H = 17.00, 1JH-H = 1.00 Hz), 4.85 (s, 2H, -CH2-), 4.78 (d, 2H, -CH2-, 2JH-H = 5.50 Hz); 13C-NMR (DMSO-d6, 125 MHz) δ: 191.38 (C=O), 171.54 (C=O), 165.44 (Ar-OH), 160.17 (C=O), 156.14 (C=N), 146.51 (Q), 134.69 (Ar), 134.05 (Q), 131.30 (-CH=), 129.84 (Ar), 127.40 (Ar), 126.44 (Q), 125.92 (Q), 125.44 (Q), 118.53 (=CH2), 117.93 (Q), 117.51 (Q), 113.96 (Ar), 46.02 (-CH2-), 38.51 (-CH2-).
5-(2-((3-benzyl-4-oxo-3,4-dihydroquinazolin-2-yl)thio)acetyl)-2-hydroxybenzamide (5b): white solid; mp = 267 °C; yield = 72%; FT IR (KBr) νmaxcm−1: 1685.48, 1661.37, 1607.86 (str C=O), 1618.95 (N-H), 1547.59 (C=N), 1319.07 (Ar-OH), 1206.26 (C-N); MS: m/z = 446.30 [M+H+]; 1H-NMR (DMSO-d6, 500 MHz) δ: 8.76 (d, 2H, Ar-CONH2, 2JH-H = 2.00 Hz), 8.13 (dd, 2H, H-2, H-6, Ar, 1JH-H = 8.75 Hz, 2JH-H = 1.75 Hz), 8.07 (dd, 1H, H-5, Q, 1JH-H = 8.00 Hz, 1JH-H = 1.00 Hz), 7.69 (td, 1H, H-6, Q, 1JH-H = 7.50 Hz, 2JH-H = 1.75 Hz), 7.41 (td, 1H, H-7, Q, 1JH-H = 7.75 Hz, 2JH-H = 1.00 Hz), 7.38–7.27 (m, 5H, Bz), 7.05 (t, 2H, H-8, Q, 1JH-H = 8.50 Hz), 5.40 (s, 2H, =CH2), 4.85 (s, 2H, -CH2-); 13C-NMR (DMSO-d6, 125 MHz) δ: 191.32 (C=O), 171.54 (C=O), 165.44 (Ar-OH), 160.68 (C=O), 156.36 (C=N), 146.52 (Q), 134.58 (Bz), 134.82 (Ar), 134.04 (Q), 129.82 (Ar), 128.54 (Bz), 127.42 (Ar), 127.37 (Bz), 126.78 (Bz), 126.56 (Q), 126.01 (Q), 125.47 (Q), 118.53 (Bz), 117.91 (Q), 113.93 (Ar), 47.13 (-CH2-), 38.55 (-CH2-).
5-(2-((3-ethyl-4-oxo-3,4-dihydroquinazolin-2-yl)thio)acetyl)-2-hydroxybenzamide (5c): white solid; mp = 236 °C; yield = 71%; FT IR (KBr) νmaxcm−1: 1672.95, 1654.62, 1577.49 (str C=O), 1614.61 (N-H), 1552.42 (C=N), 1314.73 (Ar-OH), 1202.88 (C-N); MS: m/z = 384.20 [M+H+]; 1H-NMR (DMSO-d6, 500 MHz) δ: 8.77 (d, 2H, Ar-CONH2, 2JH-H = 2.00 Hz), 8.14 (dd, 2H, H-2, H-6, Ar, 1JH-H = 8.75 Hz, 2JH-H = 2.50 Hz), 8.04 (dd, 1H, H-4, Q, 1JH-H = 8.00 Hz, 2JH-H = 1.00 Hz), 7.66 (td, 1H, H-5, Q, 1JH-H = 7.50 Hz, 2JH-H = 1.50 Hz), 7.39 (td, 1H, H-6, Q, 1JH-H = 7.75, 2JH-H = 1.00 Hz), 7.06 (d, 1H, H-7, Ar, 1JH-H = 8.50 Hz), 7.01 (d, 1H, H-8, Q, 1JH-H = 8.00 Hz), 4.86 (s, 2H, -CH2-), 4.19–4.15 (m, 2H, -CH2-), 1.34 (t, 3H, -CH3, 3JH-H = 7.00 Hz); 13C-NMR (DMSO-d6, 125 MHz) δ: 191.38 (C=O), 171.50 (C=O), 165.49 (Ar-OH), 160.14 (C=O), 155.70 (C=N), 146.49 (Q), 134.55 (Ar), 134.02 (Q), 129.85 (Ar), 127.33 (Ar), 126.31 (Q), 125.92 (Q), 125.83 (Q), 125.37 (Q), 118.66 (Ar), 117.95 (Q), 113.98 (Ar), 39.84 (-CH2-), 38.29 (-CH2-), 13.01 (-CH3).
The spectral data were found to be consistent with the proposed structures of synthesized compounds 5a–c.
All the representative signals were detected in the IR spectra. Three strong C=O stretching signals were found between 1577.49 and 1688.37 cm−1: one from the quinazolin-4(3H)-one heterocycle and two from the 5-thioacetyl-2-hydroxybenzamide residue. The C=N stretching, from the quinazolin-4(3H)-one heterocycle, had a specific signal at 1547.59–1552.42 cm−1. From the 2-hydroxybenzamide fragment, the N-H stretching had a signal at 1614.61–1618.95 cm−1, the Ar-OH stretching had a specific signal at 1314.73–1319.07 cm−1, and the C-N stretching a specific signal at 1202.88–1209.63 cm−1. All the identified signals proved that the chemical synthesis took place successfully.
In the MS spectra of 5a–c, the identified molecular mass peaks were in accordance with the chemical structures.
In the 1H-NMR spectra of 5a–c, all expected proton signals were identified. In the 13C-NMR spectra, the expected signals corresponding to the carbon atoms were identified, and all the signals were observed within the anticipated spectral regions.
Graphic depictions of the recorded IR, MS, 1H-NMR, and 13C-NMR spectra for compounds 5a–c are presented in the Supplementary Materials (Figures S1–S12).
3.2. Molecular Docking
The structure of human VEGFR-2 co-crystallized with sorafenib was taken from the Protein Data Bank (PDB code 4ASD) [51,52]. The processing of the targeted protein was reported in our previous paper, and preparation for molecular docking targeting was carried out using AutoDockTools 1.5.6 [30,53,54].
The molecular docking study targeted the binding site of ATP through inclusion of the co-crystallized sorafenib in the configured search space. The search space was centered on x = −21.966, y = −0.473, and z = −11.442, according to our previously reported protocol. The molecular docking study was performed using AutoDock Vina 1.1.2 as the main software, while AutoDock 4.2 was used as secondary software for confirmation of the results [30,32,53].
The files containing the 3D structures of compounds 5a–c and sorafenib as a reference compound were generated using Avogadro 1.2.0 and processed further using AutoDockTools 1.5.6 [53,55]. Visualization of the conformations resulting from the molecular docking was carried out using UCSF Chimera 1.10.2 [56].
3.3. Molecular Dynamics
For compounds 5a–c, the docking conformation with the highest binding affinity was used to construct chimeric complexes with VEGFR-2, which were subsequently evaluated through molecular dynamics simulations. Simulations were conducted with GROMACS 2024.5 by employing the CHARMM36 force field and TIP4P water model in an orthorhombic box [57,58,59]. Ligand topologies were generated using CGenFF, and system preparation—comprising solvation, counterion neutralization, and energy minimization—following established protocols [60,61].
Each complex was simulated for 200 ns to assess structural stability and conformational dynamics. Calculations were performed on a Debian Linux 12 system equipped with an AMD Ryzen™ 9 7900 CPU and an NVIDIA RTX 3060 GPU with CUDA 12.8. The trajectory analyses were visualized using VMD 1.9.4, and analysis parameters were computed using the GROMACS built-in functions [62].
3.4. Molecular Mechanics–Poisson–Boltzmann Surface Area (MM-PBSA)
The free binding energies for ligands 5a–c and sorafenib with VEGFR-2 were estimated using the Molecular Mechanics–Poisson–Boltzmann Surface Area (MM-PBSA) method, carried out with gmx_MMPBSA, following procedures previously described by our group [30,63]. The evaluation was made in the last 200 ns of each molecular dynamics simulation, equivalent to 20.000 frames. To clarify the energetic contributions of individual amino acids within 5 Å of the ligand, an energy decomposition analysis was conducted. The binding free energy between the ligand and VEGFR-2 was then determined using the following relationship [64,65]:
ΔG_binding = G_complex − (G_protein + G_ligand),
3.5. Density Functional Theory (DFT)
The DFT in silico calculations were performed with the B3LYP-D3 functional method and the 6-311G(2d,p) basis set using Spartan 24 1.1.0 (Wavefunction, Inc., Irvine, CA, USA) to investigate the electronic and structural characteristics of compounds 5a–c. The calculations were performed to identify the regions of the molecules that are important for their interaction with VEGFR-2 according to their electron density, frontier molecular orbitals, and dipole moment.
3.6. Cytotoxicity Assay
Compounds 5a–c were dissolved in dimethylsulfoxide (DMSO) at an initial concentration of 10 mM, which was diluted 10 times with the characteristic medium and placed on plates at final concentrations ranging from 12.5 to 150 μM. The cells were seeded on plates of 96 wells at a density of 1 × 10⁴ cells per well and incubated for 48 h. The culture medium was removed, and then 100 µL MTT (3-(4,5-dimethylthiazol-2-yl)-2,5-diphenyltetrazolium bromide) was added for 1 h. After that, it was removed, and 150 µL of pure dimethylsulfoxide (DMSO) was added. The samples were read using an ELISA Reader (BioTek, Winooski, VT, USA) at 570 nm. Sorafenib was used as a reference agent at concentrations ranging from 0.03125 to 7.5 μM. All determinations were made in triplicate [66].
The half-maximal inhibitory concentration (IC50) values were calculated to evaluate the potency of compounds 5a–c by fitting the investigational data with a 4-parameter logistic curve to obtain the dose-effect curves. The experimental IC50 results are expressed as mean values ± standard deviation (SD) of the three biological replicates.
Two-way analysis of variance (ANOVA) with a post hoc Bonferroni test was used to statistically examine the relative cell viability (%), compared to the negative control (NC), which was 100%. Data were analyzed using the PRISM 5 software (GraphPad Prism 8.0.2. Software, La Jolla, CA, USA). In terms of statistical analysis, the results were considered different at values of p < 0.05 or p < 0.001.
The selectivity index (SI) was used as a parameter to determine how many times more cytotoxic the investigated compounds were by exposing them to normal and cancer cells. It was calculated using the IC50 value ratio between the BJ cell line and the HepG2 cell line. Results that are greater than 2 are considered suitable, as reported in the literature [30].
3.7. ADME Studies
3.7.1. In Silico
An in silico molecular simulation technique was employed in the drug design of compounds 5a–c, aiming to identify which compounds comply with several rules and properties to become drug candidates. The physicochemical and pharmacokinetic (PK) profiles of compounds 5a–c were predicted using the ADMETlab 3.0 online platform [50]. The desired compounds were converted into SMILES format and introduced into the platform for the simultaneous prediction of all three compounds.
The considered physicochemical descriptors included the molecular weight (MW, g/mol), number of rotatable bonds (No. RB), number of hydrogen bond acceptors (No. HA), number of hydrogen bond donors (No. HD), topological polar surface area (TPSA, Å), octanol–water partition coefficient (logP), logarithm of aqueous solubility (logS), and the number of violations of Lipinski’s rule of five. These are key properties involved in assessing the drug-likeness of the desired compounds [2,19,27,28].
The selected pharmacokinetic descriptors included Caco-2 permeability and P-glycoprotein (P-gp) substrate probability for absorption; blood–brain barrier (BBB) permeability and plasma protein binding (PPB, %) for distribution; the likelihood of cytochrome P450 (CYP) 2C19, CYP2C9, CYP2D6, and CYP3A4 inhibition as well as human liver microsomal (HLM) stability for metabolism; and plasma clearance (Cl plasma, mL/min/kg) and half-life (T1/2, hours) for elimination [19].
3.7.2. In Vitro Lipophilicity
The lipophilic properties of the three quinazoline-4(3H)-one derivatives (5a–c) were determined using an experimental assay and theoretical methods. The reagents and solvents utilized were purchased from authorized distributors [49].
The chromatographic performance of compounds 5a–c was investigated by reverse-phase thin-layer chromatography (RP-TLC). Standardized Silica gel 60 RP-18 F254S chromatographic plates (20 × 10 cm, Merck, Darmstadt, Germany) were used as the stationary phase, and an i-propanol–water mixture, in volumetric proportions ranging from 40% to 60% (v/v) i-propanol, was used as the mobile phase. The variance between two successive elution mixtures was 5%.
Solutions containing 1 mg/mL of compounds 5a–c were prepared in dimethylsulfoxide (DMSO). A volume equal to 2 μL of each sample was manually applied using chromatographic capillary micropipettes, at a distance of 10 mm from the lower side of the plates and 10 mm from their lateral sides. The gap between two successive spots was 10 mm.
The development process was carried out at room temperature using a chromatographic chamber pre-saturated for 30 min with mobile-phase vapors. The migration distance of the mobile phase was 80 mm for all concentrations used, and it was determined manually by calculating the retention factor Rf; thus, Rf = migration distance of the compound/migration distance of the mobile phase. Rf values were calculated for each tested compound at all five concentrations of the mobile phase.
The spots were visualized under UV light at a wavelength of 254 nm.
Starting from the Rf values determined by RP-TLC, a series of lipophilicity parameters was calculated. Therefore, based on the Bate-Smith and Westall equation, the logarithmic RM values were obtained [67]:
RM = log [1/Rf−1]
Based on the linear relationship between the RM value and the concentration of the organic solvent in the mobile phase [c], using the linear regression equation and the Soczewinski–Wachtmeister model (where b = slope of the line and c = concentration of organic modifier), the values of another lipophilicity parameter, RM0, were determined by extrapolating the RM values to 0% organic modifier [68]:
RM = RM0 + b[c]
The arithmetic mean of the lipophilicity parameter RM values, corresponding to a series of concentrations of the organic modifier in the mobile phase, was determined. Therefore, the mRM lipophilicity parameter was obtained.
Applying principal component analysis (PCA, XL-STAT) to the lipophilicity parameter RM, new lipophilicity parameters represented by the principal components (PCs) were obtained [69,70].
Starting from the experimentally determined Rf values, the RM logarithmic values were calculated. Consequently, the presence of minor errors in determining the Rf values can generate errors in calculating the RM values. By analyzing the principal components, the errors in estimating the RM0 values are eliminated through extrapolation, thereby providing more precise results.
The chromatographic behavior of compounds 5a–c was also examined by high-performance liquid chromatography coupled with mass spectrometry (HPLC-MS). The analyses were conducted using an Agilent 1100 series HPLC system (binary pump, autosampler, thermostat, UV detector, Agilent Technologies, USA) coupled to a Bruker Ion Trap SL system (Bruker Daltonics GmbH). Chromatographic separation was completed using a Zorbax SB-C18 column (50 mm × 2.1 mm i.d., 3.5 μm, Agilent Technologies). The mobile phase consisted of a mixture of water with 0.1% (v/v) acetic acid and acetonitrile. The elution gradient started at 15% acetonitrile and increased to 95% within 5 min. The flow rate was 0.6 mL/min, and the thermostat was set at 45 °C. UV detection was performed at 242 nm. Based on the retention times obtained, the capacity factor k was calculated using formula 3, where tR = retention time of the compound and t0 = retention time of the solvent:
k = (tR − t0)/t0,
The logarithm of the capacity factor (log k) was used to estimate the lipophilicity of the compounds [71]. The RP-HPLC method has multiple advantages, including low sample requirements, good accuracy of determinations, fast analysis, and high reproducibility [72].
In order to interpret the obtained results, data were correlated with the theoretical logP values, calculated using the ADMETlab 3.0 online platform [50].
4. Conclusions
After a preliminary molecular docking analysis, three 2,3-disubstituted quinazolin-4(3H)-one derivatives (5a–c) were synthesized, starting with anthranilic acid via the nucleophilic addition of isothiocyanate derivatives (2a–c) in alkaline conditions, followed by a cyclization reaction; this yielded intermediates (3a–c), which were then involved in a nucleophilic S-alkylation reaction with 5-(2-bromoacetyl)-2-hydroxybenzamide in an alkaline environment.
Using their recorded IR, MS, 1H-NMR, and 13C-NMR spectral data, structural assignments of these compounds were carried out and confirmed according to the expected values.
By analyzing the preliminary molecular docking study, it was observed that compound 5b had the highest binding affinity for VEGFR-2 (ΔG = −9.3 kcal/mol when using AutoDock Vina, and ΔG = −10.19 kcal/mol when using AutoDock). All compounds showed lower binding affinities for VEGFR-2 compared to sorafenib.
Regarding the study of molecular dynamics, it was found that compounds 5a–c did not destabilize the receptor and could stably bind to it. They formed fewer hydrogen bonds than sorafenib, but exhibited greater mobility compared to it. Compound 5b showed the most promising interaction profile, due to the combination of low RMSD values and moderate hydrogen bonds, although its molecular structure needs to be further optimized to increase the number of bonds and improve their stability and affinity.
Through the MM-PBSA study, using different substituents in position 3 of the quinazolinone heterocycle in the structure of compounds 5a–c, a clear difference was observed after the decomposition of the interaction energy with nearby amino acids, especially for the unwanted repulsive interactions generated at the active site of VEGFR-2, compared to sorafenib.
Through the DFT study, HOMO was found in the quinazolinone heterocycle region of compounds 5a–c, while LUMO was found in the salicylamide fragment region of them. Correspondingly, the distribution of electrons in the molecular structure was similar in compounds 5a–c, with electron-rich regions appearing near the oxygen atoms, which could be involved in nucleophilic interactions or hydrogen acceptor bonds, while electron-deficient regions appeared around the amide hydrogen atoms, with the potential to generate an electrophilic attack or to form hydrogen donor bonds.
Compounds 5a–c were evaluated for their cytotoxic effects on one normal fibroblast cell line (BJ) and against one cancer cell line, human hepatocellular carcinoma (HepG2), after 48 h of cell exposure. Sorafenib was utilized as a reference agent. The results were expressed through IC50 (μM), relative cell viability (%), and selectivity index values. The results of the in vitro assay suggested that 5a was less cytotoxic against BJ cells than sorafenib and the other compounds. Compound 5b displayed the most promising antitumor potential against the HepG2 cell line, being the most cytotoxic, but not in the same manner as sorafenib. Compound 5c exhibited higher cytotoxic effects against BJ cells than compound 5a, but lower than those of compound 5b and sorafenib. Against HepG2 cells, 5c displayed the weakest cytotoxic potential compared to the other tested compounds and the reference agent.
An in silico ADME study was performed on 5a–c compounds using the ADMETlab 3.0 web tool, one of the latest available online prediction platforms. The compounds were characterized through physicochemical and pharmacokinetic descriptors. Based on the results, the screened compounds exhibited good druggability properties, with no violations of Lipinski’s rule of five. However, their predicted pharmacokinetic profile indicated low gastrointestinal absorption, potential to interfere with the metabolism of other drugs, and low clearance, with ultra-short or intermediate half-lives. Also, compound 5c was predicted to have a higher stability when metabolized through HLM.
A variety of lipophilicity parameters (RM, mRM, RM0, PC1, PC2, log k) were determined, derived from the retention factor (Rf) obtained by the RP-TLC method, and the retention time (tR) obtained by the RP-HPLC method. The obtained results from both in vitro methods were consistent with the theoretical logP values, determined using an in silico method.
The most important functional groups noted were the oxygen atom in quinazolinone, the hydroxyl group in the salicylamide fragment, and the hydrophobic substituent, benzyl, found in position 3 of the quinazolinone heterocycle. The most potent compound in this study was 5b. Further studies to optimize its molecular structure by increasing the number of interactions it can have with its target, VEGFR-2, while also modulating its druggability properties, could lead to the development of a HIT or LEAD candidate.
Supplementary Materials
The following supporting information can be downloaded at: https://www.mdpi.com/article/10.3390/molecules30244719/s1, Figure S1: The IR spectrum for compound 5a; Figure S2: The IR spectrum for compound 5b; Figure S3: The IR spectrum for compound 5c; Figure S4: The MS spectrum for compound 5a; Figure S5: The MS spectrum for compound 5b; Figure S6: The MS spectrum for compound 5c; Figure S7: The 1HNMR spectrum for compound 5a; Figure S8: The 1HNMR spectrum for compound 5b; Figure S9: The 1HNMR spectrum for compound 5c; Figure S10: The 13CNMR spectrum for compound 5a; Figure S11: The 13CNMR spectrum for compound 5b; Figure S12: The 13CNMR spectrum for compound 5c. Figure S13: The top superposing binding conformation of compound 5a and sorafenib at the ATP-binding site of VEGFR-2 (carbon atoms in magenta for compound 5a and in black for sorafenib, oxygen atoms in red, hydrogen atoms in white, nitrogen atoms in blue, sulfur atom in yellow). Figure S14: The top superposing binding conformation of compound 5c and sorafenib at the ATP-binding site of VEGFR-2 (carbon atoms in magenta for compound 5c and in black for sorafenib, oxygen atoms in red, hydrogen atoms in white, nitrogen atoms in blue, sulfur atom in yellow). Figure S15: The conformation that represents the highest occupied molecular orbital (HOMO) of compound 5a. Figure S16: The conformation that represents the lowest unoccupied molecular orbital (LUMO) of compound 5a. Figure S17: The conformation that represents the highest occupied molecular orbital (HOMO) of compound 5b. Figure S18: The conformation that represents the lowest unoccupied molecular orbital (LUMO) of compound 5b. Figure S19: The conformation that represents the highest occupied molecular orbital (HOMO) of compound 5c. Figure S20: The conformation that represents the lowest unoccupied molecular orbital (LUMO) of compound 5c. Figure S21: A molecular electrostatic potential (MEP) map of compound 5a. Figure S22: A molecular electrostatic potential (MEP) map of compound 5b. Figure S23: A molecular electrostatic potential (MEP) map of compound 5c. Table S1. The number of hydrogen bonds between the studied compounds 5a–c, sorafenib, and VEGFR-2 calculated every 10 ns.
Author Contributions
Conceptualization, R.P., G.M. and O.O.; methodology, R.P., B.T., G.M., C.T. and O.O.; software, R.P., G.M., C.T., A.P., L.V. and D.U.; validation, R.P., G.M., B.T., I.I., C.T., A.P., L.V. and O.O.; formal analysis, R.P., G.M., C.T., A.P., L.V. and D.U.; investigation, R.P., G.M., C.T., O.M.D., A.P. and L.V.; resources, R.P., G.M., B.T., C.T., A.P., L.V. and D.U.; data curation, R.P., G.M., C.T., A.P., L.V. and D.U.; writing—original draft preparation, R.P., G.M., B.T., I.I., A.S., C.M., C.T. and D.U.; writing—review and editing, R.P., G.M., B.T., I.I., A.S., C.M., C.T., O.M.D. and O.O.; visualization, R.P., G.M., B.T. and O.O.; supervision, O.O.; project administration, R.P., G.M. and O.O.; funding acquisition, R.P. and A.P. All authors have read and agreed to the published version of the manuscript.
Funding
This research was funded by “Iuliu Haţieganu” University of Medicine and Pharmacy Cluj–Napoca, Romania, through PCD grant numbers 2461/54/17.01.2020, 1033/50/13.01.2021, and 771/54/11.01.2023, and by the “Nucleu” Programme within the National Research, Development and Innovation Plan 2022–2027, Romania, with the support of MEC, project no. 27N/03.01.2023, component project code PN 23 24 01 05.
Institutional Review Board Statement
Not applicable.
Informed Consent Statement
Not applicable.
Data Availability Statement
Data is contained within the article or Supplementary Materials.
Conflicts of Interest
The authors declare no conflicts of interest.
References
- Kinsey, E.; Lee, H.M. Management of Hepatocellular Carcinoma in 2024: The Multidisciplinary Paradigm in an Evolving Treatment Landscape. Cancers 2024, 16, 666. [Google Scholar] [CrossRef]
- Ferrante, N.D.; Pillai, A.; Signal, A.G. Update on the Diagnosis and Treatment of Hepatocellular Carcinoma. Gastroenterol. Hepatol. 2020, 16, 506–516. [Google Scholar]
- Yang, C.; Qin, S. Apatinib Targets Both Tumor and Endothelial Cells in Hepatocellular Carcinoma. Cancer Med. 2018, 7, 4570–4583. [Google Scholar] [CrossRef] [PubMed]
- Mohsen, H.T.A.; Abdullaziz, M.A.; El Kerdawy, A.M.; Ragab, F.A.F.; Flanagan, K.J.; Mahmoud, A.E.E.; Ali, M.M.; El Diwani, H.I.; Senge, M.O. Targeting Receptor Tyrosine Kinase VEGFR-2 in Hepatocellular Cancer: Rational Design, Synthesis and Biological Evaluation of 1, 2-Disubstituted Benzimidazoles. Molecules 2020, 25, 770. [Google Scholar] [CrossRef]
- Mahdy, H.A.; Ibrahim, M.K.; Metwaly, A.M.; Belal, A.; Mehany, A.B.M.; El-Gamal, K.M.A.; El-Sharkawy, A.; Elhendawy, M.A.; Radwan, M.M.; Elsohly, M.A.; et al. Design, Synthesis, Molecular Modeling, in Vivo Studies and Anticancer Evaluation of Quinazolin-4(3H)-One Derivatives as Potential VEGFR-2 Inhibitors and Apoptosis Inducers. Bioorg. Chem. 2020, 94, 103422. [Google Scholar] [CrossRef]
- Eissa, I.H.; El-Helby, A.-G.A.; Mahdy, H.A.; Khalifa, M.M.; Elnagar, H.A.; Mehany, A.B.M.; Metwaly, A.M.; Elhendawy, M.A.; Radwan, M.M.; ElSohly, M.A.; et al. Discovery of New Quinazolin-4(3H)-Ones as VEGFR-2 Inhibitors: Design, Synthesis, and Anti-Proliferative Evaluation. Bioorg. Chem. 2020, 105, 104380. [Google Scholar] [CrossRef]
- Wang, L.; Chen, M.; Ran, X.; Tang, H.; Cao, D. Sorafenib-Based Drug Delivery Systems: Applications and Perspectives. Polymers 2023, 15, 2638. [Google Scholar] [CrossRef]
- Coman, F.; Mbaveng, A.; Marc, G.; Leonte, D.; Brém, B.; Vlase, L. Heterocycles 47. Synthesis, Characterization And Biological Evaluation Of Some New Thiazole Aurones As Antiproliferative Agents. Farmacia 2020, 68, 492–506. [Google Scholar] [CrossRef]
- Bădiceanu, C.; Nuţă, D.; Missir, A.-V.; Hrubaru, M.; Limban, C. Synthesis And Characterization Of New 2-(2-Thienyl)-5-Aryl-1,3,4-Oxadiazoles. Farmacia 2018, 66, 553–557. [Google Scholar] [CrossRef]
- Mic, M.; Pîrnău, A.; Floare, C.G.; Borlan, R.; Focsan, M.; Oniga, O.; Bogdan, M.; Vlase, L.; Oniga, I.; Marc, G. Antioxidant Activity Evaluation and Assessment of the Binding Affinity to HSA of a New Catechol Hydrazinyl-Thiazole Derivative. Antioxidants 2022, 11, 1245. [Google Scholar] [CrossRef]
- Sabe, V.T.; Ntombela, T.; Jhamba, L.A.; Maguire, G.E.M.; Govender, T.; Naicker, T.; Kruger, H.G. Current Trends in Computer Aided Drug Design and a Highlight of Drugs Discovered via Computational Techniques: A Review. Eur. J. Med. Chem. 2021, 224, 113705. [Google Scholar] [CrossRef]
- Wang, K.; Huang, Y.; Wang, Y.; You, Q.; Wang, L. Recent Advances from Computer-Aided Drug Design to Artificial Intelligence Drug Design. RSC Med. Chem. 2024, 15, 3978–4000. [Google Scholar] [CrossRef]
- Abbas, S.Y. 4(3H)-Quinazolinone Derivatives: Syntheses, Physical Properties, Chemical Reaction, and Biological Properties. In Quinazolinone and Quinazoline Derivatives; Gamal Al-Kal, A., Ed.; IntechOpen: London, UK, 2020; pp. 53–56. [Google Scholar]
- Abdelmonsef, A.H.; Mosallam, A.M. Synthesis, in Vitro Biological Evaluation and in Silico Docking Studies of New Quinazolin-2,4-dione Analogues as Possible Anticarcinoma Agents. J. Heterocycl. Chem. 2020, 57, 1637–1654. [Google Scholar] [CrossRef]
- Ahmed, M.F.; Belal, A. Design, Synthesis, and Molecular Docking Studies of 2-(Furan-2-yl)Quinazolin-4-one Derivatives as Potential Antiproliferative Agents. Arch. Pharm. 2015, 348, 487–497. [Google Scholar] [CrossRef]
- Alsibaee, A.M.; Al-Yousef, H.M.; Al-Salem, H.S. Quinazolinones, the Winning Horse in Drug Discovery. Molecules 2023, 28, 978. [Google Scholar] [CrossRef]
- Das, S.; Chatterjee, N.; Bose, D.; Dey, S.K.; Munda, R.N.; Nandy, A.; Bera, S.; Biswas, S.K.; Saha, K. Das Anticancer Potential of 3-(Arylideneamino)-2-Phenylquinazoline-4(3H)-One Derivatives. Cell. Physiol. Biochem. 2012, 29, 251–260. [Google Scholar] [CrossRef] [PubMed]
- ElZahabi, H.S.A.; Nafie, M.S.; Osman, D.; Elghazawy, N.H.; Soliman, D.H.; EL-Helby, A.A.H.; Arafa, R.K. Design, Synthesis and Evaluation of New Quinazolin-4-One Derivatives as Apoptotic Enhancers and Autophagy Inhibitors with Potent Antitumor Activity. Eur. J. Med. Chem. 2021, 222, 113609. [Google Scholar] [CrossRef] [PubMed]
- Soliman, M.H.A.; Ali, I.A.I.; El-Sakka, S.S.A.; Mohamed, O.E.-S.A.-B. Novel Quinoline Derivatives as Antitumor Agents against HepG2 Cells: Synthesis, Characterization, in Silico, in Vitro and Docking Studies. J. Mol. Struct. 2022, 1254, 132325. [Google Scholar] [CrossRef]
- Yu, P.; Cao, W.; Yang, S.; Wang, Y.; Xia, A.; Tan, X.; Wang, L. Design, Synthesis and Antitumor Evaluation of Novel Quinazoline Analogs in Hepatocellular Carcinoma Cell. J. Mol. Struct. 2022, 1268, 133718. [Google Scholar] [CrossRef]
- Zahran, S.S.; Ragab, F.A.; El-Gazzar, M.G.; Soliman, A.M.; Mahmoud, W.R.; Ghorab, M.M. Antiproliferative, Antiangiogenic and Apoptotic Effect of New Hybrids of Quinazoline-4(3H)-Ones and Sulfachloropyridazine. Eur. J. Med. Chem. 2023, 245, 114912. [Google Scholar] [CrossRef]
- Noser, A.A.; El-naggar, M.; Donia, T.; Abdelmonsef, A.H. Synthesis, In Silico and In Vitro Assessment of New Quinazolinones as Anticancer Agents via Potential AKT Inhibition. Molecules 2020, 25, 4780. [Google Scholar] [CrossRef]
- Haneen, D.S.A.; Abdalha, A.A.; Alkhatib, M.M.; Kamal, M.; Youssef, A.S.A.; Abou-elmagd, W.S.I.; Samir, S.S. Synthesis, Comprehensive in Silico Studies, and Cytotoxicity Evaluation of Novel Quinazolinone Derivatives as Potential Anticancer Agents. Sci. Rep. 2025, 15, 1–25. [Google Scholar] [CrossRef] [PubMed]
- Han, S.; Jung, J.E.; Oh, D.H.; Kim, M.; Kim, J.; Chung, S.; Han, H.; Lee, J.; Lee, K.; Jeong, H.J.; et al. Identification of Highly Selective Type II Kinase Inhibitors with Chiral Peptidomimetic Tails Peptidomimetic Tails. J. Enzyme Inhib. Med. Chem. 2022, 37, 1257–1277. [Google Scholar] [CrossRef] [PubMed]
- Kufareva, I.; Abagyan, R. Type-II Kinase Inhibitor Docking, Screening, and Profiling Using Modified Structures of Active Kinase States. J. Med. Chem. 2008, 51, 7921–7932. [Google Scholar] [CrossRef]
- Wu, X.; Li, H.; Ding, X.; Chen, X.; Yin, C.; Gao, Y.; Ma, J. Design, Synthesis, and Evaluation of 8-(o-Tolyl)Quinazoline Derivatives as Small-Molecule PD-1/PD-L1 Antagonists. ACS Med. Chem. Lett. 2024, 15, 518–523. [Google Scholar] [CrossRef] [PubMed]
- Pele, R.; Marc, G.; Stana, A.; Ionuț, I.; Nastasă, C.; Tiperciuc, B.; Oniga, I.; Pîrnău, A.; Vlase, L.; Oniga, O. Synthesis of New Phenolic Derivatives of Quinazolin-4(3H)-One as Potential Antioxidant Agents—In Vitro Evaluation and Quantum Studies. Molecules 2022, 27, 2599. [Google Scholar] [CrossRef]
- Pele, R.; Marc, G.; Ionuț, I.; Nastasă, C.; Fizeșan, I.; Pîrnău, A.; Vlase, L.; Palage, M.; Oniga, S.; Oniga, O. Antioxidant and Cytotoxic Activity of New Polyphenolic Derivatives of Quinazolin-4(3H)-One: Synthesis and In Vitro Activities Evaluation. Pharmaceutics 2022, 15, 136. [Google Scholar] [CrossRef]
- Velázquez-Libera, J.L.; Durán-Verdugo, F.; Valdés-Jiménez, A.; Núñez-Vivanco, G.; Caballero, J. LigRMSD: A Web Server for Automatic Structure Matching and RMSD Calculations among Identical and Similar Compounds in Protein-Ligand Docking. Bioinformatics 2020, 36, 2912–2914. [Google Scholar] [CrossRef]
- Șandor, A.; Fizeșan, I.; Ionuț, I.; Marc, G.; Moldovan, C.; Oniga, I.; Pîrnău, A.; Vlase, L.; Petru, A.-E.; Macasoi, I.; et al. Discovery of A Novel Series of Quinazoline–Thiazole Hybrids as Potential Antiproliferative and Anti-Angiogenic Agents. Biomolecules 2024, 14, 218. [Google Scholar] [CrossRef]
- Vieira, T.F.; Sousa, S.F. Comparing AutoDock and Vina in Ligand/Decoy Discrimination for Virtual Screening. Appl. Sci. 2019, 9, 4538. [Google Scholar] [CrossRef]
- Trott, O.; Olson, A.J. AutoDock Vina: Improving the Speed and Accuracy of Docking with a New Scoring Function, Efficient Optimization, and Multithreading. J. Comput. Chem. 2010, 31, 455–461. [Google Scholar] [CrossRef]
- Chang, M.W.; Ayeni, C.; Breuer, S.; Torbett, B.E. Virtual Screening for HIV Protease Inhibitors: A Comparison of AutoDock 4 and Vina. PLoS ONE 2010, 5, 1–9. [Google Scholar] [CrossRef]
- Gaillard, T. Evaluation of AutoDock and AutoDock Vina on the CASF-2013 Benchmark. J. Chem. Inf. Model. 2018, 58, 1697–1706. [Google Scholar] [CrossRef] [PubMed]
- Wei, M.; Cao, Z.; Dong, L.; Wang, W.E.I.; Wei, M.E.I.; Ji, L.; Duan, L.; Sun, H.U.I.; Zheng, M. The Advantages and Challenges of Sorafenib Combination Therapy: Drug Resistance, Toxicity and Future Directions (Review). Oncol. Lett. 2025, 30, 1–20. [Google Scholar] [CrossRef] [PubMed]
- Hollingsworth, S.A.; Dror, R.O. Review Molecular Dynamics Simulation for All. Neuron 2018, 99, 1129–1143. [Google Scholar] [CrossRef] [PubMed]
- Wang, C.; Greene, D.A.; Xiao, L.; Qi, R.; Luo, R.; Luo, R. Recent Developments and Applications of the MMPBSA Method. Front. Mol. Biosci. 2018, 4, 1–18. [Google Scholar] [CrossRef]
- Kokalj, A. On the Alleged Importance of the Molecular Electron-Donating Ability and the HOMO–LUMO Gap in Corrosion Inhibition Studies. Corros. Sci. 2020, 180, 109016. [Google Scholar] [CrossRef]
- Choudhary, V.K.; Bhatt, K.; Dash, D.; Sharma, N. DFT Calculations on Molecular Structures, HOMO—LUMO Study, Reactivity Descriptors and Spectral Analyses of Newly Synthesized Diorganotin (IV) 2-Chloridophenylacetohydroxamate Complexes. J. Comput. Chem. 2019, 40, 2354–2363. [Google Scholar] [CrossRef]
- Turcu, I.; Mic, M. Size Dependence of Molecular Self-Assembling in Stacked Aggregates. II. Heat Exchange Effects. J. Phys. Chem. B 2013, 117, 9083–9093. [Google Scholar] [CrossRef]
- Infield, D.T.; Rasouli, A.; Galles, G.D.; Chipot, C.; Ahern, C.A. Cation-π Interactions and Their Functional Roles in Membrane Proteins. J. Mol. Biol. 2021, 433, 167035. [Google Scholar] [CrossRef]
- Dougherty, D.A. The Cation−π Interaction in Chemistry and Biology. Chem. Rev. 2025, 125, 2793–2808. [Google Scholar] [CrossRef] [PubMed]
- Varlamova, E.G.; Goltyaev, M.V.; Simakin, A.V.; Gudkov, S.V. Comparative Analysis of the Cytotoxic Effect of a Complex of Selenium Nanoparticles Doped with Sorafenib, “Naked” Selenium Nanoparticles, and Sorafenib on Human Hepatocyte Carcinoma HepG2 Cells. Int. J. Mol. Sci. 2022, 23, 6641. [Google Scholar] [CrossRef] [PubMed]
- Wu, C.-C.; Chung, J.; Tsai, S.-J.; Yang, J.; Sheen, L. Differential Effects of Allyl Sulfides from Garlic Essential Oil on Cell Cycle Regulation in Human Liver Tumor Cells. Food Chem. Toxicol. 2004, 42, 1937–1947. [Google Scholar] [CrossRef] [PubMed]
- Komura, H.; Watanabe, R.; Mizuguchi, K. The Trends and Future Prospective of In Silico Models from the Viewpoint of ADME Evaluation in Drug Discovery. Pharmaceutics 2023, 15, 2619. [Google Scholar] [CrossRef]
- van Breemen, R.B.; Li, Y. Caco-2 Cell Permeability Assays to Measure Drug Absorption. Expert. Opin. Drug Metab. Toxicol. 2005, 1, 175–185. [Google Scholar] [CrossRef]
- Sorkun, M.C.; Khetan, A.; Er, S. AqSolDB, a Curated Reference Set of Aqueous Solubility and 2D Descriptors for a Diverse Set of Compounds. Sci. Data 2019, 6, 1–8. [Google Scholar] [CrossRef]
- Morak-młodawska, B.; Jele, M. Study of Lipophilicity and ADME Properties of 1, 9-Diazaphenothiazines with Anticancer Action. Int. J. Mol. Sci. 2023, 24, 6970. [Google Scholar] [CrossRef]
- Tamaian, R.; Moţ, A.; Silaghi-Dumitrescu, R.; Ionuţ, I.; Stana, A.; Oniga, O.; Nastasə, C.; Benedec, D.; Tiperciuc, B.; McPhee, D.J. Study of the Relationships between the Structure, Lipophilicity and Biological Activity of Some Thiazolyl-Carbonyl-Thiosemicarbazides and Thiazolyl-Azoles. Molecules 2015, 20, 19841. [Google Scholar] [CrossRef]
- Fu, L.; Shi, S.; Yi, J.; Wang, N.; He, Y.; Wu, Z. ADMETlab 3.0: An Updated Comprehensive Online ADMET Prediction Platform Enhanced with Broader Coverage, Improved Performance, API Functionality and Decision Support. Nucleic Acids Res. 2024, 52, W422–W431. [Google Scholar] [CrossRef]
- McTigue, M.; Murray, B.W.; Chen, J.H.; Deng, Y.-L.; Solowiej, J.; Kania, R.S. Molecular Conformations, Interactions, and Properties Associated with Drug Efficiency and Clinical Performance among VEGFR TK Inhibitors. Proc. Natl. Acad. Sci. USA 2012, 109, 18281–18289. [Google Scholar] [CrossRef]
- Berman, H.M.; Westbrook, J.; Feng, Z.; Gilliland, G.; Bhat, T.N.; Weissig, H.; Shindyalov, I.N.; Bourne, P.E. The Protein Data Bank. Nucleic Acids Res. 2000, 28, 235–242. [Google Scholar] [CrossRef] [PubMed]
- Morris, G.M.; Huey, R.; Lindstrom, W.; Sanner, M.F.; Belew, R.K.; Goodsell, D.S.; Olson, A.J. AutoDock4 and AutoDockTools4: Automated Docking with Selective Receptor Flexibility. J. Comput. Chem. 2009, 30, 2785–2791. [Google Scholar] [CrossRef]
- Waterhouse, A.; Bertoni, M.; Bienert, S.; Studer, G.; Tauriello, G.; Gumienny, R.; Heer, F.T.; De Beer, T.A.P.; Rempfer, C.; Bordoli, L.; et al. SWISS-MODEL: Homology Modelling of Protein Structures and Complexes. Nucleic Acids Res. 2018, 46, 296–303. [Google Scholar] [CrossRef]
- Hanwell, M.D.; Curtis, D.E.; Lonie, D.C.; Vandermeersch, T.; Zurek, E.; Hutchison, G.R. Avogadro: An Advanced Semantic Chemical Editor, Visualization, and Analysis Platform. J. Cheminform. 2012, 4, 17. [Google Scholar] [CrossRef]
- Pettersen, E.F.; Goddard, T.D.; Huang, C.C.; Couch, G.S.; Greenblatt, D.M.; Meng, E.C.; Ferrin, T.E. UCSF Chimera—A Visualization System for Exploratory Research and Analysis. J. Comput. Chem. 2004, 25, 1605–1612. [Google Scholar] [CrossRef]
- Abraham, M.J.; Murtola, T.; Schulz, R.; Páll, S.; Smith, J.C.; Hess, B.; Lindahl, E. GROMACS: High Performance Molecular Simulations through Multi-Level Parallelism from Laptops to Supercomputers. SoftwareX 2015, 1–2, 19–25. [Google Scholar] [CrossRef]
- Vanommeslaeghe, K.; Hatcher, E.; Acharya, C.; Kundu, S.; Zhong, S.; Shim, J.; Darian, E.; Guvench, O.; Lopes, P.; Vorobyov, I.; et al. CHARMM General Force Field: A Force Field for Drug-like Molecules Compatible with the CHARMM All-atom Additive Biological Force Fields. J. Comput. Chem. 2010, 31, 671–690. [Google Scholar] [CrossRef]
- Jorgensen, W.L.; Chandrasekhar, J.; Madura, J.D.; Impey, R.W.; Klein, M.L. Comparison of Simple Potential Functions for Simulating Liquid Water. J. Chem. Phys. 1983, 79, 926–935. [Google Scholar] [CrossRef]
- Lv, Z.; Wang, H.S.; Niu, X.D. Molecular Dynamics Simulations Reveal Insight into Key Structural Elements of Aaptamines as Sortase Inhibitors with Free Energy Calculations. Chem. Phys. Lett. 2013, 585, 171–177. [Google Scholar] [CrossRef]
- Jin, H.; Zhou, Z.; Wang, D.; Guan, S.; Han, W. Molecular Dynamics Simulations of Acylpeptide Hydrolase Bound to Chlorpyrifosmethyl Oxon and Dichlorvos. Int. J. Mol. Sci. 2015, 16, 6217. [Google Scholar] [CrossRef] [PubMed]
- Humphrey, W.; Dalke, A.; Schulten, K. VMD: Visual Molecular Dynamics. J. Mol. Graph. 1996, 14, 33–38. [Google Scholar] [CrossRef]
- Valdés-Tresanco, M.S.; Valdés-Tresanco, M.E.; Valiente, P.A.; Moreno, E. Gmx_MMPBSA: A New Tool to Perform End-State Free Energy Calculations with GROMACS. J. Chem. Theory Comput. 2021, 17, 6281–6291. [Google Scholar] [CrossRef]
- Ahmad Mir, S.; Paramita Mohanta, P.; Kumar Meher, R.; Baitharu, I.; Kumar Raval, M.; Kumar Behera, A.; Nayak, B. Structural Insights into Conformational Stability and Binding of Thiazolo-[2,3-b] Quinazolinone Derivatives with EGFR-TKD and in-Vitro Study. Saudi J. Biol. Sci. 2022, 29, 103478. [Google Scholar] [CrossRef]
- Revankar, A.G.; Bagewadi, Z.K.; Shaikh, I.A.; Mannasaheb, B.A.; Ghoneim, M.M.; Khan, A.A.; Asdaq, S.M.B. In-Vitro and Computational Analysis of Urolithin-A for Anti-Inflammatory Activity on Cyclooxygenase 2 (COX-2). Saudi J. Biol. Sci. 2023, 30, 103804. [Google Scholar] [CrossRef]
- Kumar, P.; Nagarajan, A.; Uchil, P.D. Analysis of Cell Viability by the MTT Assay. Cold Spring Harb. Protoc. 2018, 2018, pdb.prot095505. [Google Scholar] [CrossRef]
- Bradfield, A.E.; Bate-Smith, E.C. Chromatographic Behaviour and Chemical Structure II. The Tea Catechins. Biochim. Biophys. Acta 1950, 4, 441–444. [Google Scholar] [CrossRef]
- Soczewiński, E.; Wachtmeister, C.A. The Relation between the Composition of Certain Ternary Two-Phase Solvent Systems and RM Values. J. Chromatogr. 1962, 7, 311–319. [Google Scholar] [CrossRef]
- Maćkiewicz, A.; Waldemar, R. Principal Components Analysis (PCA). Comput. Geosci. 1993, 19, 303–342. [Google Scholar] [CrossRef]
- Casoni, D.; Sârbu, C. Original Paper The Lipophilicity of Parabens Estimated on Reverse Phases Chemically Bonded and Oil-Impregnated Plates and Calculated Using Different Computation Methods. J. Sep. Sci. 2009, 32, 2377–2384. [Google Scholar] [CrossRef]
- Elmansi, H.; Nasr, J.J.; Rageh, A.H.; El Awady, M.I.; Hassan, G.S.; Aziz, H.A.A.; Belal, F. Assessment of Lipophilicity of Newly Synthesized Celecoxib Analogues Using Reversed-Phase HPLC. BMC Chem. 2019, 13, 1–7. [Google Scholar] [CrossRef]
- Santos, A.; Soares, J.X.; Cravo, S.; Tiritan, M.E.; Reis, S.; Afonso, C.; Fernandes, C.; Pinto, M.M.M. Lipophilicity Assessement in Drug Discovery: Experimental and Theoretical Methods Applied to Xanthone Derivatives. J. Chromatogr. B Anal. Technol. Biomed. Life Sci. 2018, 1072, 182–192. [Google Scholar] [CrossRef]
Disclaimer/Publisher’s Note: The statements, opinions and data contained in all publications are solely those of the individual author(s) and contributor(s) and not of MDPI and/or the editor(s). MDPI and/or the editor(s) disclaim responsibility for any injury to people or property resulting from any ideas, methods, instructions or products referred to in the content. |
© 2025 by the authors. Licensee MDPI, Basel, Switzerland. This article is an open access article distributed under the terms and conditions of the Creative Commons Attribution (CC BY) license (https://creativecommons.org/licenses/by/4.0/).