

Discovery and Flavor Characterization of High-Grade Markers in Baked Green Tea


Abstract
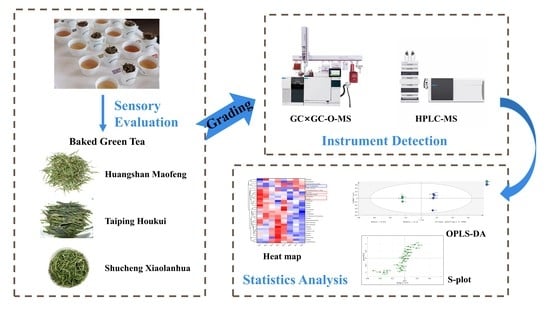
1. Introduction
2. Results and Discussion
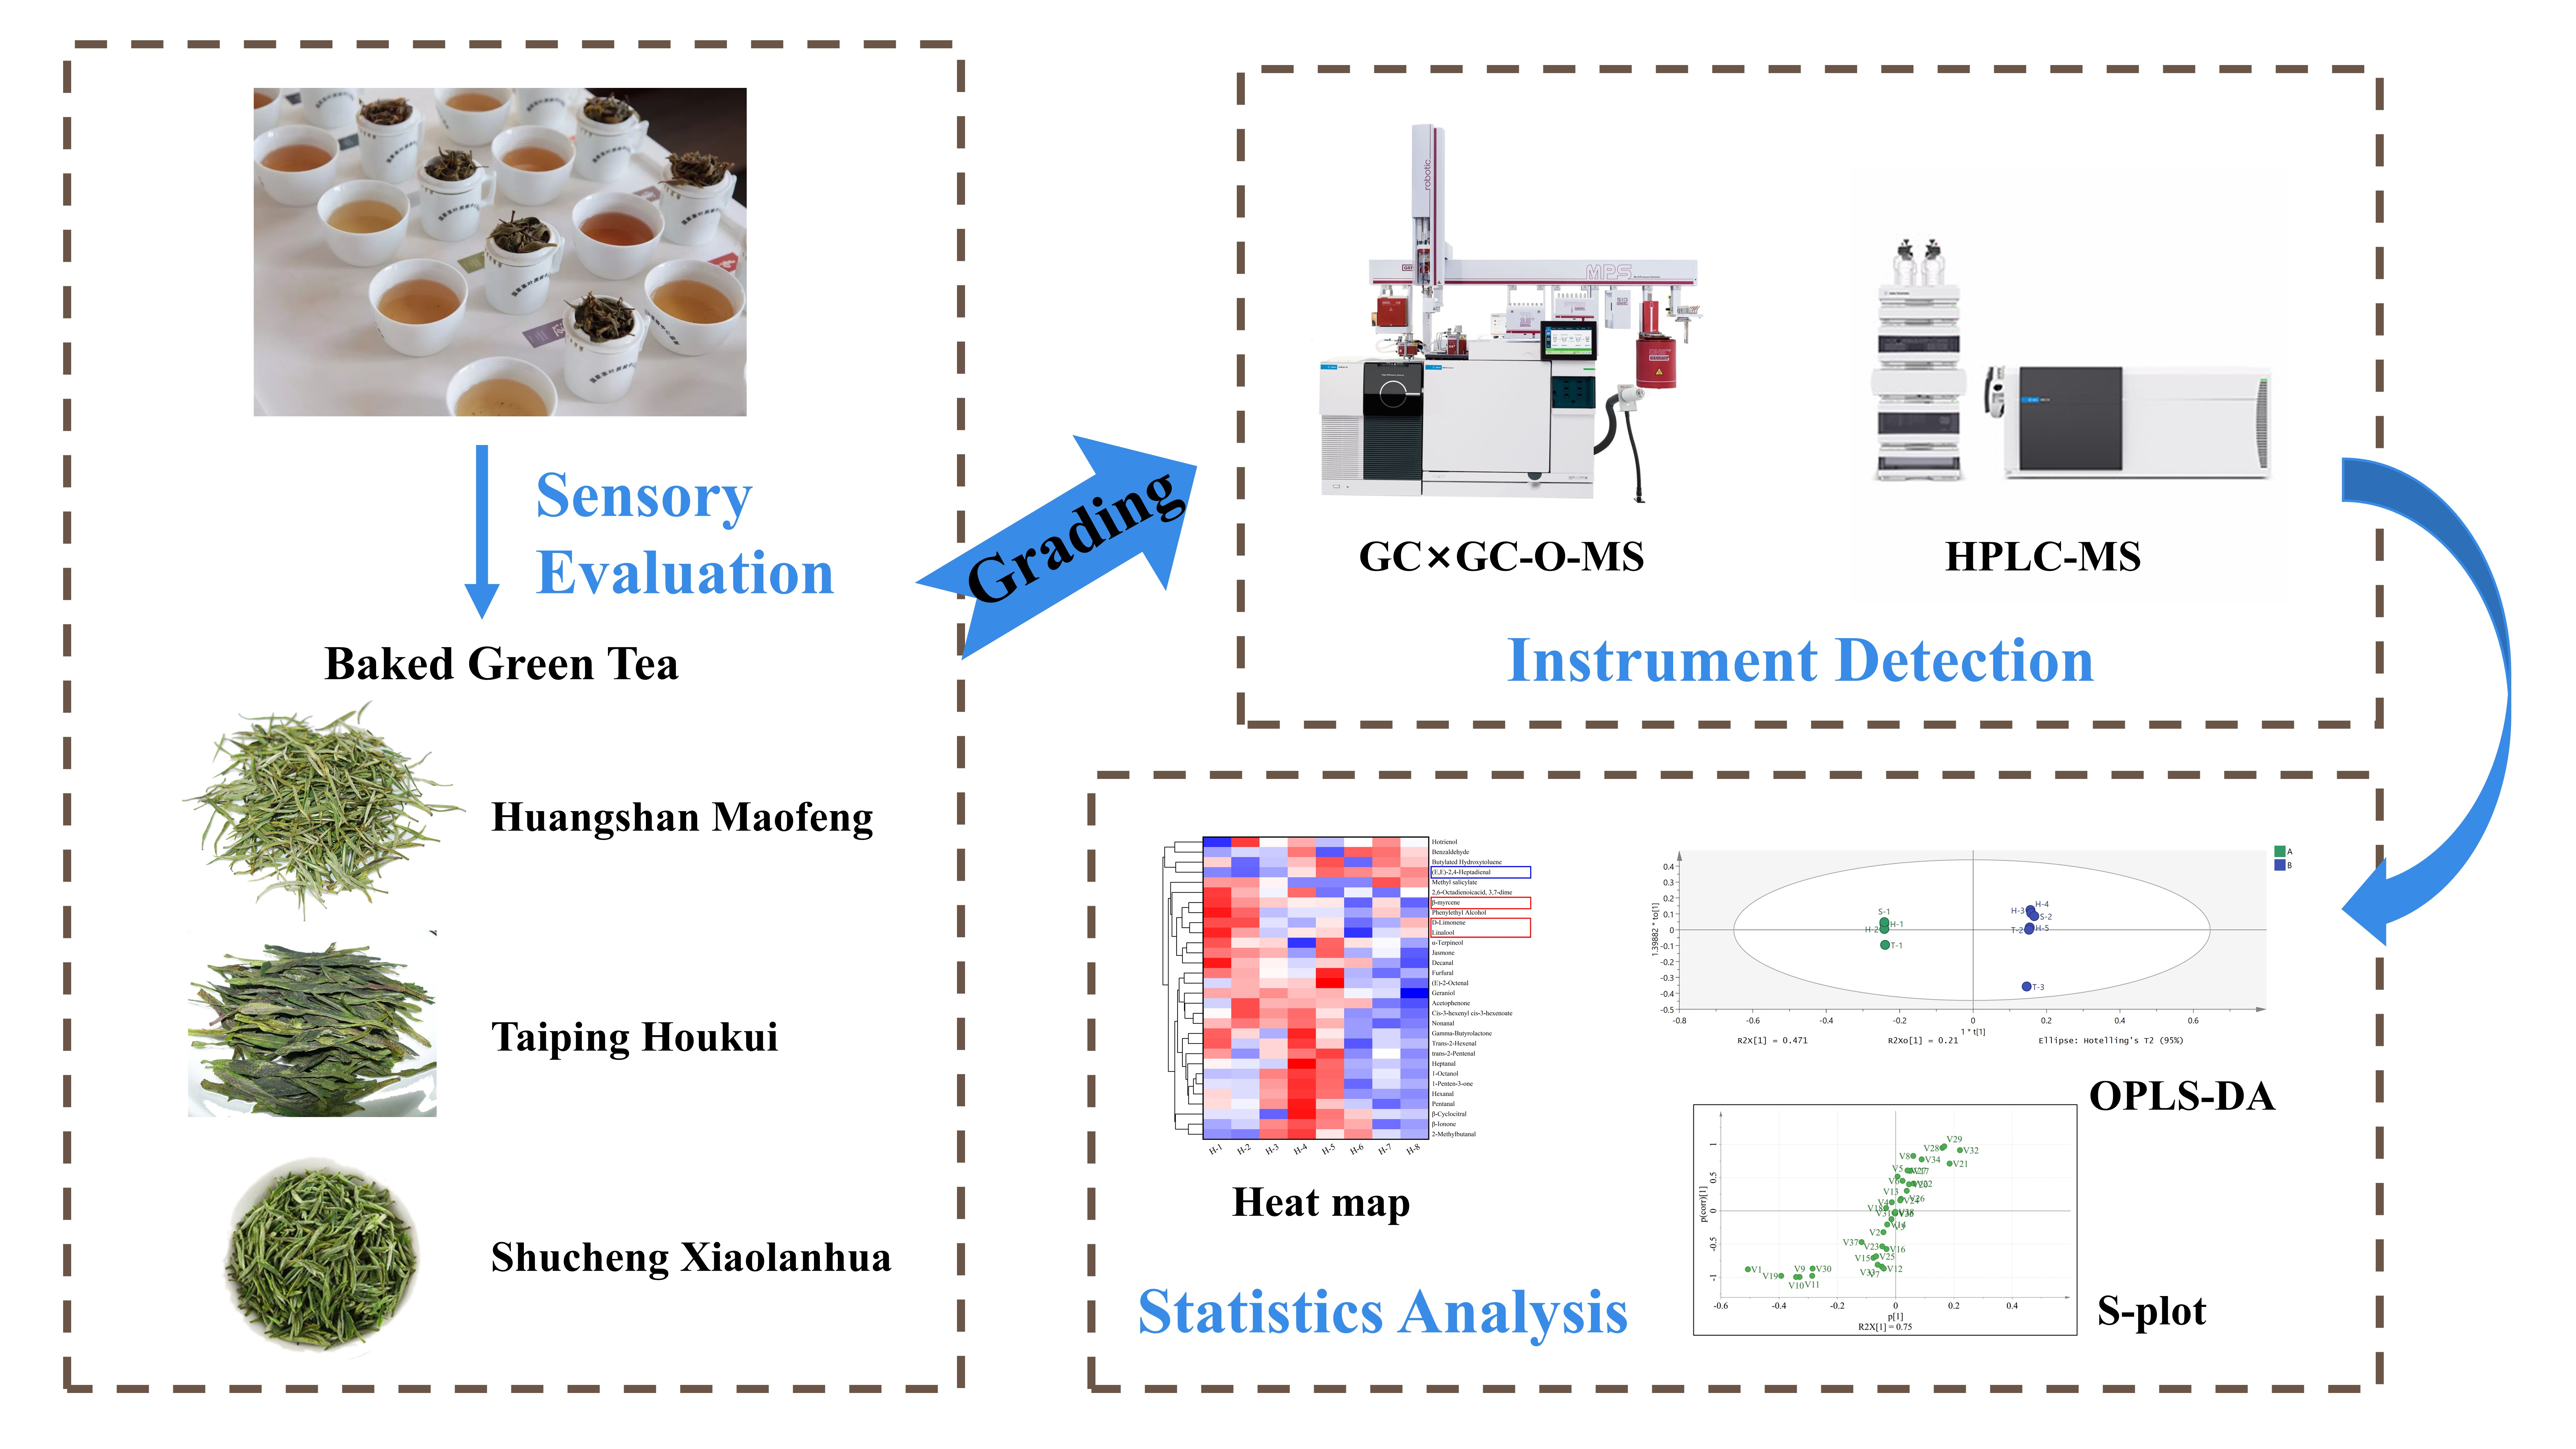
2.1. Analysis of Green-Tea-Screening Results
2.2. Analysis of Baked Green Tea Grading Results
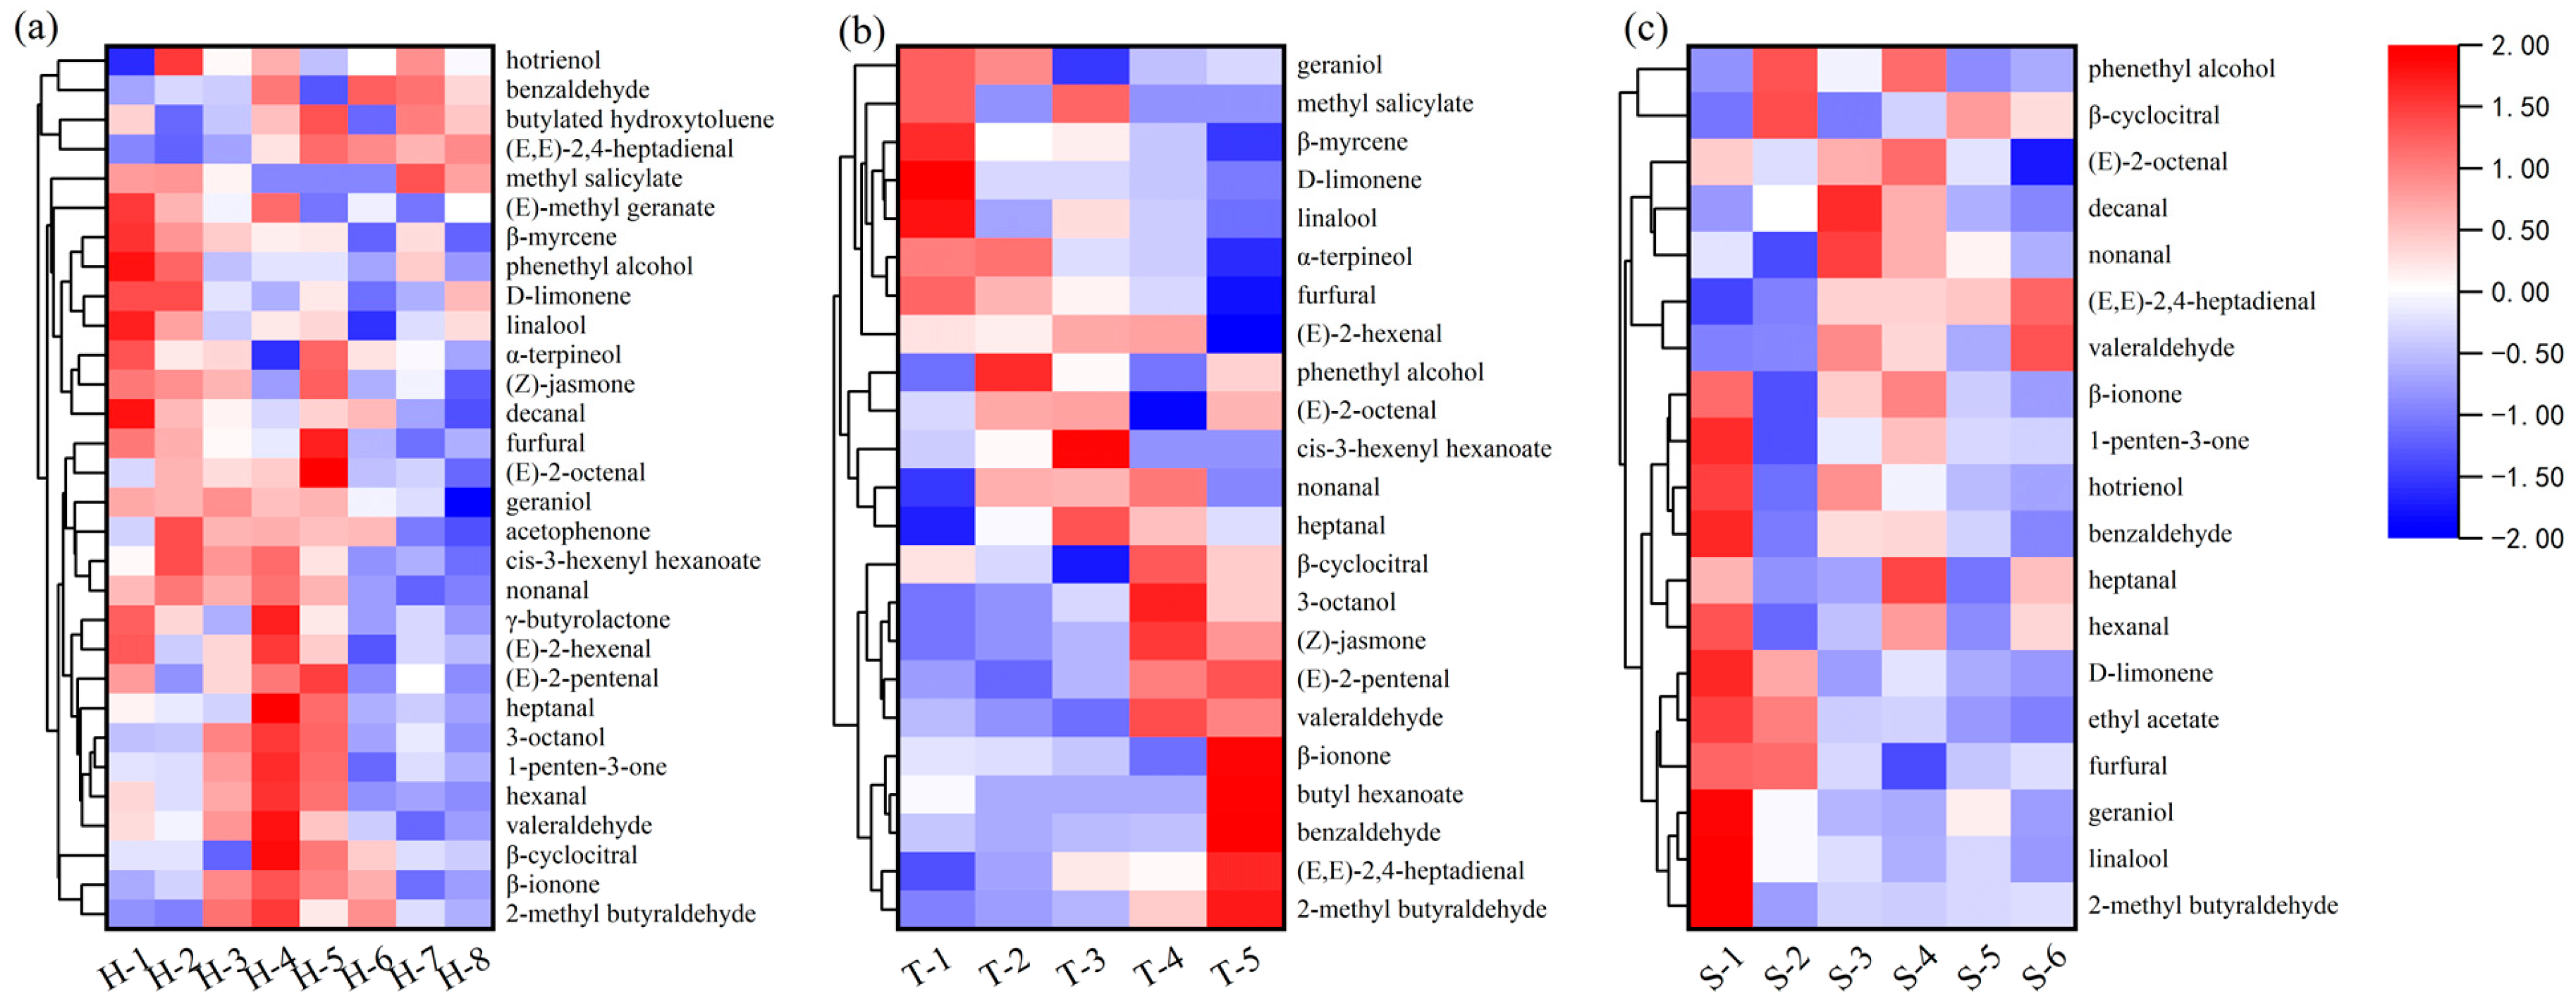
2.3. Odor Composition Analysis and Aroma Extract Dilution Analysis
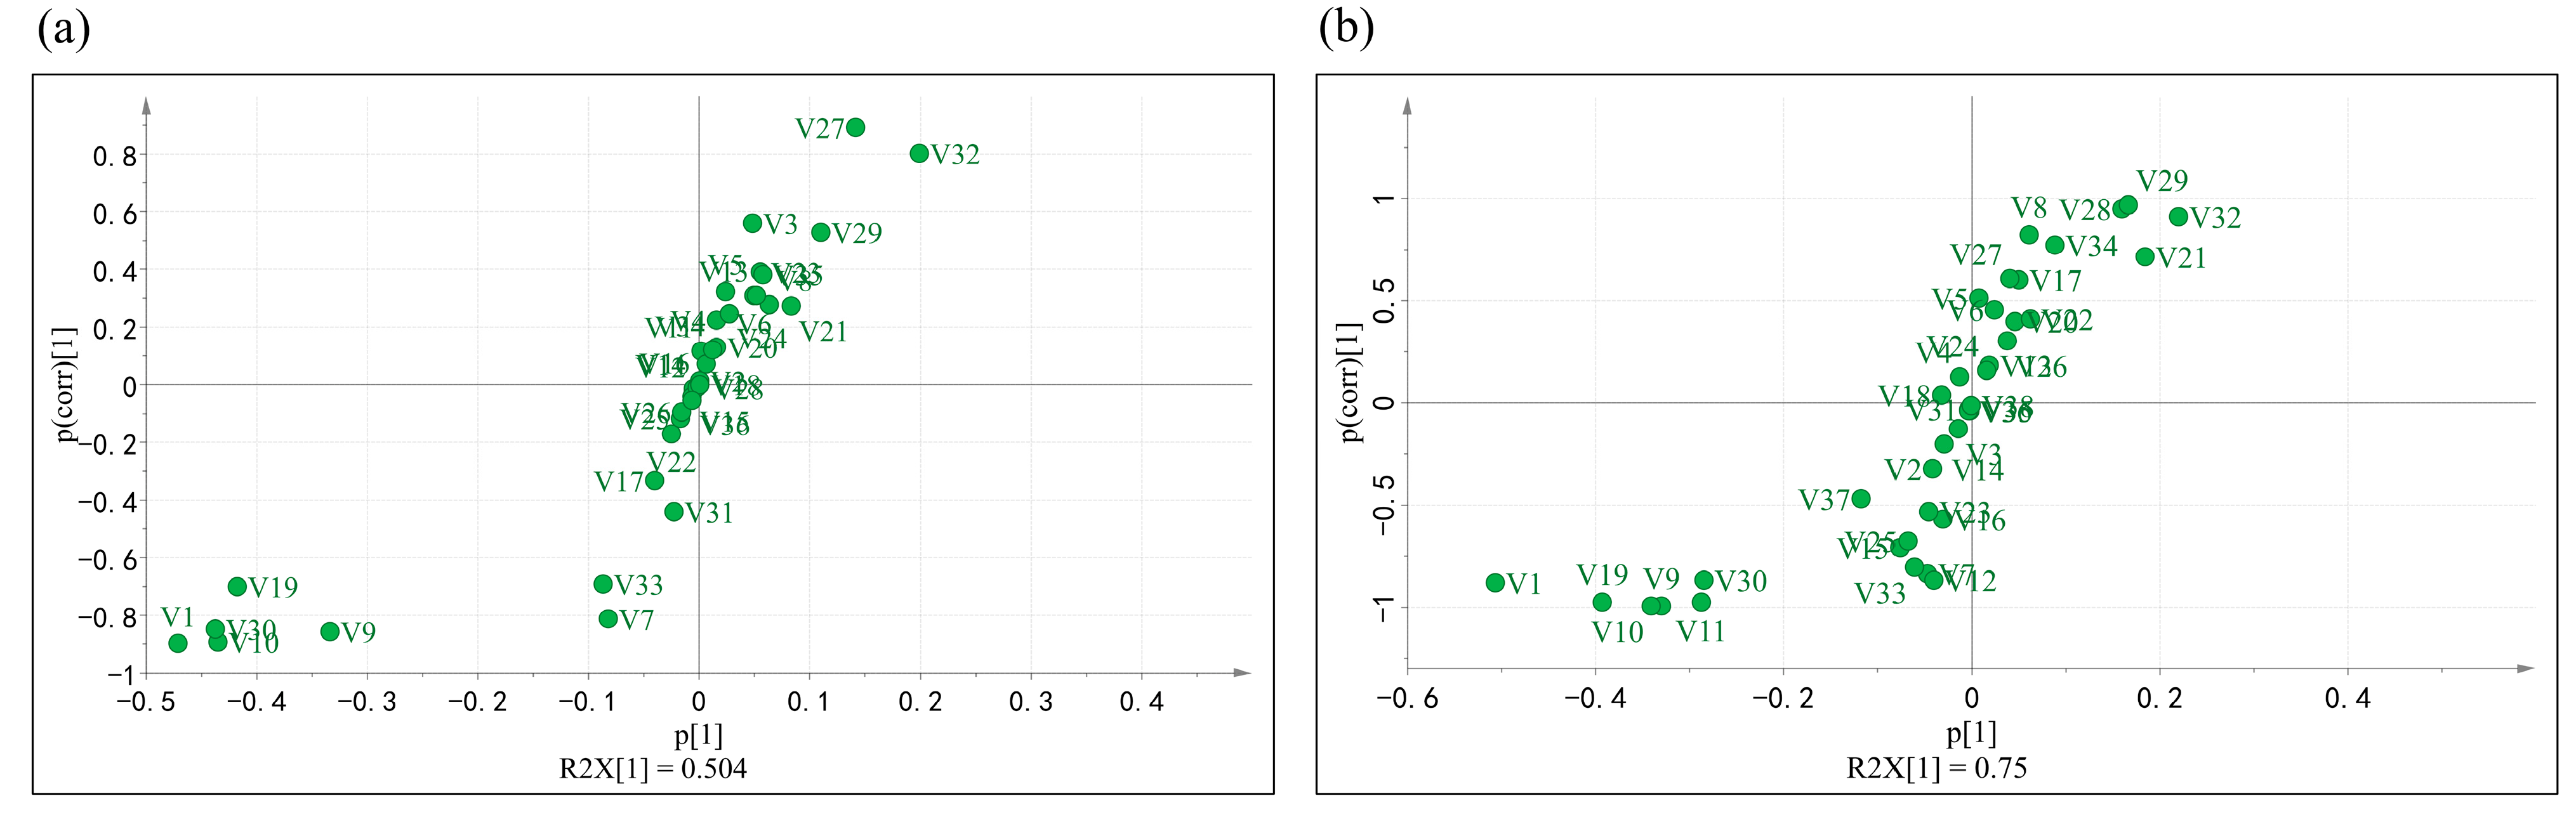
2.4. Odor Composition Correlations Analysis and Grade A Odor Markers’ Identification
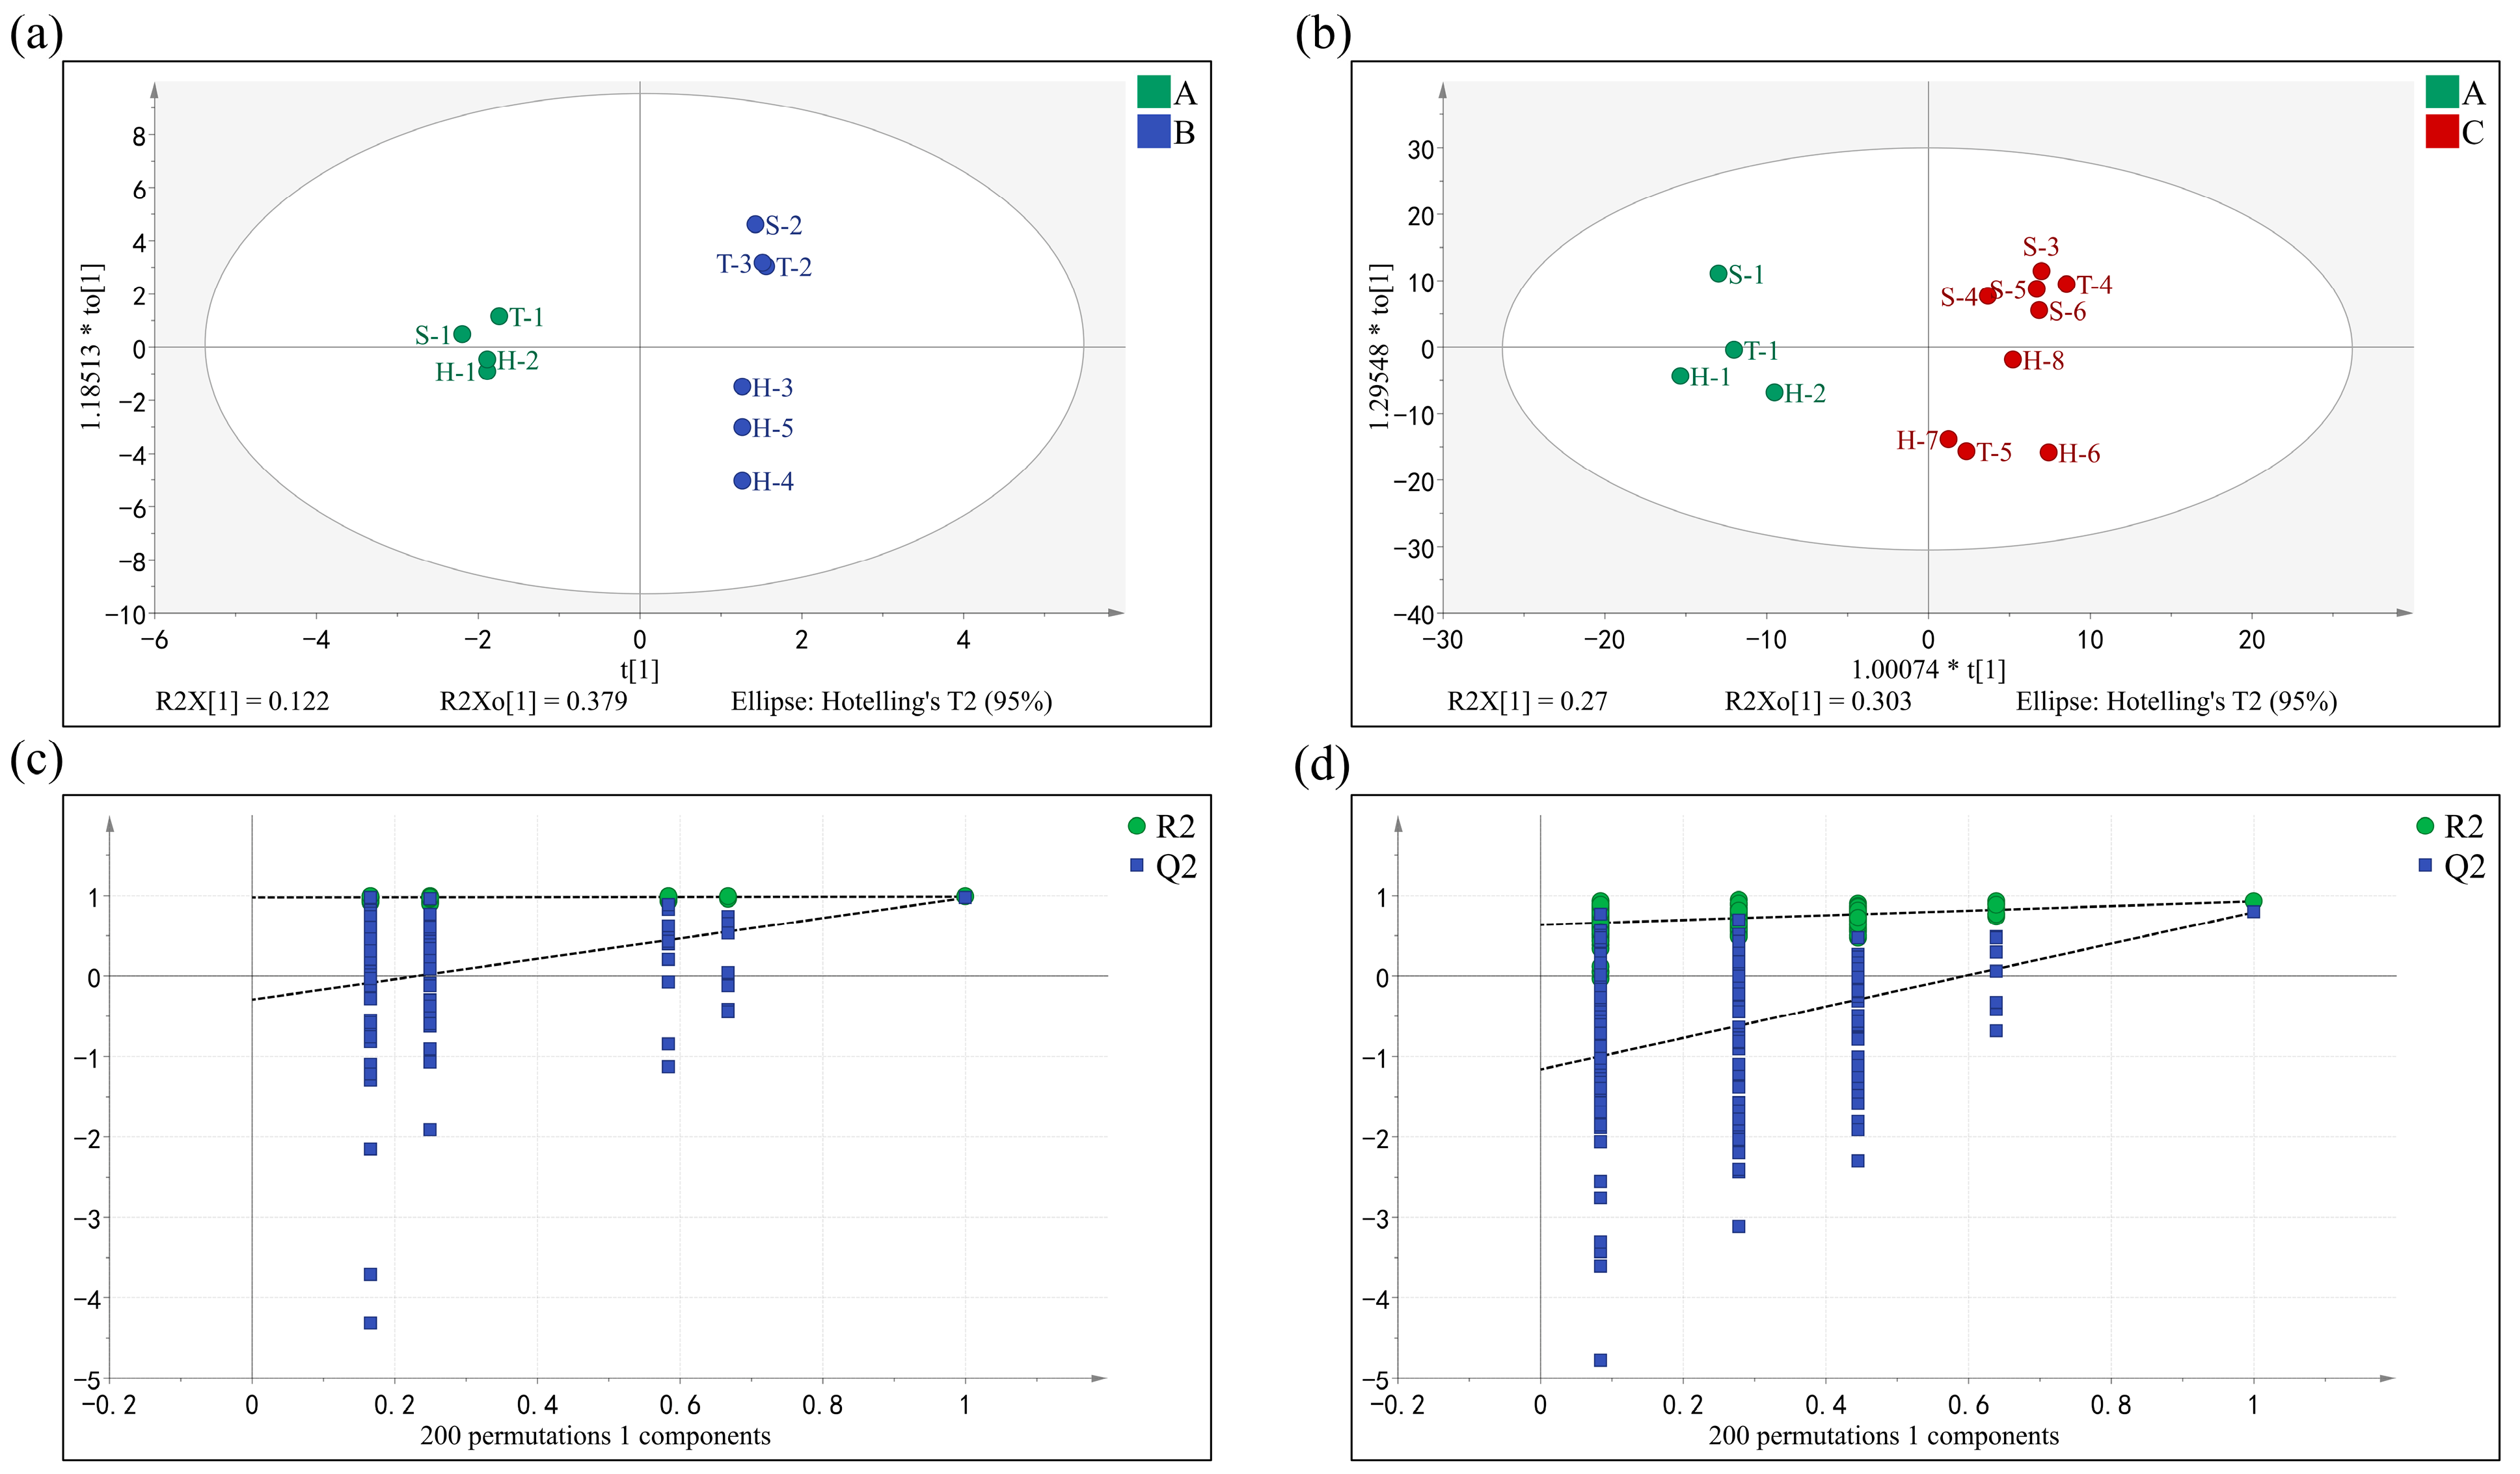
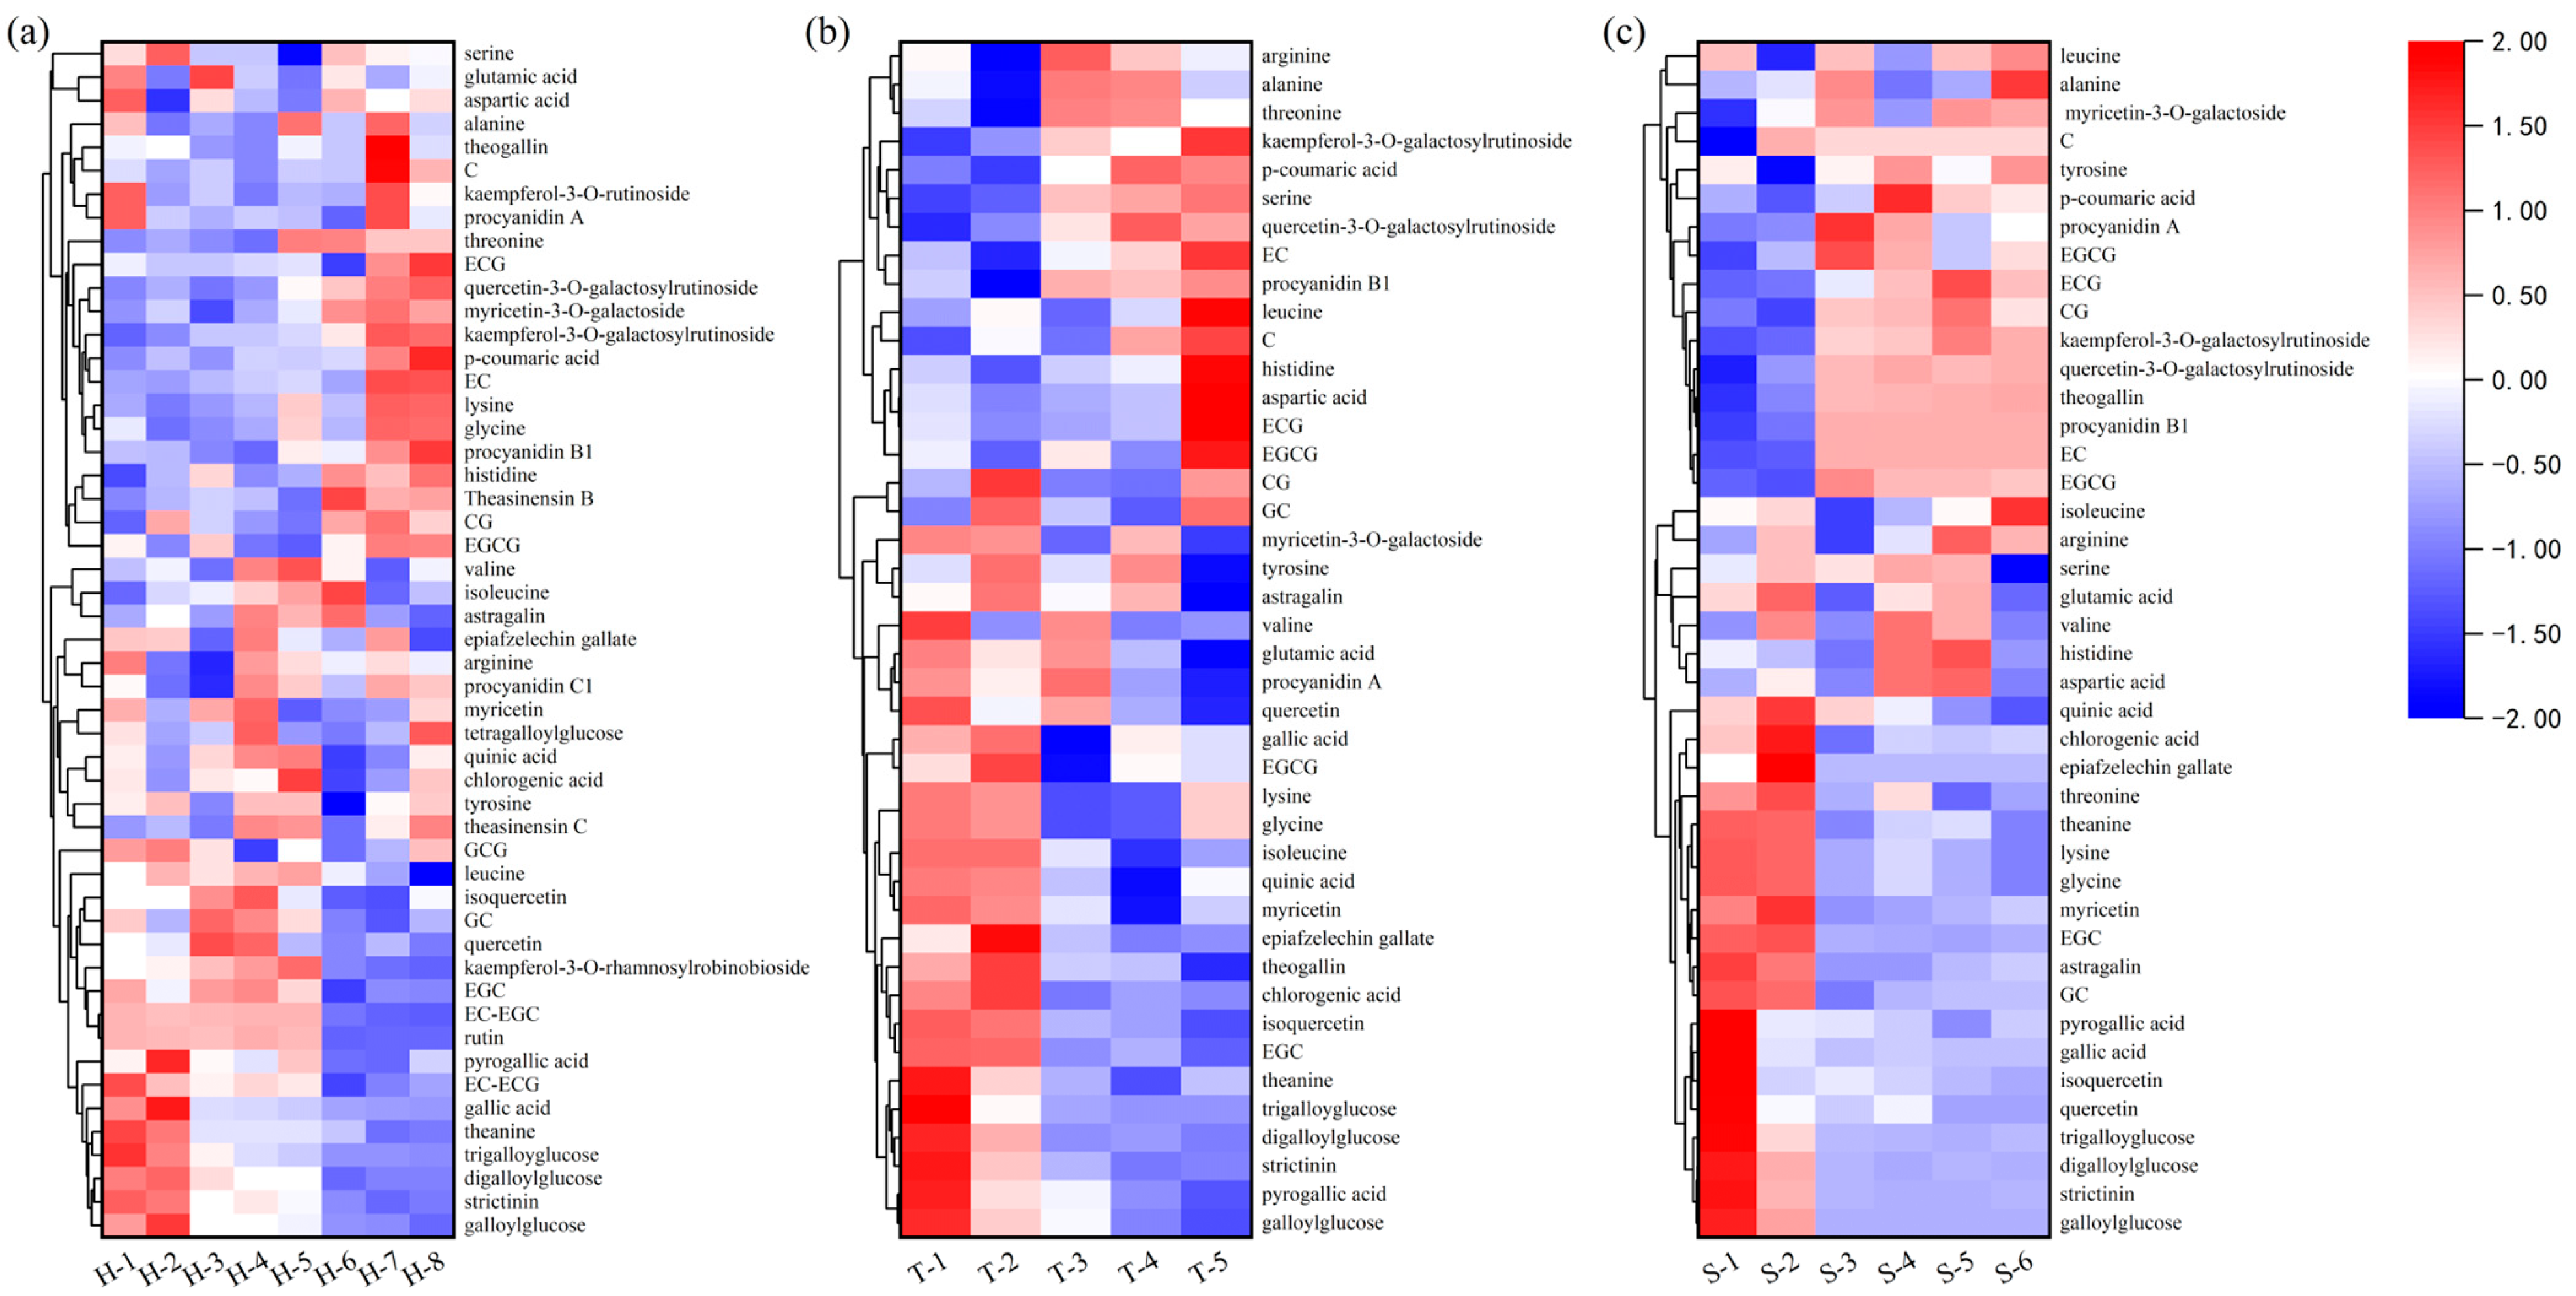
2.5. Taste Composition Analysis and Correlation Analysis via Clustering Analysis
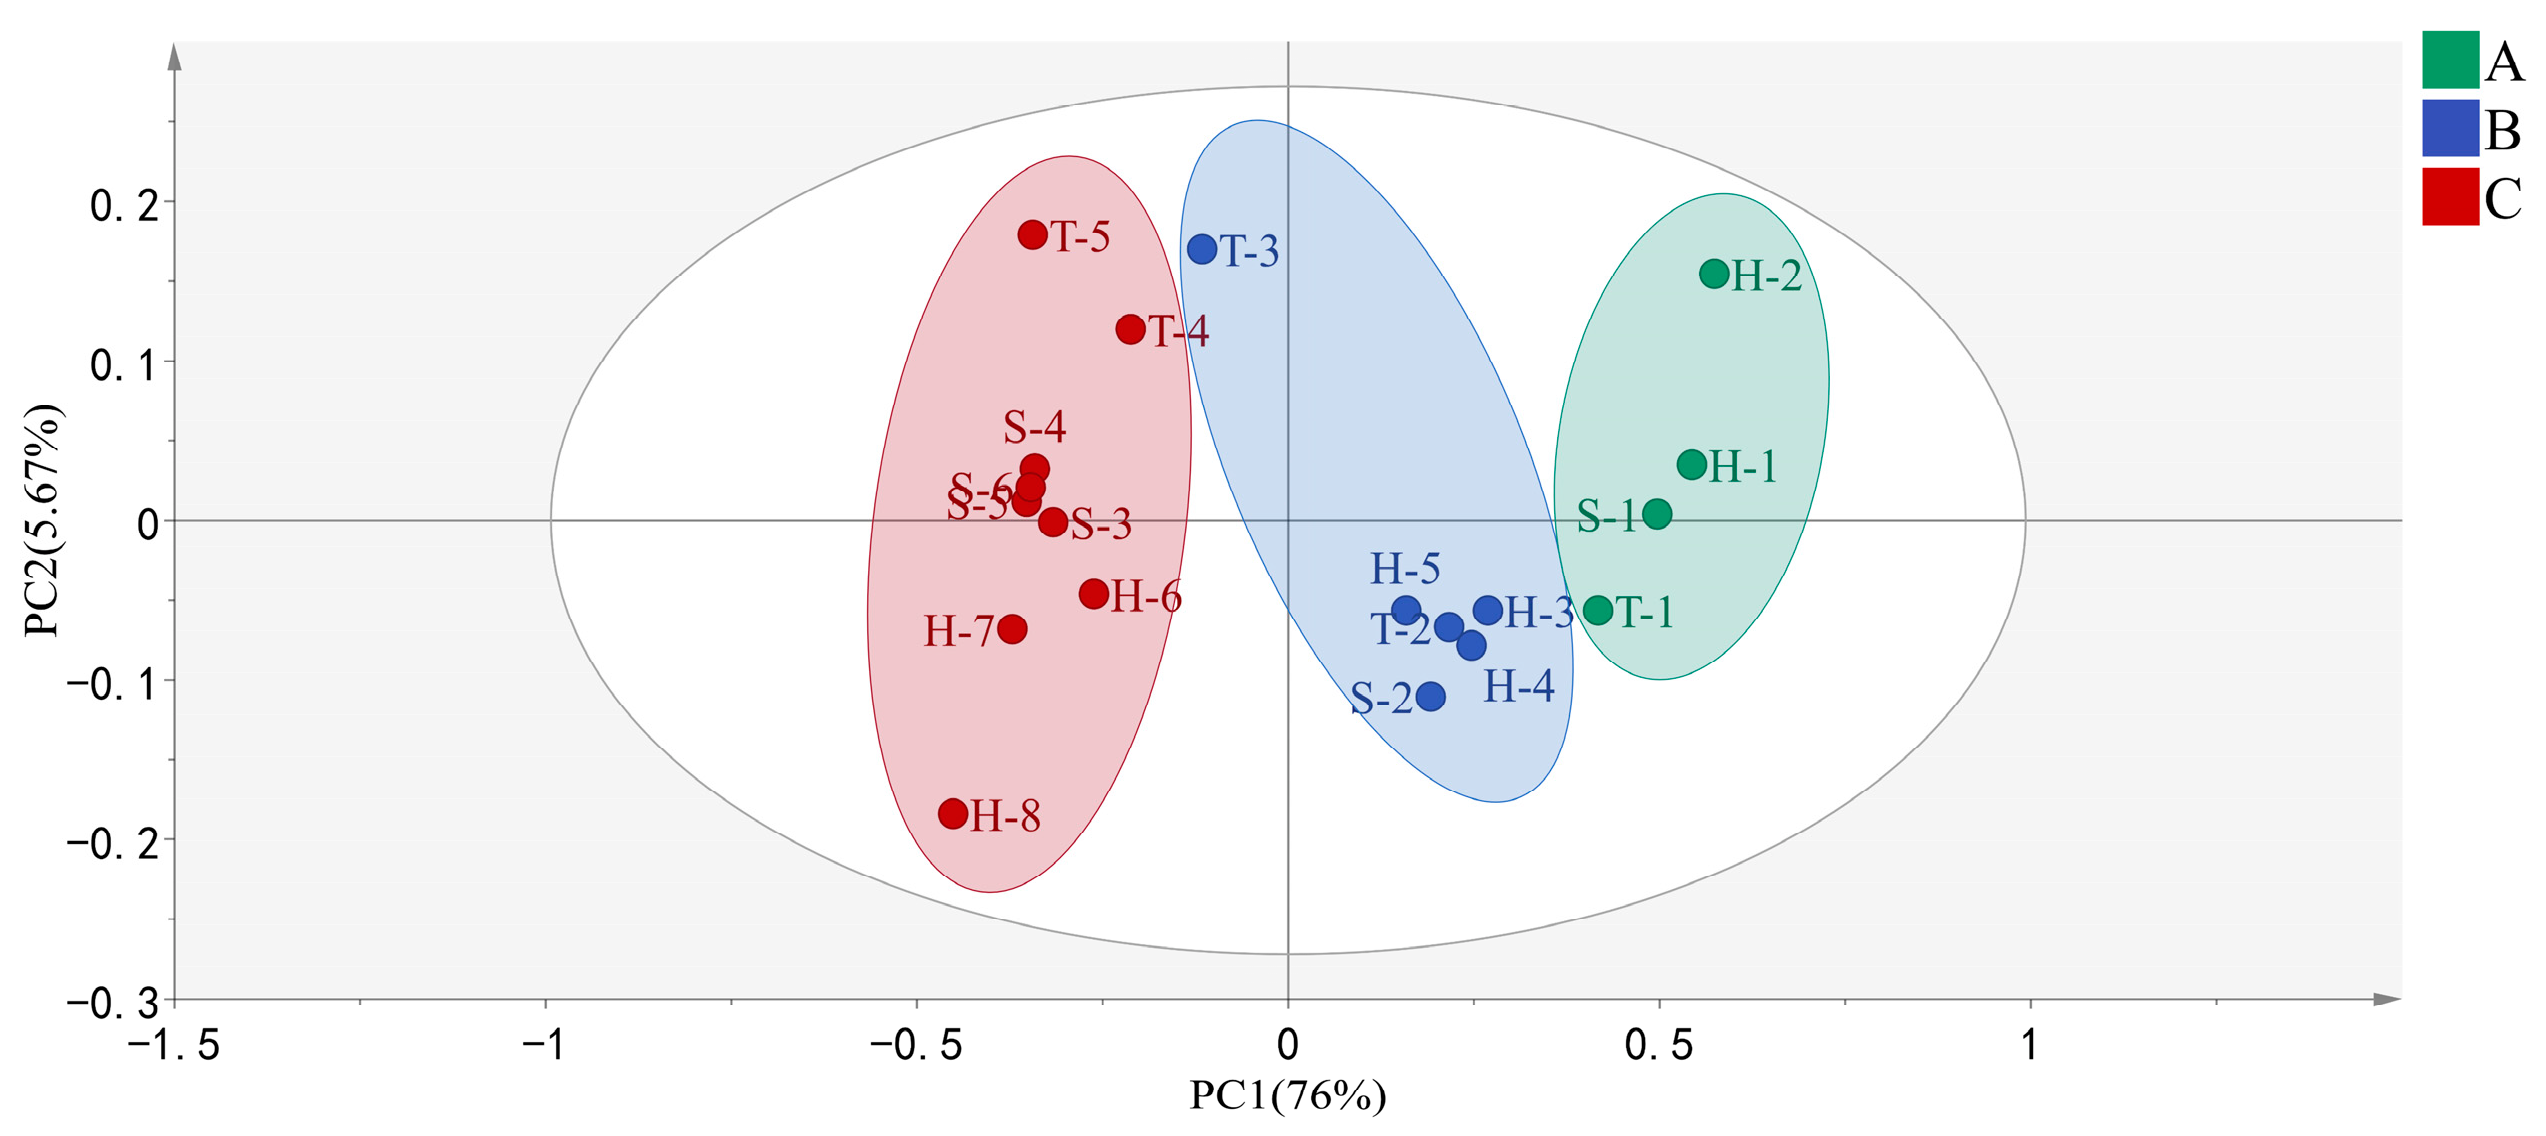
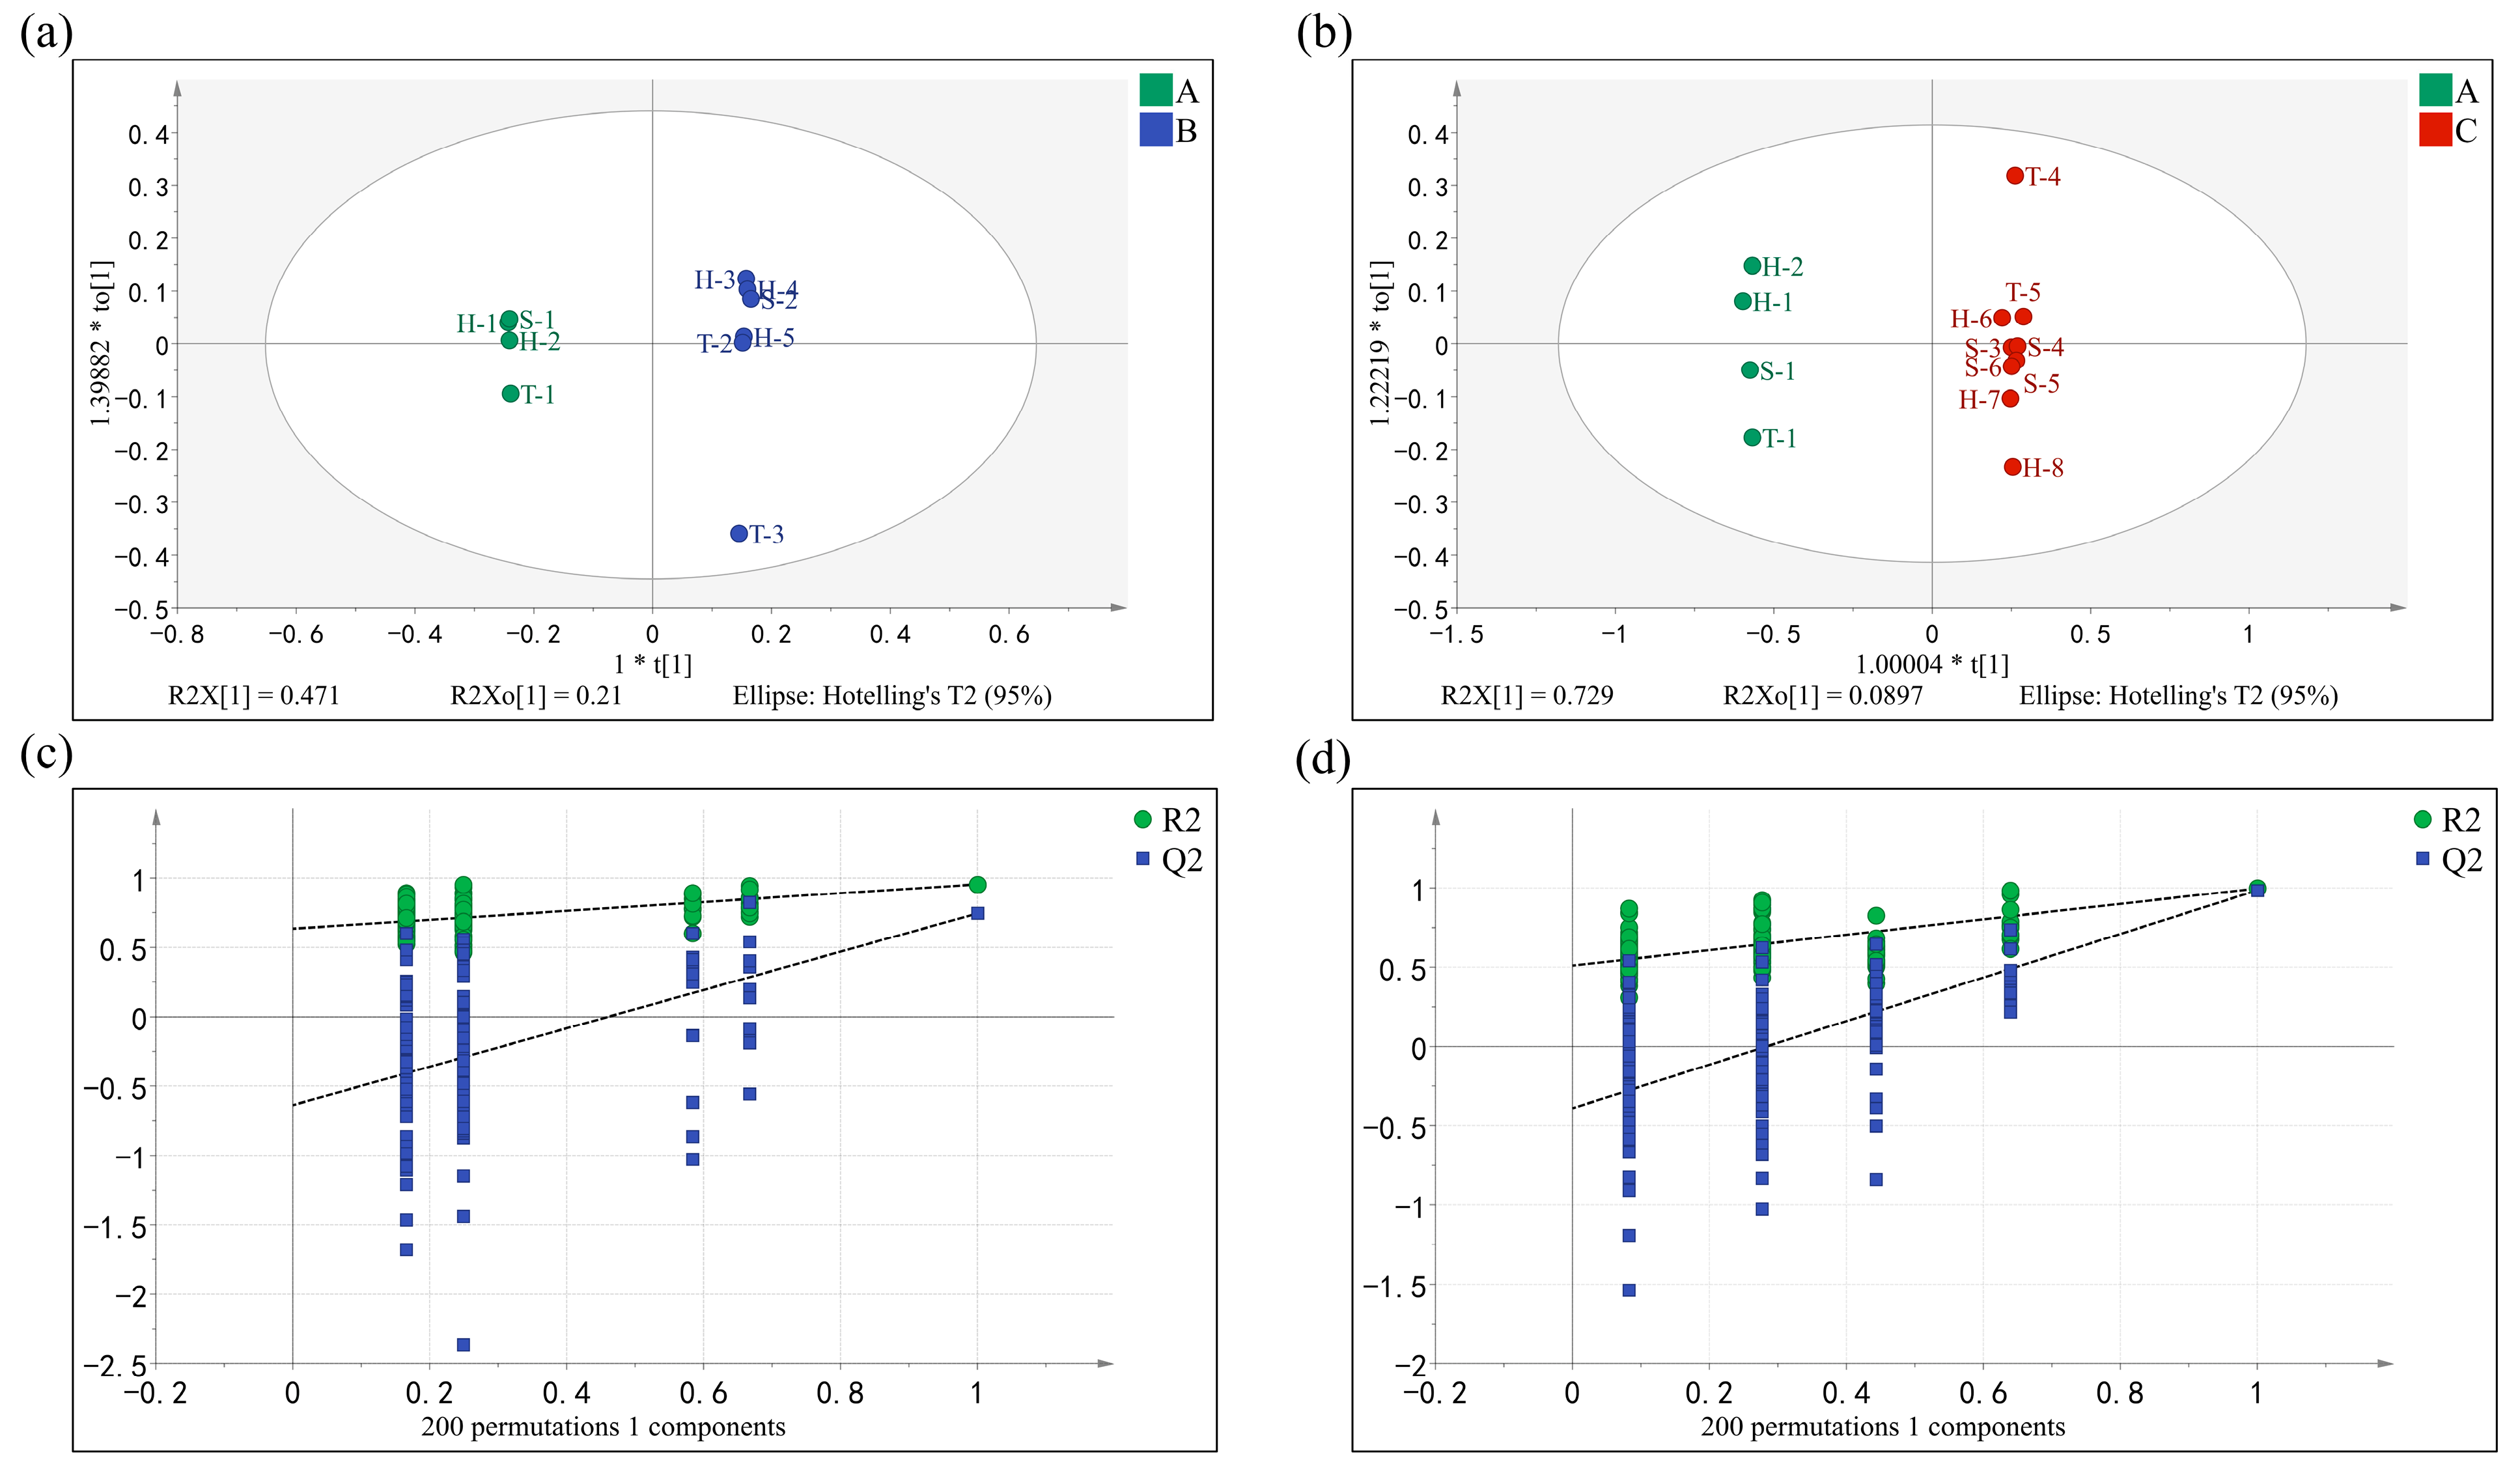
2.6. Identification of Grade A Taste Markers by PCA and OPLS-DA
3. Materials and Methods
3.1. Samples
3.2. Chemicals
3.3. Sample Pretreatment
3.4. Sensory Evaluation
3.5. Odor Components Detection
3.5.1. Solid-Phase Micro Extraction (SPME)
3.5.2. GC×GC-O-MS Detection of Odor Components
3.6. Taste Components’ Detection
3.6.1. HPLC–MS Detection of Phenolic Compounds
3.6.2. HPLC Detection of Amino Acids
3.7. Data Analysis
4. Conclusions
Author Contributions
Funding
Institutional Review Board Statement
Informed Consent Statement
Data Availability Statement
Conflicts of Interest
Appendix A

| Factor | Grade | Quality Characteristics | Score |
|---|---|---|---|
| Taste | A | sweet and fresh or fresh and mellow, heavy and mellow, mellow and thick, fresh and brisk | 90~99 |
| B | clean and brisk, strong and slightly mellow, slightly mellow and thick | 80~89 | |
| C | slightly mellow, strong and astringent, grassy and astringent | 70~79 | |
| Odor | A | high fresh, chestnut-like/tender/orchid-like aroma | 90~99 |
| B | fresh, tender or high-fired aroma | 80~89 | |
| C | less pure, dull odor, over-fired aroma | 70~79 |
Appendix B
| Odor-Active Compound | Identification Method | Odor | log3 FD | ||
|---|---|---|---|---|---|
| H-1 Tea | T-1 Tea | S-1 Tea | |||
| 2-methyl butyraldehyde | MS/RI/O | cocoa | 1 | 1 | 1 |
| 1-penten-3-one | MS/RI/O | peppery | 1 | - | 1 |
| hexanal | MS/RI/O | grass | 3 | - | 3 |
| 3-octanol | MS/RI/O | mushroom | 2 | 1 | 1 |
| phenethyl alcohol | MS/RI/O | floral | 2 | 2 | 2 |
| linalool | MS/RI/O | floral, lavender | 3 | 3 | 3 |
| (E)-2-pentenal | MS/RI/O | fruity | 1 | - | - |
| (E)-2-octenal | MS/RI/O | nut | 1 | 1 | 1 |
| furfural | MS/RI/O | sweet, baked bread | 1 | 1 | 1 |
| benzaldehyde | MS/RI/O | bitter almond | 1 | 1 | 2 |
| β-cyclocitral | MS/RI/O | herbal | 2 | 2 | 2 |
| hotrienol | MS/RI/O | floral | 1 | - | 2 |
| D-limonene | MS/RI/O | citrus orange | 1 | 2 | 2 |
| β-myrcene | MS/RI/O | balsamic | 3 | 3 | - |
| butyl hexanoate | MS/RI/O | fruity | - | 1 | - |
| α-terpineol | MS/RI/O | pine | 1 | 1 | - |
| cis-3-hexenyl hexanoate | MS/RI/O | fruity | 1 | 1 | - |
| (E)-methyl geranate | MS/RI/O | refreshing | 1 | - | - |
| ethyl acetate | MS/RI/O | fruity | - | - | 2 |
| (E,E)-2,4-heptadienal | MS/RI/O | fatty | 1 | 1 | 1 |
| valeraldehyde | MS/RI/O | malt | 1 | 1 | 1 |
| heptanal | MS/RI/O | citrus | 1 | 1 | 1 |
References
- Zhang, L.; Ho, C.T.; Zhou, J.; Santos, J.S.; Armstrong, L.; Granato, D. Chemistry and Biological Activities of Processed Camellia sinensis Teas: A Comprehensive Review. Compr. Rev. Food Sci. Food Saf. 2019, 18, 1474–1495. [Google Scholar] [CrossRef]
- Wang, M.; Yang, R.J.; Zhao, W. Effects of Heat and Pulsed Electric Fields on Bioactive Components and Color of Green Tea Infusions. Int. J. Food Eng. 2008, 4. [Google Scholar] [CrossRef]
- Zhu, Y.; Yan, H.; Zhang, Z.-F.; Zeng, J.-M.; Zhang, Y.; Wang, J.-T.; Ma, W.-J.; Wang, M.-Q.; Peng, Q.-H.; Lv, H.-P.; et al. Assessment of the contribution of chiral odorants to aroma property of baked green teas using an efficient sequential stir bar sorptive extraction approach. Food Chem. 2021, 365, 130615. [Google Scholar] [CrossRef] [PubMed]
- GB/T 23776-2018; Methodology for Sensory Evaluation of Tea. China National Standardization Administration: Beijing, China, 2018.
- Zhai, X.; Zhang, L.; Granvogl, M.; Ho, C.-T.; Wan, X. Flavor of tea (Camellia sinensis): A review on odorants and analytical techniques. Compr. Rev. Food Sci. Food Saf. 2022, 21, 3867–3909. [Google Scholar] [CrossRef] [PubMed]
- Yin, X.-L.; Fu, W.-J.; Chen, Y.; Zhou, R.-F.; Sun, W.; Ding, B.; Peng, X.-T.; Gu, H.-W. GC-MS-based untargeted metabolomics reveals the key volatile organic compounds for discriminating grades of Yichang big-leaf green tea. Lwt-Food Sci. Technol. 2022, 171, 114148. [Google Scholar] [CrossRef]
- Guo, X.; Long, P.; Meng, Q.; Ho, C.-T.; Zhang, L. An emerging strategy for evaluating the grades of Keemun black tea by combinatory liquid chromatography-Orbitrap mass spectrometry-based untargeted metabolomics and inhibition effects on alpha-glucosidase and alpha-amylase. Food Chem. 2018, 246, 74–81. [Google Scholar] [CrossRef]
- Zhang, L.; Cao, Q.-Q.; Granato, D.; Xu, Y.-Q.; Ho, C.-T. Association between chemistry and taste of tea: A review. Trends Food Sci. Technol. 2020, 101, 139–149. [Google Scholar] [CrossRef]
- Zheng, X.-Q.; Li, Q.-S.; Xiang, L.-P.; Liang, Y.-R. Recent Advances in Volatiles of Teas. Molecules 2016, 21, 338. [Google Scholar] [CrossRef]
- Wang, K.B.; Liu, F.; Liu, Z.H.; Huang, J.A.; Xu, Z.X.; Li, Y.H.; Chen, J.H.; Gong, Y.S.; Yang, X.H. Comparison of catechins and volatile compounds among different types of tea using high performance liquid chromatograph and gas chromatograph mass spectrometer. Int. J. Food Sci. Technol. 2011, 46, 1406–1412. [Google Scholar] [CrossRef]
- Yu, P.; Yeo, A.S.-L.; Low, M.-Y.; Zhou, W. Identifying key non-volatile compounds in ready-to-drink green tea and their impact on taste profile. Food Chem. 2014, 155, 9–16. [Google Scholar] [CrossRef]
- Zhang, Y.-N.; Yin, J.-F.; Chen, J.-X.; Wang, F.; Du, Q.-Z.; Jiang, Y.-W.; Xu, Y.-Q. Improving the sweet aftertaste of green tea infusion with tannase. Food Chem. 2016, 192, 470–476. [Google Scholar] [CrossRef]
- Scharbert, S.; Hofmann, T. Molecular definition of black tea taste by means of quantitative studies, taste reconstitution, and omission experiments. J. Agric. Food Chem. 2005, 53, 5377–5384. [Google Scholar] [CrossRef] [PubMed]
- Deng, S.; Zhang, G.; Aluko, O.O.; Mo, Z.; Mao, J.; Zhang, H.; Liu, X.; Ma, M.; Wang, Q.; Liu, H. Bitter and astringent substances in green tea: Composition, human perception mechanisms, evaluation methods and factors influencing their formation. Food Res. Int. 2022, 157, 111262. [Google Scholar] [CrossRef] [PubMed]
- Xu, Y.-Q.; Zhang, Y.-N.; Chen, J.-X.; Wang, F.; Du, Q.-Z.; Yin, J.-F. Quantitative analyses of the bitterness and astringency of catechins from green tea. Food Chem. 2018, 258, 16–24. [Google Scholar] [CrossRef] [PubMed]
- Narukawa, M.; Kimata, H.; Noga, C.; Watanabe, T. Taste characterisation of green tea catechins. Int. J. Food Sci. Technol. 2010, 45, 1579–1585. [Google Scholar] [CrossRef]
- Kubo, T.; Fujiwara, T.; Tomizawa, Y. Evaluation of Astringency and Umami of Green Tea Infusions with Different Elution Conditions Using a Taste Sensor System. J. Jpn. Soc. Food Sci. Technol. 2014, 61, 192–198. [Google Scholar] [CrossRef]
- Wu, C.Y.; Xu, H.R.; Heritier, J.; Andlauer, W. Determination of catechins and flavonol glycosides in Chinese tea varieties. Food Chem. 2012, 132, 144–149. [Google Scholar] [CrossRef]
- Wang, L.; Xu, R.J.; Hu, B.; Li, W.; Sun, Y.; Tu, Y.Y.; Zeng, X.X. Analysis of free amino acids in Chinese teas and flower of tea plant by high performance liquid chromatography combined with solid-phase extraction. Food Chem. 2010, 123, 1259–1266. [Google Scholar] [CrossRef]
- Su, D.; He, J.-J.; Zhou, Y.-Z.; Li, Y.-L.; Zhou, H.-J. Aroma effects of key volatile compounds in Keemun black tea at different grades: HS-SPME-GC-MS, sensory evaluation, and chemometrics. Food Chem. 2022, 373, 131587. [Google Scholar] [CrossRef]
- Han, Z.; Wen, M.; Zhang, H.; Zhang, L.; Wan, X.; Ho, C.-T. LC-MS based metabolomics and sensory evaluation reveal the critical compounds of different grades of Huangshan Maofeng green tea. Food Chem. 2022, 374, 131796. [Google Scholar] [CrossRef]
- Yue, W.; Sun, W.; Rao, R.S.P.; Ye, N.; Yang, Z.; Chen, M. Non-targeted metabolomics reveals distinct chemical compositions among different grades of Bai Mudan white tea. Food Chem. 2019, 277, 289–297. [Google Scholar] [CrossRef] [PubMed]
- Marti, M.P.; Mestres, M.; Sala, C.; Busto, O.; Guasch, J. Solid-phase microextraction and gas chromatography olfactometry analysis of successively diluted samples. A new approach of the aroma extract dilution analysis applied to the characterization of wine aroma. J. Agric. Food Chem. 2003, 51, 7861–7865. [Google Scholar] [CrossRef]
- Schuh, C.; Schieberle, P. Characterization of the key aroma compounds in the beverage prepared from Darjeeling black tea: Quantitative differences between tea leaves and infusion. J. Agric. Food Chem. 2006, 54, 916–924. [Google Scholar] [CrossRef] [PubMed]
- Jezussek, M.; Juliano, B.O.; Schieberle, P. Comparison of key aroma compounds in cooked brown rice varieties based on aroma extract dilution analyses. J. Agric. Food Chem. 2002, 50, 1101–1105. [Google Scholar] [CrossRef] [PubMed]
- Panpan, L.; Pengcheng, Z.; Ziming, G.; Zerui, C.; Fangjun, S.; Bo, H.; Lin, F.; Shiwei, G.; Lin, Z. Analysis of aroma characteristics and volatile components of Juhong tea, manufactured from black tea with added citrus peel. Food Sci. China 2021, 42, 198–205. [Google Scholar] [CrossRef]
- Zhu, Y.; Lv, H.-P.; Shao, C.-Y.; Kang, S.; Zhang, Y.; Guo, L.; Dai, W.-D.; Tan, J.-F.; Peng, Q.-H.; Lin, Z. Identification of key odorants responsible for chestnut-like aroma quality of green teas. Food Res. Int. 2018, 108, 74–82. [Google Scholar] [CrossRef]
- Kato, M.; Shibamoto, T. Variation of major volatile constituents in various green teas from southeast Asia. J. Agric. Food Chem. 2001, 49, 1394–1396. [Google Scholar] [CrossRef]
- Miyata, Y.; Tanaka, T.; Tamaya, K.; Matsui, T.; Tamaru, S.; Tanaka, K. Effects of the Firing Process on Sensory Testing and Aromatic Compounds of a Mixed Fermented Tea Product Obtained by Kneading Third-crop Green Tea and Loquat Leaves. J. Jpn. Soc. Food Sci. Technol. 2013, 60, 110–116. [Google Scholar] [CrossRef]
- Kang, C.; Zhang, Y.; Zhang, M.; Qi, J.; Zhao, W.; Gu, J.; Guo, W.; Li, Y. Screening of specific quantitative peptides of beef by LC-MS/MS coupled with OPLS-DA. Food Chem. 2022, 387, 132932. [Google Scholar] [CrossRef]
- He, X.; Yangming, H.; Gorska-Horczyczak, E.; Wierzbicka, A.; Jelen, H.H. Rapid analysis of Baijiu volatile compounds fingerprint for their aroma and regional origin authenticity assessment. Food Chem. 2021, 337, 128002. [Google Scholar] [CrossRef]
- Szeto, S.S.W.; Reinke, S.N.; Sykes, B.D.; Lemire, B.D. Mutations in the Saccharomyces cerevisiae Succinate Dehydrogenase Result in Distinct Metabolic Phenotypes Revealed Through H-1 NMR-Based Metabolic Footprinting. J. Proteome Res. 2010, 9, 6729–6739. [Google Scholar] [CrossRef] [PubMed]
- Hidalgo, M.J.; Pozzi, M.T.; Furlong, O.J.; Marchevsky, E.J.; Pellerano, R.G. Classification of organic olives based on chemometric analysis of elemental data. Microchem. J. 2018, 142, 30–35. [Google Scholar] [CrossRef]
- Lu, M.-J.; Chu, S.-C.; Yan, L.; Chen, C. Effect of tannase treatment on protein-tannin aggregation and sensory attributes of green tea infusion. Lwt-Food Sci. Technol. 2009, 42, 338–342. [Google Scholar] [CrossRef]
- Yang, P.; Song, H.; Lin, Y.; Guo, T.; Wang, L.; Granvogl, M.; Xu, Y. Differences of characteristic aroma compounds in Rougui tea leaves with different roasting temperatures analyzed by switchable GC-O-MS and GC x GC-O-MS and sensory evaluation. Food Funct. 2021, 12, 4797–4807. [Google Scholar] [CrossRef] [PubMed]


| Sample 1 | Market Grade 2 | Abbreviation | Score 3 | Grade 4 |
|---|---|---|---|---|
| H tea | Best Class | H-1 | 92 ± 0.3 | A |
| Super class Grade A | H-2 | 96 ± 0.5 | A | |
| Super class Grade B | H-3 | 85 ± 0.2 | B | |
| Super class Grade C | H-4 | 82 ± 0.4 | B | |
| Super class | H-5 | 83 ± 0.3 | B | |
| First class Grade A | H-6 | 75 ± 0.8 | C | |
| First class Grade B | H-7 | 76 ± 0.9 | C | |
| Second class | H-8 | 72 ± 0.4 | C | |
| T tea | Best Class | T-1 | 93 ± 0.1 | A |
| Super class Grade A | T-2 | 87 ± 0.5 | B | |
| Super class Grade B | T-3 | 84 ± 1.1 | B | |
| Super class | T-4 | 74 ± 0.3 | C | |
| First class | T-5 | 73 ± 0.2 | C | |
| S tea | Super class Grade A | S-1 | 94 ± 0.2 | A |
| Super class Grade B | S-2 | 83 ± 0.7 | B | |
| First class | S-3 | 74 ± 0.4 | C | |
| First class Grade A | S-4 | 75 ± 0.6 | C | |
| First class Grade B | S-5 | 72 ± 0.3 | C | |
| First class Grade C | S-6 | 78 ± 0.2 | C |
Disclaimer/Publisher’s Note: The statements, opinions and data contained in all publications are solely those of the individual author(s) and contributor(s) and not of MDPI and/or the editor(s). MDPI and/or the editor(s) disclaim responsibility for any injury to people or property resulting from any ideas, methods, instructions or products referred to in the content. |
© 2023 by the authors. Licensee MDPI, Basel, Switzerland. This article is an open access article distributed under the terms and conditions of the Creative Commons Attribution (CC BY) license (https://creativecommons.org/licenses/by/4.0/).
Share and Cite
Zou, Y.; Tang, C.; Yang, X.; Guo, T.; Song, H. Discovery and Flavor Characterization of High-Grade Markers in Baked Green Tea. Molecules 2023, 28, 2462. https://doi.org/10.3390/molecules28062462
Zou Y, Tang C, Yang X, Guo T, Song H. Discovery and Flavor Characterization of High-Grade Markers in Baked Green Tea. Molecules. 2023; 28(6):2462. https://doi.org/10.3390/molecules28062462
Chicago/Turabian StyleZou, Yushi, Chen Tang, Xinyu Yang, Tianyang Guo, and Huanlu Song. 2023. "Discovery and Flavor Characterization of High-Grade Markers in Baked Green Tea" Molecules 28, no. 6: 2462. https://doi.org/10.3390/molecules28062462
APA StyleZou, Y., Tang, C., Yang, X., Guo, T., & Song, H. (2023). Discovery and Flavor Characterization of High-Grade Markers in Baked Green Tea. Molecules, 28(6), 2462. https://doi.org/10.3390/molecules28062462