Abstract
The reaction of ethanol with a surface of CeO2 was studied using IR spectroscopy. In some experiments, CeO2 was pretreated in a vacuum at 820 K which caused a partial reduction. In other experiments, CeO2 was reduced with hydrogen at 770 K. We also used CeO2 oxidized by oxygen treatment at 670 K. At low coverages, ethoxy groups and new surface OH groups were formed and water was not produced. On the other hand, at higher loading surfaces, Ce-OH was consumed and ethoxy groups and water were formed. Three kinds of ethoxyls were found on CeO2: monodentate, bidentate, and tridentate ones. They were characterized by various frequencies of symmetrical, asymmetrical, and combinational bands of C-C-O units. The reduction of CeO2 increased the contribution of tridentate ethoxyls and the oxidation increased the contribution of monodentate ones. At higher temperatures, ethoxy groups were oxidized to acetate ions with the formation of new surface OH groups. Monodentate ethoxyls were the most reactive and tridentate ones were the least reactive during oxidation. The amounts of acetate species were the highest for the oxidized CeO2.
1. Introduction
Hydrogen may be considered as a very promising fuel, so the production of hydrogen is an important challenge of technology and science. One of the most important methods of hydrogen production is the steam reforming of alcohols. Most studies have been conducted with two alcohols: methanol and ethanol. The advantage of methanol is its easy and efficient production from syngas sources that can be derived from the steam reforming of hydrocarbons or the gasification of coal. Ethanol, on the other hand, is receiving interest as a bio-fuel produced from the fermentation of corn and other renewable resources [1,2,3,4].
Most probably, the most important catalytic systems for hydrogen production from alcohols are M/ZnO (M = Cu, Pd) and M/CeO2 systems typically promoted by Pt, Pd, or other metals [5,6,7,8,9,10,11,12,13,14,15].
The present study concerns the adsorption and transformations of ethanol on CeO2. CeO2 has surface centered fluorite type structure which consists of cubic close-packed array of Ce4+ cations with all tetrahedral holes occupied by oxygen [16,17]. Surface Ce4+ can be reduced to Ce3+ in reductive conditions and CeO2−x (0 < x < 0.5) is formed with oxygen vacancies. This makes the reversible addition and abstraction of oxygen possible. The heating of CeO2 above 921 K produces CeO2−y (0 < y < 0.18) [18]. In such a phase, the cation sublattice is unchanged and oxygen vacancies are formed. The ease of the reversible abstraction and addition of oxygen means that CeO2 may play the role of an oxygen storage system in numerous catalytic reactions.
One of the catalytic systems in which CeO2 is involved is a three-way converter [19,20,21,22] which make a significant contribution to reducing emission levels by converting hydrocarbons, CO, and NOx into nontoxic compounds. The oxidative properties of CeO2 and CeO2-containing materials were used for the oxidation of some organic compounds [23,24,25]. As mentioned above, another catalytic process based on CeO2 is the steam reforming of alcohols and hydrogen production. A lot of the studies on the transformations of methanol and ethanol on CeO2 were conducted by Idriss et al. [17,26,27,28,29], Lamotte [30], Binet [31], and Badri [32], as well as other authors [33]. Idriss and collaborators completed complex studies on ethanol transformations on CeO2 and CeO2 with metals (Pt, Pd, Rh, Au) using IR, TPD, and XPS methods, as well as in catalytic experiments. These authors reported the formation of mono- and bidentate ethoxy groups characterized by 1107 and 1057 cm−1 IR bands on the (111) and (310) surfaces of CeO2. Ethoxy groups on CeO2 were already oxidized to acetate ions at room temperature and to carbonate species above 470 K. The presence of noble metals caused the lowering of the IR frequencies of both monodentate and bidentate ethoxyls, which was interpreted as an increase in the strength of the interaction of ethoxyls with the surface. The addition of Pd changed also the process of oxidation of ethoxy species and ethanol. Higher temperatures were needed to obtain acetate ions, and acetaldehyde was produced. Acetaldehyde was not formed without Pd. Ethoxy groups were also produced on H2-reduced CeO2, but they were not oxidized at low temperatures.
Lamotte [30], Binet [31], and Badri [32] completed extensive IR studies on methoxy groups on CeO2 as well as the properties of OH groups on unreduced, reduced, and oxidized CeO2. The reaction of methoxy groups with CO2 producing methyl carbonate was also studied. These authors revealed that fully oxidized CeO2 practically did not contain any surface hydroxyls. H2-treated CeO2 showed four kinds of hydroxyls denoted as OH I (IR band 3730 cm−1), two kinds of OH II (OH II A and OH II B—IR bands at 3660 and 3650 cm−1, respectively), and OH III (IR band 3600 cm−1). The proportion of the amounts of these hydroxyls varied upon hydrogen treatment and upon evacuation. The reaction of methanol with CeO2 produced methoxy groups: monodentate, two kinds of bidentate species, and tridentate, characterized by IR bands at 1106, 1062, 1042, and 1015 cm−1, respectively. The reduction of CeO2 converted monodentate methoxyls into tridentate ones. This process was found to be reversible in the presence of oxygen. Only monodentate methoxyls could react with CO2 forming methyl carbonate. Badri et al. [26] also completed quantitative IR studies on methanol adsorption on CeO2. The extinction coefficients of the C-O band and the concentration of methoxy groups were determined.
In this study, using IR spectroscopy, we followed the reaction of ethanol with CeO2 surface sites and especially the formation, speciation, and oxidation of ethoxy groups on unreduced, reduced and oxidized CeO2. As mentioned above, Lamotte [30], Binet [31], and Badri [32] completed complex IR studies on the interaction of methanol on CeO2; however, there was a deficiency of complex IR studies on the ethanol reaction on ceria. Even though Idriss et al. [17,26,29], as well as Jacobs et al. [5], conducted an extensive study on the ethanol transformations on CeO2, including IR experiments, there was a lack of data concerning the reactions of ethanol with surface OH groups and the speciation of ethoxyl groups.
The IR studies of ethanol reactions are a more difficult task than those of methanol transformations because the IR spectrum of ethoxyl groups is more complicated than that of methoxyl groups. While the vibration of C-O fragments in methoxy groups gives only one IR band around 1000 cm−1, the vibration of C-C-O entity in ethoxyls gives two bands of symmetric and asymmetric vibration around 900 and 1050 cm−1, respectively. Moreover, a third band in this region (at ca. 1100 cm−1) is present. This last band was interpreted [34] as the combination of two vibrations: the deformation (δ) of M-O-C and rocking (r) of a CH3 group: δM-O-C + r║CH3.
2. Results and Discussion
2.1. Effect of Calcination Temperature
The XRD pattern of our CeO2 is presented in Figure 1A and the morphology is given in Figure 1B. The diffractogram displays reflections due to the presence of a well-ordered cubic CeO2 phase of nanocrystalline character, crystalized in the Fm-3m symmetry [ICDD PDF-4+ 2015 01-075-9470]. SEM analysis reveals that the sample is composed of fine crystallites, with sizes ranging from 18–26 nm (well visible in Figure 1B) which is in line with our XRD calculation of average crystallite size. The surface area determined by N2 adsorption was 63 m2/g.
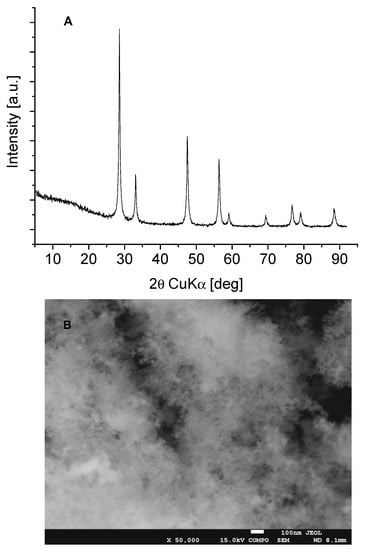
Figure 1.
(A)—XRD patterns and (B)—SEM image of CeO2 sample.
It is well known that strongly basic CeO2 adsorbs atmospheric CO2 forming carbonate species. In order to find the optimal conditions of pretreatment, CeO2 was calcined in a vacuum at 370, 470, 570, 670, and 820 K. The spectra of such treated CeO2 are presented in Figure 2. The calcination above 570 K causes the disappearance of some bands in the region of 1400–1700 cm−1 due to the decomposition of carbonates. The decomposition of carbonates was also evidenced in TPD experiments which showed the desorption of CO2 during heating (Figure 3). Heating above 570 K causes only small changes in the spectra. In most of the further experiments, CeO2 was pre-treated at 570 K in a vacuum.
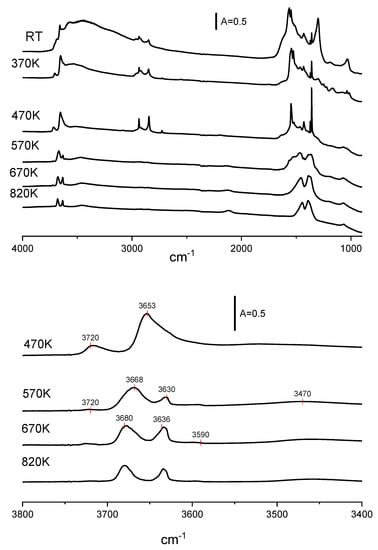
Figure 2.
The spectra of OH groups on CeO2 activated in a vacuum at various temperatures.
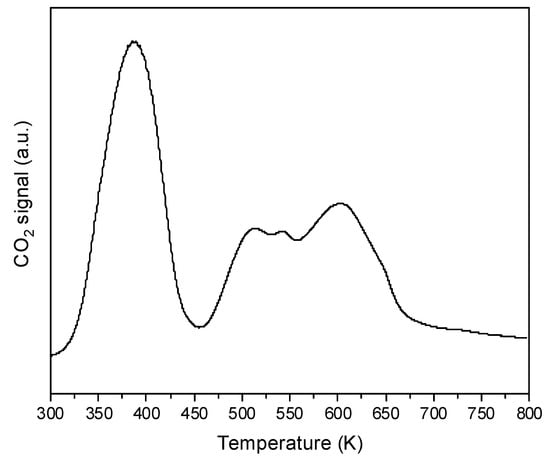
Figure 3.
TPD diagram of CO2 desorption from CeO2.
The spectra of OH groups also change upon evacuation at high temperatures. Two distinct bands are present upon evacuation at 470 K. According to Jacobs et al. [12], they may be assigned to OH (I) (3720 cm−1) and to OH (II) (3653 cm−1). The last band is broad and most probably it is composed of several submaxima. At a temperature of 570 K and higher, the OH (II) band splits as well as the OH (II A) 3668 cm−1 and OH (II B 3630 cm−1) bands. A weak OH (III) band at 3590 cm−1 is also present. The analysis of the OH (II A) band shows that it is composed of two submaxima around 3680 and 3668 cm−1. The hydroxyls at 3668 cm−1 are more prone to dihydroxylation and they disappear upon calcination at 670 K. Two distinct bands of OH (IIA) and OH (IIB) at 3680 and 3636 cm−1, respectively, are clearly seen upon activation at 820 K, together with weak bands of OH (I) and OH (III) at 3720 and 3590 cm−1. The broad and very weak band around 3470 cm−1 was attributed to an oxyhydroxy species [31,35].
The spectra of CeO2 calcined at 570 K and above show a band at 2126 cm−1. The interpretation of the band was discussed by Binet et al. [31]. These authors proposed the electronic origin of this band, either an electronic transition from donor levels located near the conduction band, such as Ce3+ or oxygen vacancies [36], or the forbidden 2F5/2 → 2F7 /2 electronic transition of Ce3+ located at the subsurface or bulk defective lattice sites [37].
2.2. Reaction of Ethanol with CeO2
The interaction of ethanol with the surface of CeO2 is chemisorption. The reaction of ethanol on the CeO2 surface produces ethoxy groups. In order to follow the properties and reactivity of ethoxy groups, the doses of ethanol were adsorbed, and subsequently, non-reacted ethanol was removed by evacuation at 370 K. The results presented in Figure 4 evidence that the evacuation at 370 K was sufficient to remove unreacted ethanol—the δ OH band of the deformation vibrations of molecular ethanol at 1270 cm−1 disappeared upon the evacuation at this temperature.
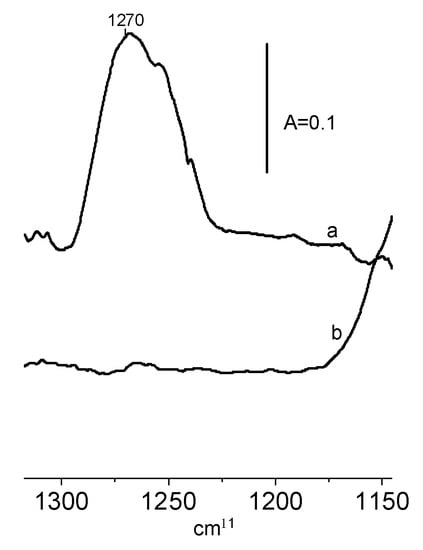
Figure 4.
The spectra recorded upon the adsorption of ethanol on CeO2 at RT (a), and upon the evacuation at 370 K (b).
The spectra recorded upon the adsorption of several doses of ethanol on CeO2 activated at 570 K are presented in Figure 5A,B. The bands at the regions 850–950 cm−1 and 1000–1080 cm−1 are assigned to the symmetric and asymmetric vibrations of C-C-O fragments, respectively. The bands in the 1080–1150 cm−1 region may be assigned to combination vibrations δM-O-C + r║CH3 [28]. In each of these regions, three narrow maxima are seen.
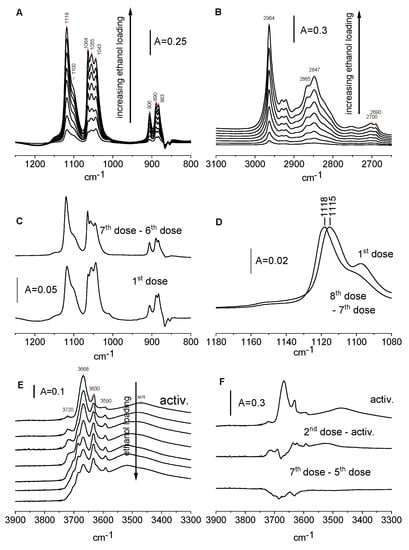
Figure 5.
(A,B)—The spectra of ethoxy groups on CeO2 formed upon the adsorption of ethanol. (C,D)—The spectra of ethoxy groups on CeO2 formed by the adsorption of the 1st dose of ethanol and difference spectra (8th dose minus 7th dose). (E)—The spectra of OH groups on CeO2 and spectra recorded upon the adsorption of ethanol. (F)—The spectrum of OH groups on CeO2 and difference spectra: second dose minus activated sample and seventh dose minus fifth dose.
They are clearly seen for the symmetric and asymmetric vibrations of C-C-O and it is probable that the broad shoulder around 950–1100 cm−1 is composed of two submaxima. By analogy with the spectra of the methoxy groups on CeO2 [32], we assign the bands at 906, 1064, and 1118 cm−1 bands to monodentate, the bands at 890 and 1055 cm−1 to bidentate, and the bands at 883 and 1043 cm−1 to tridentate ethoxyls. We suppose that the broad shoulder at 1090–1100 cm−1 is a superposition of combinational bands of bi- and tridentate ethoxyls. In the region of C-H vibrations, the bands of CH2 (2847 cm−1), and CH3 asym. (2964 cm−1). The frequencies of the bands are listed in Table 1, Table 2 and Table 3. The maxima 2690–2700 cm−1 are the result of the Fermi resonance of the C-H deformation vibration.

Table 1.
The frequencies of monodentate, bidentate, and tridentate ethoxy groups.

Table 2.
The frequencies of C-C-O asymmetric bands of ethoxy groups formed of non-reduced, reduced and oxidized CeO2.

Table 3.
The frequencies of CH3 and CH2 groups.
Figure 5C shows the spectra recorded upon the adsorption of the first dose of ethanol adsorbed on CeO2 and the difference spectra: the difference between the last dose and before the last dose of ethanol. Comparing these spectra suggests that tridentate ethoxyls are formed in the first order at lower coverage, whereas monodentate species are formed at the second order. The results presented in Figure 5D concern a combination band of monodentate ethoxyls. This band shifts from 1115 to 1118 cm−1 with an increase in the loading. It suggests the presence of several kinds of Ce sites bonding the monodentate ethoxy groups with various frequencies of combination bands.
The spectra of Ce-OH groups upon the reaction with ethanol are presented in Figure 5E and the difference spectra are in Figure 5F.
According to the data presented in Figure 5F, the adsorption of the first doses of ethanol resulted in the formation of new hydroxyl groups. It may be supposed that the following reaction takes place:
CeOCe + HOC2H5 = Ce-OH + Ce-O-C2H5
The adsorption of further doses of ethanol consumes Ce-OH groups according to the scheme:
Ce-OH + HOC2H5 = Ce-OC2H5 + H2O
In order to confirm these hypothetical mechanisms, we conducted experiments, the goal of which was to test if water was definitely formed. In the first experiment, the products of the reaction of the first dose of ethanol were desorbed into the cold trap, and subsequently, they were adsorbed on an activated zeolite disc. A similar procedure was applied in the case of adsorption of the 8th dose. The results are presented in Figure 6. At a low loading of ethanol (spectrum a), water was practically not formed (the band deformation of H2O at 1630 cm−1 was very small) which agrees with the fact that new hydroxyls were formed and confirms mechanism 1. On the other hand, the 1630 cm−1 band was present at higher loadings of ethanol (spectrum b) which agrees with the fact that surface hydroxyls were consumed forming water and confirmed mechanism 2.
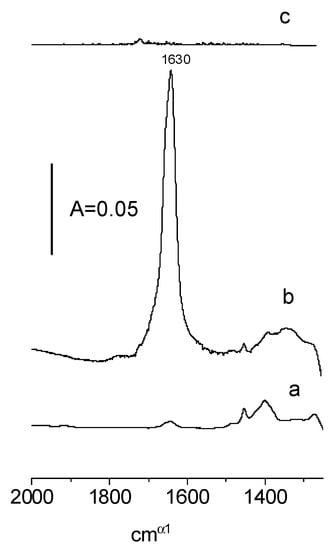
Figure 6.
The IR spectra of the products of the reaction of the 1st (a) and 8th dose (b) of ethanol on CeO2, as well as the products of the oxidation of ethoxyl groups (c). These products were adsorbed on zeolite NaY.
2.3. Effect of Reduction of CeO2 on the Formation of Ethoxy Groups
According to [18], the calcination of CeO2 causes the loss of oxygen and CeO2−y (0 < y < 0.18) is formed. In our study, the CeO2 was calcined in a vacuum at 820 K, i.e., we obtained a partially reduced sample. We studied also CeO2 treated with hydrogen at 770 K for 1 h. After evacuation, the sample was treated with hydrogen at 770 K once more and finally was evacuated at 670 K. Such a sample was reduced to a bigger extent than the one which was calcined at 820 K only.
The spectra of OH groups on the surface of reduced CeO2 are presented in Figure 7A. Activation at 820 K (spectrum b) causes the dehydroxylation and loss of 3668 cm−1 hydroxyls. Reduction with hydrogen (spectrum c) does not change the hydroxyls vibrating at 3680 cm−1 (OH II A) but increases the concentration of OH II B (3636 cm−1). This may be the result of the reduction of CeO2 and the formation of new hydroxyls. The band of OH II B shifts from 3631 to 3636 cm−1.
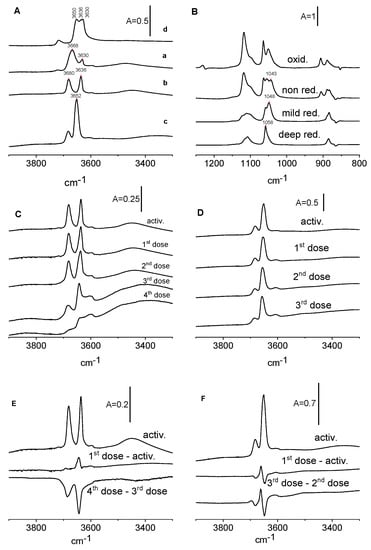
Figure 7.
(A)—IR spectra of OH groups on non-reduced CeO2 (activated at 570 K) (a), mildly reduced (activated at 820 K) (b), deeply reduced by hydrogen at 770 K (c), and oxidized by oxygen at 670 K (d). (B)—ethoxy groups formed on non-reduced CeO2, mildly reduced, deeply reduced, and oxidized. (C,D)—OH groups on CeO2 mildly reduced (C) and deeply reduced (D) upon the adsorption of ethanol. (E)—The spectrum of OH groups on mildly reduced CeO2 and difference spectra: first dose minus activated sample as well as 4th dose minus 3rd dose of ethanol. (F)—The spectrum of OH groups on deeply reduced CeO2 and difference spectra: first dose minus activated sample as well as 3rd dose minus 2nd dose of ethanol.
Ethanol was subsequently adsorbed on reduced samples of CeO2. The spectra of ethoxy groups are presented in Figure 7B and the spectra of OH groups are given in Figure 7C,D. According to the data presented in Figure 7B, the mild reduction by calcination at 820 K caused the distinct decrease in the amount of monodentate ethoxy groups, whereas on the deeply reduced CeO2 surface, the adsorption of ethanol lead to the formation of only tridentate ethoxyls. A more significant reduction by hydrogen treatment also caused the loss of most of the bidentate ethoxyls, with little more than tridentate ethoxyls remaining. A similar situation was observed by Binet et al. [31] for methoxy groups. These authors reported that the reduction of CeO2 converted monodentate methoxyls into tridentate ones. This process was found to be reversible in the presence of oxygen [31].
Figure 7C,D present the spectra of OH groups in reduced CeO2 before and after the reaction with ethanol. The difference spectra are shown as well (Figure 7E,F). As mentioned, CeO2 that was moderately reduced by activation at 820 K shows distinct OH bands of OH(IIA) and OH(2B) at 3680 and 3636 cm−1 and smaller bands of OH(1) and OH(III). The band of OH(I) is smaller than that before the reduction. It is possible that the distinct decrease in the amount of monodentate ethoxy groups may be related to the elimination of OH (I) by dehydroxylation.
The analysis of difference spectra (Figure 7E,F) suggests that in CeO2 which is mildly reduced by the activation (similarly to non-reduced CeO2) of the first doses of ethanol at 820 K, new hydroxyls are produced, and the next doses consume OH. For CeO2 deeply reduced by hydrogen all the doses of ethanol consume some hydroxyls and produce new ones, suggesting that both mechanisms 1 and 2 overlap.
2.4. Effect of Oxidation of CeO2 on the Formation of Ethoxy Groups
The oxidation of CeO2 was realized by the treatment of the sample with oxygen at 670 K, which was previously activated in a vacuum at 570 K. After oxygen treatment, CeO2 was evacuated at 570 K.
The oxidation changed the OH groups (Figure 7A). The OH (II A) band at 3680 cm−1 disappeared and the band at 3668 cm−1 shifted to lower frequencies, increasing distinctly, and showed three submaxima at 3630, 3636, and 3650 cm−1. The amount of OH (III) increased significantly.
The spectra of ethoxy groups in non-oxidized and oxidized CeO2 are presented in Figure 7B. The oxidation of CeO2 causes an increase in the amount of monodentate and a decrease in the amount of tridentate ethoxyls.
The analysis of the spectra of OH groups evidenced (spectra not shown) that at lower coverages, some hydroxyls are formed, whereas at higher coverages, hydroxyls are consumed.
Summing up, it can be said that monodentate ethoxyls predominate for oxidized CeO2 and tridentate ones for the reduced samples.
2.5. Frequencies of Ethoxyl Groups
The results obtained in this study enable us to compare the stretching frequencies of mono-, bi-, and tridentate ethoxy groups The frequencies of C-C-O fragments of these species taken from Figure 5A are presented in Table 1. All the frequencies of stretching vibrations are the highest for monodentate ethoxyls and the lowest for tridentate species. This is because the higher the coordination number, the lower the strength of the bonds.
It was also possible to follow the effect of oxidation and reduction of CeO2 on the stretching frequencies of C-C-O fragments in ethoxyls. Figure 7B presents the spectra of ethoxy groups formed on non-reduced, reduced, and oxidized CeO2, and the band frequencies are given in Table 2. According to these data, the reduction of CeO2 caused the increase in stretching frequencies of asymmetric C-C-O units. Similar effects were reported by Binet [31] for methoxy groups. On the other hand, the oxidation of CeO2 causes the decrease in the band frequencies.
The spectra of the CH stretchings of ethoxy groups in non-reduced, reduced, and oxidized CeO2 are presented in Figure 8 and the frequencies of CH2 and CH3 are given in Table 3. Both frequencies are the lowest for reduced and the highest for oxidized CeO2. For CH2, the effect is more significant than for CH2, because the CH2 group is closer to the adsorption site on the CeO2 surface. We suppose that oxidation and reduction change the status of Ce ions (oxidation, coordination, and/or environment) on the surface and changes the properties of ethoxy groups. Another effect that affects the C-H frequencies is the multiplicity of the bonding of Ce-O bonds on the properties of ethoxy groups. It affects the frequencies of both C-C-O and C-H stretching. The information on the effect of the multiplicity of Ce-O bonds on the properties of bonds in C-C-O in ethoxy groups is given in Table 1. Both effects influence the C-H stretching (Table 3).
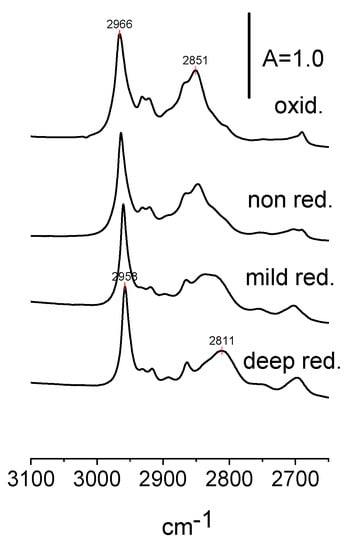
Figure 8.
The bands of CH2 and CH3 groups in ethoxyls formed on the surface of non-reduced, reduced and oxidized CeO2.
2.6. Oxidation of Ethoxy Groups
Ethoxy groups on CeO2 are oxidized to acetate ions. The maxima characteristic of acetate ions appear at 1450 and 1550 cm−1 (symmetric and asymmetric COO− stretching). These maxima are seen in Figure 9A (top spectrum) in which the spectrum of acetic acid adsorbed at room temperature on CeO2 is shown. Weak bands at 1050 and 1020 cm−1 are also present (Figure 9B, bottom spectrum)
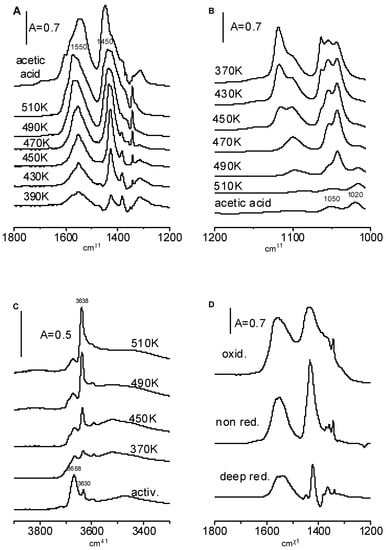
Figure 9.
(A–C)—The spectra recorded upon the formation of ethoxy groups on CeO2 and heating. (D)—The spectra of acetate ions formed on non-reduced, deeply reduced, and oxidized CeO2.
Acetic species were formed when CeO2 was heated with ethoxy species (Figure 9A). The bands of acetic ions increase significantly and the bands of ethoxy groups decrease with the temperature (Figure 9B). The weak band of acetate ions at 1020 cm−1 becomes visible at higher temperatures.
The data presented in Figure 9B evidence that mono-, bi-, and tridentate ethoxyls show various reactivities during oxidation by CeO2. The monodentate ethoxyls are completely oxidized at 470 K. Most of the bidentate ethoxyls are completely oxidized at 490 K and tridentate ethoxyls are oxidized at 510 K.
As mentioned above, the reaction of the first doses of ethanol on the CeO2 surface created new hydroxyls, but the next doses consumed hydroxyls. According to the data presented in Figure 9C, the oxidation of ethoxy groups to acetate ions created OH groups. We suppose that the hydrogen which is released in the process C2H5O-Ce → CH3 COO− + Ce+ reacts with surface oxygens forming hydroxyls. This hypothesis was additionally supported in the experiment in which the products of the oxidation of ethoxy groups and the formation of acetate ions were “trapped” in the cold trap and, subsequently, these products were adsorbed on activated zeolite NaY. The spectrum shown in Figure 6 (spectrum c) evidences that no water was formed; therefore, the hydrogen that was released was engaged in the formation of new hydroxyl groups.
The heating of ethoxy groups on reduced and oxidized CeO2 also produces acetate ions. This is seen in Figure 9D in which the spectra recorded upon the heating of CeO2 with ethoxyl groups to 490 K are presented. The amount of acetate ions is the lowest for the reduced CeO2 and the highest for oxidized CeO2.
3. Materials and Methods
Cerium(IV) oxide CeO2 nanopowder obtained from Aldrich was used (purity 99,5%).
X-ray diffraction (XRD) patterns were collected with the X’Pert PRO MPD diffractometer (PANalytical, Almelo, The Netherlands) with CuKα radiation (40 kV, 30 mA) selected by a nickel monochromator in a diffraction beam with a step size 0.05°. The pattern was recorded in the range of 2–92° with the use of a silicon low background sample holder. The crystal size of the oxide was estimated using the Scherrer equation based on the fwhm (full width at half-maximum) measurement of the reflections.
The morphology of the sample was carried out by means of a JEOL JSM–7500F Field Emission Scanning Electron Microscope (JEOL, Akishima, Japan) equipped with a retractable backscattered-electron detector (RBEI) and energy dispersive spectra (EDS) detection system of a characteristic X-ray radiation AZtec Live for EDS system (Oxford Instruments, London, UK).
The specific surface area was determined from the nitrogen adsorption–desorption isotherms obtained at –196 °C using a Quantachrome Nova 2000 apparatus. The specific surface area measurement was based on BET (Brunauer-Emmett-Teller) formalism.
The temperature-programmed desorption experiment (TPD) was carried out in a quartz fixed-bed flow reactor connected online to the mass spectrometer (QMG 220 PRISMA PLUS). Signal m/z = 44 (CO2) was monitored during the TPD. For the analysis, 50 mg of the sample was placed in the reactor. Prior to TPD, the sample was kept at room temperature in a stream of He until line m/z = 44 was stable. Next, the TPD was performed from RT to 800 K with ∆T = 10 deg/min.
For the IR studies, CeO2 was pressed into thin wafers of ca. 150—200 mg. Prior to the IR experiments, wafers were evacuated in situ in an IR cell at 570 K or 820 K for 30 min. In some experiments, CeO2 was reduced by hydrogen treatment at 770 K for 1 h. Next, hydrogen was removed by evacuation at 670 K and the reduction procedure was repeated at 770 K. Finally, the wafer was evacuated at 670 K. In other experiments, CeO2 was oxidized by oxygen treatment at 670 K followed by evacuation at 570 K.
The doses of gaseous ethanol (ca. 20 µmol/g) were adsorbed at room temperature and, subsequently, unreacted ethanol was removed by evacuation at 370 K. The IR spectra were recorded at room temperature. The spectra were recorded with a NICOLET 6700 spectrometer (Thermo Scientific, Cambridge, MA, USA) with a spectral resolution of 1 cm−1.
4. Conclusions
The adsorption of ethanol on CeO2 results in the formation of ethoxy groups. At low ethanol loadings, water is not produced and new hydroxyls are formed; at higher coverages, water is formed and hydroxyls are consumed. Monodentate, bidentate, and tridentate ethoxyls are formed. Each of these ethoxyls is characterized by IR bands of the symmetric and asymmetric vibrations of C-C-O units as well as of the combinational band. At lower loadings, tridentate ethoxyls are preferentially formed, and at higher loadings, monodentate. The reduction of CeO2 eliminates the sites responsible for the formation of mono- and bidentate ethoxyls; only tridentate are observed in the deeply reduced sample. On the other hand, monodentate ethoxyls dominate on oxidized CeO2. The frequencies of asymmetric C-C-O stretching, as well as of CH3 and CH2, depend both on the multiplicity of the bond of ethoxy groups with the surface and on the oxidation state of the oxide. Ethoxyl groups on CeO2 are oxidized to acetate ions. Monodentate ethoxyls are oxidized at lower temperatures, whereas higher temperatures are needed to oxidize tridentate species. The oxidation of ethoxyls does not produce water. Surface hydroxyls are formed.
Author Contributions
Conceptualization, J.D.; methodology, J.P., M.Z., M.Ś. and J.D.; software, J.P.; validation, J.P., M.Z., M.Ś. and J.D.; formal analysis, J.P., M.Z., M.Ś. and J.D.; investigation, J.P., M.Z. and M.Ś.; resources, J.P.; data curation, J.P., M.Z., M.Ś. and J.D.; writing—original draft preparation, J.D.; writing—review and editing, J.P., M.Z., M.Ś. and J.D.; visualization, J.P., M.Z. and M.Ś.; supervision, J.D.; project administration, J.D.; funding acquisition, J.D. All authors have read and agreed to the published version of the manuscript.
Funding
This work was supported by the statutory funds of the Jerzy Haber Institute of Catalysis and Surface Chemistry PAS.
Institutional Review Board Statement
Not applicable.
Informed Consent Statement
Not applicable.
Data Availability Statement
Not applicable.
Conflicts of Interest
The authors declare no conflict of interest.
Sample Availability
Samples of the compounds are not available from the authors.
References
- Spatari, S.; Zhang, Y.; MacLean, H.L. Life cycle assessment of switchgrass- and corn stover-derived ethanol-fueled automobiles. Environ. Sci. Technol. 2005, 39, 9750–9758. [Google Scholar] [CrossRef] [PubMed]
- Farrell, A.E.; Plevin, R.J.; Turner, B.T.; Jones, A.D.; O’Hare, M.; Kammen, D.M. Ethanol can contribute to energy and environmental goals. Science 2006, 311, 506–508. [Google Scholar] [CrossRef] [PubMed]
- Pimentel, D.; Patzek, T.W. Ethanol Production Using Corn, Switchgrass, and wood; biodiesel production using soybean and sunflower. Nat. Res. Res. 2005, 14, 65–76. [Google Scholar] [CrossRef]
- Hou, T.; Zhang, S.; Chen, Y.; Wang, D.; Cai, W. Hydrogen production from ethanol reforming: Catalysts and reaction mechanism. Renew. Sustain. Energy Rev. 2015, 44, 132–148. [Google Scholar] [CrossRef]
- Jacobs, G.; Keogh, R.A.; Burtron, H.; Davis, B.H. Steam reforming of ethanol over Pt/ceria with co-fed hydrogen. J. Catal. 2007, 245, 326–337. [Google Scholar] [CrossRef]
- Farrauto, R.; Hwang, R.; Shore, S.; Ruettinger, L.; Lampert, W.; Giroux, J.; Liu, T.; Ilinich, Y.O. New material needs for hydrocarbon fuel processing: Generating hydrogen for the PEM fuel cell. Annu. Rev. Mater. Res. 2003, 33, 1–27. [Google Scholar] [CrossRef]
- Ghenciu, A.F. Review of fuel processing catalysts for hydrogen production in PEM fuel cell systems. Curr. Opin. Solid State Math. Sci. 2002, 6, 389–399. [Google Scholar] [CrossRef]
- Liu, Y.; Hayakawa, T.; Tsunoda, T.; Suzuki, K.; Hamakawa, S.; Murata, K.; Shiozaki, R.; Ishii, T.; Kumagai, M. Steam reforming of methanol over Cu/CeO2 catalysts studied in comparison with Cu/ZnO and Cu/Zn(Al)O catalysts. Top. Catal. 2003, 22, 205–213. [Google Scholar] [CrossRef]
- Cheng, W.-H.; Chen, I.; Liou, J.-S.; Lin, S.-S. Supported Cu catalysts with yttria-doped ceria for steam reforming of methanol. Top. Catal. 2003, 22, 225–233. [Google Scholar] [CrossRef]
- Men, Y.; Gnaser, H.; Zapf, R.; Hessel, V.; Ziegler, C.; Kolb, G. Steam reforming of methanol over Cu/CeO2/γ-Al2O3 catalysts in a microchannel reactor. Appl. Catal. A Gen. 2004, 277, 83–90. [Google Scholar] [CrossRef]
- Oguchi, H.; Nishiguchi, T.; Matsumoto, T.; Kanai, H.; Utani, K.; Matsumura, Y.; Imamura, S. Steam reforming of methanol over Cu/CeO2/ZrO2 catalysts. Appl. Catal. A Gen. 2005, 281, 69–73. [Google Scholar] [CrossRef]
- Mastalir, A.; Frank, B.; Szizybalski, A.; Soerijanto, H.; Deshpande, A.; Niederberger, M.; Schomaecker, R.; Schloegl, R.; Ressler, T. Steam reforming of methanol over Cu/ZrO2/CeO2 catalysts: A kinetic study. J. Catal. 2005, 230, 464–475. [Google Scholar] [CrossRef]
- Jacobs, G.; Davis, B.H. In situ DRIFTS investigation of the steam reforming of methanol over Pt/ceria. Appl. Catal. A Gen. 2005, 285, 43–49. [Google Scholar] [CrossRef]
- Men, Y.; Gnaser, H.; Ziegler, C.; Zapf, R.; Hessel, V.; Kolb, G. Characterization of Cu/CeO2/γ-Al2O3 thin film catalysts by thermal desorption spectroscopy. Catal. Lett. 2005, 105, 35–40. [Google Scholar] [CrossRef]
- Pinton, N.; Vidalb, M.V.; Signoretto, M.; Martínez-Arias, A.; Cortés Corberán, V. Ethanol steam reforming on nanostructured catalysts of Ni, Co and CeO2: Influence of synthesis method on activity, deactivation and regenerability. Catal. Today 2017, 296, 135–143. [Google Scholar] [CrossRef]
- Allen, G.; Wood, M.; Dyke, J. Spectroscopic properties of some mixed-valence transitional metal chalcogenides. J. Inorg. Nucl. Chem. 1973, 35, 2311–2318. [Google Scholar] [CrossRef]
- Yee, A.; Morrison, S.J.; Idriss, H. A Study of the reactions of ethanol on CeO2 and Pd/CeO2 by steady state reactions, temperature programmed desorption, and in situ FT-IR. J. Catal. 1999, 186, 279–295. [Google Scholar] [CrossRef]
- Faber, J.; Seitz, M. Defect characterization in CeO2−x at elevated temperatures—I: X-Ray diffraction. J. Phys. Chem. Solids 1976, 37, 903–907. [Google Scholar] [CrossRef]
- Gandhi, H.S.; Piken, A.G.; Shelef, M.; Delosh, R.G. Laboratory Evaluation of Three-Way Catalysts; SAE Paper 760201; SAE Publishing: Warrendale, PE, USA, 1976. [Google Scholar] [CrossRef]
- Su, E.C.; Montreuil, C.N.; Rothchild, W.G. Oxygen storage capacity of monolith three-way catalysts. Appl. Catal. 1985, 17, 75–86. [Google Scholar] [CrossRef]
- Harrison, B.; Diwell, A.F.; Hallett, C. Promoting platinum metals by ceria. Platin. Met. Rev. 1988, 32, 73. [Google Scholar]
- Fujiwara, A.; Tsurunari, Y.; Yoshida, H.; Ohyama, J.; Yamada, T.; Haneda, M.; Miki, T.; Machida, M. Thermal deactivation of Pd/CeO2−ZrO2 three-way catalysts during real engine aging: Analysis by a surface plus peripheral site model. ACS Omega 2020, 5, 28897–28906. [Google Scholar] [CrossRef] [PubMed]
- Narayanan, J.; Hernández, J.G.; Padilla-Martínez, I.I.; Thangarasu, P.; Garay, S.E.S.; Palacios-Cabrera, C.B.; Santiago-Cuevas, A.J. Geometry influenced adsorption of fluoxetine over the surface of RuFeO3 and CeFeO3 nanoparticles: Kinetics and thermodynamic studies. Ceram. Int. 2021, 47, 20544–20561. [Google Scholar] [CrossRef]
- Santiago-Cuevas, A.J.; Palacios-Cabrera, C.B.; Aguilar, C.A.H.; Padilla-Martínez, I.I.; Thangarasu, P.; Contreras, E.F.V.; Alonzo, F.R.; Narayanan, J. Effect of the structural integrity on the size and porosity of gold-implanted mixed-metal oxide nanocomposites: Their influence on the photocatalytic degradation of thioanisole. Dalton Trans. 2022, 51, 17671–17687. [Google Scholar] [CrossRef]
- Hernandez, P.; Santiago-Cuevas, A.; Palacios-Cabrera, C.; Thangarsu, P.; Narayanan, J.; Kaur, H.; Singh, J.; Kumar, D.; Huerta-Aguilar, C.A.; Singh, P.P.; et al. Development and applications of Ru and Ce based iron oxides as photocatalysts. Mater. Lett. 2022, 313, 131720. [Google Scholar] [CrossRef]
- Idriss, H.; Seebauer, E.G. Reactions of ethanol over metal oxides. J. Mol. Catal. A Chem. 2000, 152, 201–212. [Google Scholar] [CrossRef]
- Idriss, H. Ethanol reactions over the surfaces of noble metal/cerium oxide catalysts. Platin. Met. Rev. 2004, 48, 105–115. [Google Scholar] [CrossRef]
- Idriss, H.; Diagne, C.; Hindermann, J.P.; Kiennemann, A.; Barteau, M.A. Reactions of acetaldehyde on CeO2 and CeO2-supported catalysts. J. Catal. 1995, 155, 219–237. [Google Scholar] [CrossRef]
- Yee, A.; Morrison, S.J.; Idriss, H. The reactions of ethanol over M/CeO2 catalysts. Evidence of carbon—Carbon bond dissociation at low temperatures over Rh/CeO2. Catal. Today 2000, 63, 327–335. [Google Scholar] [CrossRef]
- Lamotte, J.; Moravek, V.; Bensitel, M.; Lavalley, J.-C. FT- IR Study of the structure and reactivity of methoxy species on ThO2 and CeO2. React. Kinet. Catal. Lett. 1988, 36, 113–118. [Google Scholar] [CrossRef]
- Binet, C.; Daturi, M.; Lavalley, J.-C. IR Study of polycrystalline ceria properties in oxidized and reduced states. Catal. Today 1999, 50, 207–225. [Google Scholar] [CrossRef]
- Badri, A.; Binet, C.; Lavalley, J.-C. Use of methanol as molecular probe to study the surface of polycrystaline ceria. J. Chem. Soc. Faraday Trans. 1997, 93, 1159–1168. [Google Scholar] [CrossRef]
- Mullins, D.R.; Senanayake, S.D.; Chen, T.L. Adsorption and reaction of C1-C3 alcohols over CeOX(111) thin films. J. Phys. Chem. C 2010, 114, 17112–17119. [Google Scholar] [CrossRef]
- Perchared, J.P.; Josien, M.L. Etude des Spectres Vibrationelles de douze Especes Isotopiques d’Ethanols Monomeres. J. Chim. Phys. 1968, 65, 1834–1855. [Google Scholar] [CrossRef]
- Badri, A.; Binet, C.; Lavalley, J.C. An FTIR study of surface ceria hydroxy groups during a redox process with H2. J. Chem. Soc. Faraday Trans. 1996, 92, 4669. [Google Scholar] [CrossRef]
- Bozon-Verduraz, F.; Bensalem, A. IR studies of cerium dioxide: Influence of impurities and defects. J. Chem. Soc. Faraday Trans. 1994, 90, 653. [Google Scholar] [CrossRef]
- Binet, C.; Badri, A.; Lavalley, J.C. A Spectroscopic Characterization of the Reduction of Ceria from Electronic Transitions of Intrinsic Point Defects. J. Phys. Chem. 1994, 98, 6392. [Google Scholar] [CrossRef]
Disclaimer/Publisher’s Note: The statements, opinions and data contained in all publications are solely those of the individual author(s) and contributor(s) and not of MDPI and/or the editor(s). MDPI and/or the editor(s) disclaim responsibility for any injury to people or property resulting from any ideas, methods, instructions or products referred to in the content. |
© 2023 by the authors. Licensee MDPI, Basel, Switzerland. This article is an open access article distributed under the terms and conditions of the Creative Commons Attribution (CC BY) license (https://creativecommons.org/licenses/by/4.0/).