Abstract
The difficulty of exposing active sites and easy recombination of photogenerated carriers have always been two critical problems restricting the photocatalytic activity of g-C3N4. Herein, a simple (NH4)2MoO4-induced one-step calcination method was successfully introduced to transform bulk g-C3N4 into g-C3N4/MoO2 composites with a large specific surface area. During the calcination, with the assistance of NH3 and water vapor produced by ammonium molybdate, the pyrolytical oxidation and depolymerization of a g-C3N4 interlayer were accelerated, finally realizing the exfoliation of the g-C3N4. Furthermore, another pyrolytical product of ammonium molybdate was transformed into MoO2 under an NH3 atmosphere, which was in situ loaded on the surface of a g-C3N4 nanosheet. Additionally, the results of photocatalytic hydrogen evolution under visible light show that the optimal g-C3N4/MoO2 composite has a high specific surface area and much improved performance, which is 4.1 times that of pure bulk g-C3N4. Such performance improvement can be attributed to the full exposure of active sites and the formation of abundant heterojunctions. However, with an increasing feed amount of ammonium molybdate, the oxidation degree of g-C3N4 was enhanced, which would widen the band gap of g-C3N4, leading to a weaker response ability to visible light. The present strategy will provide a new idea for the simple realization of exfoliation and constructing a heterojunction for g-C3N4 simultaneously.
1. Introduction
With the development of human society, energy crises and environmental problems have caused more and more troubles for mankind, and semiconductor photocatalysis technology is a promising technology to solve these two problems [1,2]. For better photocatalytic effects, a variety of semiconductor materials have been developed as photocatalysts. Among them, g-C3N4 has attracted extensive attention because of its suitable band gap structure, stable physical and chemical properties, environmental friendliness, low cost, and easy availability [3]. In addition, because g-C3N4 has a graphene-like structure (that is, a two-dimensional layered structure), it theoretically has a large specific surface area, which can lead to a huge number of reactively active sites in theory and act as a framework carrier [4]. However, during its thermal polymerization, due to the disordered growth and ubiquitous intermolecular interaction between the layers, the synthesized g-C3N4 is usually highly concentrated as lumps, called bulk g-C3N4 by scholars, which can only expose a small specific surface area, preventing its photocatalytic reaction [5]. Therefore, how to peel g-C3N4 from layer to layer to expose more active sites is a hot topic in this field.
In the literature, a lot of researchers have tried to prepare exfoliated g-C3N4. At the outset, the Hummers’ method for the preparation of graphene oxide was used to exfoliate g-C3N4 [6]. Thereupon, lots of chemical delamination methods using a large number of strong acids and strong oxidants were developed [7,8,9,10,11]. However, because such methods should apply a large number of strong acids and/or oxidants such as concentrated H2SO4, HNO3, HCl, H3PO4, and KMnO4, which impose great harm on the environment, greener methods have to be developed. Almost at the same time, methods using ultrasonic separation with low surface-tension solvents have been developed. For example, Lin et al. acquired g-C3N4 nanosheets by ultrasonic and centrifugation accompanied with a variety of organic solvents [12]. Although g-C3N4 nanosheets can be obtained more environmentally friendly by such a method, it cannot be widely used in practical application due to its high equipment requirements and very low productivity. In addition, Niu et al. found that secondary calcination could effectively exfoliate bulk g-C3N4, because the principle of its interlayer separation is the oxidation reaction and depolymerization of g-C3N4 under an atmosphere of high temperature [13]. Moreover, Wu et al. adopted a method by adding a large amount of NH4Cl in combination with secondary calcination to obtain exfoliated g-C3N4 nanosheets at a lower temperature [14].
However, only gaining exfoliated g-C3N4 cannot solve the problems that limit the enhancement of its photocatalytical performance. As is well known, the rapid recombination of photogenerated carriers is another critical factor that seriously affects the photocatalytic efficiency of g-C3N4. To solve this problem, excepting the deposition of materials with high electrical conductivity onto the surface of g-C3N4, loading semiconductor materials onto the surface of g-C3N4 nanosheets to form heterojunctions is a classical program, because it is also conducive to optoelectronic transmission on the two-dimensional layer-like structured g-C3N4 [15,16,17].
Among semiconductor materials, MoO2 has excellent electrical conductivity and photoelectrochemical activity due to its unique metallic properties which are attributed to the fermi level of MoO2 provided by its 4d orbital [18,19]. Therefore, MoO2 has been widely investigated and applied in photocatalysis, electrocatalysis, batteries, and other fields [20,21,22]. Recently, researchers have reported some work on g-C3N4/MoO2 composites for photocatalysis. In the literature, Li et al. realized an obvious improvement in photocatalytic efficiency in the reduction of CO2 over the g-C3N4/MoO2 composite, which can be attributed to the construction of a Schottky junction between g-C3N4 and MoO2 in the composite [23]. Yadav et al. prepared a microspherical MoO2/g-C3N4 core-shell composite for the high-efficiency photocatalytic degradation of xylenol orange by a simple one-step calcination procedure [24]. In addition, Ji et al. prepared a g-C3N4/MoO2 2D-2D structured composite by a cumbersome three-step process for enhanced photocatalytic degradation of Rhodamine B [25]. However, there are very few studies on the photocatalytic hydrogen evolution of g-C3N4/MoO2 composites [18]. Consequently, it is necessary to further explore the possibility of g-C3N4/MoO2 composites in photocatalytic hydrogen evolution.
In this work, a novel g-C3N4/MoO2 composite with a large specific surface area was successfully prepared by employing a simple one-step calcination method for high-performance photocatalytic hydrogen evolution. In the whole process of this method, NH3 and water vapor produced by the pyrolysis of ammonium molybdate break the van der Waals forces between the layers of g-C3N4, which then lets O2 in the air flow to promote the oxidation and depolymerization process of g-C3N4 between the layers and grow MoO2 particles onto the surface of the g-C3N4 interlayer, ultimately realizing the spalling of g-C3N4 and the construction of heterojunctions between g-C3N4 and MoO2 through a single calcination. The gained g-C3N4/MoO2 composite has much improved photocatalytic performance for hydrogen evolution under visible light, which can be attributed to the effectively enhanced specific surface area by the exfoliation of bulk g-C3N4 and the reduced recombination of photogenerated carriers by forming the heterojunctions of g-C3N4 with MoO2. The photocatalytic hydrogen evolution rate (HER) over the optimal sample is 4.1 times greater than that over bulk g-C3N4. In addition, the photocatalytic mechanism of the obtained g-C3N4/MoO2 composite was proposed. The current strategy will provide a new idea for simple exfoliation while also constructing a heterojunction for g-C3N4.
2. Results and Discussion
2.1. Composition, Structure, and Morphology
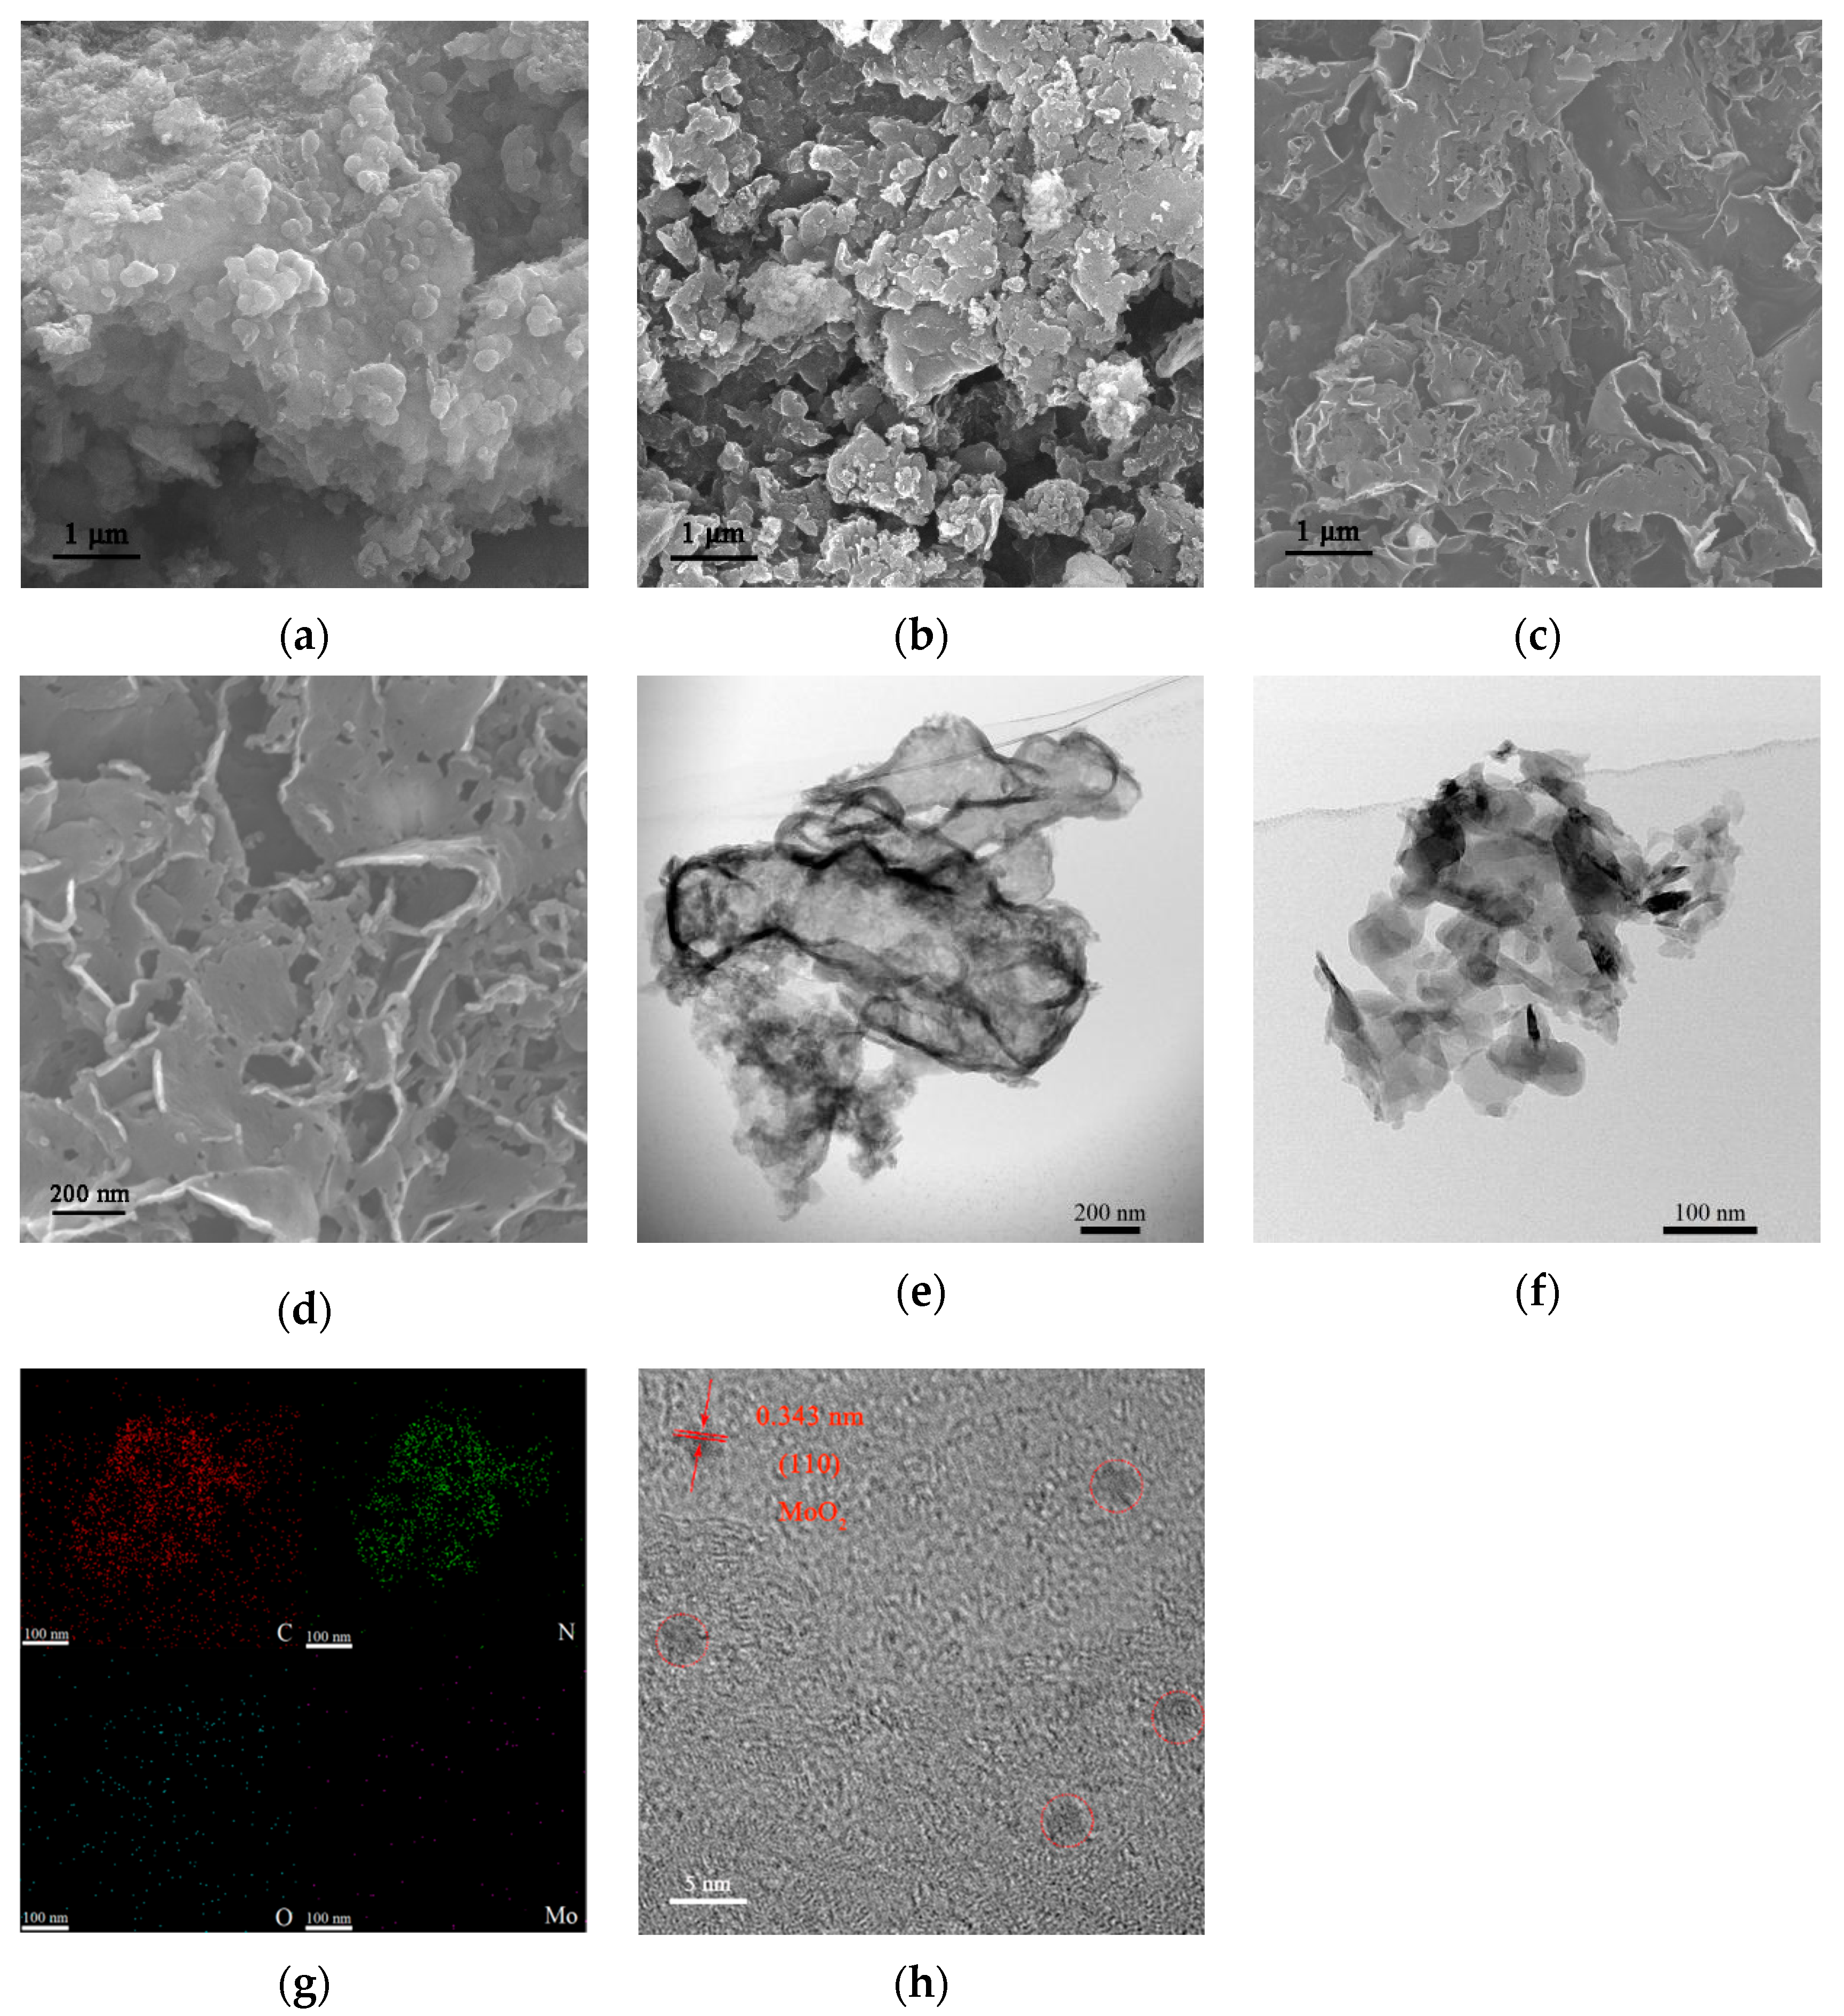
In order to examine the morphological features of the samples, the samples were observed by SEM. As can be seen in Figure 1a, g-C3N4 directly obtained by calcination from melamine shows a large bulk structure, which is due to the stacking of g-C3N4 layers caused by the interlayer van der Waals force. After thermal treatment in air, the g-C3N4 sample presents a measure of spalling owing to the corrosion on the edge of g-C3N4 by oxygen at high temperatures. From Figure 1b, it can be clearly seen that the g-C3N4 bulk became smaller after thermal treatment without any other change in morphology. However, the sample treated with ammonium molybdate solution, as shown in Figure 1c,d, displays a more obvious lamellar structure, which can be attributed to the escape of NH3 from the thermal decomposition of ammonium molybdate. In addition, it can be seen from Figure S1 in the Supporting materials that with increasing amounts of the applied ammonium molybdate, the size of the resultant g-C3N4 nanosheets gradually decreases.
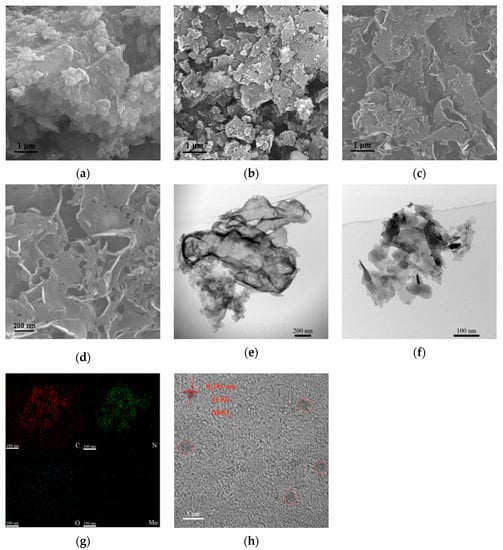
Figure 1.
Microstructures of the prepared samples. Typical SEM images: low-magnification for (a) bulk g-C3N4 and (b) CNH, and (c,d) different, higher magnification for CNM-4. Typical TEM images of (e) CNH and (f) CNM-4. EDX elemental mapping (g) and HRTEM (h) images corresponding to CNM-4.
In order to further examine the morphology and elemental composition of the samples, TEM characterization was carried out. Compared with the sample CNH (see Figure 1e), the sample treated with ammonium molybdate exhibits a clearer exfoliation between the layers (Figure 1f). Meanwhile, TEM mapping scanning was performed on the area of Figure 1f, and the results are shown in Figure 1g. As is seen, four elements of C, N, O, and Mo were identified by the system. Among them, the distributions of C and N elements are consistent with the shape of g-C3N4 nanosheets as shown in Figure 1f. However, the Mo and O elements are only of a small amount and evenly distributed on the surface of the g-C3N4 nanosheets. In order to find out the scattering feature of molybdenum oxide on the g-C3N4 nanosheets, with a small piece of sample at this position, high-resolution TEM (HRTEM) characterization was carried out. Through the HRTEM image (Figure 1h), it can be observed that some quantum dots with a diameter of about 2–3 nm are distributed on the surface of the nanosheets. Although their crystallinity is not very fine, a small number of lattice stripes can still be identified on the quantum dots, which could be indexed to the MoO2 (110) crystal plane. From the above results, it can be inferred that the thermally treated g-C3N4 is effectively exfoliated into thinner nanosheets, and a small amount of MoO2 quantum dots are loaded on the surface of the g-C3N4 nanosheets.
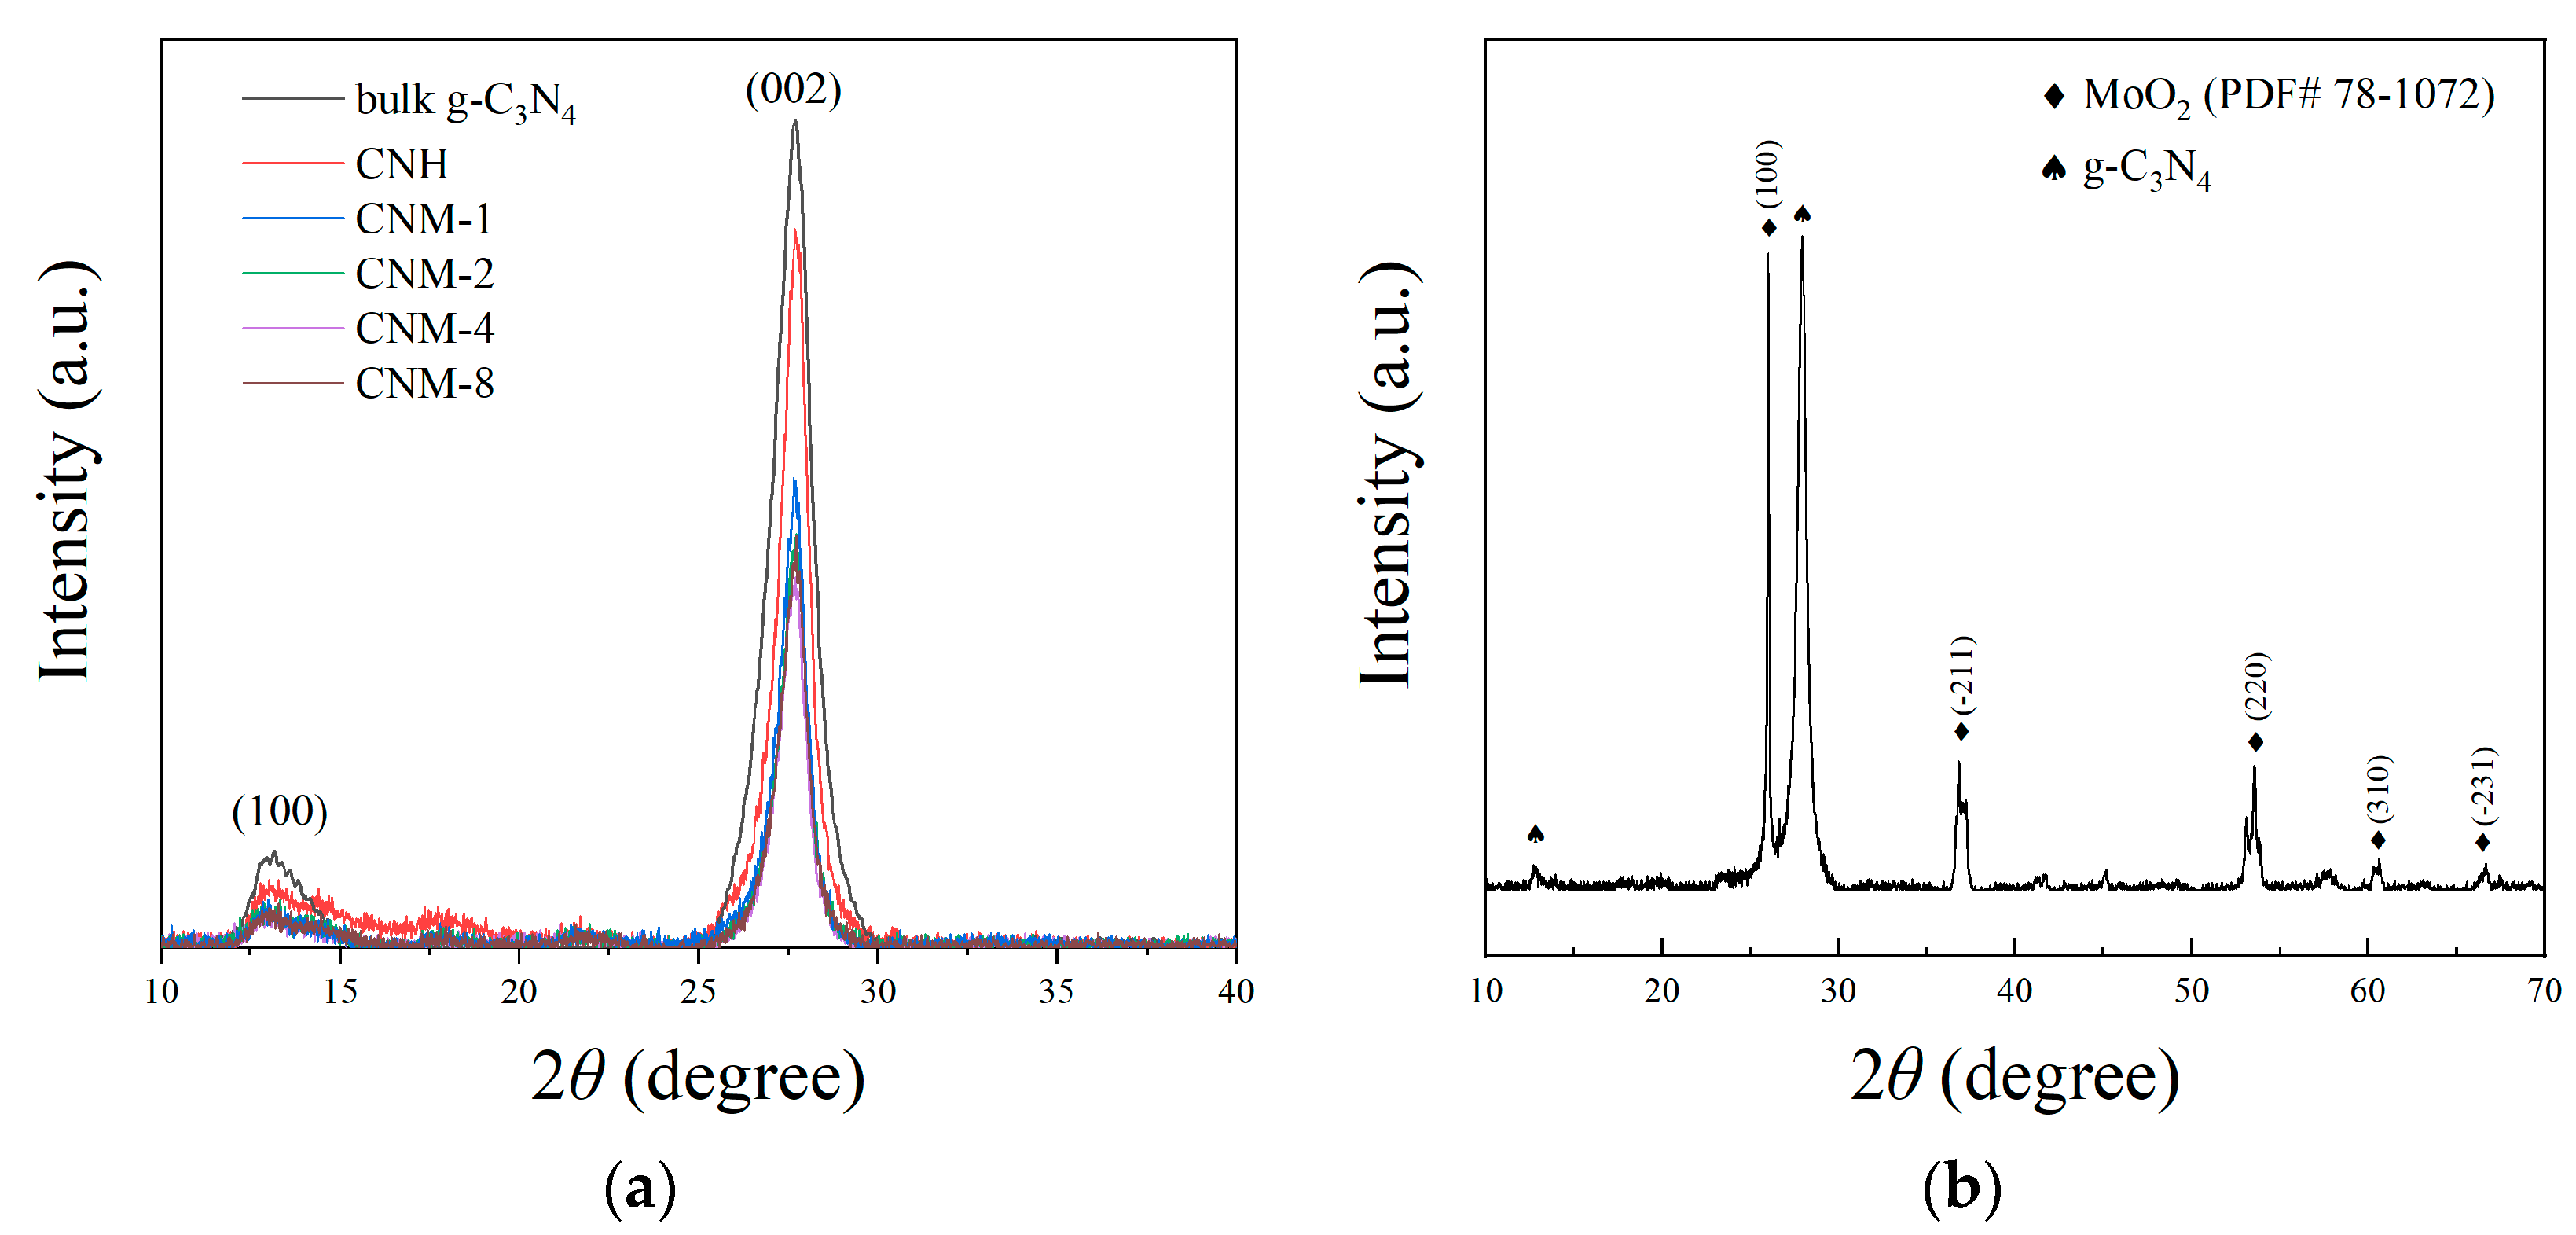
Typical XRD patterns of the bulk g-C3N4, CNH, and CNM sample are shown in Figure 2a. It can be seen from this figure that all the samples contain the two characteristic peaks of g-C3N4. The peak around 13.2° is indexed to the (100) crystal plane of g-C3N4 (0.671 nm), which represents the tri-s-triazine repeating unit in the g-C3N4 plane, while the peak around 27.6° is attributed to the (002) crystal plane of g-C3N4 (0.323 nm), signifying the interlayer stacking conjugated aromatic system of g-C3N4 in the vertical direction [13,16]. Remarkably, compared with those of bulk g-C3N4, the strengths of these two peaks of the other samples are relatively low. This result can be interpreted as the spalling between g-C3N4 layers and plane fracturing, which would cause the structural damage of the g-C3N4 crystal [12]. Obviously, due to the interlayer separation caused by the escape of NH3, the four composite samples from CNM-1 to CNM-8 have weaker XRD peaks, and this fact further verifies that the processes presented in this work can peel g-C3N4 effectively. However, the peak of MoO2 cannot be identified from these patterns because MoO2 in these samples exists in the form of quantum dots with a high degree of dispersion, poor crystallinity, and a small molar fraction. In order to confirm the phase composition of molybdenum oxide in the samples, a large number of composite samples were collected from the Al2O3 ceramic boat after the synthesis processes, and another 3 h of thermal treatment under air was performed, which was intended to thermally decompose g-C3N4 for enriching molybdenum oxide. The enriched samples were characterized by XRD, and the result is shown in Figure 2b. It can be clearly seen in this figure that the peaks corresponding to the MoO2 phase are consistent with standard PDF card no. 78-1072.
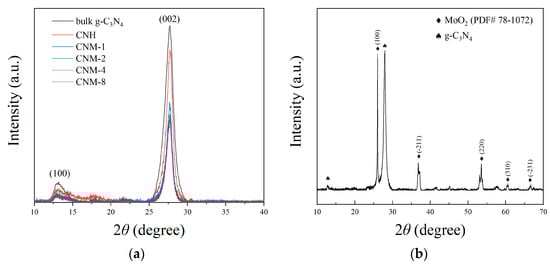
Figure 2.
XRD results: (a) comparison on the patterns of CNM, CNH, and bulk g-C3N4, and (b) single pattern for the optimal sample CNM-4 thermally treated under air for another 3 h.
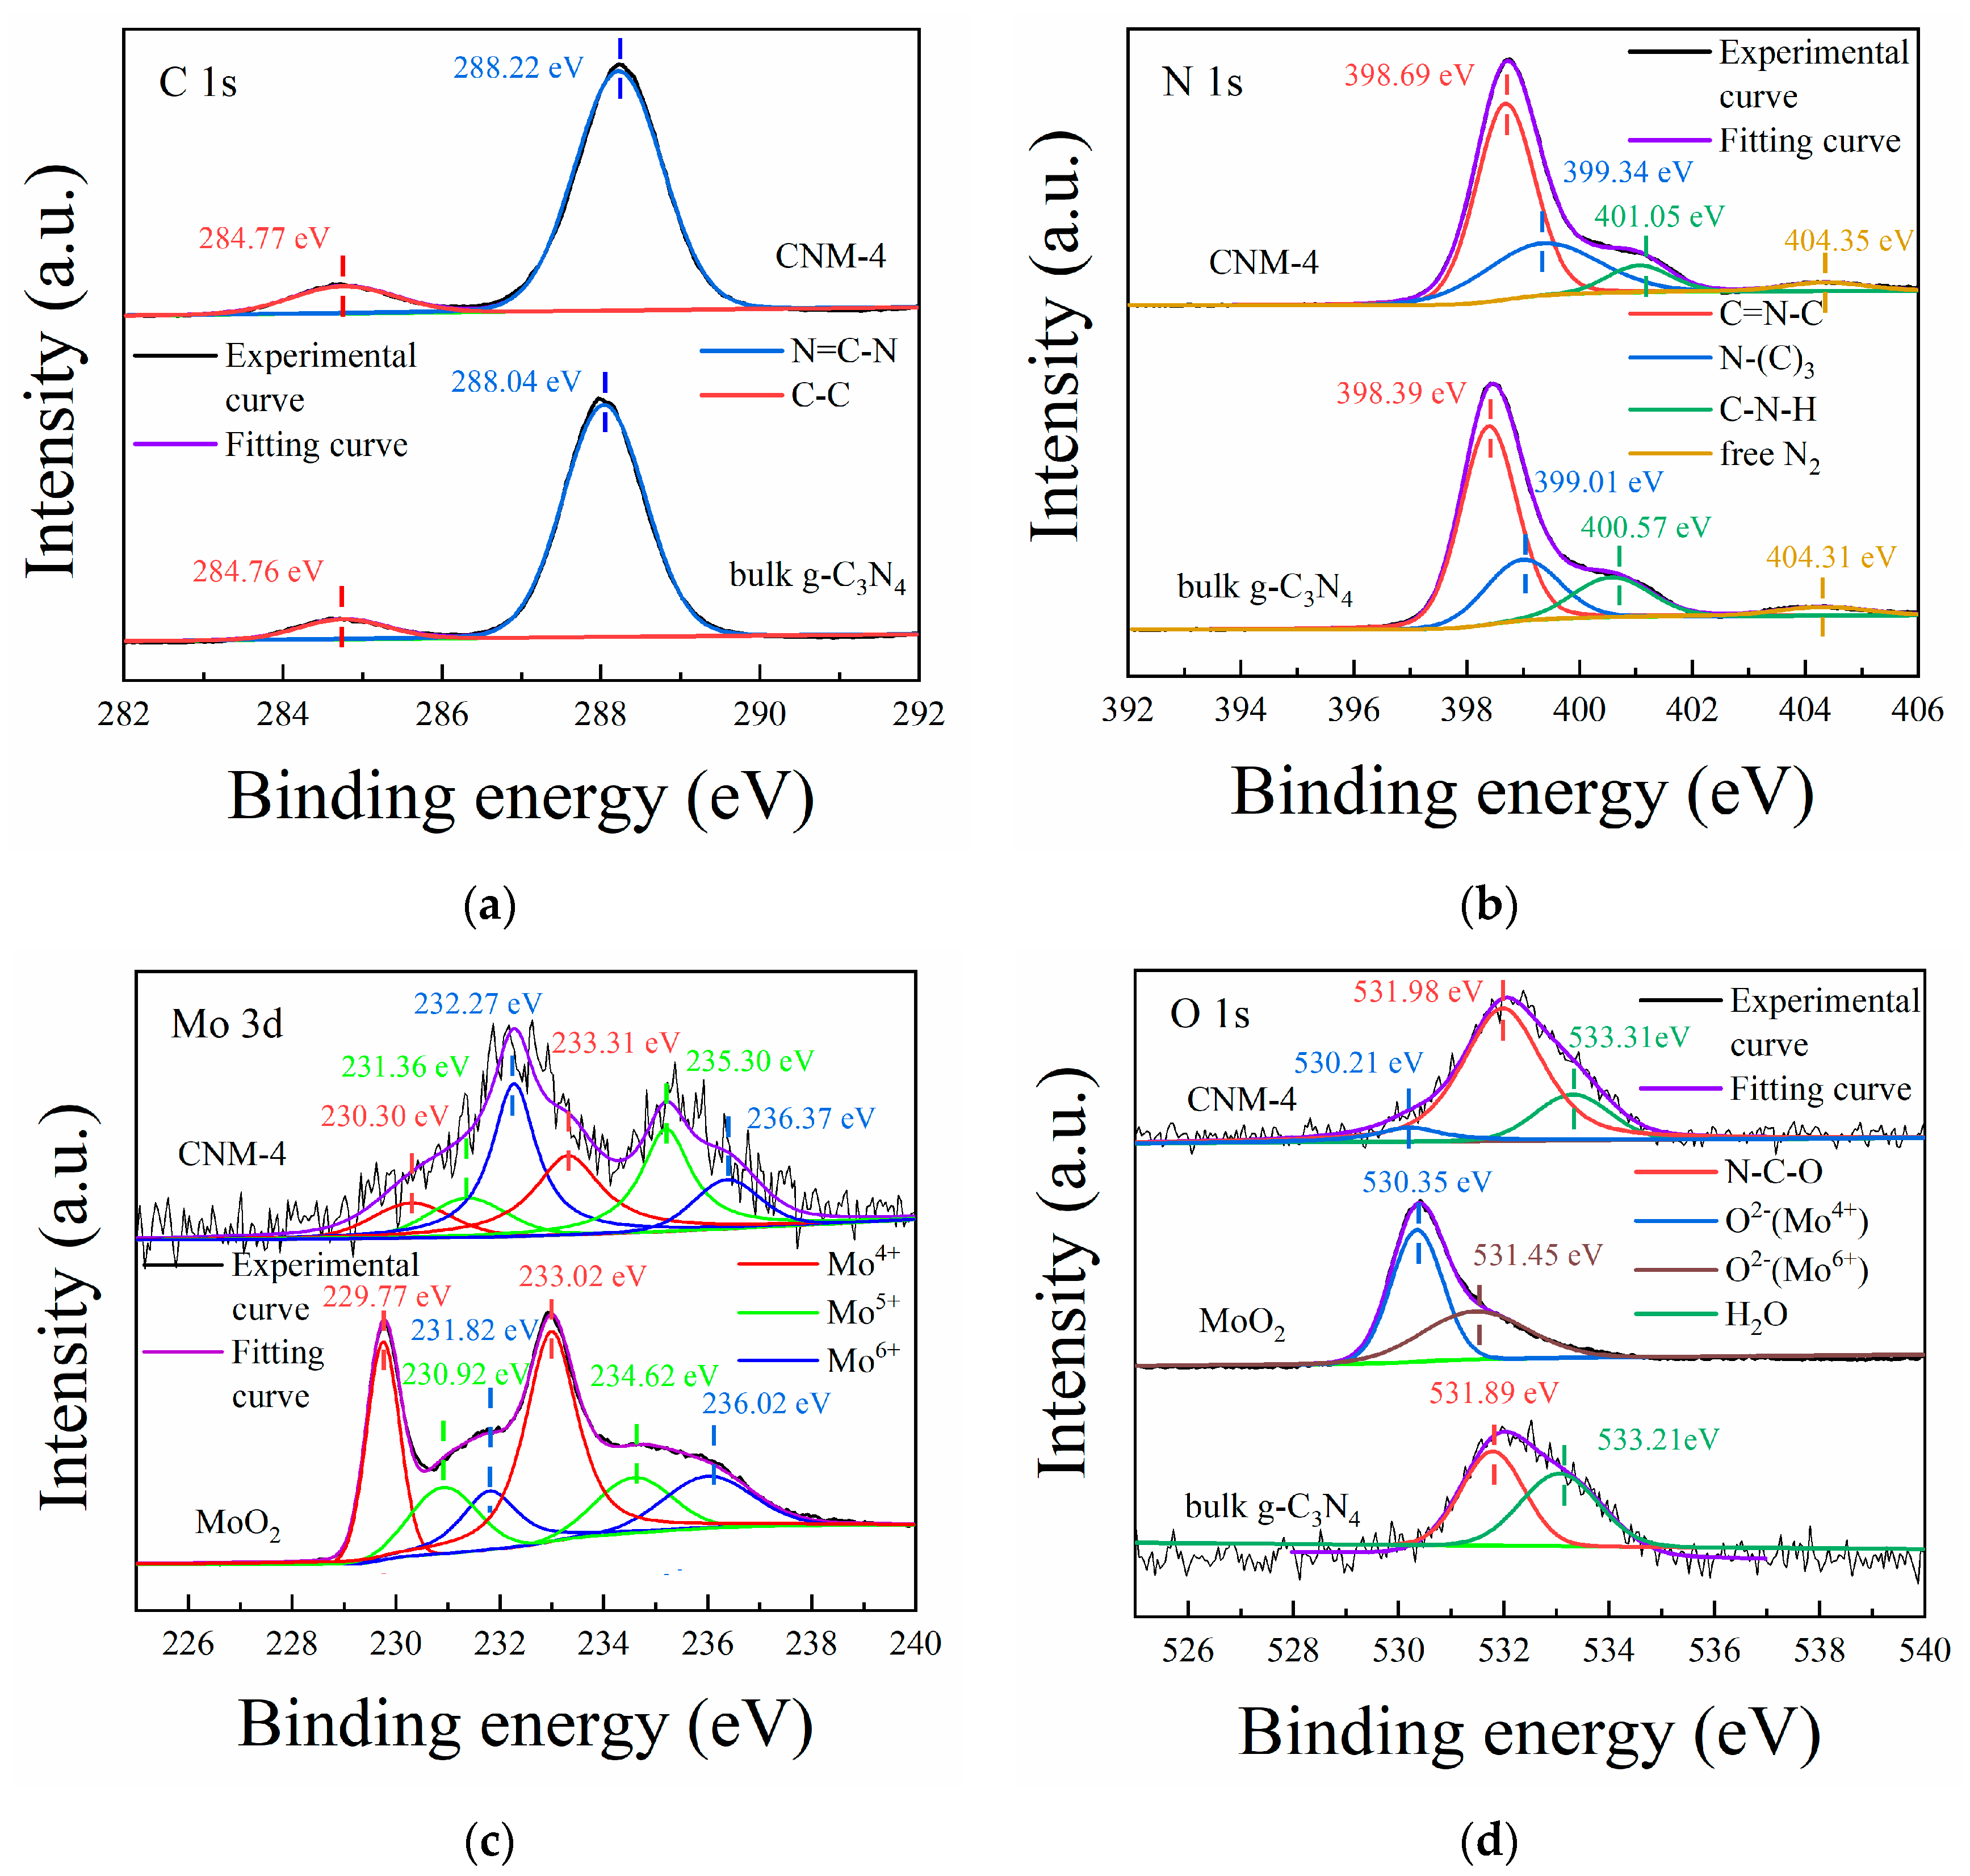
In order to investigate the elemental composition and chemical state of the composite samples, XPS analysis on them was performed. Since the XPS spectra of the prepared series of composite samples are similar, only the spectra of the optimal sample CNM-4 are displayed. Through the XPS survey spectrum (see Figure S2), it can be seen that the composite sample is composed of C, N, Mo, and O. From the high-resolution spectra (Figure 3), the chemical state of each element in the composite can be further understood. In the C 1s spectrum (Figure 3a), two peaks centered at the binding energies of 284.77 and 288.22 eV can be observed in the sample, which are attributed to the free carbon for instrument calibration and the C element in N-C=N, respectively [26]. For comparison, the high-resolution C 1s spectrum of bulk g-C3N4 was also presented in this figure. It is seen that this spectrum has the same peaks at similar positions as that of the optimal sample CNM-4. The only difference between these two spectra is that the binding energy of CNM-4 at 288.22 eV is 0.18 eV higher than that of bulk g-C3N4, due to the inductive effect of the O atoms, which are connected to the g-C3N4 structure caused by the thermal oxidation process. In addition, in the N 1s spectrum of the sample CNM-4 (Figure 3b), four peaks with binding energies of 398.69, 399.34, 401.05, and 404.35 eV can be fitted, representing N atoms in C-N=C, N-(C)3, and C-N-H structures in the g-C3N4 framework as well as free N2 adsorbed from air, respectively [26]. Similarly, the peaks in the N 1s spectrum representing the g-C3N4 structure in the sample CNM-4 are shifted to the high value of binding energies by about 0.3 eV compared with those of bulk g-C3N4, which is due to the inductive effect of the O atoms connected with the g-C3N4 structure. On the basis of the chemical states of C and N elements discussed above, it can be concluded that the composite does contain g-C3N4. As for the Mo 3d spectrum of the optimal sample CNM-4 (Figure 3c), there are three groups of peaks with binding energy at 230.30 and 233.31 eV, 231.36 and 235.30 eV, as well as 232.27 and 236.37 eV, representing the electron spin splitting of 3d5/2 and 3d3/2 of Mo4+, Mo5+, and Mo6+ in the composites, respectively [20,27]. The XPS spectrum of the Mo element revealed that the oxidation state of Mo atoms in the composites involved Mo4+, Mo5+, and Mo6+, with the Mo5+ and Mo6+ states attributed to the Jahn–Teller effect caused by lattice distortion [28]. This result is consistent with the XPS Mo spectrum of pure MoO2, also shown in Figure 3c. Thus, it can be concluded that the molybdenum oxide in the optimal sample CNM-4 is composed of MoO2. From the XPS spectrum of O 1s (Figure 3d), three peaks centered at the binding energies of 520.21, 531.98, and 533.31 eV could be observed, which can be assigned to the oxygen element in MoO2, the N-C-O structure, and free H2O, respectively [27]. Compared with the XPS spectrum of bulk g-C3N4, the O peak area representing N-C-O in the sample CNM-4 displays an obvious increase, which can be attributed to the O atoms introduced into the g-C3N4 structure by thermal oxidation.
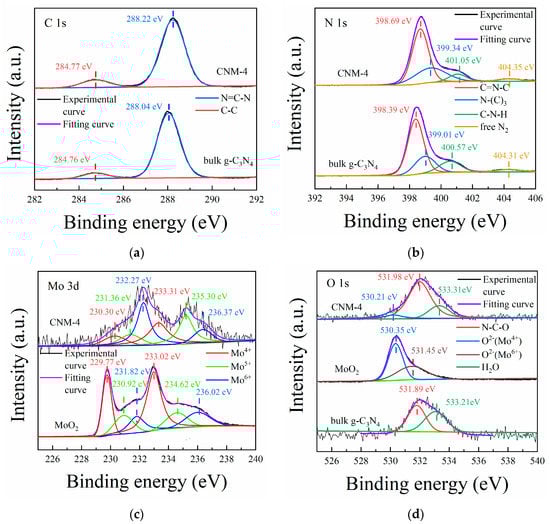
Figure 3.
XPS spectra of the optimal composite CNM-4 in comparison with those of the control samples (bulk g-C3N4 and commercial MoO2): (a) C 1s, (b) N 1s, (c) Mo 3d, and (d) O 1s.
In addition, the content of each element in the prepared samples in this work was calculated based on XPS analysis and is listed in Table 1. It can be seen that C and N elements account for the main components in each sample, and the atomic ratio of C to N is close to 3:4. Thus, it is believable that the main component of these samples is g-C3N4. Furthermore, the content of Mo in these samples increased gradually as the concentration of ammonium molybdate in the precursor solution used for the thermal treatment increased. Additionally, the content of O element is clearly increased, which is more than twice the content of Mo element, indicating that, in addition to the O atoms in the introduced MoO2, there are additional O atoms in the samples. This result should be attributed to the O atoms introduced into g-C3N4 that is combined directly with the g-C3N4 structure in the samples by the oxidation reaction during the thermal treatment in air. In addition, the increase in oxidation degree reflects the destruction of the intermolecular force between g-C3N4 layers by the gases produced by the decomposition of ammonium molybdate. In other words, when O2 can enter the g-C3N4 layers smoothly, the oxidation process will be further accelerated. In summary, through the XPS analysis of the composite samples, it can be concluded that such samples are composed of O-doped g-C3N4 and MoO2.

Table 1.
Elemental compositions of each sample.
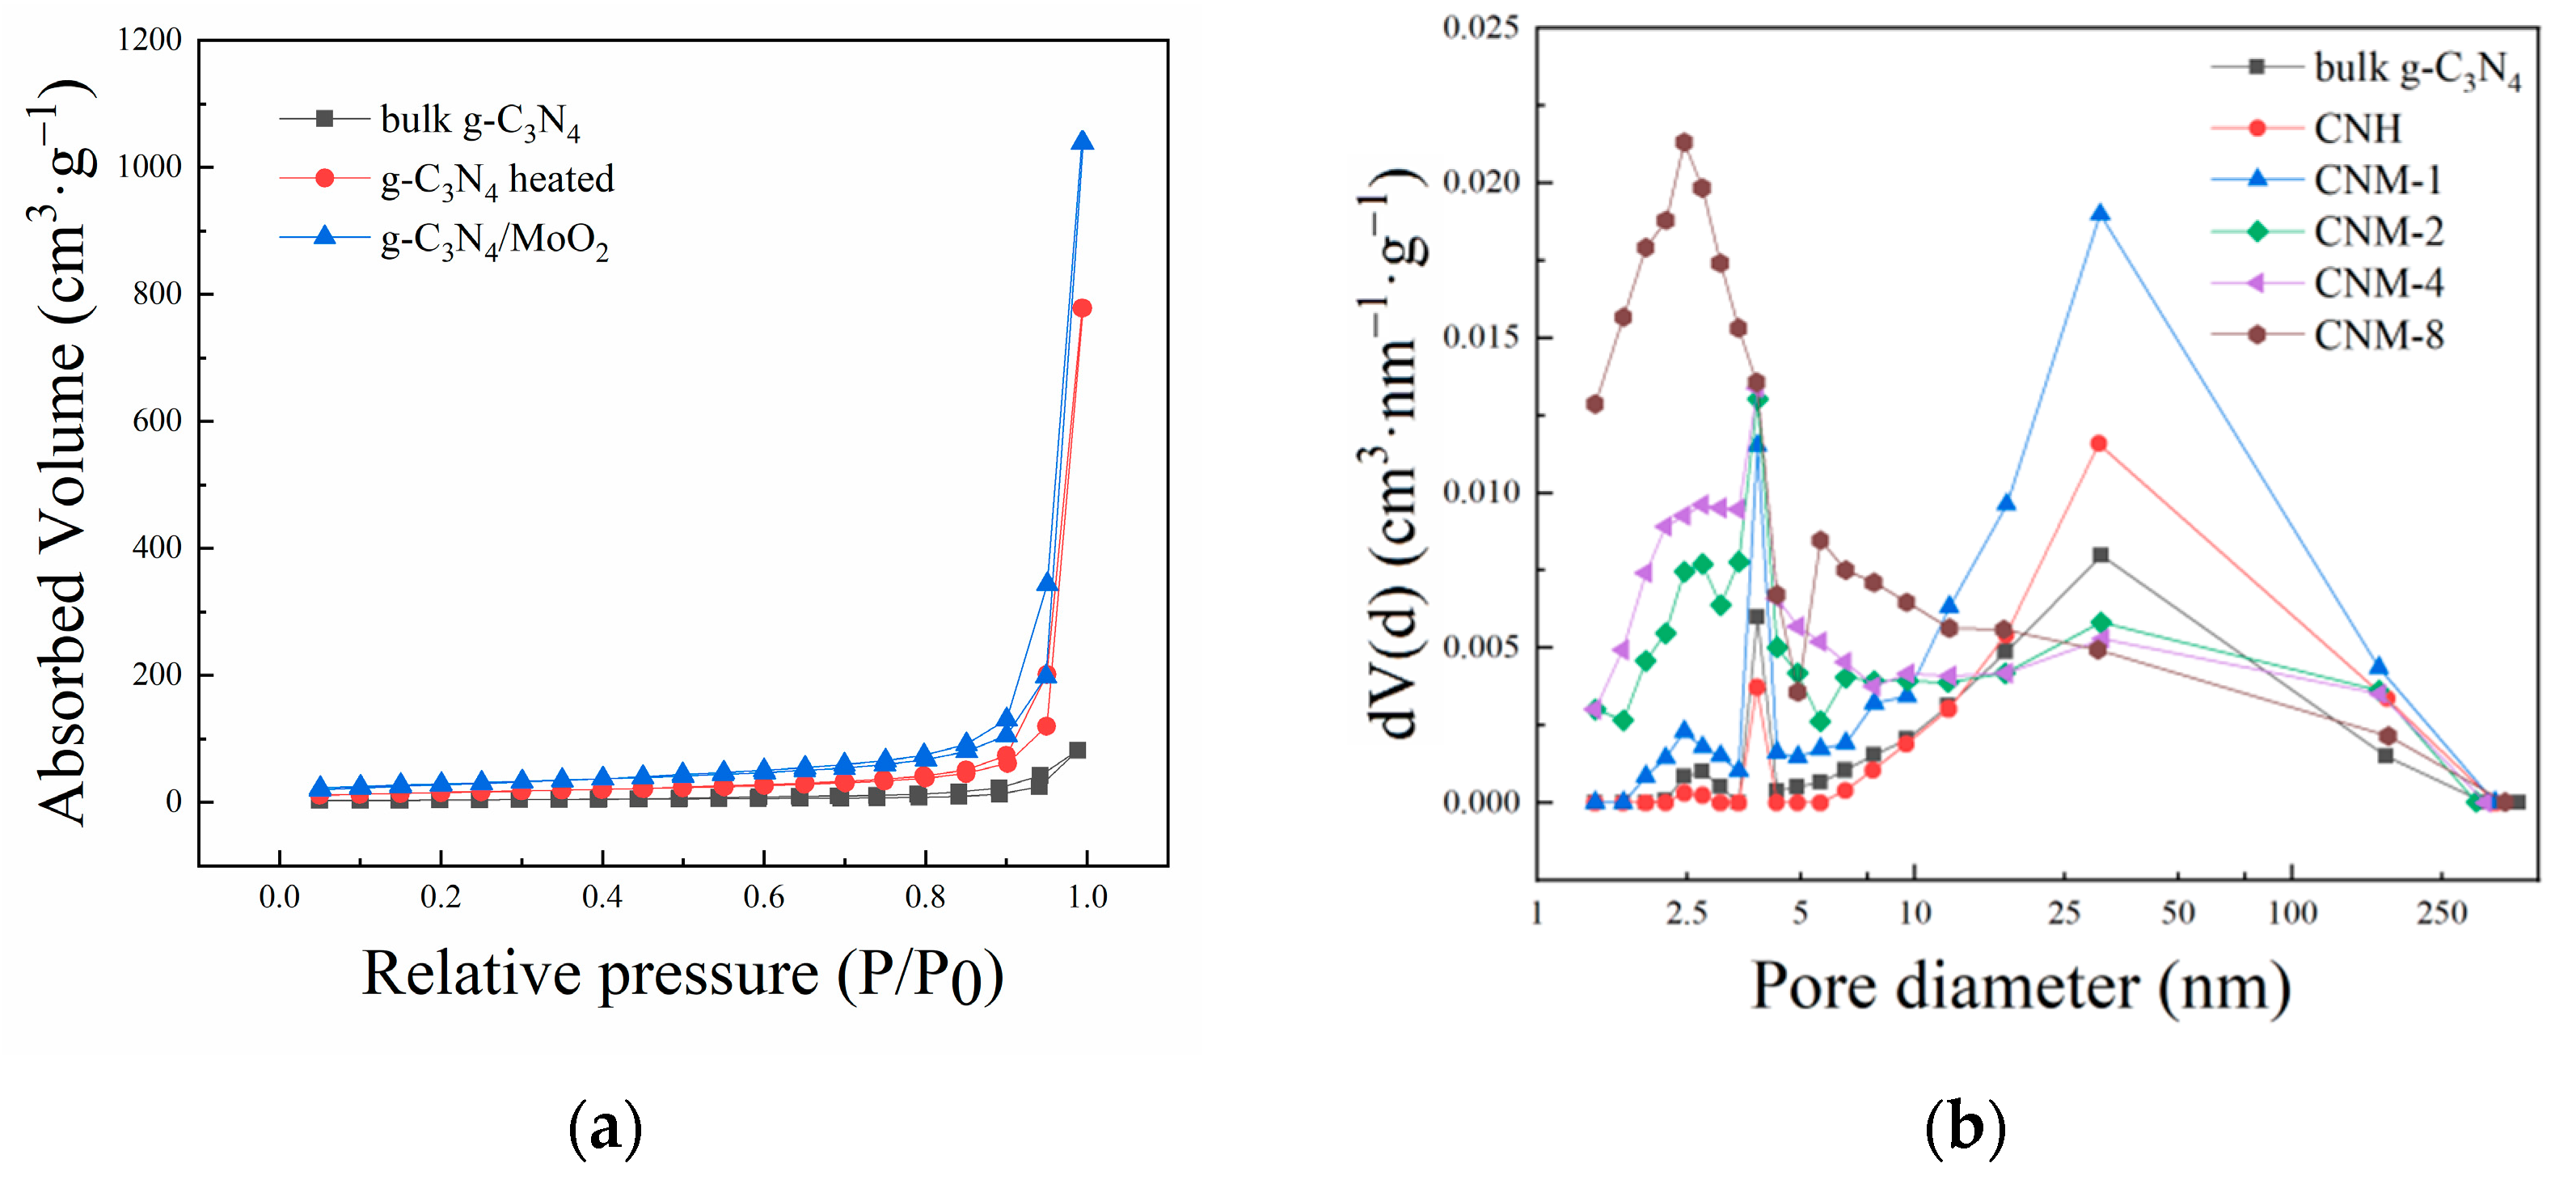
To further explore the internal pore structure in the composite samples, a set of N2 adsorption-desorption tests were conducted on bulk g-C3N4, CNH, and this series of CNM composite samples. The recorded N2 adsorption-desorption isotherms are shown in Figure 4a. Based on them, the specific surface area (SBET), pore diameter, and pore volume of the samples were calculated. The results are listed in Table 2, in which the pore diameter distribution is also displayed in Figure 4b. Firstly, comparing the SBET values of the samples (see Table 2) with that of the bulk g-C3N4 (12.34 m2·g−1), the sample CNH shows a larger SBET value of 55.65 m2·g−1, which can be attributed to the oxidation of g-C3N4 by O2 from air [13]. The SBET values of CNM-1, CNM-2, CNM-4, and CNM-8 samples were 102.91, 89.67, 96.17, and 116.32 m2·g−1, respectively, which were much larger than those of CN and CNH samples. Based on the above facts, the increase in specific surface area can be attributed to the spalling effect of ammonia produced by the decomposition of ammonium molybdate in the g-C3N4 layers and O2 corrosion of g-C3N4 [14]. Then, the pore size distribution of the samples was examined (see Figure 4b). Compared with that of the bulk g-C3N4, the CNH sample has more pores with a large pore size of about 10~50 nm but fewer pores with a small pore size of roughly 3.833 nm, indicating that partial small pores are expanded into large mesopores under the erosion of O2. The change of small pores into large pores will lead to an increase in specific surface area and pore volume. Moreover, the pore diameter of the sample CNM-1 increases in both ranges, which can be explained by the fact that the escape of NH3 produces a large number of micro/mesopores and oxygen corrosion simultaneously. Furthermore, with an increasing concentration of ammonium molybdate in the precursor solution, the pore diameter distribution changed significantly. After examining the pore diameter of CNM-2, CNM-4, and CNM-8, it can be seen that more small-pore-size mesopores and fewer large-pore-size micropores are built in the samples. This phenomenon may be attributed to two factors. On the one hand, because the escape of more ammonia reduced the local oxygen concentration in the sample, the oxidation of g-C3N4 was limited, thereby restraining the further expansion of pores. On the other hand, after more MoO2 was deposed into the large pore, part of the large pore was blocked into small ones. As a result, there are more small pores and fewer large pores after adding more (NH4)2MoO4·4H2O.
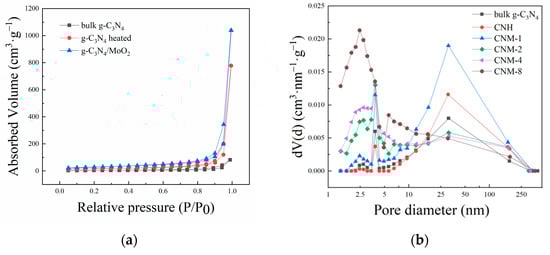
Figure 4.
(a) N2 adsorption-desorption isotherm and (b) pore diameter distribution of the prepared samples.
Table 2.
SBET, pore volume, and pore diameter of the prepared samples.
2.2. Synthesis Strategy and Formation Mechanism
According to the above characterization results of the samples, the synthesis strategy and formation mechanism of the CNM composite samples are proposed in Figure 5. As shown in Figure 5a, initially, bulk g-C3N4 was dispersed in ammonium molybdate solution under stirring in order to fully adsorb MoO42− and NH4+ on the g-C3N4 sheet. Considering that the radius of NH4+ is 0.142 nm and that of MoO42− is 0.192 nm, as well as from XRD data, the calculated radius of the small ring in the g-C3N4 sheet is 0.134 nm and the diameter of the large pot is 0.671 nm, the NH4+ and MoO42− ions in the precursor solution can only enter into the large pot in the g-C3N4 sheet [29,30], as shown in Figure 5b. Then, after centrifugation, the precipitate was collected and dried, obtaining the precursor for the preparation of the target sample. Finally, the precursor was placed in an Al2O3 ceramic boat and heated under an air atmosphere in a tube furnace to obtain the target sample. According to thermogravimetric analysis data of the precursors (see Figure S3), the samples with ammonium molybdate began to lose weight at around 450 °C and completely decomposed after 600 °C, whereas the original g-C3N4 sample began to lose weight after 500 °C and completely decomposed at 700 °C. Therefore, it can be deduced that the presence of ammonia would reduce the decomposition temperature and increase the decomposition rate of g-C3N4. Based on these facts, the formation mechanism of the present CNM samples can be proposed as follows (Figure 5b). MoO42− and NH4+ ions entered into the interlayer of bulk g-C3N4 and further entered into the large pot in the g-C3N4 lamellas. In the process of thermal treatment, the ammonium molybdate absorbed between the g-C3N4 nanosheets is decomposed. During this process, NH4+ is transformed into ammonia, and the escape of ammonia will destroy the van der Waals forces between g-C3N4 molecular layers, finally leading to exfoliated layers of g-C3N4. On the other hand, the amount of ammonia generated in the g-C3N4 nanosheets cannot diffuse out immediately and forms a reductive environment. Thus, MoO42− was decomposed into MoO3 initially, which was then converted into MoO2 at 500 °C in the reductive ammonia atmosphere [28]. At the same time, O2 in the air flow diffuses into the g-C3N4 interlayer and oxidizes g-C3N4, forming numerous pores of larger size in g-C3N4 (see Figure 5c). Finally, the proposed g-C3N4/MoO2 composites are formed.
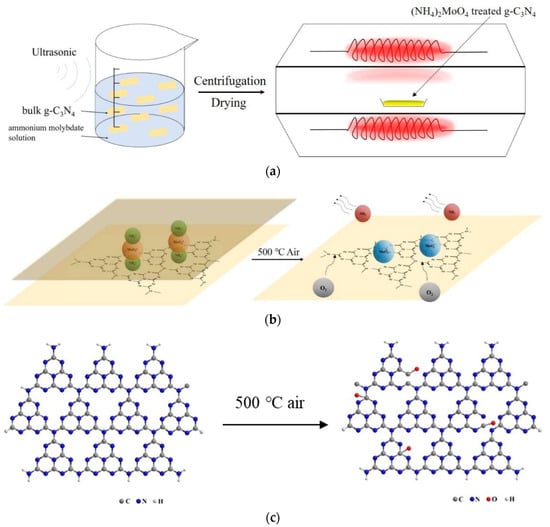
Figure 5.
Schematic diagrams of (a) the synthesis strategy for the samples, (b) the formation mechanism for the exfoliated g-C3N4/MoO2 composite, and (c) the oxidation mechanism for g-C3N4.
2.3. Photocatalytic H2 Evolution Performance
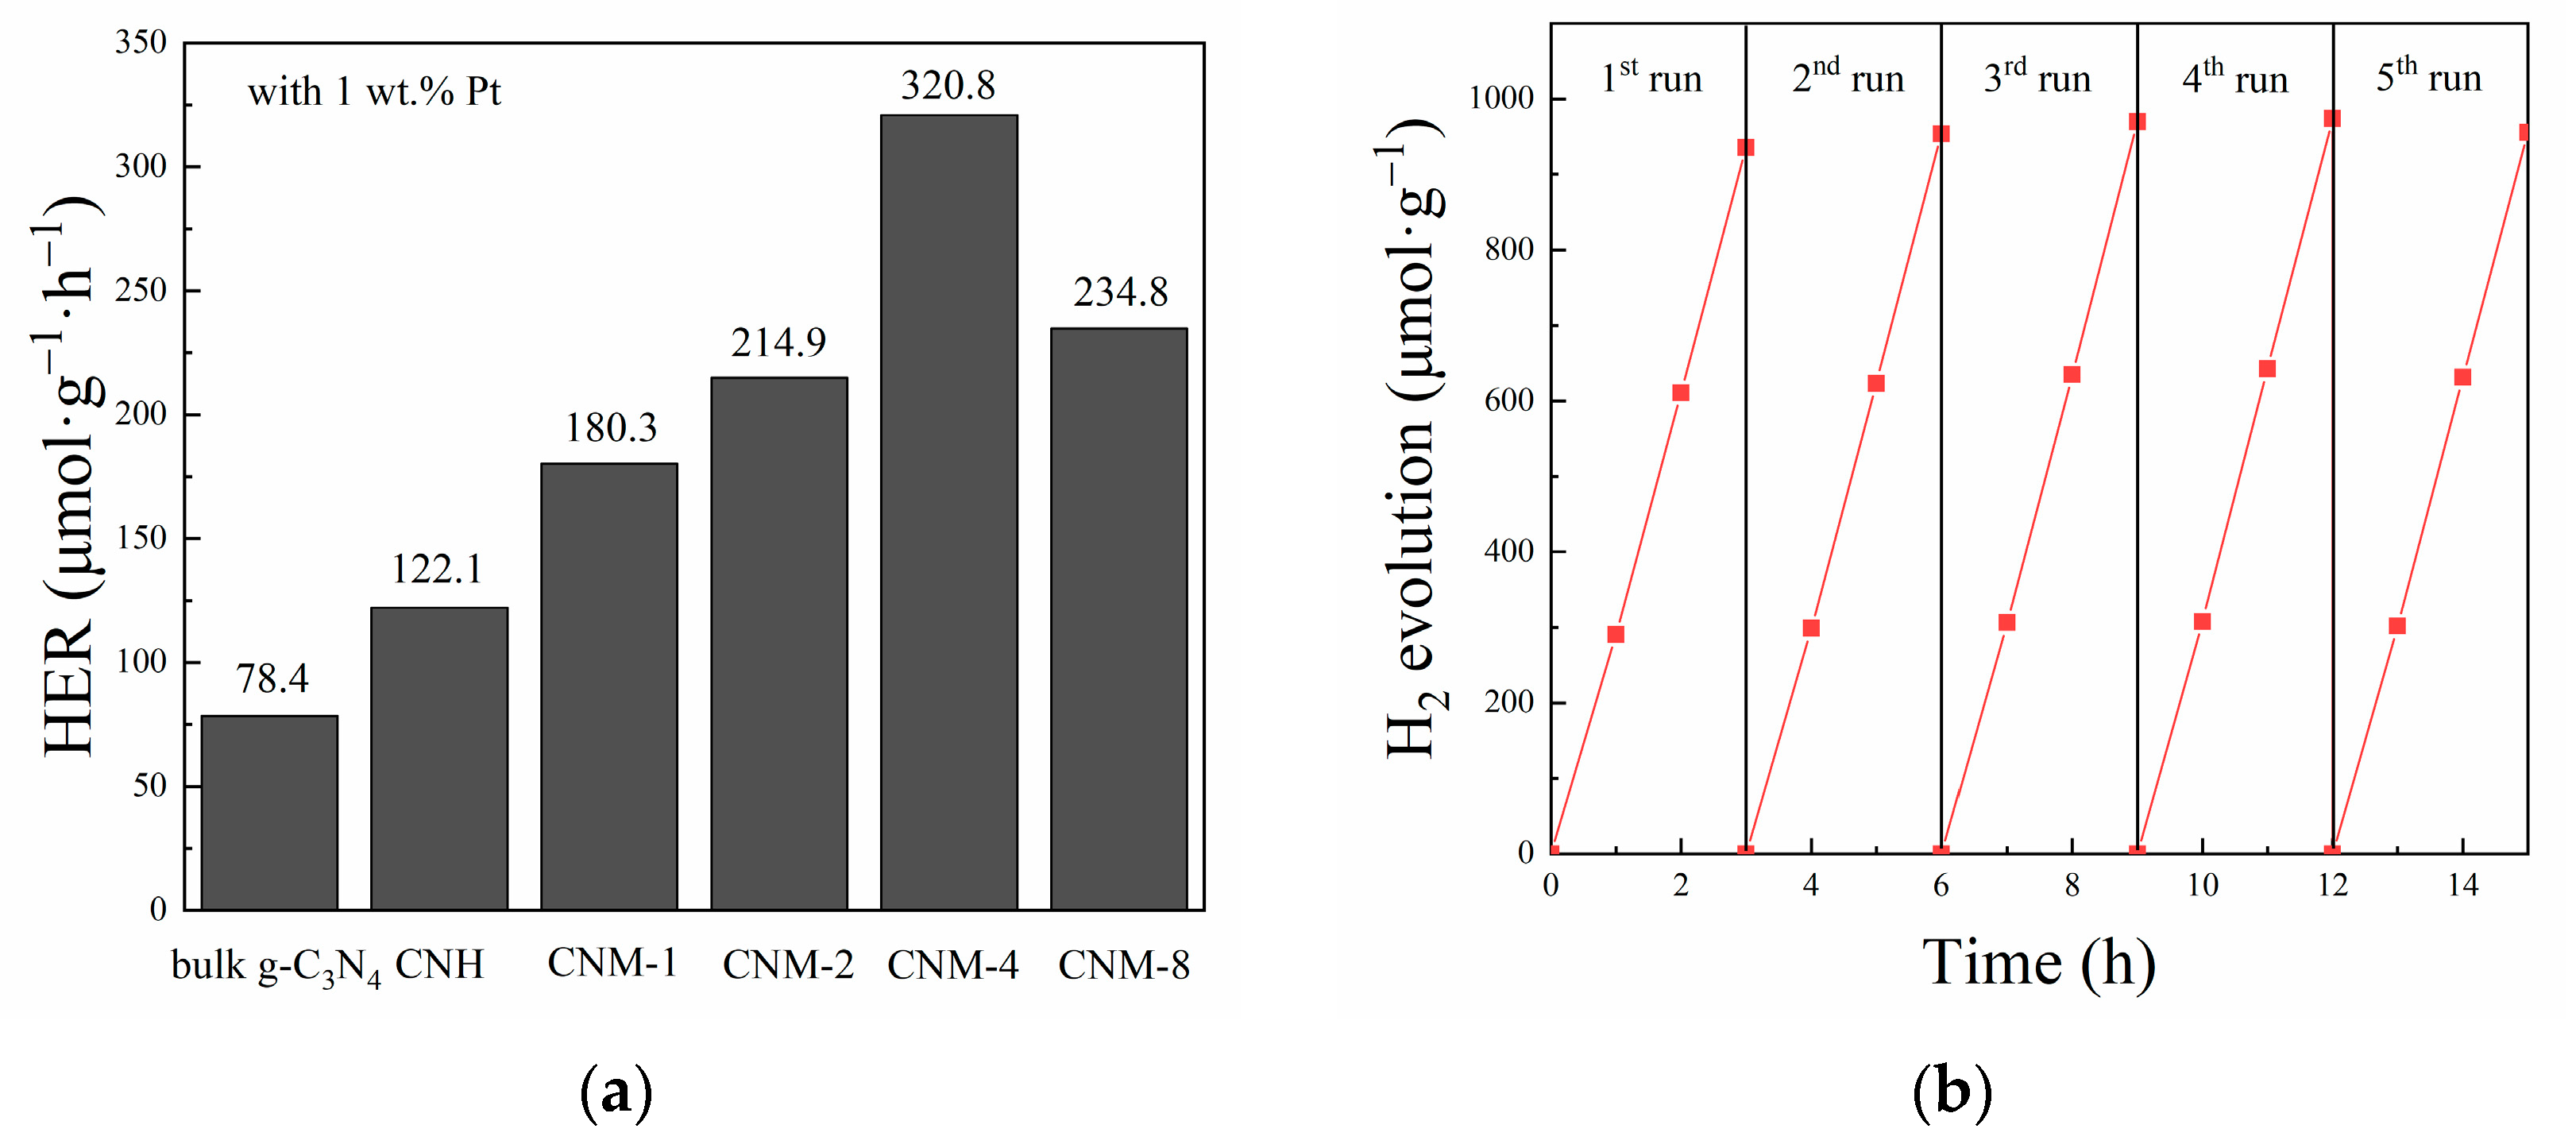
The photocatalytic performance was evaluated by measuring the photocatalytic hydrogen evolution ability over the samples under visible light, and the results are displayed in Figure 6. Figure 6a clearly shows that the HER of the samples CNH and CNM-1 to CNM-8 increases with increasing ammonium molybdate concentration in the pre-cursor solution, reaching a maximum value of 320.8 μmol·g−1·h−1 when the ammonium molybdate concentration is 4 mmol·L−1. However, under the same conditions, the photocatalytic HER of a bulk g-C3N4 sample is only 78.4 μmol·g−1·h−1. In other words, the performance of the optimal sample CNM-4 in this work is 4.1 times that of bulk g-C3N4. Therefore, it can be confirmed that the improved performance of the composite samples is due to the increasing amount of MoO2 in the samples and their enhanced specific surface area. Compared with CNM-4, the photocatalytic HER of the sample CNM-8 would be significantly reduced because the band gap of C3N4 in CNM-8 reaches 3.02 eV, which can only absorb light with a wavelength below 410 nm. However, because a 400 nm filter was used to cut off the UV light source below 400 nm in this work, the shortage of the available light for the sample CNM-8 would certainly result in the decline of its hydrogen evolution performance. Consequently, although a higher concentration of ammonium molybdate can be beneficial for both enhancing the amount of MoO2 and producing more pores in the sample CNM-8, the intensified oxidation of bulk g-C3N4 will widen the band gap of g-C3N4, making it impossible to make effective use of visible light. In addition, compared with bulk g-C3N4, although the sample CNH will lose partial absorption capacity of visible light sources due to the oxidation of g-C3N4, its photocatalytic hydrogen evolution performance was still improved significantly. This result can be attributed to the exposure of more active sites caused by the expansion of a specific surface area. The as-prepared composite samples thermally treated with ammonium molybdate show more excellent photocatalytic hydrogen evolution performance because of their larger specific surface area and more abundant mesopores in the samples. Based on the above results, it can be concluded that the improvement of photocatalytic hydrogen evolution performance of the present g-C3N4/MoO2 composite samples is caused by a synergistic effect of the MoO2 recombination with g-C3N4 and the increase in specific surface area. However, it has to be noted that excessive oxidation will reduce the light absorption range of g-C3N4, which will ultimately finally lead to a decline in the photocatalytic hydrogen evolution performance of the samples.
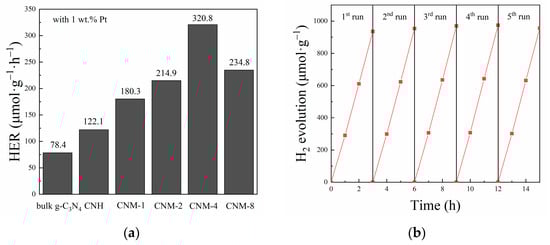
Figure 6.
(a) Photocatalytic H2 evolution rate of bulk g-C3N4, CNH, and all exfoliated g-C3N4/MoO2 composites; (b) cycling performance for H2 evolution over the optimal CNM-4 composite.
Moreover, whether a photocatalyst can work stably for a long time is also very important for its practical application. Therefore, cyclic stability tests were performed for the optimal sample CNM-4 under the same conditions as described above. Notably, the cyclic stability tests consist of 5 rounds of a 3 h photocatalytic hydrogen evolution process, for which the system should be re-evacuated after each run. From the test results shown in Figure 6b, it can be concluded that the sample CNM-4 has good stability for photocatalytic hydrogen evolution, since the sample can still maintain stable, high hydrogen evolution efficiency after five rounds of tests.
2.4. Photoelectrochemical Properties
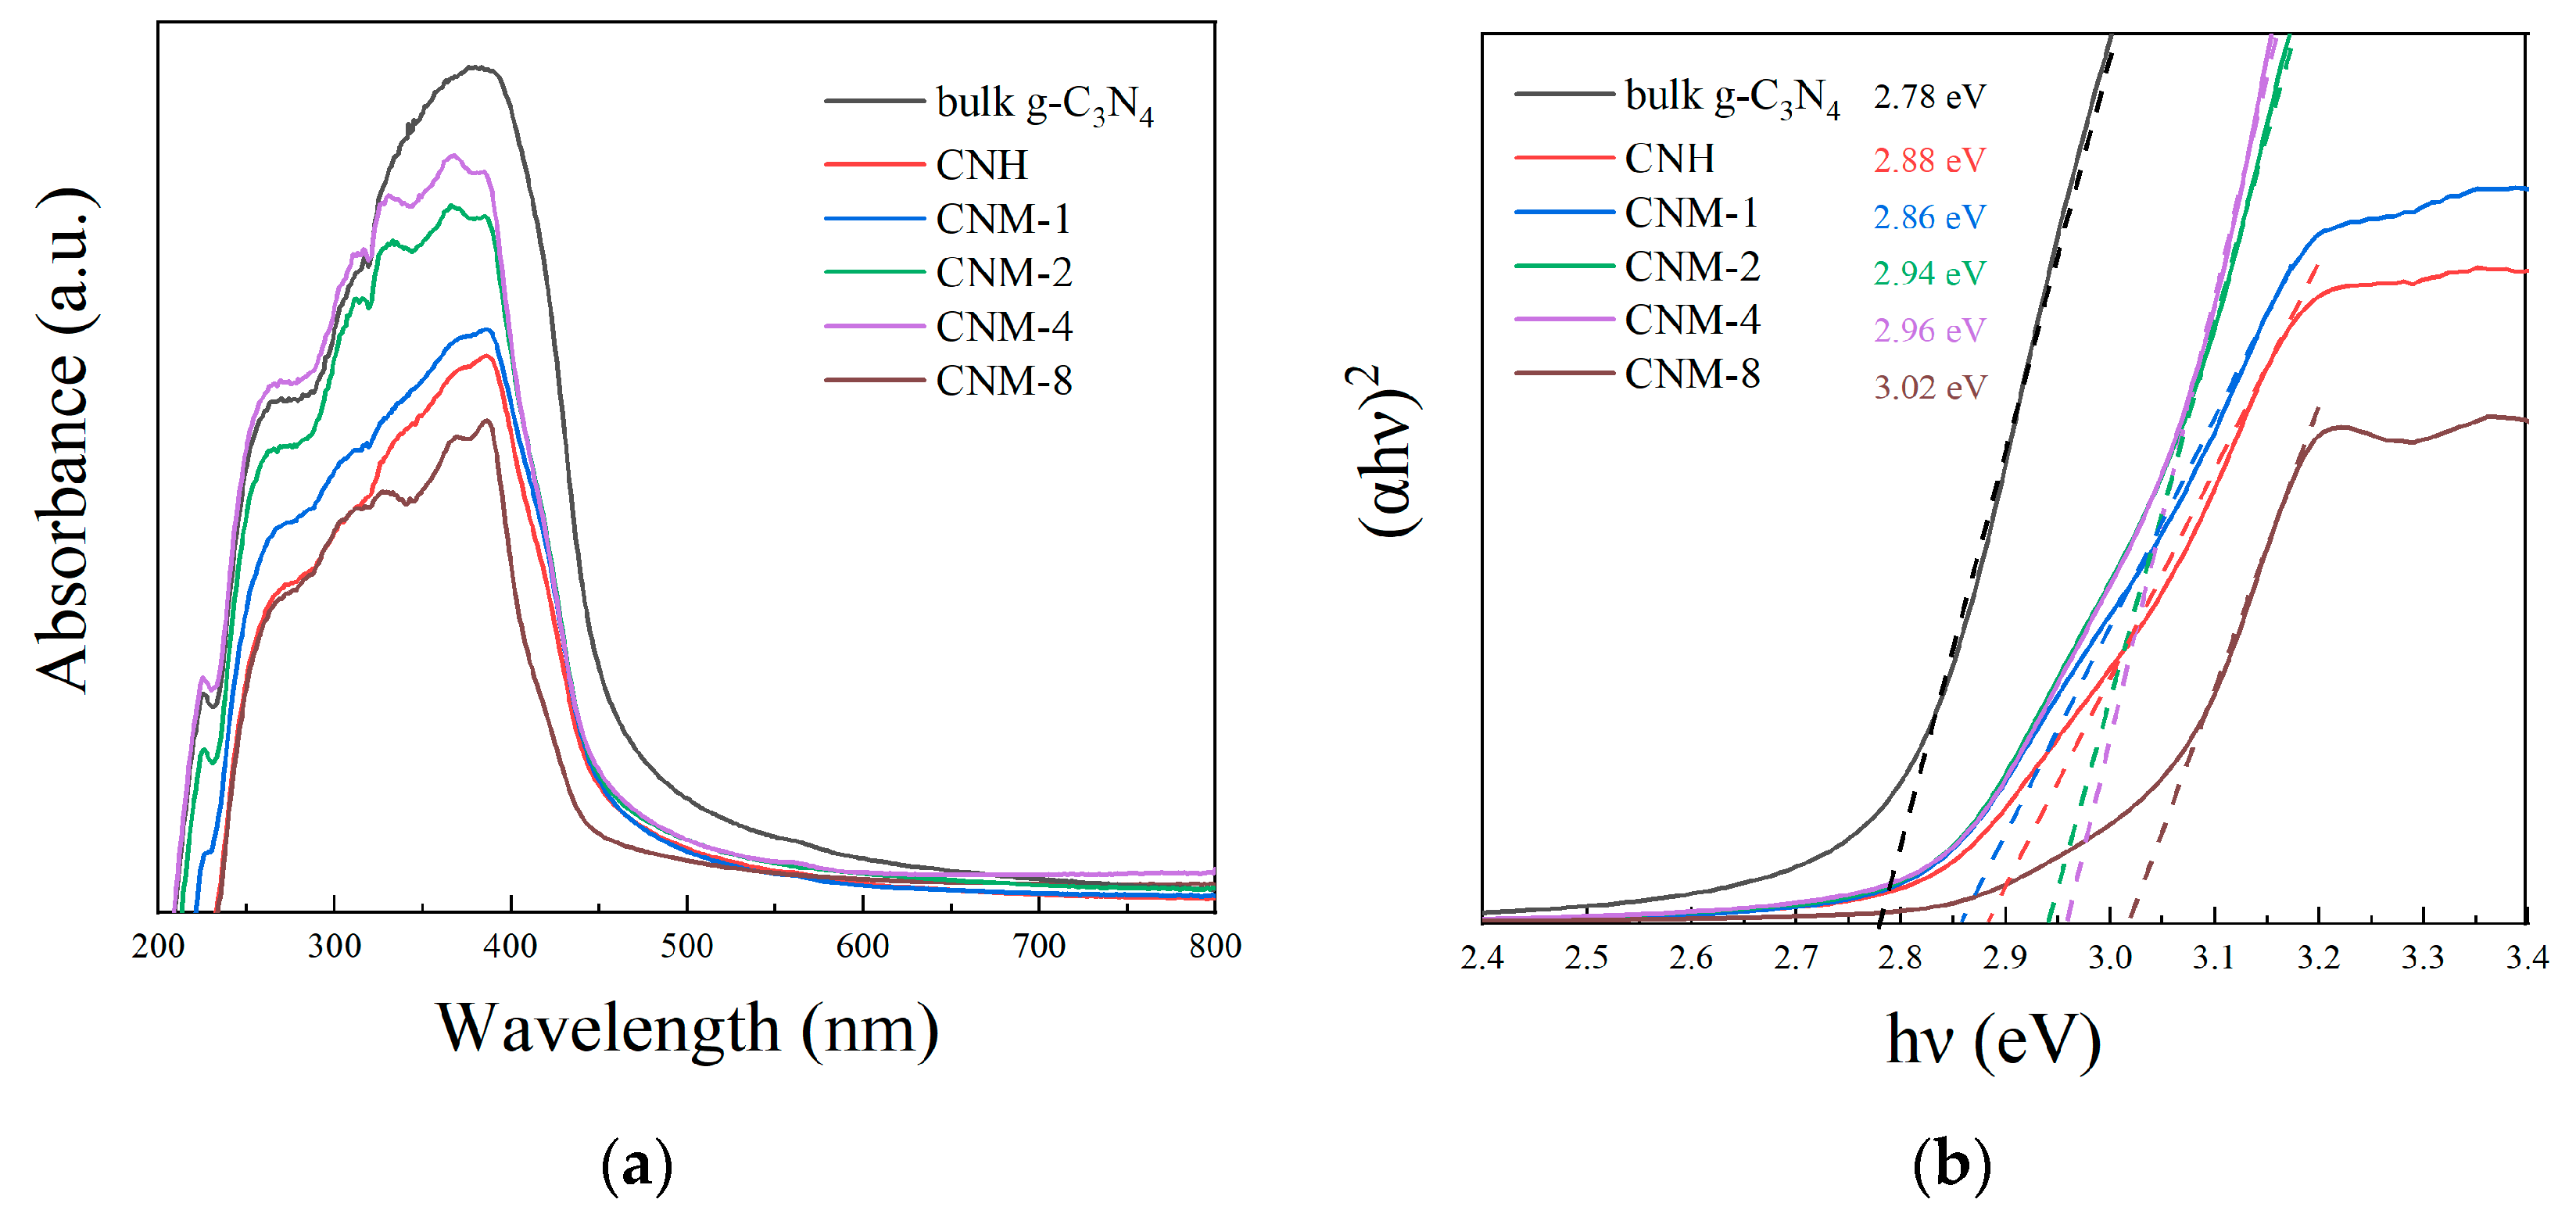
In order to characterize the absorption ability of the prepared materials for light, the UV-Vis absorption spectra of bulk g-C3N4, CNH, and all the g-C3N4/MoO2 composite samples were measured. Figure 7a shows the recorded spectra of these samples. As shown in the figure, when compared to bulk g-C3N4, after thermal treatment, the resultant samples CNH and CNM would have a lower light absorption capacity due to their widened band gap. Moreover, Figure 7b displays their corresponding (ahν)2 versus Eg plots, from which the band gap of the corresponding materials can be obtained. As can be seen, the band gap of the sample bulk g-C3N4, CNH, and CNM-1–CNM-8 is 2.78, 2.88, 2.86, 2.94, 2.96, and 3.02 eV, respectively, which can be attributed to the changed structure caused by the increased degree of oxidation on g-C3N4. The band gap of g-C3N4 is excited by π-π * excitation, in which the conjugated C 2p and N 2p orbitals in the heptazine form the conduction band, while the 2p orbitals of the edge N atoms form the valence band [31]. However, the oxidation of g-C3N4 will break the C=N bond conjugated structure into an N-C-O bond, resulting in an expanded band gap of g-C3N4 in the sample. Although the band gap of the samples CNM-1–CNM-4 continues to increase, their light absorption capacity becomes stronger and stronger, which can be attributed to the increased loading amount of MoO2 in the sample. On the other hand, the sample CNM-8 shows a poor light absorption capacity due to the greatly widened band gap of g-C3N4 caused by excessive oxidation.
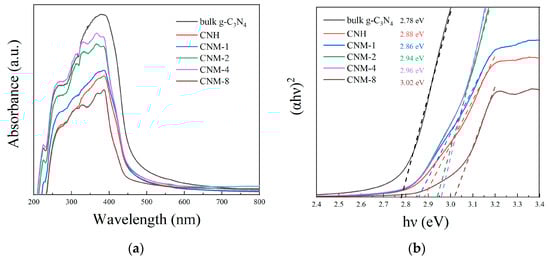
Figure 7.
(a) UV-Vis absorption spectra of bulk g-C3N4, CNH, and all g-C3N4/MoO2 composites, and (b) their corresponding (ahν)2 versus Eg plots.
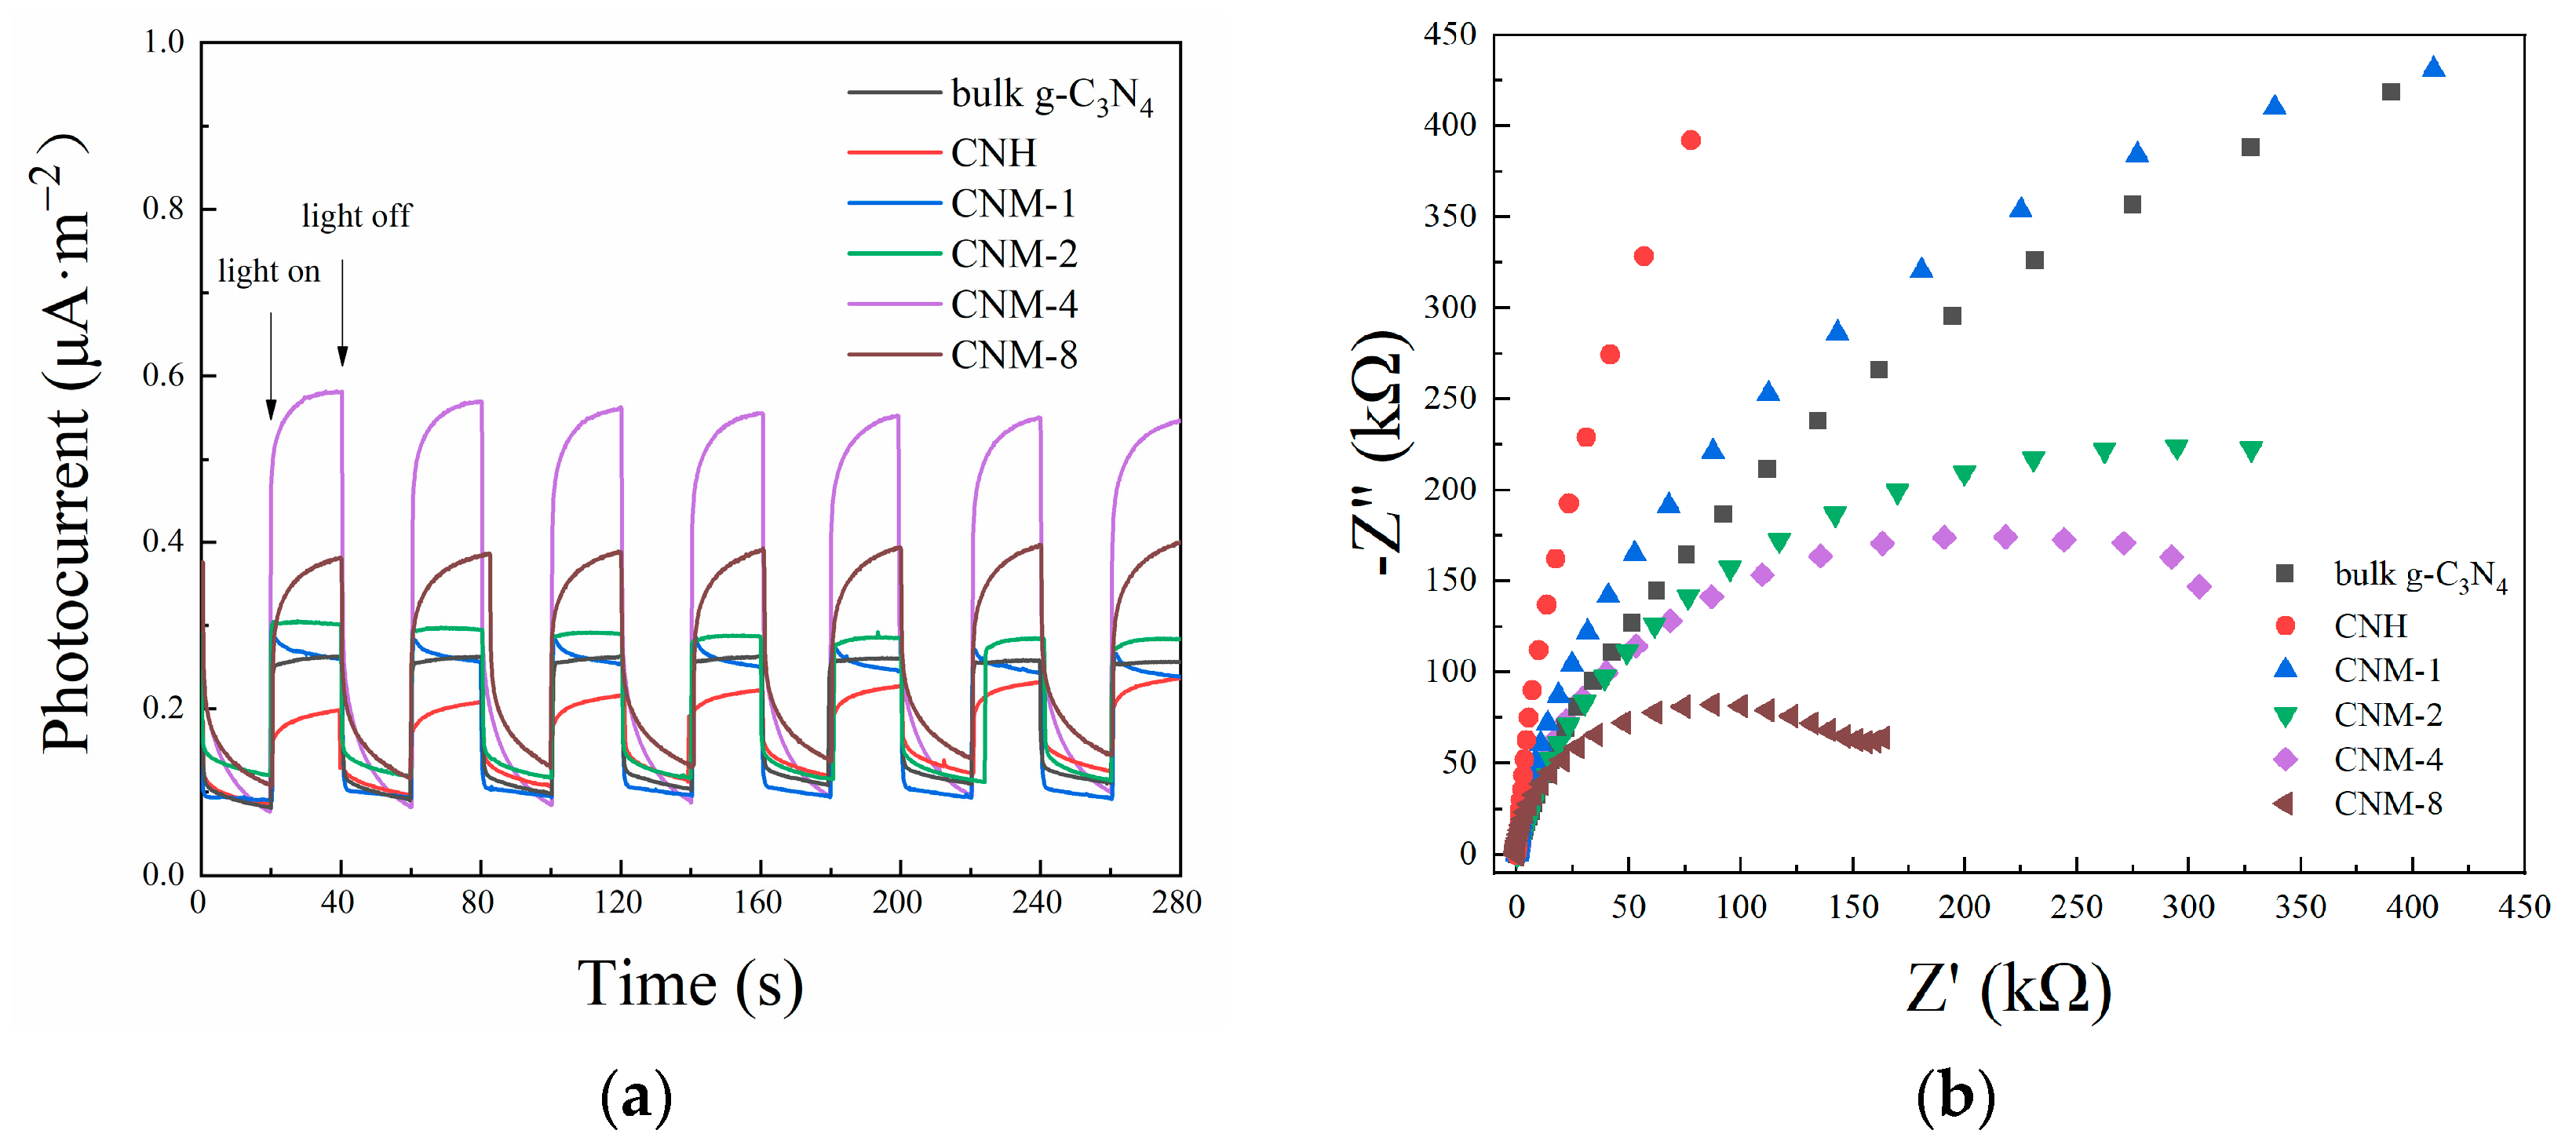
To explain the photocatalytic activity for hydrogen evolution of the prepared samples, their photoelectric response ability and carrier transport ability were investigated by transient photocurrent response and electrochemical impedance tests. Figure 8a shows the transient photocurrent response curves of all the samples. From this figure, it can be clearly seen that the optimal sample CNM-4, which presents the highest efficiency for photocatalytic hydrogen evolution, also has the strongest photocurrent response ability. It is easy to understand that its photocurrent intensity is stronger than those of the samples CNM-1 and CNM-2 because it contains more MoO2. Because the loaded MoO2 can effectively separate photogenerated electrons and holes, more free electrons will be converted into current without becoming internal energy after the compositing of MoO2 with g-C3N4. However, the photocurrent intensity of CNM-8 with the highest content of MoO2 is attenuated, which is obviously due to the poor light utilization ability of CNM-8, because it can only make use of the light in the band range between 400–410 nm after the light with a wavelength shorter than 400 nm is filtered. In addition, it is seen that the photocurrent intensity of bulk g-C3N4 is stronger than that of the sample CNH, because the widening of the band gap after the oxidation of g-C3N4 will result in a poor utilization efficiency of light.
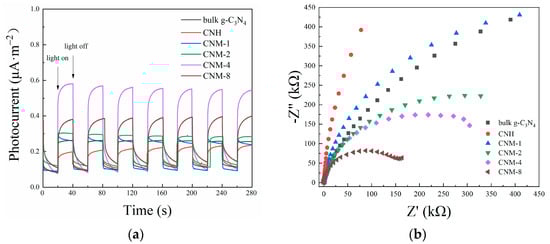
Figure 8.
Photoelectrochemical results of bulk g-C3N4, CNH, and all the exfoliated g-C3N4/MoO2 composites: (a) transient photocurrent response curves and (b) EIS Nyquist plots.
The EIS Nyquist plots of all the samples obtained from the electrochemical impedance test are shown in Figure 8b. Obviously, the impedance of all the samples after thermal treatment decreased with the increase of the MoO2 content in them. This phenomenon shows again that the compositing of MoO2 with g-C3N4 is conducive to the transfer of photogenerated carriers through the photocatalyst. Additionally, this result can be attributed to the following two reasons: firstly, MoO2 has better electrical conductivity than g-C3N4, and another reason is that the compositing of g-C3N4 with MoO2 forms a built-in electric field, which is also conducive to charge transmission. The resultant lower impedance is beneficial to improving the transmission efficiency of photogenerated carriers, preventing them from recombination, effectively improving the photocatalytic performance. In addition, the impedances of CNH and CNM-1 are higher than that of bulk g-C3N4, which is because the impedance depends on both g-C3N4 and MoO2. The impedance of g-C3N4 would be increased after it was oxidized, while the deposition of MoO2 with good electrical conductivity would decrease the impedance of the samples. The impedance of the samples is actually a balanced result between the oxidation of g-C3N4 and the deposition of MoO2. Consequently, the impedance of CNH is higher than that of bulk g-C3N4 due to the oxidation of g-C3N4. The impedance of CNM-1 is higher than that of bulk g-C3N4 because the deposition of a small amount of MoO2 cannot compensate for the counteracting effect of the oxidation of g-C3N4. In summary, the increase in MoO2 content in the composites can effectively reduce the impedance of the samples, while the oxidation of g-C3N4 will increase the impedance of the samples. Therefore, it is the superposition of the two factors that determines the final impedance of the samples.
2.5. Photocatalytic Mechanism
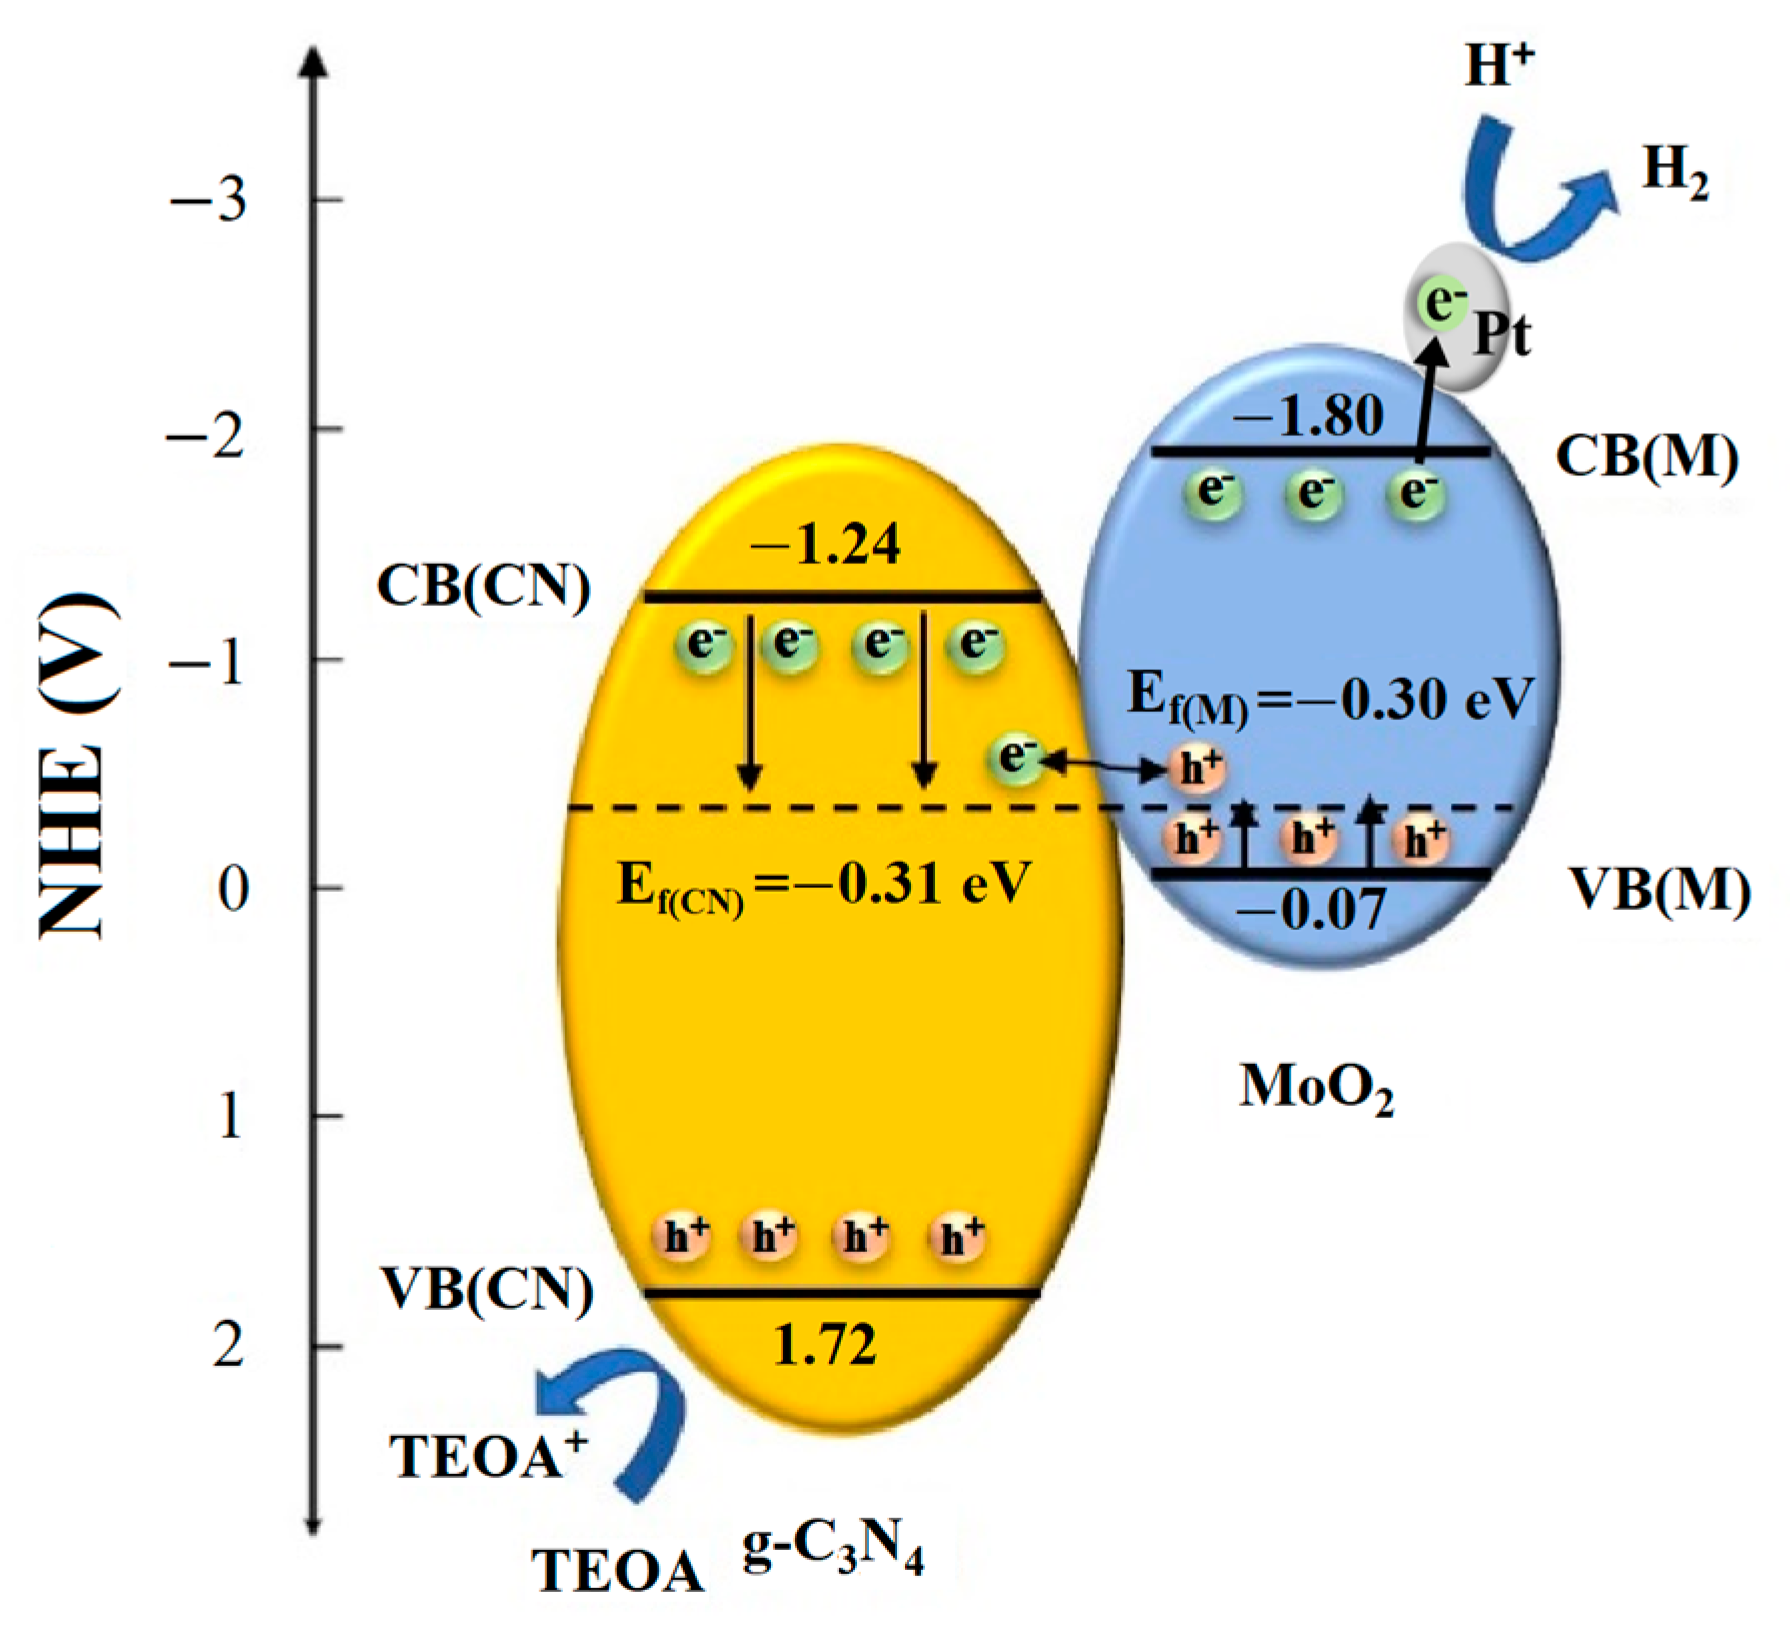
Based on the results mentioned above and the support of relevant theories, the photocatalytic hydrogen evolution mechanism over the obtained photocatalysts was proposed in Figure 9. In order to obtain the energy band correlation between g-C3N4 and MoO2 in the figure, with the optimal sample CNM-4 as an example, Mott-Schottky plots, VB-XPS spectra, and UV-Vis absorption spectra were carried out, and the results are displayed in Figure S4. In this study, the flat band potentials of CNM-4 and MoO2 can be obtained from the recorded Mott-Schottky plots, which are −0.53 and −0.52 eV, respectively. After eliminating the influence of the potential from the Ag/AgCl reference electrode, their final flat band potential values are −0.31 and −0.30 eV, respectively [32]. From the VB-XPS spectra, the potential differences in the energy bands of CNM-4 and MoO2 from the valence band top to the Fermi level are 2.02 and 0.23 eV, respectively [33]. In general, the flat band potential value is approximately equal to the Fermi level [32,34]. Based on the above data, it can be calculated that the valence band values of CNM-4 and MoO2 are 1.72 and −0.07 eV, respectively. In addition, the band gap of CNM-4 and MoO2 could be obtained from Figure 7b and Figure S4, and the calculated values of their valence bands are −1.24 and −1.80 eV, respectively. Finally, according to the energy band data obtained from the test, the photocatalytic hydrogen evolution mechanism was proposed.

Figure 9.
Schematic diagram of the photocatalytic HER mechanism over the g-C3N4/MoO2 composites.
As is seen, three factors are considered to influence the photocatalytic hydrogen evolution performance of g-C3N4/MoO2 composite. The first is the heterojunction between g-C3N4 and MoO2, which can form a built-in electric field there and promote the separation of photogenerated electrons and holes, preventing them from recombination. Under the irradiation of visible light, the photocatalyst was excited to generate lots of free electrons and holes. The photogenerated electrons in the conduction band of g-C3N4 pass across the heterojunctions through the connected Fermi level due to the energy difference between the two sides of the heterojunction into MoO2, which can combine with the holes in the valence band of MoO2, where a depletion layer is formed. As a result, the counteraction of electrons was prevented, thus retaining the holes in the valence band of g-C3N4 and the electrons in the conduction band of MoO2. These free photogenerated electrons will further rapidly move to the Pt particles deposited on the surface of the catalysts and attend to the redox reaction with H+ in the solution to produce hydrogen. Meanwhile, the photogenerated holes in g-C3N4 can react with TEOA to be quenched. Of course, the transfer process of carriers from conduction band to conduction band and/or from valence band to valence band in such a Type II heterojunction may also be in question. Nevertheless, if the electrons in the valence band of g-C3N4 are transferred to the valence band of MoO2, the total oxidation potential of the catalyst will decrease dramatically. As a result, it is unable to react with TEOA. So, such a process was almost impossible during the photocatalytic process over the present composite catalyst. In other words, the formation of heterojunctions promotes the photocatalytic hydrogen evolution of the present composite catalyst.
The second factor is the exfoliation of g-C3N4, which can effectively increase the specific surface area and form numerous mesopores in the catalyst. A larger specific surface area is conducive to the exposure of active sites in a catalyst, and the formation of more mesopores is advantageous to the adsorption of reaction substrates and the release of the formed hydrogen. This point explains the improvement in the photocatalytic hydrogen evolution performance of the samples CNM-1–CNM-8.
Finally, the oxidation of g-C3N4 during thermal treatment causes the π-π conjugated structures in the heptazine group to be destroyed, which will widen the band gap. With the increasing oxidation degree, the band gap of the samples increases gradually. As a result, the band wavelength of visible light that can be used for photocatalytic hydrogen evolution will be narrowed, ultimately degrading the photocatalytic performance of the sample.
In summary, the photocatalytic hydrogen evolution performance of the present g-C3N4/MoO2 samples is affected by three factors: the loading amount of MoO2, the extent of exfoliation, and the degree of g-C3N4 oxidation. Among them, high MoO2 content and full exfoliation are conducive to photocatalysis, but the oxidation of g-C3N4 is also intensified with increasing content of MoO2 in the sample. Therefore, the sample CNM-4 instead of CNM-8 is the optimal sample for photocatalytic hydrogen evolution by adjusting the synthesis and application conditions.
3. Experimental Details
3.1. Raw Materials
Ammonium molybdate ((NH4)2MoO4, 99.0%) and sodium sulfate anhydrous (Na2SO4, 99.0%) were bought from Sinopharm Chemical Reagent Co., Ltd. (Shanghai, China). Melamine (99.0%), triethanolamine (TEOA, 98.0%), and molybdenum dioxide (MoO2, 99.0%) were bought from Aladdin Reagent Co., Ltd. (Shanghai, China). Potassium hexachloroplatinate (K2PtCl6, 99.9%) was purchased from Macklin Biochemical Co., Ltd. (Shanghai, China). All the raw materials are used without further treatment in this work.
3.2. Preparation of g-C3N4
The g-C3N4 sample was synthesized by calcining melamine in the air [26]. Typically, 10 g of melamine was placed into an Al2O3 ceramic crucible with a half cover and the calcination was carried out in a muffle furnace at 550 °C for 4 h. After the calcination, a bulk g-C3N4 sample could be obtained, and by grinding the collected bulk sample in a mortar, g-C3N4 powder was ready for use.
3.3. Preparation of CNM Nanocomposites
The composite samples of g-C3N4 and MoO2 (CNM) were synthesized by a one-step calcination method. Typically, a certain amount of ammonium molybdate powder was dissolved in 100 mL of deionized water. Then, 1 g of bulk g-C3N4 powder was added into the prepared ammonium molybdate solution and dispersed for 1 h under stirring. Afterwards, a precursor could be obtained from the sediment by centrifuging and following drying. Finally, the precursor was placed in an Al2O3 ceramic boat and heated under an air atmosphere at 500 °C for 2 h in a tube furnace to obtain the target sample. The samples obtained by thermally treating g-C3N4 powder with different concentrations of ammonium molybdate solution (1, 2, 4, and 8 mmol/L) were named CNM-1, CNM-2, CNM-4, and CNM-8, respectively. In addition, a sample using the same process for the preparation of CNM samples but without ammonium molybdate in deionized water was also prepared as the control sample (CNH).
3.4. Materials Characterization
The morphology and microstructure of the samples were observed by a field-emission scanning electron microscope (FE-SEM, Gemini SEM 500, Carl Zeiss, Oberkohen, Germany) and transmission electron microscope (TEM, FEI Tecnai G2 F20 U-TWIN, Hillsborough, OR, USA). The elemental compositions in the samples were examined by the energy dispersive X-ray spectroscope attached to the TEM. The phase composition of the samples was identified by X-ray diffraction (XRD, D/max-RB, Tokyo, Japan; Cu Kα radiation, λ = 1.5418 Å) in a continuous scanning mode at a speed of 8°·min−1. An X-ray photoelectron spectroscope (XPS, EscaLab MKII, Thermo Fisher Scientific, Waltham, MA, USA; C 1s of 284.8 eV as reference) was utilized to investigate the elemental composition and chemical state. An Agilent Varian Cary 5000 UV-Vis spectrometer (Palo Alto, CA, USA) was used to record the UV-Vis absorption spectra of the samples by using solid powders. N2 adsorption-desorption curves were measured by using a Quantachrome Autosorb-IQ adsorption instrument (Boynton Beach, FL, USA). In addition, the specific surface area and pore-size distribution of the samples were evaluated by the multipoint Brunner–Emmet–Teller (BET) and Barret–Joyner–Halenda (BJH) methods, respectively. A Linseis STA PT1600 thermogravimetric analyzer (TGA, Zelbu, Germany) was used to collect the data for thermogravimetric analysis.
3.5. Evaluation of Photocatalytic H2 Evolution
The hydrogen evolution test of each sample was carried out on a Labsolar IIIAG automatic photocatalytic system from PerfectLight (Beijing, China). During the test, 50 mg of sample was first dispersed in 100 mL of 10 vol.% triethanolamine (TEOA) aqueous solution. Then, a small amount of K2PtCl6 equivalent to 1 wt.% of the tested sample was added into the system for the deposition of Pt onto the sample surface by Xe lamp illumination for 30 min. Afterwards, the photocatalytic hydrogen evolution performance of the samples was evaluated under the illumination of an Xe lamp for 3 h. All the light sources were provided with a 300 W Xe lamp equipped with a 400 nm UV cut-off filter and 20 cm away from the top of the reactor. The testing temperature was maintained at 7 °C by circulating cooling water to prevent boiling. The resultant gas was analyzed by gas chromatography (Techcomp GC-7900, Shanghai, China), in which the carrier gas was N2. The cyclic tests were repeated five times under the same test conditions.
3.6. Electrochemical Measurements
The working electrode employed in the electrochemical tests was prepared by 50 μL of ink coating on a FTO glass substrate, which was composed of the as-prepared powder photocatalyst (5 mg), 20 μL of 5 wt.% Nafion ethanol solution, and 500 μL of ethanol. The area covered by the ink on the FTO glass was 1 cm2. Additionally, the electrolyte solution was a 0.2 M Na2SO4 aqueous solution.
All the related electrochemical tests were performed on a CHI 660E electrochemical workstation by using a three-electrode system, in which the counter electrode was Pt foil, and the reference electrode was Ag/AgCl. The light source was provided by a 300 W Xe lamp equipped with an UV cut-off filter (λ ≥ 400 nm).
4. Conclusions
An exfoliated g-C3N4/MoO2 composite was synthesized by a simple and effective (NH4)2MoO4-induced one-step calcination method. Specifically, through the thermal decomposition of (NH4)2MoO4, the gaseous product NH3 and water vapor between the g-C3N4 layers can expand the layer spacing and thus the oxygen in the air flow can accelerate the oxidation and depolymerization process of g-C3N4, finally realizing the exfoliation of g-C3N4, while the solid product MoO3 is transformed into MoO2 in the NH3 atmosphere, finally loading on the g-C3N4 surface. Such exfoliated g-C3N4/MoO2 composites show an effectively improved photocatalytic hydrogen evolution performance, in which the optimal g-C3N4/MoO2 composite has a high specific surface area and presents a high HER (320.8 μmol·g−1·h−1) under visible light, reaching 4.1 times that of bulk g-C3N4. The improvement in photocatalytic activity of the present g-C3N4/MoO2 composites can be attributed to the full exposure of active sites caused by the enhanced specific surface area and the formation of numerous mesopores in the catalysts, as well as the formation of abundant heterojunctions between g-C3N4 and MoO2, which alleviates the recombination of photogenerated carriers. In addition, it should be noted that the oxidation of g-C3N4 will widen the band gap of g-C3N4 and reduce its utilization ability in visible light. The present strategy will provide a new idea for the simple realization of exfoliation and constructing a heterojunction for g-C3N4 simultaneously.
Supplementary Materials
The following supporting information can be downloaded at: https://www.mdpi.com/article/10.3390/molecules27217178/s1, Figure S1: Typical low-magnification SEM images of (a) CNM-1, (b) CNM-2, (c) CNM-4, (d) CNM-8. Figure S2: XPS survey spectrum of the optimal sample CNM-4. Figure S3: TG curves of bulk g-C3N4 and the precursors to prepare the different exfoliated g-C3N4/MoO2 composites. Figure S4: Valence-band XPS spectrum (a) and Motto-Schottky plot (b) of the optimal sample CNM-4. Valence-band XPS spectrum (c) and Motto-Schottky plot (d) of MoO2. (e) (αhν)2 versus Eg plot of MoO2.
Author Contributions
Conceptualization, Z.P.; methodology, Y.C. and A.L.; formal analysis, Y.C., A.L. and X.F.; investigation, Y.C. and A.L.; resources, Z.P. and X.F.; writing—original draft preparation, Y.C. and A.L.; writing—review and editing, Z.P. and X.F.; supervision, Z.P. and X.F.; project administration, Z.P. and X.F.; funding acquisition, Z.P. and X.F. All authors have read and agreed to the published version of the manuscript.
Funding
This research was funded by the Fundamental Research Funds for the Central Universities and the National Natural Science Foundation of China (grant Nos. 11674035 and 61274015).
Institutional Review Board Statement
Not applicable.
Informed Consent Statement
Not applicable.
Data Availability Statement
Not applicable.
Conflicts of Interest
The authors declare no conflict of interest.
Sample Availability
Samples of the compounds in this article are available from the authors.
References
- Yue, S.; Chen, L.; Zhang, M.K.; Liu, Z.; Chen, T.; Xie, M.Z.; Cao, Z.; Han, W.H. Electrostatic Field Enhanced Photocatalytic CO2 Conversion on BiVO4 Nanowires. Nano-Micro Lett. 2022, 14, 15. [Google Scholar] [CrossRef] [PubMed]
- Luo, Y.P.; Li, H.; Luo, Y.L.; Li, Z.; Qi, Y.; Zhang, F.X.; Li, C. Heterostructure of Ta3N5 Nanorods and CaTaO2N Nanosheets Fabricated Using a Precursor Template to Boost Water Splitting under Visible Light. J. Energy Chem. 2022, 67, 27–33. [Google Scholar] [CrossRef]
- Ong, W.J.; Tan, L.L.; Ng, Y.H.; Yong, S.T.; Chai, S.P. Graphitic Carbon Nitride (g-C3N4)-Based Photocatalysts for Artificial Photosynthesis and Environmental Remediation: Are We a Step Closer to Achieving Sustainability? Chem. Rev. 2016, 116, 7159–7329. [Google Scholar] [CrossRef] [PubMed]
- Mulungulungu, G.A.; Mao, T.T.; Han, K. Two-Dimensional Graphitic Carbon Nitride-Based Membranes for Filtration Process: Progresses and Challenges. Chem. Eng. J. 2022, 427, 130955. [Google Scholar] [CrossRef]
- Hong, Y.Z.; Li, C.S.; Fang, Z.Y.; Luo, B.F.; Shi, W.D. Low-Temperature Solid-State Preparation of Ternary CdS/g-C3N4/CuS Nanocomposites for Enhanced Visible-Light Photocatalytic H2-Production Activity. Carbon 2017, 121, 463–471. [Google Scholar] [CrossRef]
- Hummers, W.S.; Offeman, R.E. Preparation of Graphitic Oxide. J. Am. Chem. Soc. 1958, 80, 1339. [Google Scholar] [CrossRef]
- Lee, J.H.; Park, M.J.; Yoo, S.J.; Jang, J.H.; Kim, H.J.; Nam, S.W.; Yoon, C.W.; Kim, J.Y. A Highly Active and Durable Co-N-C Electrocatalyst Synthesized Using Exfoliated Graphitic Carbon Nitride Nanosheets. Nanoscale 2015, 7, 10334–10339. [Google Scholar] [CrossRef]
- Zhang, J.; Zhang, M.; Lin, L.; Wang, X. Sol Processing of Conjugated Carbon Nitride Powders for Thin-Film Fabrication. Angew. Chem. Int. Ed. 2015, 54, 6297–6301. [Google Scholar] [CrossRef]
- Zhang, S.; Li, J.; Wang, X.; Huang, Y.; Zeng, M.; Xu, J. In Situ Ion Exchange Synthesis of Strongly Coupled Ag@AgCl/g-C3N4 Porous Nanosheets as Plasmonic Photocatalyst for Highly Efficient Visible-Light Photocatalysis. ACS Appl. Mater. Interfaces 2014, 6, 22116–22125. [Google Scholar] [CrossRef]
- Shi, L.; Chang, K.; Zhang, H.B.; Hai, X.; Yang, L.Q.; Wang, T.; Ye, J.H. Drastic Enhancement of Photocatalytic Activities over Phosphoric Acid Protonated Porous g-C3N4 Nanosheets under Visible Light. Small 2016, 12, 4431–4439. [Google Scholar] [CrossRef]
- Li, J.; Fang, J.; Gao, L.; Zhang, J.W.; Ruan, X.C.; Xu, A.H.; Li, X.X. Graphitic Carbon Nitride Induced Activity Enhancement of OMS-2 Catalyst for Pollutants Degradation with Peroxymonosulfate. Appl. Surf. Sci. 2017, 402, 352–359. [Google Scholar] [CrossRef]
- Lin, Q.Y.; Li, L.; Liang, S.J.; Liu, M.H.; Bi, J.H.; Wu, L. Efficient Synthesis of Monolayer Carbon Nitride 2D Nanosheet with Tunable Concentration and Enhanced Visible-Light Photocatalytic Activities. Appl. Catal. B 2015, 163, 135–142. [Google Scholar] [CrossRef]
- Niu, P.; Zhang, L.L.; Liu, G.; Cheng, H.M. Graphene-Like Carbon Nitride Nanosheets for Improved Photocatalytic Activities. Adv. Funct. Mater. 2012, 22, 4763–4770. [Google Scholar] [CrossRef]
- Wu, X.H.; Gao, D.D.; Wang, P.; Yu, H.G.; Yu, J.G. NH4Cl-Induced Low-Temperature Formation of Nitrogen-Rich g-C3N4 Nanosheets with Improved Photocatalytic Hydrogen Evolution. Carbon 2019, 153, 757–766. [Google Scholar] [CrossRef]
- Wang, X.H.; Wang, X.H.; Tian, W.L.; Meng, A.; Li, Z.J.; Li, S.X.; Wang, L.; Li, G.C. High-Energy Ball-Milling Constructing P-doped g-C3N4/MoP Heterojunction with Mo-N Bond Bridged Interface and Schottky Barrier for Enhanced Photocatalytic H2 evolution. Appl. Catal. B 2022, 303, 120933. [Google Scholar] [CrossRef]
- Zeng, Y.D.; Xu, Y.L.; Zhong, D.J.; Yao, H.Y.; Zhong, N.B. Peroxymonosulfate Activated by Photocatalytic Fuel Cell with g-C3N4/BiOI/Ti Photoanode to Enhance Rhodamine B Degradation and Electricity Generation. J. Hazard. Mater. 2022, 425, 127967. [Google Scholar] [CrossRef]
- Li, A.; Peng, Z.J.; Fu, X.L. Simple Hydrothermal Synthesis of g-C3N4/Ni9S8 Composites for Efficient Photocatalytic H2 evolution. J. Mater. Sci. Mater. Electron. 2021, 32, 21643–21657. [Google Scholar] [CrossRef]
- Liu, X.H.; Yin, Y.X.; Du, F.; Bai, J.R.; Luo, B.; Cheng, C.; Chen, Q.Y.; He, C. In Situ Synthesis of Ultrafine Metallic MoO2/Carbon Nitride Nanosheets for Efficient Photocatalytic Hydrogen Generation: A Prominent Cocatalytic Effect. Catal. Sci. Technol. 2020, 10, 4053–4060. [Google Scholar] [CrossRef]
- Inzani, K.; Nematollahi, M.; Vullum-Bruer, F.; Grande, T.; Reenaas, T.W.; Selbach, S.M. Electronic Properties of Reduced Molybdenum Oxides. Phys. Chem. Chem. Phys. 2017, 19, 9232–9245. [Google Scholar] [CrossRef]
- di Mauro, A.; Natile, M.M.; Landstrom, A.; Concina, I.; Ferroni, M.; Privitera, V.; Impellizzeri, G.; Epifani, M. Visible Light Photodegradation of Dyes and Paracetamol by Direct Sensitization Mechanism onto Metallic MoO2 Nanocrystals. J. Photochem. Photobiol. A 2021, 413, 113258. [Google Scholar] [CrossRef]
- Ding, M.M.; Xu, H.; Liu, M.X.; Wang, Y.T.; Wang, A.Q.; Lin, T.; Zhang, L.; Zhang, K. Interface Construction and Porosity Engineering to Trigger Efficient Hydrogen Evolution of Two-Dimensional Porous Molybdenum Phosphide/Dioxide Heterojunction Nanosheets in Acidic and Alkaline Electrolytes. Chem. Eng. J. 2022, 430, 132674. [Google Scholar] [CrossRef]
- Cai, D.Q.; Yang, J.L.; Liu, T.; Zhao, S.X.; Cao, G.Z. Interfaces-Dominated Li2S Nucleation Behavior Enabled by Heterostructure Catalyst for Fast Kinetics Li-S Batteries. Nano Energy 2021, 89, 106452. [Google Scholar] [CrossRef]
- Li, H.J.W.; Zhou, H.M.; Chen, K.J.; Liu, K.; Li, S.; Jiang, K.X.; Zhang, W.H.; Xie, Y.B.; Cao, Z.; Li, H.M.; et al. Metallic MoO2-Modified Graphitic Carbon Nitride Boosting Photocatalytic CO2 Reduction via Schottky Junction. Solar RRL 2020, 4, 1900416. [Google Scholar] [CrossRef]
- Yadav, P.; Gopalaiah, K.; Shrivastava, V.; Nagarajan, R. Microspherical Core-Shell MoO2-Graphitic C3N4 Heterojunction Promoted Integration Leading to Krohnke Pyridines and Degradation of Xylenol Orange. Mater. Today Commun. 2021, 26, 102117. [Google Scholar] [CrossRef]
- Ji, H.Y.; Fei, T.; Zhang, L.L.; Yan, J.; Fan, Y.M.; Huang, J.H.; Song, Y.H.; Man, Y.H.; Tang, H.; Xu, H.; et al. Synergistic Effects of MoO2 Nanosheets and Graphene-Like C3N4 for Highly Improved Visible Light Photocatalytic Activities. Appl. Surf. Sci. 2018, 457, 1142–1150. [Google Scholar] [CrossRef]
- Li, A.; Peng, Z.J.; Fu, X.L. Exfoliated, Mesoporous W18O49/g-C3N4 Composites for Efficient Photocatalytic H2 Evolution. Solid State Sci. 2020, 106, 106298. [Google Scholar] [CrossRef]
- Ma, B.; Hao, W.Y.; Ruan, W.H.; Yuan, C.; Wang, Q.H.; Teng, F. Unveiling capacitive behaviors of MoO2 in different electrolytes and flexible MoO2-based asymmetric micro-supercapacitor. J. Energy Storag. 2022, 52, 104833. [Google Scholar] [CrossRef]
- Bai, L.Q.; Zhang, Y.H.; Zhang, L.K.; Zhang, Y.X.; Sun, L.; Ji, N.; Li, X.W.; Si, H.C.; Zhang, Y.; Huang, H.W. Jahn-Teller Distortions in Molybdenum Oxides: An Achievement in Exploring High Rate Supercapacitor Applications and Robust Photocatalytic Potential. Nano Energy 2018, 53, 982–992. [Google Scholar] [CrossRef]
- Shannon, R.D. Revised Effective Ionic Radii and Systematic Studies of Interatomie Distances in Halides and Chaleogenides. Acta Cryst. 1976, 32, 751–767. [Google Scholar] [CrossRef]
- Zhao, D.M.; Dong, C.L.; Wang, B.; Chen, C.; Huang, Y.C.; Diao, Z.D.; Li, S.Z.; Guo, L.J.; Shen, S.H. Synergy of Dopants and Defects in Graphitic Carbon Nitride with Exceptionally Modulated Band Structures for Efficient Photocatalytic Oxygen Evolution. Adv. Mater. 2019, 31, 1903545. [Google Scholar] [CrossRef]
- Wang, Y.; Silveri, F.; Bayazit, M.K.; Ruan, Q.; Li, Y.M.; Xie, J.J.; Catlow, C.R.A.; Tang, J.W. Band gap Engineering of Organic Semiconductors for Highly Efficient Photocatalytic Water Splitting. Adv. Energy Mater. 2018, 8, 180184. [Google Scholar]
- Tian, N.; Zhang, Y.H.; Li, X.W.; Xiao, K.; Du, X.; Dong, F.; Waterhouse, G.I.N.; Zhang, T.R.; Huang, H.W. Precursor-Reforming Protocol to 3D Mesoporous g-C3N4 Established by Ultrathin Self-Doped Nanosheets for Superior Hydrogen Evolution. Nano Energy 2017, 38, 72–81. [Google Scholar] [CrossRef]
- Liu, C.Y.; Zhang, Y.H.; Dong, F.; Reshak, A.H.; Ye, L.Q.; Pinna, N.; Zeng, C.; Zhang, T.R.; Huang, H.W. Chlorine Intercalation in Graphitic Carbon Nitride for Efficient Photocatalysis. Appl. Catal. B 2017, 203, 465–474. [Google Scholar] [CrossRef]
- Scaife, D.E. Oxide Semiconductors in Photoelectrochemical Conversion of Solar Energy. Solar Energy 1980, 25, 41–45. [Google Scholar] [CrossRef]

Publisher’s Note: MDPI stays neutral with regard to jurisdictional claims in published maps and institutional affiliations. |
© 2022 by the authors. Licensee MDPI, Basel, Switzerland. This article is an open access article distributed under the terms and conditions of the Creative Commons Attribution (CC BY) license (https://creativecommons.org/licenses/by/4.0/).