Abstract
We unravel the potentialities of resonance Raman spectroscopy to detect ibuprofen in diluted aqueous solutions. In particular, we exploit a fully polarizable quantum mechanics/molecular mechanics (QM/MM) methodology based on fluctuating charges coupled to molecular dynamics (MD) in order to take into account the dynamical aspects of the solvation phenomenon. Our findings, which are discussed in light of a natural bond orbital (NBO) analysis, reveal that a selective enhancement of the Raman signal due to the normal mode associated with the C–C stretching in the ring, , can be achieved by properly tuning the incident wavelength, thus facilitating the recognition of ibuprofen in water samples.
1. Introduction
Ibuprofen, a non-steroidal anti-inflammatory agent, has become and remains one of the most consumed medications around the world [1]. Indeed, the worldwide ibuprofen market is projected to increase over the period 2020–2024 [2]. The wide use of ibuprofen is related to its capability to provide therapeutic action for a variety of diseases, Ref. [1] via the inhibition of the COX enzyme [3] during the production of prostaglandins [4]. According to its chemical structure, ibuprofen is classified as an amphiphilic molecule as it presents an aromatic ring doubly substituted with a methyl propyl group and with a propionic acid, the latter constituting the polar part of the drug. The connection between the non-polar and polar groups not only allows the molecule to be soluble in both polar and apolar environments but also gives rise to an enantiomeric carbon from which the S-configuration has been regarded as the active species (see Figure 1) [5].
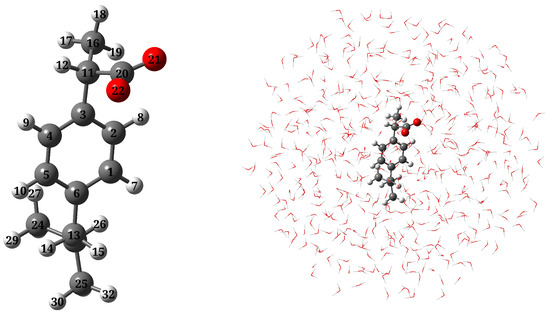
Figure 1.
Molecular structure of a-Ibu and atom labeling (left); a pictorial view of a-Ibu dissolved in aqueous solution as treated in QM/MM calculations (right).
The study of ibuprofen in aqueous solutions is a hot research topic from biological and environmental points of view [6,7,8]. From the biological perspective, the human body is around 70% water, therefore it is expected that water⋯ibuprofen interactions will play an important role in the drug behavior and hence in its therapeutic action [9,10]. On the other hand, ibuprofen is of environmental importance because it is consumed in large quantities and it has been reported as a pollutant that must be removed from residual waters (especially from healthcare and wastewater treatment facilities) [8,11,12,13]. In both cases, the identification of ibuprofen in the aquatic bodies is quite relevant taking into account its protonation state since ibuprofen undergoes structural transitions at acidic or basic pH, and its properties highly depend on it [14,15]. In this regard, ibuprofen as well as, to a greater extent, the anionic ibuprofen (a-Ibu, resulting from deprotonation) have been described as strong chelating agents, acting as monodentate or bidentate ligands through the carboxylate oxygens [16].
Over the years, the removal of ibuprofen from aqueous solutions has drawn great interest. Researchers have suggested several promising strategies as chemical adsorption on different materials, Ref. [17,18,19,20,21] advanced oxidation processes [13,22], coagulation–flocculation [23], photocatalytic degradation [24], among others, focusing on the increase of the removal rate. As for the detection of ibuprofen in water and wastewater, electrochemical techniques [25,26,27,28] seem to be the most investigated, as well as microextraction methodologies [29]. In addition, spectroscopic techniques are well established fundamental tools to identify several analytes in a given aqueous matrix. Among these techniques, UV-vis is one of the most commonly used (by itself or coupled to a separation technique such as HPLC), and calculated UV-vis spectra are also available in the literature to better understand the experimental data [30].
According to the experimental studies carried out by Olaru and Patras [31] and Du et al. [32], it is possible to identify ibuprofen in water by means of UV-vis spectroscopy. However, the spectra from both the protonated and deprotonated drug perfectly match each other, thus suggesting that the excited electronic states involving the apolar part of the drug, which is the only difference between the structures, play a major role than those of its polar component. In order to get better detection and distinction pictures, other spectroscopic techniques have been used. For example, neutral and anionic ibuprofen have been widely studied and characterized by Raman, Raman optical activity (ROA), and IR spectroscopies [33,34,35,36,37,38]. However, due to the very strong IR absorption of water in the 1700–1400 cm region, the use of Raman is recommended [16]. It has been shown that the vibrational modes, especially those of the aromatic ring, change depending on the chemical environment surrounding the molecule, and due to that, they have been regarded as sensors [35]. Notwithstanding, very diluted ibuprofen-containing solutions continue to be a challenge in the detection processes [39,40].
Resonance Raman (RR) has been proposed as a technique that can significantly increase band intensity and resolution compared to conventional Raman, because the incident wavelength is at resonance with molecular electronic transitions [41,42,43,44]. Therefore, RR allows the detection of analytes even at very low concentrations [45,46]. Despite the obvious importance of the detection of ibuprofen in aqueous solution, to the best of our knowledge, there are neither computational nor experimental studies of RR applied to that system, albeit ultraviolet resonance Raman (UVRR) spectra of human serum albumin and its complexes with three types of ligands, including ibuprofen, have been measured at 240 nm [47]. In this work, based on computational simulations of UV-vis, Raman, and resonance Raman spectra of a-Ibu in aqueous environment, we investigate the potentialities of RR to identify this drug in water. The Natural Bond Orbitals (NBO)-aided detailed description of the different electronic transitions that are involved in UV-vis spectra and could be finely tuned in RR, allows us to gather complementary information to understand the underlying causes of intensity enhancements in Raman spectra, which have not been previously explored.
The paper is organized as follows: after describing the details of the computations in the next section, a discussion focused on hydration patterns under the MD and NBO contexts is presented. Then, the results for diverse spectroscopies, UV-vis, Raman and resonance Raman applied to solvated a-Ibu are reported and analyzed. Finally, conclusions are drawn.
2. Methods
Ibuprofen can occur in protonated and deprotonated forms depending on the pH of the solution. An initial analysis of protonation with respect to pH was carried out using Marvin Beans version 19.20 [48] and according to the speciation plots, at neutral pH (pH = 7.0) the dominant form of ibuprofen bears a deprotonated carboxylic group. Besides, physicochemical analyses of the quality of wastewater from different effluents have revealed that regardless of the facility, season, level of treatment, sampling point, etc., pH ranges vary from 6 to 10 [49] with an average pH value found to be around 7.5 [50]. With the ibuprofen pKa being 4.91, this compound will primarily exist in the dissociated form in wastewater too. Therefore, we used the a-Ibu in all the following calculations.
The molecular geometry of a-Ibu (see Figure 1, left panel) was optimized by employing the CAM-B3LYP density functional [51] combined with the 6-311++G(d, p) basis set [52,53]. To ensure that the geometries and calculated properties are actually representative of the overall solvation environment, we carried out a Molecular Dynamics (MD) simulation to sample the solute-solvent phase space [54]. To do that, the optimized structure of a-Ibu was placed in a cubic box with 7390 water molecules, setting the smallest atom⋯wall distance to 1 nm. The MD run was conducted using the GAFF force field [55] with the TIP3P water model [56]. Parameters for a-Ibu were generated from the electrostatic potential and the CM5 charges [57]. Simulations were run in GROMACS 2019.3, [58] for a total production length of 30 ns, and a step-size of 2 fs. Temperature and pressure were maintained at 298.15 K and 1 bar, respectively, using a modified Berendsen thermostat [59] and Parrinello-Rahman barostat [60], with a coupling constant, , of 0.1 ps for each. The system was also equilibrated in two ensembles, NVT and NPT, of 1 ns runs, with solvent and solute in separate temperature coupling groups. At the end of the production stage, we sampled 200 uncorrelated configurations at intervals of 10 ps, discarding the first 10 ns. In the chosen frames, the closest water molecules within a radius of 14 Å of a-Ibu were included in a sphere-shaped cut, as depicted in the right panel of Figure 1. Geometric clustering was conducted to identify similar conformations sampled during the MD run. To this end, the gromos clustering method from Ref. [61] with a cutoff of 0.13 nm (the average RMSD) was used. This cluster analysis identified 7 representative structures of a-Ibu, illustrated in Figure S1 in the Supplementary Material (SM). Their corresponding occurrences along the MD trajectory and the size of the cluster are plotted in Figure S2 in the SM.
To get insight into solute–solvent hydrogen bonding interactions, we analyzed the MD trajectory by means of radial distribution functions (RDFs), spatial distribution functions (SDFs), and the average number of hydrogen bonds (HBs) between water molecules and the carboxylate group, by using the TRAVIS package [62,63]. Orbital interactions associated to hydrogen bonding were analyzed at the NBO level [64,65,66] and the interaction energies were obtained via second order perturbation corrections to the Fock matrix with the NBO7.0 program [67]. We also borrowed and reoptimized the structures reported in Ref. [7] as being the lowest energy motifs in the quantum mechanics (QM) potential energy surface (PES) for the microsolvation of a-Ibu: WS ( 94.3), WS ( 63.4) and WS ( 44.9), and applied NBO methodologies to quantify and compare the strength of the interactions.
In spectral calculations, solvent effects were described by means of the quantum mechanics/fluctuating charges (QM/FQ) model [54], applied to each of the extracted snapshots. FQ parameters reported in Ref. [68] were exploited. TD-DFT calculations (15 excited states) for each one of the configurations extracted from the MD trajectory were then carried out at the CAM-B3LYP/6-311++G(d, p) level of theory. It is worth noticing that with this DFT functional and large number of excited states not only intensities and band shapes are accurately modeled, but also the experimental spectra are better reproduced. Reported averaged absorption spectrum was obtained by convoluting peak intensities with Gaussian functions, with a full width at half maximum (FWHM) of 0.5 eV. The orbitals involved in the main transitions were identified and by means of a canonical molecular orbitals (CMO) analysis, we tabulated the leading NBO contributions (bonding, nonbonding, or antibonding) to each canonical Molecular Orbital (MO). Afterwards, the set of geometries extracted from MD simulations was partially optimized [69] and the vibrational calculations were performed on each converged minima. We also recomputed electronic absorption spectra with the optimized snapshots and we obtained essentially the same results as for the non-optimized ones (see Figure S3 in the SM). The Raman scattering spectrum of a-Ibu in aqueous solution was calculated at 532 nm with the QM/FQ protocol [69]. Finally, the QM/FQ methodology described in Ref. [70] was applied to calculate resonance Raman spectra, choosing several incident wavelengths to build the resonance Raman excitation profile (RREP). The Franck Condon Vertical Gradient approximation, successfully used in other works [70,71,72,73], was exploited. For a better visualization, the Raman and RR stick bands were convoluted with a Lorentzian line shape with FWHM of 20 cm. Convergence tests indicated that the inclusion of extra (more than 200) uncorrelated snapshots yield unaltered UV-vis, Raman, and RR spectra (see Figures S6–S8 in the SM). All QM calculations were performed using a locally modified version of the Gaussian 16 package [74]. It should be noted that all calculations refer to the S-enantiomer.
3. Results and Discussion
3.1. Hydration Patterns
Hydration patterns sampled by MD simulations were analyzed in terms of two descriptors: SDFs and RDFs. Figure 2 shows SDF of solvent atoms (O and H) near oxygen atoms of a-Ibu. Such plots clearly identify the space region occupied by water molecules; the almost symmetrically distributed surfaces indicate that the two oxygen atoms in the CO motif behave in a very similar way. In order to refine the analysis, the RDF between the carboxylate group and water hydrogen atoms was also calculated (Figure 2, right panel). A sharp peak in the g(r) can be recognized at 1.7 Å, which integrates for around 3 water molecules located close to each oxygen in the first hydration sphere, whereas a less pronounced peak is present at 3.0 Å, thus denoting a second solvation shell formed by 7 (×2) water molecules. These O⋯H distances and arrangements of the solvent molecules surrounding the solute are in line with the findings by Zapata-Escobar et al. [7] who reported a detailed study of the microsolvation of a-Ibu and found that water molecules in direct contact with the solute prefer to aggregate around the carboxylate oxygen atoms via cyclic or bridged charge assisted HBs.
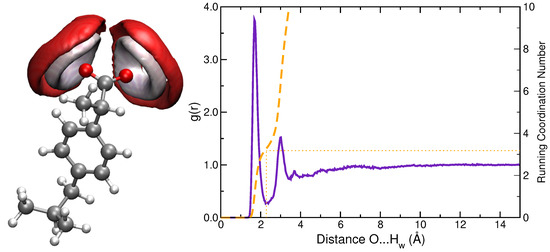
Figure 2.
(Left panel): Spatial distribution function of water oxygen (red) and hydrogen (white) atoms around a-Ibu. Calculated SDF isodensity values are equal to 70 and 100 nm for hydrogen and oxygen atoms, respectively. (Right panel): RDF between ibuprofen oxygens and water hydrogens. The curve is similar for both oxygen atoms in the carboxylate group. Running Coordination Numbers are also included (dashed orange line).
A more comprehensive examination of hydrogen-bonding motifs for the solvated a-Ibu can be done by means of the stabilization energies given by the second order perturbation theory analysis of the Fock matrix on the NBO basis. Such energies allow determining the strength of the donor–acceptor interactions between the solute and the water molecules in its vicinities. Figure 3 compares the intermolecular NBO interactions for anionic ibuprofen and water molecules for the most stable structures reported in the [a-Ibu(HO)] n = 1, 2, 3 PES [7], with those obtained for a single snapshot (Ibu1 in the SM) extracted from the MD when several water molecules were included in the QM portion. To quantify and compare the relative strengths of the interactions in these molecular clusters, we list the corresponding energies, , in Table 1.
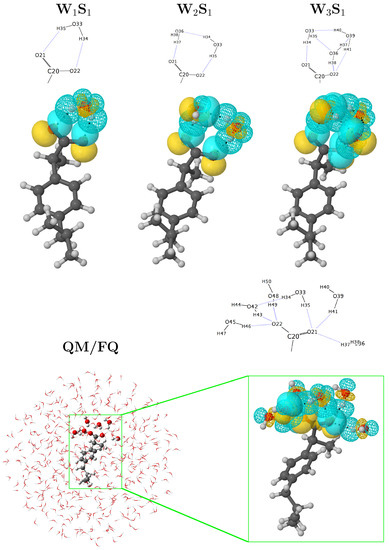
Figure 3.
Orbital representation within the NBO picture for the intermolecular interactions in solvated a-Ibu. Structures for WS, WS, and WS were taken from Ref. [7]. The QM/FQ structure with six explicit waters exhibits the most representative conformation of a-Ibu during the MD run. See also Figure S1 in the SM.

Table 1.
orbital interaction energies in solvated a-Ibu. The largest stabilization energies in kcal/mol are reported in each case. See Figure 3 for atom labeling.
Even if in the NBO framework there are distinct types of interactions which stabilize the configurations/clusters of a-Ibu in water, the dominant contribution is given by the lone pair → antibonding () form. In all cases, the strongest interactions arise from the charge transfer between a lone pair in the carboxylate group and an antibonding orbital of a neighboring water molecule, affording stabilization energies up to 6.81, 26.16, 16.38, and 18.82 kcal/mol when 1, 2, 3 and 6 water molecules (plus the rest of the FQ layer) surround the solute. For clusters with more than one water molecule, the two oxygen atoms are not exactly equivalent and water⋯water interactions are also possible but in general, the overlap leads to small orbital interaction energies, though they are comparable or stronger than the HB in the reference water dimer [75,76] due to the formal charge in a-Ibu. Note that, as predicted by the RDFs, for the configuration considered for this analysis, there are three water molecules located around each oxygen in the a-Ibu. In addition, the energy values, calculated for the interactions in that snapshot, are in the same ranges as those found in a-Ibu/water clusters coming from exhaustive explorations of the PESs, reinforcing the fact that randomly choosing configurations from classical mechanics simulations are reliable sources to gain deep insight about inter-fragment bonding, a strategy that has been recently used in several works [10,77,78,79,80].
3.2. UV-Vis Spectrum
We now move to discuss the comparison between computed and experimental UV-vis spectra. Electronic absorption spectra of a-Ibu are usually measured for the ibuprofen sodium salt in solution. When recorded in the 200–300 nm range, the spectrum is characterized by an intense peak with a maximum absorption wavelength () of 222 nm, associated with a transition [24,32,81,82]. Other authors claim the main absorption bands to be located at 222 nm and 190 nm, with the latter value being a rough estimation because below 200 nm the spectral data is not conclusive [24]. The QM/FQ calculated absorption spectrum for a-Ibu in aqueous solution is shown in Figure 4, left panel, and the position of absorption maxima (222 nm and 182 nm) in the analyzed interval give a first indication of the good agreement between calculated and experimental data, thus also validating the level of theory here employed. Interestingly, the destruction of the drug by photocatalytic degradation is followed by the disappearance of the band corresponding to ibuprofen at 222 nm [24].
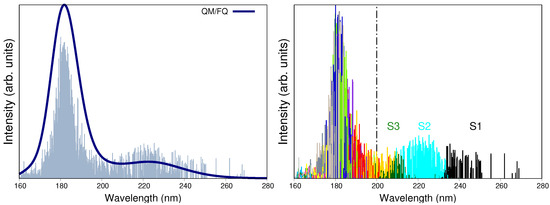
Figure 4.
(Left panel): Convoluted QM/FQ UV-vis absorption spectrum of ibuprofen in aqueous solution. Convolution was done with Gaussian functions and using a FWHM of 0.5 eV. (Right panel): Distinction of the fifteen excited states converged in the TD-DFT calculations, where each one of them is associated to a different stick color. Labels S1 to S3 indicate the first three excited states. Experimental reports collected from Refs. [24,32,81,82] determine the first maximum to appear at 222 nm. Dashed vertical line indicates that there is no experimental information below 200 nm.
As can be seen in Figure 4, left panel, the fact of using a robust sampling methodology that includes several snapshots from the MD brings in a natural broadening in the UV-vis spectra, otherwise lost or arisen from a mere convolution if just a few configurations/conformations are taken into account as it is done in cluster-like approaches or implicit solvation [54]. On the right panel of Figure 4, the stick-like spectrum of a-Ibu was separated by colors according to the excited state the sticks described, in such a way that it is possible to distinguish the excited states mainly contributing to each band. It is clear from such a qualitative separation that , and lead to the appearance of the band at higher wavelengths, whereas the second band is due to a combination of all the remaining excitations. In Table 2, the MOs contributions to – transitions are listed. For instance, (black sticks in Figure 4) is predominantly a HOMO → LUMO + 1 excitation, whereas includes the HOMO as well but the receptor of the charge transfer is the LUMO. The involved MOs are depicted in Figure 5 for the most representative snapshot in light of the clustering method [61].
Table 2.
Decomposition of the excited states mainly contributing to the onset of the band centered at 222 nm in the absorption spectrum of a-Ibu in solution. The decomposition is done based on the canonical molecular orbitals (CMO) and the natural bonding orbitals (NBO).
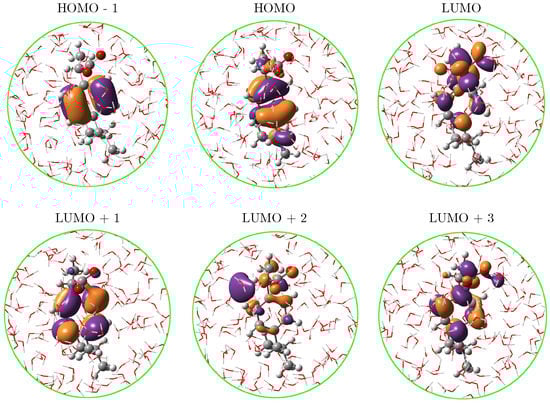
Figure 5.
Molecular orbitals for the lowest three excited states of a-Ibu in aqueous solution. See Table 2 for their contributions to the transitions.
The NBO analysis of CMO reported in Table 2 allows to further decompose the MOs in NBOs and assign the nature of the transitions. By looking at the values in the linear combinations for the MO already mentioned, it turns out that though the occupied orbitals involved in the transitions might look somewhat different, the NBOs forming them belong to the aromatic ring in the molecule. Visual inspection of the LUMO orbital in Figure 5 reveals that the carboxylate group plays an important role in that orbital and the CMO decomposition confirms that hypothesis by attributing it primarily to the antibonding orbital. Gathering all this information, the band at 222 nm in the resonance Raman spectrum of the solvated a-Ibu is a superposition of three excited states, which can be briefly summarized as a redistribution of the electron density from the -cloud on the ring to either the ring itself or the COO groups, in a → charge transfer according to the NBO description.
3.3. Raman Spectrum
The experimental far-from-resonance Raman spectrum of solid IbuNa salt and of its solution in water were reported by Bonora et al. [16] along with the corresponding assignments of the normal modes. Therefore, in what follows, just a summary of the main findings will be discussed. Figure 6 reports the QM/FQ simulated Raman spectrum of a-Ibu in aqueous solution and its experimental counterpart. Overall, there is an outstanding agreement of almost all peak positions and relative intensities.
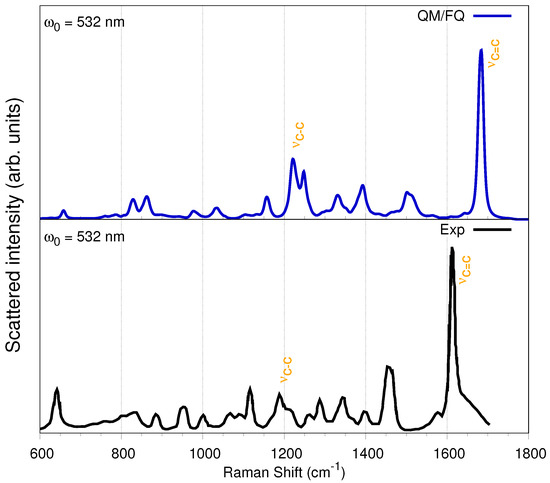
Figure 6.
Convoluted QM/FQ (top) and experimental (bottom) Raman spectrum of a-Ibu in aqueous solution. Experimental data taken from Refs. [83,84,85].
It has been reported that the most relevant difference between the Raman spectra of the solid undissociated acid form of ibuprofen and a-Ibu in aqueous solution is due to the stretching mode that for the carboxylic group appears at 1647 cm (computed at 1709 cm in Ref. [16]), which is of course not present neither in the diluted IbuNa water solution nor in the solid IbuNa, because in those systems, the asymmetrical and symmetrical stretching vibrations take place [16].
Concerning the assignments of the bands appearing in Raman spectrum, the most important signals in the 600–1800 cm interval account for an intense peak at 1613 cm (theoretically located at ≈1690 cm), attributed to stretching vibrations of the benzene ring (). The second most intense peak appears as a doublet with maxima at 1450 and 1455 cm (simulated at 1500 and 1510 cm) and can be assigned to the antisymmetric deformations of the methyl groups, the CH scissors mode and the vibration. Vargek [83] claimed that the splitting could originate from the close proximity of the phenyl ring and the CH group in the chiral carbon atom. Another couple of peaks popping up in the spectrum is that at 1288 and 1342 cm, which originates from the out-of-plane CCCH motion, and the aliphatic and bendings. The two Raman peaks at around 800 cm are attributable to torsions and stretchings, whereas the peak at 640 cm can be assigned to the phenyl CH out-of-plane deformation, though the bending is also involved. For the upcoming Resonance Raman spectra, it is worth describing the two peaks appearing at 1188 and 1210 cm, which are the result of a complex combined , , , and aliphatic vibrations including both the propyl and the isobutyl group, located at the para- position from the propanoate (propyl group + carboxylate). CH-bending modes of the benzene ring also contribute to these peaks [47]. The normal modes with frequencies around 1200 and 1690 cm are depicted in Figure 7 for the most representative snapshot selected via the gromos clustering method. These vibrational modes display large displacements of the C–C bonds.
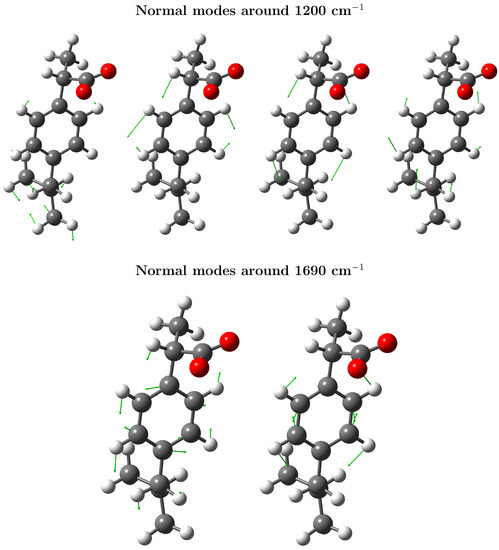
Figure 7.
Important vibrational modes giving rise to the most enhanced peaks in resonance Raman. (Top panel): normal modes especially enhanced at incident frequencies, 55,000 cm (182 nm). (Bottom panel): normal modes always enhanced according to the RREP, but selectively more enhanced at 45,000 cm (222 nm).
3.4. Resonance Raman
From the simulated UV-vis spectrum of a-Ibu (Figure 4), the lowest electronic absorption with significant oscillator strength was predicted to arise from three excitations, consistent with the appearance of a single, broad band in the aqueous phase absorption spectrum having a maximum (at 222 nm) quite close to what is experimentally observed. Nevertheless, there is another more intense band (at 182 nm) as a result of several transitions with the highest calculated oscillator strengths. The computed RR spectra of a-Ibu when these two incident wavelengths are used to irradiate the sample, are depicted in Figure 8. Spectral profiles for ranging from 165 to 285 nm are displayed in Figure S4 in the SM. For full clarity, we also computed RR spectra taking into account just the first three excited states, the results are found in the SM (Figure S5).
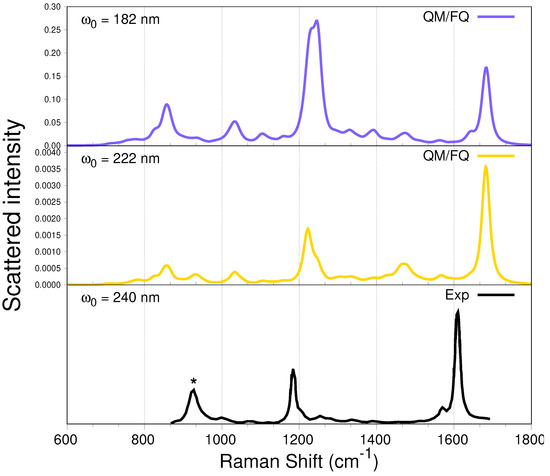
Figure 8.
QM/FQ UV-resonance Raman spectra of a-Ibu in aqueous solution, calculated when the two absorption maxima wavelengths are used to irradiate the system ((top panel), 182 nm and middle, 222 nm). RR intensities (in cmmolsr) were calculated with a damping factor of 200 cm and broadened using Lorentzian functions with FWHM = 20 cm. For visualization purposes, the intensity of the highest peak was normalized to 1. In the experimental spectrum [47] (bottom panel), the intensity was calibrated with the ClO band marked with .
When compared against the off-resonance Raman spectra in Figure 6, the RR spectra in Figure 8 immediately show evidence of selective resonance enhancement, as is characteristic of RR spectroscopy [86,87,88]. That is particularly evidenced by the slight changes in the position and strong changes in the intensity of some of the peaks described above. Indeed, the major features of the RR spectra of solvated a-Ibu are the enhancements of either the peak around 1200 cm or the peak located at ≈1690 cm, both associated mostly with carbon–carbon vibrations in the aliphatic regions and ring, respectively, and to movements of the methyl groups of ibuprofen.
Two important findings are noticeable when comparing the two simulated spectra in Figure 8. On the one hand, the RR intensities at 182 nm are about 100 times larger than those at 222 nm (see also Figure 9 below), thus reflecting the relative intensities in the absorption spectra; and on the other hand, there is a selective enhancement of the peak at ≈1200 cm at nm. In fact, at that incident wavelength, this peak exhibits the largest RR intensity, while the peaks located at 1400 cm almost disappeared. Furthermore, notice that at nm, the intensity of the peak at about 800 cm is enhanced.
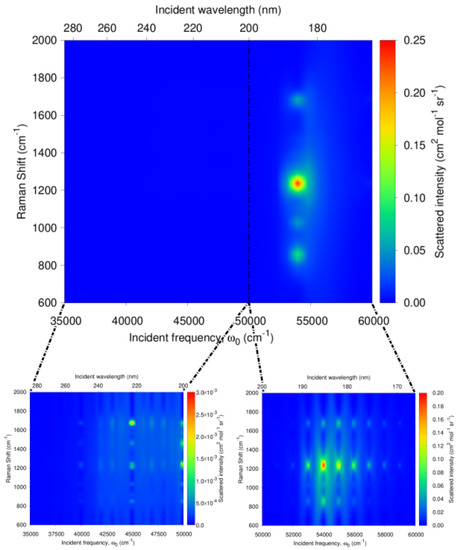
Figure 9.
Calculated QM/FQ resonance Raman excitation profile (RREP) of a-Ibu in aqueous solution. Dashed vertical line indicates that there is no experimental information below 200 nm.
The only work we found concerning UVRR studies of a-Ibu in aqueous solution, reported measurements with a laser excitation set up to 240 nm, Ref. [47] a near-resonance incident wavelength. For the sake of comparison, that spectrum is included in the bottom panel of Figure 8. The authors pointed out that the most prominent peaks are located at 1613 and 1188 cm, assigned to the ring stretching and CH-bending modes of the benzene ring, respectively. Those peaks are characteristic of p-disubstituted benzene derivatives. Our simulations are perfectly consistent with their findings, except perhaps for a small shift in the frequencies.
Going beyond these results at particular excitation wavelengths, the RREP of a-Ibu is shown in Figure 9 as well as a zoom to see in more detail the excitation profile in two specific incident frequency regions: (285–200 nm) and (200–165 nm) under the available experimental information for the absorption spectra. At a first glance, there are at least four peaks (≈800, 1000, 1200 and 1700 cm) in the RR spectra expected to increase their intensity when an incident wavelength = 182 nm is used. Nonetheless, the separation of the regions allows us to recognize that if the threshold of the intensities is lowered, it would be possible to find more enhanced peaks, as seen in the green patches of the RREP maps. While one might argue that this sacrifice in intensity jeopardizes the aim of the detection, for finely tunable devices (like a synchrotron source) used to carry out UVRR experiments, the exploitable range of incident wavelengths is 127–280 nm and moreover, the spectral resolution can be set up for synchrotron radiation-based UVRR experiments in order to have a sufficiently high signal to noise ratio [70,89,90,91].
The most enhanced peaks in the RR spectrum of solvated a-Ibu were monitored individually by sectioning the RREP maps. The excitation wavelength dependence of the intensity of the enhanced peaks is shown in Figure 10 along with its Raman cross-section ratios. As expected, the calculated excitation profiles for and reach their maxima at the excitation wavelengths found in the simulated absorption spectra, though the peak shows essentially the same low Raman cross section from 200 to 260 nm.
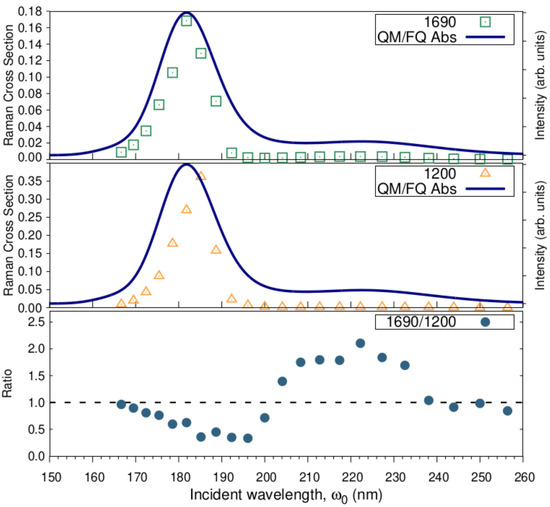
Figure 10.
Excitation wavelength dependence of the and bands intensity, and of / Raman cross-section ratios. RR intensities (in cmmolsr) were calculated with a damping factor of 200 cm and broadened using Lorentzian functions with FWHM = 20 cm.
The selective enhancement of the two signals is also clear from the sinusoidal behavior of the intensity ratios (Figure 10, bottom). Notice that the -peak becomes up to two-fold more intense than the peak, for incident wavelengths approaching the second absorption maximum, whereas the ratio equals 0.5 in the vicinities of 182 nm, thus favoring the peak. This fact could be explained by resorting to the information provided by NBO, the analysis of the orbitals involved in the transitions leading to that band, and of course to the normal modes whose signals generate those peaks (see Figure 7). As stated above, the transition predominantly involves orbitals confined to the aromatic ring or the carboxylate group of ibuprofen. What is more, the peak at 1690 comprises normal modes essentially concentrated in the ring, i.e., ; therefore it is understandable that even at longer wavelengths (200–260 nm) and most likely at 222 nm, an increase in the intensity of this peak is to be observed.
Finally, these results suggest that there are at least two signals to unequivocally trace ibuprofen in aqueous solution through UVRR techniques: (i) the aromatic ring stretching mode occurring at 1690 cm and () the aliphatic vibrations emerging at 1200 cm, which can be selectively enhanced by choosing the proper incident wavelength. We emphasize here that even if devices with tunable excitation sources are not available for shorter wavelengths, the ring vibrations will appear with an increased intensity when typical 226 nm lasers are used, thus becoming the preferable signals to detect ibuprofen in water.
4. Conclusions
In the present study, the potentialities of resonance Raman to detect ibuprofen in water have been investigated by exploiting the mixed quantum–classical polarizable QM/MM scheme based on fluctuating charges to treat in a refined way the solute–solvent interactions, thus obtaining reliable spectral profiles. We additionally have ensured that the anionic ibuprofen⋯water geometries taken for the study are representative of the overall solvated environment by sampling configurations from classical molecular dynamics simulations. As a general rule, hydration patterns indicated that solvent molecules prefer to bind the carboxylate group in a-Ibu, leading to the formation of charge assisted networks of strong hydrogen bonds as confirmed by the NBO analysis.
To validate the application of the QM/FQ + MD methodology for the target system, we have shown that computed vertical absorption energies display a minimal deviation from experimental results, and on top of this, our calculations also capture most of the features of the experimental Raman spectra of a-Ibu in aqueous solution. The validated approach was then used to simulate resonance Raman spectra. The variation of the intensities as a function of revealed that a couple of peaks in the RR spectrum might be selectively enhanced by properly choosing the incident wavelength. With an NBO-guided assignment of the nature of the electronic transitions, we have related the location of the MOs involved in the excited states with the characteristics of the normal modes whose intensities are enhanced in the RR spectrum. For example, we have outlined that as the normal mode has a large contribution of the C–C stretching in the ring and the does not, therefore the use of 222 nm (the maximum absorption for the lowest energy band, which in turn is due to a → transition) would enhance the RR intensity of the normal mode or in general, those normal modes having ring components.
Although the findings in this work provide solid evidence that Resonance Raman can be suggested as a powerful technique to detect ibuprofen in very diluted aqueous solutions, our results would need further experimental verification. Indeed, we are currently in the process of collecting data on that matter, and this will be the subject of a future paper.
Supplementary Materials
The following supporting information is online. Most representative conformers of a-Ibu under clustering method (Figures S1 and S2), UV-vis spectra from non-optimized structures (Figure S3), RR spectra at different incident wavelengths (Figure S4), and taking into account just the first three excited states (Figure S5), Convergence tests for UV-vis, Raman and RR spectra (Figures S6–S8).
Author Contributions
Conceptualization, S.G., N.R.-V., T.G. and A.R.; methodology, S.G. and T.G.; validation, S.G. and N.R.-V.; formal analysis, S.G., N.R.-V., T.G., A.R. and C.C.; investigation, S.G., N.R.-V., T.G., C.C. and A.R.; resources, S.G., T.G. and C.C.; writing—original draft preparation, S.G., N.R.-V., T.G., A.R. and C.C.; writing—review and editing, S.G., N.R.-V., T.G., C.C. and A.R.; project administration, C.C. and A.R.; funding acquisition, C.C. and A.R. All authors have read and agreed to the published version of the manuscript.
Funding
Partial funding for this project from H2020-MSCA-ITN-2017 European Training Network “Computational Spectroscopy In Natural sciences and Engineering” (COSINE), grant number 765739 is acknowledged. Internal support from Universidad de Antioquia via “Estrategia para la sostenibilidad” is also acknowledged. We gratefully acknowledge the Center for High Performance Computing (CHPC) at SNS for providing the computational infrastructure.
Institutional Review Board Statement
Not applicable.
Informed Consent Statement
Not applicable.
Data Availability Statement
Most representative conformers of a-Ibu under clustering method, UV-vis spectra from non-optimized structures, RR spectra at different incident wavelengths, and taking into account just the first three excited states, Convergence tests for UV-vis, Raman and RR spectra.
Conflicts of Interest
The authors declare no conflict of interest. The funders had no role in the design of the study; in the collection, analyses, or interpretation of data; in the writing of the manuscript, or in the decision to publish the results.
Sample Availability
Not applicable.
Abbreviations
The following abbreviations are used in this manuscript:
| (UV)RR | (Ultra–Violet) Resonance Raman |
| NBO | Natural Bond Orbitals |
| FQ | Fluctuating Charges |
| PES | Potential Energy Surface |
| MO | Molecular Orbital |
| CMO | Canonical Molecular Orbital |
| RREP | Resonance Raman Excitation Profile |
| QM | Quantum Mechanics |
References
- Conaghan, P.G. A turbulent decade for NSAIDs: Update on current concepts of classification, epidemiology, comparative efficacy, and toxicity. Rheumatol. Int. 2012, 32, 1491–1502. [Google Scholar] [CrossRef] [PubMed] [Green Version]
- Research and Market. The World’s Largest Market Research Store. Outlook on the Ibuprofen Global Market to 2024—Insights & Forecast with Potential Impact of COVID-19. 2021. Available online: https://www.globenewswire.com/ (accessed on 20 October 2021).
- Vane, J.; Botting, R. Anti-inflammatory drugs and their mechanism of action. Inflamm. Res. 1998, 47, 78–87. [Google Scholar] [CrossRef]
- Goodwin, G. Prostaglandins: Biochemisty, Functions, Types and Roles; Nova Science Publisher: New York, NY, USA, 2010. [Google Scholar]
- Evans, A.M. Comparative pharmacology of S (+)-ibuprofen and (RS)-ibuprofen. Clin. Rheumatol. 2001, 20, 9–14. [Google Scholar] [CrossRef] [PubMed]
- Wood, M.; Morales, M.; Miller, E.; Braziel, S.; Giancaspro, J.; Scollan, P.; Rosario, J.; Gayapa, A.; Krmic, M.; Lee, S. Ibuprofen and the Phosphatidylcholine Bilayer: Membrane Water Permeability in the Presence and Absence of Cholesterol. Langmuir 2021, 37, 4468–4480. [Google Scholar] [CrossRef] [PubMed]
- Zapata-Escobar, A.; Manrique-Moreno, M.; Guerra, D.; Hadad, C.Z.; Restrepo, A. A combined experimental and computational study of the molecular interactions between anionic ibuprofen and water. J. Chem. Phys. 2014, 140, 184312. [Google Scholar] [CrossRef] [PubMed]
- Chopra, S.; Kumar, D. Ibuprofen as an emerging organic contaminant in environment, distribution and remediation. Heliyon 2020, 6, e04087. [Google Scholar] [CrossRef]
- Rojas-Valencia, N.; Lans, I.; Manrique-Moreno, M.; Hadad, C.Z.; Restrepo, A. Entropy drives the insertion of ibuprofen into model membranes. Phys. Chem. Chem. Phys. 2018, 20, 24869–24876. [Google Scholar] [CrossRef] [PubMed]
- Rojas-Valencia, N.; Gómez, S.; Montillo, S.; Manrique-Moreno, M.; Cappelli, C.; Hadad, C.; Restrepo, A. Evolution of Bonding during the Insertion of Anionic Ibuprofen into Model Cell Membranes. J. Phys. Chem. B 2020, 124, 79–90. [Google Scholar] [CrossRef] [PubMed]
- Baccar, R.; Sarrà, M.; Bouzid, J.; Feki, M.; Blánquez, P. Removal of pharmaceutical compounds by activated carbon prepared from agricultural by-product. Chem. Eng. J. 2012, 211, 310–317. [Google Scholar] [CrossRef]
- Petrie, B.; Barden, R.; Kasprzyk-Hordern, B. A review on emerging contaminants in wastewaters and the environment: Current knowledge, understudied areas and recommendations for future monitoring. Water Res. 2015, 72, 3–27. [Google Scholar] [CrossRef]
- Klavarioti, M.; Mantzavinos, D.; Kassinos, D. Removal of residual pharmaceuticals from aqueous systems by advanced oxidation processes. Environ. Int. 2009, 35, 402–417. [Google Scholar] [CrossRef] [PubMed]
- Liu, W.; Zhang, S.; Meng, F.; Tang, L. Molecular simulation of ibuprofen passing across POPC membrane. J. Theor. Comput. Chem. 2014, 13, 1450033. [Google Scholar] [CrossRef]
- Hiller, E.; Šebesta, M. Effect of temperature and soil pH on the sorption of ibuprofen in agricultural soil. Soil Water Res. 2017, 12, 78–85. [Google Scholar] [CrossRef]
- Bonora, S.; Pisi, A.; Ottani, S.; Cesini, D.; Maris, A.; Foggia, M.D. Raman and SERS study on ibuprofen metal complexes with biomedical interest. Vib. Spectrosc. 2014, 73, 45–55. [Google Scholar] [CrossRef]
- Xiong, P.; Zhang, H.; Li, G.; Liao, C.; Jiang, G. Adsorption removal of ibuprofen and naproxen from aqueous solution with Cu-doped Mil-101(Fe). Sci. Total. Environ. 2021, 797, 149179. [Google Scholar] [CrossRef]
- Xiao, R.; He, Z.; Diaz-Rivera, D.; Pee, G.Y.; Weavers, L.K. Sonochemical degradation of ciprofloxacin and ibuprofen in the presence of matrix organic compounds. Ultrason. Sonochem. 2014, 21, 428–435. [Google Scholar] [CrossRef]
- Khazri, H.; Ghorbel-Abid, I.; Kalfat, R.; Trabelsi-Ayadi, M. Removal of ibuprofen, naproxen and carbamazepine in aqueous solution onto natural clay: Equilibrium, kinetics, and thermodynamic study. Appl. Water Sci. 2017, 7, 3031–3040. [Google Scholar] [CrossRef] [Green Version]
- Rafati, L.; Ehrampoush, M.; Rafati, A.; Mokhtari, M.; Mahvi, A. Removal of ibuprofen from aqueous solution by functionalized strong nano-clay composite adsorbent: Kinetic and equilibrium isotherm studies. Int. J. Environ. Sci. Technol. 2018, 15, 513–524. [Google Scholar] [CrossRef]
- Rafati, L.; Ehrampoush, M.H.; Rafati, A.A.; Mokhtari, M.; Mahvi, A.H. Fixed bed adsorption column studies and models for removal of ibuprofen from aqueous solution by strong adsorbent Nano-clay composite. J. Environ. Health Sci. Eng. 2019, 17, 753–765. [Google Scholar] [CrossRef] [PubMed]
- Feng, L.; van Hullebusch, E.D.; Rodrigo, M.A.; Esposito, G.; Oturan, M.A. Removal of residual anti-inflammatory and analgesic pharmaceuticals from aqueous systems by electrochemical advanced oxidation processes. A review. Chem. Eng. J. 2013, 228, 944–964. [Google Scholar] [CrossRef]
- Boyd, G.R.; Reemtsma, H.; Grimm, D.A.; Mitra, S. Pharmaceuticals and personal care products (PPCPs) in surface and treated waters of Louisiana, USA and Ontario, Canada. Sci. Total. Environ. 2003, 311, 135–149. [Google Scholar] [CrossRef]
- Choina, J.; Kosslick, H.; Fischer, C.; Flechsig, G.U.; Frunza, L.; Schulz, A. Photocatalytic decomposition of pharmaceutical ibuprofen pollutions in water over titania catalyst. Appl. Catal. B Environ. 2013, 129, 589–598. [Google Scholar] [CrossRef]
- Motoc, S.; Manea, F.; Iacob, A.; Martinez-Joaristi, A.; Gascon, J.; Pop, A.; Schoonman, J. Electrochemical Selective and Simultaneous Detection of Diclofenac and Ibuprofen in Aqueous Solution Using HKUST-1 Metal-Organic Framework-Carbon Nanofiber Composite Electrode. Sensors 2016, 16, 1719. [Google Scholar] [CrossRef] [Green Version]
- Manea, F.; Motoc, S.; Pop, A.; Remes, A.; Schoonman, J. Silver-functionalized carbon nanofiber composite electrodes for ibuprofen detection. Nanoscale Res. Lett. 2012, 7, 331. [Google Scholar] [CrossRef] [Green Version]
- Amin, S.; Soomro, M.T.; Memon, N.; Solangi, A.R.; Qureshi, T.; Behzad, A.R.; Behzad, A.R. Disposable screen printed graphite electrode for the direct electrochemical determination of ibuprofen in surface water. Environ. Nanotechnol. Monit. Manag. 2014, 1, 8–13. [Google Scholar] [CrossRef] [Green Version]
- Motoc, S.; Manea, F.; Pop, A.; Pode, R.; Burtica, G. Determination of ibuprofen in water using Ag-doped zeolite-expanded graphite composite electrode. Adv. Sci. Eng. Med. 2011, 3, 7–12. [Google Scholar] [CrossRef]
- Wang, C.H.; Su, H.; Chou, J.H.; Lin, J.Y.; Huang, M.Z.; Lee, C.W.; Shiea, J. Multiple solid phase microextraction combined with ambient mass spectrometry for rapid and sensitive detection of trace chemical compounds in aqueous solution. Anal. Chim. Acta 2020, 1107, 101–106. [Google Scholar] [CrossRef] [PubMed]
- Rocha, F.S.; Gomes, A.J.; Lunardi, C.N.; Kaliaguine, S.; Patience, G.S. Experimental methods in chemical engineering: Ultraviolet visible spectroscopy—UV-Vis. Can. J. Chem. Eng. 2018, 96, 2512–2517. [Google Scholar] [CrossRef]
- Olaru, M.; Cotofana, C.; Patras, X. Design of novel PVA-based hybrid composites for drug delivery. Optoelectron. Adv. Mater. Rapid Commun. 2009, 3, 1273–1275. [Google Scholar]
- Du, L.; Liu, X.; Huang, W.; Wang, E. A study on the interaction between ibuprofen and bilayer lipid membrane. Electrochim. Acta 2006, 51, 5754–5760. [Google Scholar] [CrossRef]
- Ertürk, A.S.; Gürbüz, M.U.; Metin, T. New-generation Jeffamine® D230 core amine, TRIS and carboxylterminated PAMAM dendrimers: Synthesis, characterization and the solubility application for a model NSAID drug Ibuprofen. Marmara Pharm. J. 2017, 21, 385–399. [Google Scholar] [CrossRef] [Green Version]
- Qandil, A.M.; Obaidat, A.A.; Ali, M.A.M.; Al-Taani, B.M.; Tashtoush, B.M.; Al-Jbour, N.D.; Al Remawi, M.M.; Al-Sou’od, K.A.; Badwan, A.A. Investigation of the Interactions in Complexes of Low Molecular Weight Chitosan with Ibuprofen. J. Solut. Chem. 2009, 38, 695–712. [Google Scholar] [CrossRef]
- Levin, C.S.; Kundu, J.; Janesko, B.G.; Scuseria, G.E.; Raphael, R.M.; Halas, N.J. Interactions of Ibuprofen with Hybrid Lipid Bilayers Probed by Complementary Surface-Enhanced Vibrational Spectroscopies. J. Phys. Chem. B 2008, 112, 14168–14175. [Google Scholar] [CrossRef] [PubMed] [Green Version]
- Rossi, B.; Verrocchio, P.; Viliani, G.; Mancini, I.; Guella, G.; Rigo, E.; Scarduelli, G.; Mariotto, G. Vibrational properties of ibuprofen–cyclodextrin inclusion complexes investigated by Raman scattering and numerical simulation. J. Raman Spectrosc. 2009, 40, 453–458. [Google Scholar] [CrossRef]
- Ewing, A.V.; Clarke, G.S.; Kazarian, S.G. Attenuated total reflection-Fourier transform infrared spectroscopic imaging of pharmaceuticals in microfluidic devices. Biomicrofluidics 2016, 10, 024125. [Google Scholar] [CrossRef] [PubMed] [Green Version]
- Matkovic, S.; Valle, G.; Briand, L. Quantitative analysis of ibuprofen in pharmaceutical formulations through FTIR spectroscopy. Lat. Am. Appl. Res. 2005, 35, 189–195. [Google Scholar]
- Jampilek, J.; Dolowy, M.; Pyka-Pajak, A. Estimating limits of detection and quantification of ibuprofen by TLC-densitometry at different chromatographic conditions. Processes 2020, 8, 919. [Google Scholar] [CrossRef]
- Khan, N.A.; Khan, S.U.; Ahmed, S.; Farooqi, I.H.; Yousefi, M.; Mohammadi, A.A.; Changani, F. Recent trends in disposal and treatment technologies of emerging-pollutants—A critical review. TrAC Trends Anal. Chem. 2020, 122, 115744. [Google Scholar] [CrossRef]
- Long, D.A. Vibrational Resonance Raman Scattering. In The Raman Effect; John Wiley & Sons: Hoboken, NJ, USA, 2002; Chapter 7; pp. 221–270. [Google Scholar] [CrossRef]
- Myers Kelley, A. Resonance Raman and Resonance Hyper-Raman Intensities: Structure and Dynamics of Molecular Excited States in Solution. J. Phys. Chem. A 2008, 112, 11975–11991. [Google Scholar] [CrossRef]
- Myers, A.B. Resonance Raman Intensities and Charge-Transfer Reorganization Energies. Chem. Rev. 1996, 96, 911–926. [Google Scholar] [CrossRef]
- Efremov, E.V.; Ariese, F.; Gooijer, C. Achievements in resonance Raman spectroscopy: Review of a technique with a distinct analytical chemistry potential. Anal. Chim. Acta 2008, 606, 119–134. [Google Scholar] [CrossRef] [PubMed]
- Rossi, B.; Bottari, C.; Catalini, S.; D’Amico, F.; Gessini, A.; Masciovecchio, C. Chapter 13—Synchrotron-based ultraviolet resonance Raman scattering for material science. In Molecular and Laser Spectroscopy; Gupta, V., Ozaki, Y., Eds.; Elsevier: Amsterdam, The Netherlands, 2020; pp. 447–482. [Google Scholar] [CrossRef]
- Catalini, S.; Rossi, B.; Foggi, P.; Masciovecchio, C.; Bruni, F. Aqueous solvation of glutathione probed by UV resonance Raman spectroscopy. J. Mol. Liq. 2019, 283, 537–547. [Google Scholar] [CrossRef]
- Hashimoto, S.; Yabusaki, T.; Takeuchi, H.; Harada, I. Structure and ligand-binding modes of human serum albumin studied by UV resonance raman spectroscopy. Biospectroscopy 1995, 1, 375–385. [Google Scholar] [CrossRef]
- Marvin. Calculator Plugins Were Used for Structure Property Prediction and Calculation, Marvin 19.20; ChemAxon: Budapest, Hungary, 2019; Available online: http://www.chemaxon.com (accessed on 31 October 2021).
- Odjadjare, E.E.; Okoh, A.I. Physicochemical quality of an urban municipal wastewater effluent and its impact on the receiving environment. Environ. Monit. Assess. 2010, 170, 383–394. [Google Scholar] [CrossRef] [PubMed]
- Majumder, A.; Gupta, A.K.; Ghosal, P.S.; Varma, M. A review on hospital wastewater treatment: A special emphasis on occurrence and removal of pharmaceutically active compounds, resistant microorganisms, and SARS-CoV-2. J. Environ. Chem. Eng. 2020, 9, 104812. [Google Scholar] [CrossRef]
- Yanai, T.; Tew, D.P.; Handy, N.C. A new hybrid exchange–correlation functional using the Coulomb-attenuating method (CAM-B3LYP). Chem. Phys. Lett. 2004, 393, 51–57. [Google Scholar] [CrossRef] [Green Version]
- Krishnan, R.; Binkley, J.S.; Seeger, R.; Pople, J.A. Self-consistent molecular orbital methods. XX. A basis set for correlated wave functions. J. Chem. Phys. 1980, 72, 650. [Google Scholar] [CrossRef]
- Clark, T.; Chandrasekhar, J.; Spitznagel, G.W.; Schleyer, P.V.R. Efficient diffuse function-augmented basis sets for anion calculations. III. The 3-21+G basis set for first-row elements, Li–F. J. Comput. Chem. 1983, 4, 294–301. [Google Scholar] [CrossRef]
- Giovannini, T.; Egidi, F.; Cappelli, C. Molecular spectroscopy of aqueous solutions: A theoretical perspective. Chem. Soc. Rev. 2020, 49, 5664–5677. [Google Scholar] [CrossRef]
- Wang, J.; Wolf, R.M.; Caldwell, J.W.; Kollman, P.A.; Case, D.A. Development and testing of a general amber force field. J. Comput. Chem. 2004, 25, 1157–1174. [Google Scholar] [CrossRef]
- Mark, P.; Nilsson, L. Structure and Dynamics of the TIP3P, SPC, and SPC/E Water Models at 298 K. J. Phys. Chem. A 2001, 105, 9954–9960. [Google Scholar] [CrossRef]
- Marenich, A.V.; Jerome, S.V.; Cramer, C.J.; Truhlar, D.G. Charge Model 5: An Extension of Hirshfeld Population Analysis for the Accurate Description of Molecular Interactions in Gaseous and Condensed Phases. J. Chem. Theory Comput. 2012, 8, 527–541. [Google Scholar] [CrossRef] [PubMed]
- Abrahama, M.J.; Murtola, T.; Schulz, R.; Pálla, S.; Smith, J.C.; Hess, B.; Lindahl, E. GROMACS: High Performance Molecular Simulations through Multi-Level Parallelism from Laptops to Supercomputers. SoftwareX 2015, 1–2, 19–25. [Google Scholar] [CrossRef] [Green Version]
- Berendsen, H.J.; Van Gunsteren, W.F. Practical algorithms for dynamic simulations. In Molecular-Dynamics Simulations of Statistical-Mechanical Systems; Enrico Fermi Summer School: Varenna, Italy, 1986; pp. 43–65. [Google Scholar]
- Parrinello, M.; Rahman, A. Strain fluctuations and elastic constants. J. Chem. Phys. 1982, 76, 2662–2666. [Google Scholar] [CrossRef]
- Daura, X.; Gademann, K.; Jaun, B.; Seebach, D.; van Gunsteren, W.F.; Mark, A.E. Peptide Folding: When Simulation Meets Experiment. Angew. Chem. Int. Ed. 1999, 38, 236–240. [Google Scholar] [CrossRef]
- Brehm, M.; Kirchner, B. TRAVIS - A Free Analyzer and Visualizer for Monte Carlo and Molecular Dynamics Trajectories. J. Chem. Inf. Model. 2011, 51, 2007–2023. [Google Scholar] [CrossRef] [Green Version]
- Brehm, M.; Thomas, M.; Gehrke, S.; Kirchner, B. TRAVIS—A free analyzer for trajectories from molecular simulation. J. Chem. Phys. 2020, 152, 164105. [Google Scholar] [CrossRef] [Green Version]
- Weinhold, F. Natural bond critical point analysis: Quantitative relationships between natural bond orbital-based and QTAIM-based topological descriptors of chemical bonding. J. Comput. Chem. 2012, 33, 2440–2449. [Google Scholar] [CrossRef]
- Weinhold, F.; Landis, C.R. Discovering Chemistry with Natural Bond Orbitals; Wiley-VCH: Hoboken, NJ, USA, 2012; 319p. [Google Scholar]
- Weinhold, F.; Landis, C.; Glendening, E. What is NBO analysis and how is it useful? Int. Rev. Phys. Chem. 2016, 35, 399–440. [Google Scholar] [CrossRef]
- Glendening, E.D.; Badenhoop, J.K.; Reed, A.E.; Carpenter, J.E.; Bohmann, J.A.; Morales, C.M.; Karafiloglou, P.; Landis, C.R.; Weinhold, F. NBO 7.0; Theoretical Chemistry Institute, University of Wisconsin: Madison, WI, USA, 2018. [Google Scholar]
- Giovannini, T.; Lafiosca, P.; Chandramouli, B.; Barone, V.; Cappelli, C. Effective yet reliable computation of hyperfine coupling constants in solution by a QM/MM approach: Interplay between electrostatics and non-electrostatic effects. J. Chem. Phys. 2019, 150, 124102. [Google Scholar] [CrossRef]
- Giovannini, T.; Del Frate, G.; Lafiosca, P.; Cappelli, C. Effective computational route towards vibrational optical activity spectra of chiral molecules in aqueous solution. Phys. Chem. Chem. Phys. 2018, 20, 9181–9197. [Google Scholar] [CrossRef]
- Gómez, S.; Egidi, F.; Puglisi, A.; Giovannini, T.; Rossi, B.; Cappelli, C. Unlocking the Power of Resonance Raman Spectroscopy: The Case of Amides in Aqueous Solution. J. Mol. Liq. 2021, 346, 117841. [Google Scholar] [CrossRef]
- Santoro, F.; Cappelli, C.; Barone, V. Effective Time-Independent Calculations of Vibrational Resonance Raman Spectra of Isolated and Solvated Molecules Including Duschinsky and Herzberg—Teller Effects. J. Chem. Theory Comput. 2011, 7, 1824–1839. [Google Scholar] [CrossRef]
- Olszówka, M.; Russo, R.; Mancini, G.; Cappelli, C. A computational approach to the resonance Raman spectrum of doxorubicin in aqueous solution. Theor. Chem. Accounts 2016, 135, 27. [Google Scholar] [CrossRef]
- Egidi, F.; Bloino, J.; Cappelli, C.; Barone, V. A Robust and Effective Time-Independent Route to the Calculation of Resonance Raman Spectra of Large Molecules in Condensed Phases with the Inclusion of Duschinsky, Herzberg–Teller, Anharmonic, and Environmental Effects. J. Chem. Theory Comput. 2014, 10, 346–363. [Google Scholar] [CrossRef] [PubMed] [Green Version]
- Frisch, M.J.; Trucks, G.W.; Schlegel, H.B.; Scuseria, G.E.; Robb, M.A.; Cheeseman, J.R.; Scalmani, G.; Barone, V.; Petersson, G.A.; Nakatsuji, H.; et al. Gaussian 16 Revision B.01; Gaussian Inc.: Wallingford, CT, USA, 2016. [Google Scholar]
- Reed, A.E.; Curtiss, L.A.; Weinhold, F. Intermolecular interactions from a natural bond orbital, donor-acceptor viewpoint. Chem. Rev. 1988, 88, 899–926. [Google Scholar] [CrossRef]
- Gómez, S.; Nafziger, J.; Restrepo, A.; Wasserman, A. Partition-DFT on the water dimer. J. Chem. Phys. 2017, 146, 074106. [Google Scholar] [CrossRef] [PubMed] [Green Version]
- Gómez, S.; Rojas-Valencia, N.; Gómez, S.A.; Cappelli, C.; Merino, G.; Restrepo, A. A molecular twist on hydrophobicity. Chem. Sci. 2021, 12, 9233–9245. [Google Scholar] [CrossRef]
- Rojas-Valencia, N.; Gómez, S.; Núñez-Zarur, F.; Cappelli, C.; Hadad, C.; Restrepo, A. Thermodynamics and Intermolecular Interactions during the Insertion of Anionic Naproxen into Model Cell Membranes. J. Phys. Chem. B 2021, 125, 10383–10391. [Google Scholar] [CrossRef]
- Gomez, S.A.; Rojas-Valencia, N.; Gomez, S.; Egidi, F.; Cappelli, C.; Restrepo, A. Binding of SARS-CoV-2 to cell receptors: A tale of molecular evolution. ChemBioChem 2021, 22, 724–732. [Google Scholar] [CrossRef]
- Gomez, S.A.; Rojas-Valencia, N.; Gomez, S.; Cappelli, C.; Restrepo, A. The role of spike protein mutations in the infectious power of SARS-COV-2 variants: A molecular interaction perspective. ChemBioChem 2021, 22. [Google Scholar] [CrossRef]
- Frade, T.; Gomes, A. ZnO Nanostructured Thin Films Applied on Ibuprofen Photoelectrodegradation. In Solid State Phenomena; Trans Tech Publications: Zurich, Switzerland, 2013; Volume 194, pp. 258–261. [Google Scholar] [CrossRef]
- Tian, H.; Fan, Y.; Zhao, Y.; Liu, L. Elimination of ibuprofen and its relative photo-induced toxicity by mesoporous BiOBr under simulated solar light irradiation. RSC Adv. 2014, 4, 13061–13070. [Google Scholar] [CrossRef]
- Vargek, M. Instrumentation Advances and New Applications in Raman Optical Activity; ProQuest LLC.: Ann Arbor, MI, USA, 1997. [Google Scholar]
- Vargek, M.; Freedman, T.B.; Nafie, L.A. Resonance and Non-Resonance Raman Optical Activity in Pharmaceutical Analgesic Molecules. In Spectroscopy of Biological Molecules: Modern Trends; Carmona, P., Navarro, R., Hernanz, A., Eds.; Springer: Dordrecht, The Netherlands, 1997; pp. 459–460. [Google Scholar] [CrossRef]
- Vargek, M.; Freedman, T.B.; Lee, E.; Nafie, L.A. Experimental observation of resonance Raman optical activity. Chem. Phys. Lett. 1998, 287, 359–364. [Google Scholar] [CrossRef]
- Guthmuller, J.; Champagne, B. Time dependent density functional theory investigation of the resonance Raman properties of the julolidinemalononitrile push-pull chromophore in various solvents. J. Chem. Phys. 2007, 127, 164507. [Google Scholar] [CrossRef] [PubMed]
- Xiong, K. UV Resonance Raman Spectroscopy: A Highly Sensitive, Selective and Fast Technique for Environmental Analysis. J. Environ. Anal. Chem. 2014, 2, e107. [Google Scholar] [CrossRef]
- Guthmuller, J. Calculation of Vibrational Resonance Raman Spectra of Molecules Using Quantum Chemistry Methods. In Molecular Spectroscopy: A Quantum Chemistry Approach; Ozaki, Y., Wójcik, M.J., Popp, J., Eds.; John Wiley & Sons: Hoboken, NJ, USA, 2019. [Google Scholar] [CrossRef]
- Bottari, C.; Catalini, S.; Foggi, P.; Mancini, I.; Mele, A.; Perinelli, D.R.; Paciaroni, A.; Gessini, A.; Masciovecchio, C.; Rossi, B. Base-specific pre-melting and melting transitions of DNA in presence of ionic liquids probed by synchrotron-based UV resonance Raman scattering. J. Mol. Liq. 2021, 330, 115433. [Google Scholar] [CrossRef]
- Bottari, C.; Mancini, I.; Mele, A.; Gessini, A.; Masciovecchio, C.; Rossi, B. Conformational stability of DNA in hydrated ionic liquid by synchrotron-based UV resonance raman. In UV and Higher Energy Photonics: From Materials to Applications 2019; Lérondel, G., Cho, Y.H., Taguchi, A., Kawata, S., Eds.; International Society for Optics and Photonics, SPIE: Bellingham, WA, USA, 2019; Volume 11086, pp. 33–40. [Google Scholar] [CrossRef]
- Rossi, B.; Catalini, S.; Bottari, C.; Gessini, A.; Masciovecchio, C. Frontiers of UV resonant raman spectroscopy by using synchrotron radiation: The case of aqueous solvation of model peptides. In UV and Higher Energy Photonics: From Materials to Applications 2019; Lérondel, G., Cho, Y.H., Taguchi, A., Kawata, S., Eds.; International Society for Optics and Photonics, SPIE: Bellingham, WA, USA, 2019; Volume 11086, pp. 23–32. [Google Scholar] [CrossRef]
Publisher’s Note: MDPI stays neutral with regard to jurisdictional claims in published maps and institutional affiliations. |
© 2022 by the authors. Licensee MDPI, Basel, Switzerland. This article is an open access article distributed under the terms and conditions of the Creative Commons Attribution (CC BY) license (https://creativecommons.org/licenses/by/4.0/).