Abstract
A novel, label-free fluorescent assay has been developed for the detection of trypsin by using thioflavin T as a fluorescent probe. A specific DNA aptamer can be combined by adding cytochrome c. Trypsin hydrolyzes the cytochrome c into small peptide fragments, exposing the G-quadruplex part of DNA aptamer, which has a high affinity for thioflavin T, which then enhances the fluorescence intensity. In the absence of trypsin, the fluorescence intensity was inhibited as the combination of cytochrome c and the DNA aptamer impeded thioflavin T’s binding. Thus, the fluorescent biosensor showed a linear relationship from 0.2 to 60 μg/mL with a detection limit of 0.2 μg/mL. Furthermore, the proposed method was also successfully employed for determining trypsin in biological samples. This method is simple, rapid, cheap, and selective and possesses great potential for the detection of trypsin in bioanalytical and biological samples and medical diagnoses.
1. Introduction
Trypsin, one of the major and well-known proteolytic enzymes secreted by the pancreas, is integrally involved in many biological processes, such as protein digestion and the regulation of pancreatic function [1]. Trypsin is secreted from the acinar cells of the pancreas to the gastrointestinal tract via the pancreatic duct, where this enzyme is activated by enterokinase or autocatalysis; the resultant peptides are further digested by a variety of exopeptidases, and, subsequently, the small peptic fragments are absorbed in the intestine [2]. Abnormal trypsin levels are associated with different diseases, including pancreatitis (both chronic and acute) [3,4,5,6,7], cancer [8,9,10], inflammation [11,12,13], and septicemia [14]. The serum of a healthy individual contains 250 ± 100 ng/mL of trypsin, while patients with pancreatitis or pancreatic cancer may show a higher concentration of serum-trypsin, i.e., 1400 ± 600 ng/mL [15,16]. Patients with nutritional disorders typically exhibit serum-trypsin concentrations of less than 120 ng/mL [17,18]. For these reasons, trypsin has been successfully used as a biomarker for the diagnosis of pancreatic diseases and other health conditions [19,20]. Herein, a selective and sensitive detection method was developed that can accurately measure serum-trypsin levels in a wide concentration range and the presence of different interfering species.
Currently, various methods have been employed successfully for the detection of trypsin, including enzyme-linked immunosorbent assay (ELISA) [21,22], high-performance liquid chromatography (HPLC) [23], gelatin-based film technique [24], and colorimetric detection [25,26,27]. Nevertheless, the applicability of these traditional methods is compromised due to the time-consuming and complex sample preparation methods, high capital investment for instruments, significant recurring expenses for consumables, and the requirement of highly trained personnel. In particular, the ELISA method requires costly antibodies and involves expensive and complicated pretreatment methods. Environmental conditions, such as temperature and pH, greatly affect the stability of the antibodies and antigens. Thus, there is a need for the development of a simple, fast, and sensitive biosensor for the quantitative determination of trypsin. For the quantitative determination of trypsin, several biosensors have been developed based on different methods, such as Quartz Crystal Microbalance (QCM) [28] and fluorometric [29,30,31,32], photoelectrochemical, and electrochemical methods [33,34]. Among these methods, fluorometric methods are extremely popular owing to their inherent advantages, such as high sensitivity, simple instruments, rapid response, easy operation, and real-time detection. Until now, many fluorescence-turn-on-strategy-based assays have been developed for trypsin determination. Chen et al. reported a fluorescence turn-on method for the detection of trypsin with an inspiring detection limit of 0.004 μg/mL [35]. However, the linearity range of this method was narrow (from 0.01 to 2 μg/mL), which limited its application in clinical use. Huang et al. reported a trypsin detection method based on fluorescent probe HBI-GR; the probe was synthesized by combining the fluorophore (p-HBI) in green fluorescent protein (GFP) and guanine riboside (GR), and this method showed an excellent lower detection limit, i.e., 0.0282 ng/mL [31]. Wang et al. established a label-free and sensitive fluorometric procedure on the basis of fluorescence resonance energy transfer (FRET) between mercaptoundecanoic acid-functionalized gold nanoclusters (AuNCs) and gold nanoparticles (AuNPs) [29]. Wu et al. prepared protease-sensing, protein-conjugated QDs [36]. However, the applicability of these methods is compromised by several limitations, such as impractical clinical application, fluorescence labeling, high-cost materials, and the relatively high toxicity of quantum dots. Hence, a simple, sensitive, and practical quantitative method should be developed for determining trypsin.
The SELEX (Systematic Evolution of Ligands by Exponential Enrichment) method has been employed for the in vitro screening of the short segments of RNA or DNA single-stranded oligonucleotide sequences as aptamers [37,38]. They are equipped with an ability that frames unique three-dimensional structures via folding, including hairpin, pseudoknot, and G-quadruplex, to combine them with target molecules with a high affinity and high specificity [39,40,41]. The high affinity and specificity allow them to function as antibodies. Furthermore, aptamers are advantageous due to their low cost, high stability, and simple synthetic processes [42,43]. Therefore, aptamers are widely used for detecting different chemical compounds in protein research, drug analysis, virology, and food safety [44,45,46,47].
Hence, based on the high affinity between DNA aptamer and cytochrome c (cyt c) and the hydrolysis characteristics of trypsin [48], a simple, cost-effective, thioflavin T (ThT)-based, and quencher-free fluorescence method has been developed. Cyt c (a metalloprotein containing 104 amino acid residues) serves as a representative target for trypsin [49]. ThT-based fluorescent probes have been widely utilized in many fields due to their inherent advantages, such as sensitivity, convenience, and cost-effectiveness [50,51,52,53]. ThT can effectively bind to G-quadruplexes, resulting in an enhanced fluorescence signal [54,55]. The developed method has been successfully applied in determining trypsin in biological samples, and thus, this method has been shown to have promising applications in clinical use.
2. Results and Discussion
2.1. Principle of Trypsin Detection
The principle of this assay is depicted in Figure 1. In this study, a DNA aptamer with high specificity to cyt c was selected through SELEX and then sequenced, synthesized, and characterized [48]. After the addition, the specific DNA aptamer quickly combined with cyt c (due to its high molecular weight). Subsequently, the steric hindrance prevented the linkage between ThT and the G-quadruplex part of the DNA aptamer, thus significantly reducing the fluorescence. In the detection system, trypsin can cleave cyt c into small peptide fragments, thus reducing the steric hindrance against the linkage and restoring the fluorescence. By measuring the degree of fluorescence recovery, the amount of trypsin can be determined.
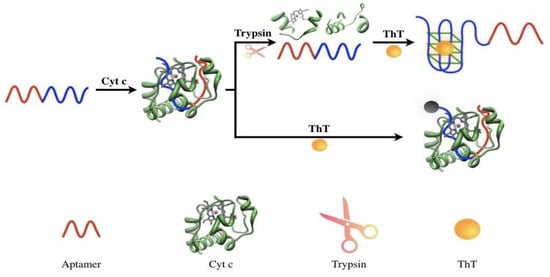
Figure 1.
Schematic illustration of the fluorometric assay for detecting trypsin.
2.2. Verification of the Feasibility of Trypsin Detection
The proposed method can detect strong levels of fluorescence at 490 nm of excitation from the G-quadruplex structure, which was formed by the association between the DNA aptamer and the ThT in buffer. However, no fluorescence was detected after the addition of cyt c, as the cyt c bonded to the DNA aptamer and prevented the formation of a G-quadruplex structure. The addition of trypsin restored the fluorescence. Trypsin cleaved the cyt c to small peptide fragments and assisted in the formation of a G-quadruplex structure (Figure 2). In summary, the results of this experiment demonstrated the feasibility of the proposed strategy for the determination of trypsin.
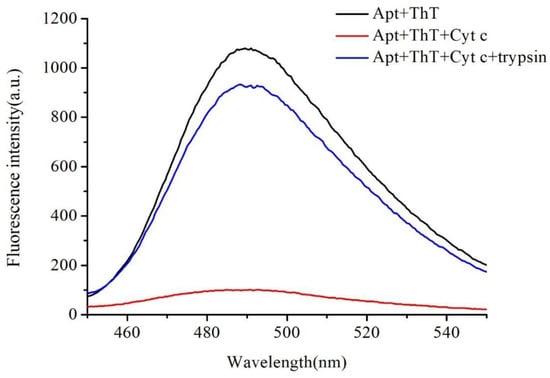
Figure 2.
Feasibility of the proposed method: Fluorescence intensity of DNA aptamer-ThT; DNA aptamer-ThT with and without adding trypsin. All reactions were performed in 50 mmol/L Tris and 1 mmol/L KCl buffer at pH 7.5. In total, 50 μmol/L DNA aptamer, 1 mmol/L ThT, 10 mmol/L cyt c, 10 mg/mL trypsin, and 30 min of incubation time were employed. Fluorescence intensity was measured using an F-2700 with excitation at 490 nm, and the emission spectra were collected in the range of 450 to 550 nm.
2.3. Optimization of Experimental Conditions
Different parameters influence fluorescence intensity during trypsin detection. Not only the concentration of each component but also the reaction time are critical factors for a desirable fluorescence response [56,57]. At first, the concentration range of the DNA aptamer was optimized between 100 nM to 350 nM. As shown in Figure 3a, the optimal concentration of the DNA aptamer was 250 nM. We then applied the 250 nM DNA aptamer in the assay to optimize the concentration of cyt c from 20 μM to 100 μM (a), and the ratio of the increase in fluorescence intensity reached a plateau at 80 μM of cyt c (Figure 3a). Under 250 nM of DNA aptamer and the 80 μM cyt c condition, the concentration of ThT was optimized from 5 μM to 15 μM, and the optimal concentration was achieved at 10 μM (Figure 3a). Figure 3b shows that the fluorescent intensity increased with the increased time for the reaction between trypsin and cyt c. The fluorescent intensity reached a peak after 45 min when the binding between trypsin and cyt c reached equilibrium and a saturation point. Moreover, 45 min was also a suitable hybridization time for cyt c, the DNA aptamer, and trypsin. Thus, 45 min was chosen as the incubation time for the reactions of cyt c with the trypsin and DNA aptamer.
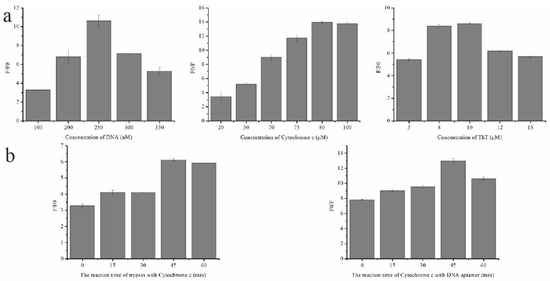
Figure 3.
Optimizing the experimental conditions: (a) concentration of different experimental components, including DNA chain (1 mM ThT, 10 mM cyt c, and 10 mg/mL trypsin; 30 min of incubation time and a different concentration of DNA aptamer were employed), cytochrome c (250 nM DNA aptamer, 1 mM ThT, and 10 mg/mL trypsin; 30 min of incubation time and a different concentration of cyt c were employed), and ThT (250 nM DNA aptamer, 80 μM cyt c, and 10 mg/mL trypsin; 30 min of incubation time and a different concentration of ThT were employed); (b) reaction time for trypsin and cytochrome c (250 nM DNA aptamer and 80 μM cyt c with or without 10 mg/mL trypsin incubated within a different time range and then 10 μM ThT added for testing) and reaction time for the DNA chain (250 nM DNA aptamer with or without 80 μM cyt c incubated within a different time range and then 10 μM ThT added for testing).
2.4. Quantitative Measurement of Trypsin
A series of concentrations of trypsin ranging from 0 to 140 μg/mL (0, 0.2, 1, 5, 10, 20, 30, 40, 60, 80, 100, 120, 140 μg/mL) was selected for evaluating the sensitivity of the proposed method. Figure 4a shows that the fluorescence intensity at 490 nm dynamically increased while increasing the concentration of trypsin. Figure 4b shows the relationship between the fluorescence intensity and the concentration of trypsin. Figure 4b shows that the fluorescence intensity possessed a linear relationship (R2 = 0.9993) with the concentration of trypsin in the range of 0.2–60 μg/mL, and the regression equation is Y = 9.7432X + 123.83, where Y is the fluorescence intensity at 490 nm and X is the trypsin concentration. The limit of detection of the proposed method was 0.2 μg/mL. Therefore, a simple, rapid, effective, and sensitive method has been established for determining trypsin. Furthermore, the proposed method showed a lower detection limit (0.2 μg/mL) and a wider linear range (0.2–60 μg/mL) than the previously reported trypsin detection methods (Table 1). In addition, the assay did not involve any synthetic or time-consuming procedures. Therefore, the proposed assay can easily and successfully quantify trypsin.
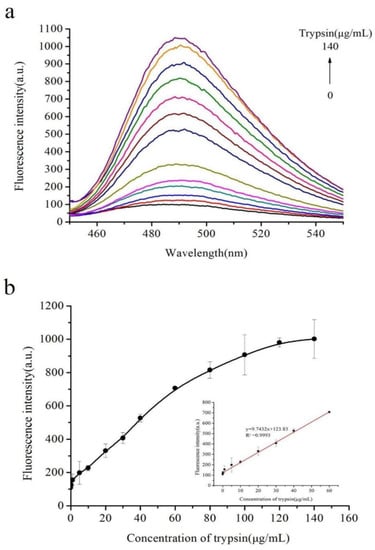
Figure 4.
(a) Fluorescence emission spectra upon addition of trypsin at different concentrations, from 0 to 140 μg/mL. (b) Fluorescence signal in response to different concentrations of trypsin, showing the linear curve of the enhanced fluorescence intensity to the concentration of trypsin. The inset shows the linearity of the fluorescence intensity with respect to trypsin concentrations.

Table 1.
Comparison of different methods of trypsin determination.
2.5. Study of Interferences
Several proteins, such as HSA, GSH, Actin, PKA, ALP, and thrombin, were tested by the proposed assay under the optimized concentrations to investigate the selectivity of the method. Figure 5 implies that none of the proteins influenced the combination of DNA aptamer and cyt c. Therefore, the proposed assay is specific for the detection of trypsin, and the method possesses great potential in evaluating biological samples.
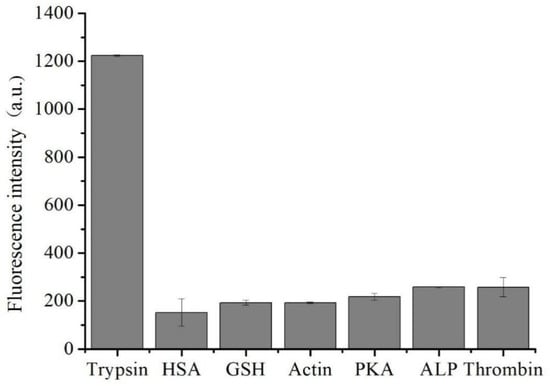
Figure 5.
Selectivity of the assay. Selectivity of the proposed trypsin assay toward trypsin, HSA, GSH, Actin, PKA, ALP, and thrombin (60 μg/mL each).
2.6. Trypsin Detection Assay in Real Samples
The method was applied to real samples, and diluted serum was added to the reaction system. When 15, 40, and 60 μg/mL of trypsin was added to the samples, the recovery rates were 103.9%, 91.8%, and 101.95%, respectively (Table 2). The result indicates that the trypsin detection method can be practically used in real samples.

Table 2.
Recovery experiments for the determination of trypsin in human serum samples.
3. Materials and Methods
3.1. Materials and Reagents
Trypsin was purchased from Sigma Aldrich (St. Louis, MO, USA). Standard solutions of trypsin were prepared daily by further diluting its stock solution (0.01 g trypsin was dissolved in 1 mL ultrapure water, and the concentration of trypsin was 10 mg/mL), which was stored at −20 °C. Human serum albumin (has), protein kinase (PKA), alkaline phosphatase, thrombin, glutathione (GSH), Actin, cyt c, and ThT were also purchased from Sigma Aldrich (St. Louis, MO, USA). The oligonucleotide cyto c apt (trypsin) was purchased from Sangon Biological Engineering Technology & Services (Shanghai, China). The DNA aptamer to cyt c was synthesized from Sangon Biotech Co. Ltd. (Shanghai, China), which had the following sequence: 5′-Fam-CCG TGT CTG GGG CCG ACC GGC GCA TTG GGT ACG TTG TTG CAA AAA GGG TTA GGG TTA GGG TTA GGG C-3′ [62]. The DNA sequence was dissolved in TE buffer and stored at −20 °C for further use. All solutions were prepared using ultrapure water, which was obtained through a Millipore Milli-Q water purification system (Billerica, MA), with an electric resistance >18.3 MΩ. All other chemicals were of analytical grade and purchased from Sinopharm Chemical Reagent Co. Ltd. (Shanghai, China).
3.2. Apparatus
All fluorescence measurements were performed on an F-2700 spectrophotometer (Hitachi, Tokyo, Japan) with excitation at 490 nm and emission at 450–550 nm for the cyt c apt. The excitation slits and emission slits were, respectively, set at 10.0 and 10.0 nm. Each experiment was carried out in a final volume of 100 µL.
3.3. Trypsin Detection Assays
In this study, 10 mM of cytochrome c and different concentrations of trypsin were mixed together in the reaction buffer (50 mM Tris, 1 mM KCl, and pH 7.5) and incubated at 37 °C for 45 min. Then, 250 nM of cyt c apt was added to the reaction solution and incubated at 37 °C for 45 min. Finally, 10 μM of ThT was added to the solution and kept at room temperature for 10 min. Fluorescence intensity was measured using an F-2700 with excitation at 490 nm, and the emission spectra were collected at the range of 450 to 550 nm.
4. Conclusions
In summary, a successful fluorometric method has been developed based on DNA aptamer, cyt c, and ThT for detecting trypsin. The proposed method exhibited high sensitivity toward trypsin, with a detection limit of 0.2 μg/mL under optimized conditions. Furthermore, this method is simple and cost-effective, without any labels or complicated operations. The proposed strategy was also successfully applied in detecting trypsin in serum samples, and satisfactory results were obtained. Therefore, the present strategy based on DNA aptamer and cyt c may be applied for detecting trypsin in bioanalytical and biological studies and medical diagnoses.
Author Contributions
Conceptualization, C.M.; formal analysis, P.G. and Y.L.; investigation, P.G. and Y.L.; writing—original draft preparation, P.G. and Y.L.; writing—review and editing, S.L. and C.M.; supervision, S.L. and C.M.; funding acquisition, S.L. All authors have read and agreed to the published version of the manuscript.
Funding
This research was funded by the National Natural Science Foundation of China (No. 21205142) and the Research Innovation Program for Graduates of Central South University (2019zzts453).
Institutional Review Board Statement
The study was approved by the Ethics Committee of Central South University (protocol code 2020-1-11; date of approval 4 February 2020).
Informed Consent Statement
Informed consent was obtained from all subjects involved in the study.
Data Availability Statement
Not applicable.
Conflicts of Interest
The authors declare no conflict of interest.
Sample Availability
Samples of the compounds are available from the authors.
References
- Atkinson, M.A.; Campbell-Thompson, M.; Kusmartseva, I.; Kaestner, K.H. Organisation of the human pancreas in health and in diabetes. Diabetologia 2020, 63, 1966–1973. [Google Scholar] [CrossRef] [PubMed]
- Sensoy, I. A review on the food digestion in the digestive tract and the used in vitro models. Curr. Res. Food Sci. 2021, 4, 308–319. [Google Scholar] [CrossRef]
- Hegyi, E.; Tóth, A.Z.; Vincze, Á.; Szentesi, A.; Hegyi, P.; Sahin-Tóth, M. Alcohol-dependent effect of PRSS1-PRSS2 haplotype in chronic pancreatitis. Gut 2020, 69, 1713–1715. [Google Scholar] [CrossRef] [PubMed]
- Hirota, M.; Ohmuraya, M.; Hashimoto, D.; Suyama, K.; Sugita, H.; Ogawa, M. Roles of Autophagy and Pancreatic Secretory Trypsin Inhibitor in Trypsinogen Activation in Acute Pancreatitis. Pancreas 2020, 49, 493–497. [Google Scholar] [CrossRef] [PubMed]
- Lasher, D.; Szabó, A.; Masamune, A.; Chen, J.M.; Xiao, X.; Whitcomb, D.C.; Barmada, M.M.; Ewers, M.; Ruffert, C.; Paliwal, S.; et al. Protease-Sensitive Pancreatic Lipase Variants Are Associated With Early Onset Chronic Pancreatitis. Am. J. Gastroenterol. 2019, 114, 974–983. [Google Scholar] [CrossRef] [PubMed]
- Liu, K.; Liu, J.; Zou, B.; Li, C.; Zeh, H.J.; Kang, R.; Kroemer, G.; Huang, J.; Tang, D. Trypsin-Mediated Sensitization to Ferroptosis Increases the Severity of Pancreatitis in Mice. Cell. Mol. Gastroenterol. Hepatol. 2022, 13, 483–500. [Google Scholar] [CrossRef]
- Malla, S.R.; Krueger, B.; Wartmann, T.; Sendler, M.; Mahajan, U.M.; Weiss, F.U.; Thiel, F.G.; De Boni, C.; Gorelick, F.S.; Halangk, W.; et al. Early trypsin activation develops independently of autophagy in caerulein-induced pancreatitis in mice. Cell. Mol. Life Sci. 2020, 77, 1811–1825. [Google Scholar] [CrossRef]
- Kim, K.K.; Turner, R.; Khazan, N.; Kodza, A.; Jones, A.; Singh, R.K.; Moore, R.G. Role of trypsin and protease-activated receptor-2 in ovarian cancer. PLoS ONE 2020, 15, e0232253. [Google Scholar] [CrossRef]
- Søreide, K.; Roalsø, M.; Aunan, J.R. Is There a Trojan Horse to Aggressive Pancreatic Cancer Biology? A Review of the Trypsin-PAR2 Axis to Proliferation, Early Invasion, and Metastasis. J. Pancreat. Cancer 2020, 6, 12–20. [Google Scholar] [CrossRef]
- Thomas, R.G.; Surendran, S.P.; Jeong, Y.Y. Tumor Microenvironment-Stimuli Responsive Nanoparticles for Anticancer Therapy. Front. Mol. Biosci. 2020, 7, 610533. [Google Scholar] [CrossRef]
- Dutta, B.; Arya, R.K.; Goswami, R.; Alharbi, M.O.; Sharma, S.; Rahaman, S.O. Role of macrophage TRPV4 in inflammation. Lab. Investig. 2020, 100, 178–185. [Google Scholar] [CrossRef] [PubMed]
- Yadav, S.C.; Zhang, B. Effect of Early Continuous Veno-Venous Haemofiltration in Severe Acute Pancreatitis for the Prevention of Local Pancreatic Complications. Gastroenterol. Res. Pract. 2022, 2022, 7575231. [Google Scholar] [CrossRef] [PubMed]
- Meyer-Hoffert, U.; Rogalski, C.; Seifert, S.; Schmeling, G.; Wingertszahn, J.; Proksch, E.; Wiedow, O. Trypsin induces epidermal proliferation and inflammation in murine skin. Exp. Dermatol. 2004, 13, 234–241. [Google Scholar] [CrossRef] [PubMed]
- Dan, Z.Q.Z.; Liao, X.L.; Hou, C.S.; Xu, B.B.; Yang, J.; Kang, Y. The expression of trypsin in serum and vital organs of septic rats. Zhonghua Nei Ke Za Zhi 2018, 57, 505–510. [Google Scholar] [CrossRef]
- Zhou, S.; Wang, L.; Chen, X.; Guan, X. Label-free nanopore single-molecule measurement of trypsin activity. ACS Sens. 2016, 1, 607–613. [Google Scholar] [CrossRef]
- Pezzilli, R.; Caccialanza, R.; Capurso, G.; Brunetti, O.; Milella, M.; Falconi, M. Pancreatic Enzyme Replacement Therapy in Pancreatic Cancer. Cancers 2020, 12, 275. [Google Scholar] [CrossRef] [PubMed]
- Li, Y.; Xu, G.; Zhou, B.; Tang, Y.; Liu, X.; Wu, Y.; Wang, Y.; Kong, J.; Xu, T.; He, C.; et al. Effects of acids, pepsin, bile acids, and trypsin on laryngopharyngeal reflux diseases: Physiopathology and therapeutic targets. Eur. Arch. Otorhinolaryngol. 2022, 279, 2743–2752. [Google Scholar] [CrossRef]
- Lohman, R.J.; O’Brien, T.J.; Cocks, T.M. Protease-activated receptor-2 regulates trypsin expression in the brain and protects against seizures and epileptogenesis. Neurobiol. Dis. 2008, 30, 84–93. [Google Scholar] [CrossRef] [PubMed]
- Fu, Y.; Liu, L.; Li, X.; Chen, H.; Wang, Z.; Yang, W.; Zhang, H.; Zhang, H. Peptide modified manganese-doped iron oxide nanoparticles as a sensitive fluorescence nanosensor for non-invasive detection of trypsin activity in vitro and in vivo. RSC Adv. 2021, 11, 2213–2220. [Google Scholar] [CrossRef]
- Rainio, M.; Lindström, O.; Penttilä, A.; Itkonen, O.; Kemppainen, E.; Stenman, U.H.; Kylänpää, L. Serum Serine Peptidase Inhibitor Kazal-Type 1, Trypsinogens 1 to 3, and Complex of Trypsin 2 and α1-Antitrypsin in the Diagnosis of Severe Acute Pancreatitis. Pancreas 2019, 48, 374–380. [Google Scholar] [CrossRef]
- Anuracpreeda, P.; Chawengkirtikul, R.; Tinikul, Y.; Poljaroen, J.; Chotwiwatthanakun, C.; Sobhon, P. Diagnosis of Fasciola gigantica infection using a monoclonal antibody-based sandwich ELISA for detection of circulating cathepsin B3 protease. Acta Trop. 2013, 127, 38–45. [Google Scholar] [CrossRef] [PubMed]
- See, W.A.; Smith, J.L. Urinary levels of activated trypsin in whole-organ pancreas transplant patients with duodenocystostomies. Transplantation 1991, 52, 630–633. [Google Scholar] [CrossRef] [PubMed]
- Schebb, N.H.; Vielhaber, T.; Jousset, A.; Karst, U. Development of a liquid chromatography-based screening methodology for proteolytic enzyme activity. J. Chromatogr. A 2009, 1216, 4407–4415. [Google Scholar] [CrossRef] [PubMed]
- Stoytcheva, M.; Zlatev, R.; Cosnier, S.; Arredondo, M. Square wave voltammetric determination of trypsin activity. Electrochim. Acta 2012, 76, 43–47. [Google Scholar] [CrossRef]
- Lou, X.; Zhang, L.; Qin, J.; Li, Z. Colorimetric sensing of alpha-amino acids and its application for the “label-free” detection of protease. Langmuir 2010, 26, 1566–1569. [Google Scholar] [CrossRef]
- Wang, G.L.; Jin, L.Y.; Dong, Y.M.; Wu, X.M.; Li, Z.J. Intrinsic enzyme mimicking activity of gold nanoclusters upon visible light triggering and its application for colorimetric trypsin detection. Biosens. Bioelectron. 2015, 64, 523–529. [Google Scholar] [CrossRef]
- Zhang, L.; Du, J. A sensitive and label-free trypsin colorimetric sensor with cytochrome c as a substrate. Biosens. Bioelectron. 2016, 79, 347–352. [Google Scholar] [CrossRef]
- Stoytcheva, M.; Zlatev, R.; Cosnier, S.; Arredondo, M.; Valdez, B. High sensitive trypsin activity evaluation applying a nanostructured QCM-sensor. Biosens. Bioelectron. 2013, 41, 862–866. [Google Scholar] [CrossRef]
- Wang, M.; Su, D.; Wang, G.; Su, X. A fluorometric sensing method for sensitive detection of trypsin and its inhibitor based on gold nanoclusters and gold nanoparticles. Anal. Bioanal. Chem. 2018, 410, 6891–6900. [Google Scholar] [CrossRef]
- Zhuo, C.X.; Wang, L.H.; Feng, J.J.; Zhang, Y.D. Label-Free Fluorescent Detection of Trypsin Activity Based on DNA-Stabilized Silver Nanocluster-Peptide Conjugates. Sensors 2016, 16, 1477. [Google Scholar] [CrossRef]
- Huang, S.; Li, F.; Liao, C.; Zheng, B.; Du, J.; Xiao, D. A selective and sensitive fluorescent probe for the determination of HSA and trypsin. Talanta 2017, 170, 562–568. [Google Scholar] [CrossRef] [PubMed]
- Amouzadeh Tabrizi, M.; Ferré-Borrull, J.; Marsal, L.F. Remote biosensor for the determination of trypsin by using nanoporous anodic alumina as a three-dimensional nanostructured material. Sci. Rep. 2020, 10, 2356. [Google Scholar] [CrossRef] [PubMed]
- Lin, Y.; Shen, R.; Liu, N.; Yi, H.; Dai, H.; Lin, J. A highly sensitive peptide-based biosensor using NiCo(2)O(4) nanosheets and g-C(3)N(4) nanocomposite to construct amplified strategy for trypsin detection. Anal. Chim. Acta 2018, 1035, 175–183. [Google Scholar] [CrossRef]
- Hu, Y.; He, Y.; Han, Y.; Ge, Y.; Song, G.; Zhou, J. Poly(styrene-4-sulfonate)-protected copper nanoclusters as a fluorometric probe for sequential detection of cytochrome c and trypsin. Mikrochim. Acta 2018, 185, 383. [Google Scholar] [CrossRef]
- Zhao, D.; Chen, C.; Zhao, J.; Sun, J.; Yang, X. Label-free fluorescence turn-on strategy for trypsin activity based on thiolate-protected gold nanoclusters with bovine serum albumin as the substrate. Sens. Actuators B Chem. 2017, 247, 392–399. [Google Scholar] [CrossRef]
- Wu, P.; Zhao, T.; Zhang, J.; Wu, L.; Hou, X. Analyte-activable probe for protease based on cytochrome C-capped Mn: ZnS quantum dots. Anal. Chem. 2014, 86, 10078–10083. [Google Scholar] [CrossRef] [PubMed]
- Eissa, S.; Siddiqua, A.; Chinnappan, R.; Zourob, M. Electrochemical SELEX Technique for the Selection of DNA Aptamers against the Small Molecule 11-Deoxycortisol. ACS Appl. Bio Mater. 2019, 2, 2624–2632. [Google Scholar] [CrossRef]
- Dai, S.; Wu, S.; Duan, N.; Chen, J.; Zheng, Z.; Wang, Z. An ultrasensitive aptasensor for Ochratoxin A using hexagonal core/shell upconversion nanoparticles as luminophores. Biosens. Bioelectron. 2017, 91, 538–544. [Google Scholar] [CrossRef]
- Abnous, K.; Danesh, N.M.; Alibolandi, M.; Ramezani, M.; Taghdisi, S.M. Amperometric aptasensor for ochratoxin A based on the use of a gold electrode modified with aptamer, complementary DNA, SWCNTs and the redox marker Methylene Blue. Microchim. Acta 2017, 184, 1151–1159. [Google Scholar] [CrossRef]
- Cetin, A.E.; Coskun, A.F.; Galarreta, B.C.; Huang, M.; Herman, D.; Ozcan, A.; Altug, H. Handheld high-throughput plasmonic biosensor using computational on-chip imaging. Light Sci. Appl. 2014, 3, e122. [Google Scholar] [CrossRef]
- Mascini, M.; Palchetti, I.; Tombelli, S. Nucleic acid and peptide aptamers: Fundamentals and bioanalytical aspects. Angew. Chem. Int. Ed. 2012, 51, 1316–1332. [Google Scholar] [CrossRef] [PubMed]
- Taghdisi, S.M.; Danesh, N.M.; Nameghi, M.A.; Ramezani, M.; Abnous, K. A label-free fluorescent aptasensor for selective and sensitive detection of streptomycin in milk and blood serum. Food Chem. 2016, 203, 145–149. [Google Scholar] [CrossRef] [PubMed]
- Roushani, M.; Shahdost-fard, F. A novel ultrasensitive aptasensor based on silver nanoparticles measured via enhanced voltammetric response of electrochemical reduction of riboflavin as redox probe for cocaine detection. Sens. Actuators B Chem. 2015, 207, 764–771. [Google Scholar] [CrossRef]
- Zheng, H.; Lang, Y.; Yu, J.; Han, Z.; Chen, B.; Wang, Y. Affinity binding of aptamers to agarose with DNA tetrahedron for removal of hepatitis B virus surface antigen. Colloids Surf. B Biointerfaces 2019, 178, 80–86. [Google Scholar] [CrossRef]
- Zhao, H.; Xiang, X.; Chen, M.; Ma, C. Aptamer-Based Fluorometric Ochratoxin A Assay Based on Photoinduced Electron Transfer. Toxins 2019, 11, 65. [Google Scholar] [CrossRef]
- Tang, X.; Wu, K.; Zhao, H.; Chen, M.; Ma, C. A Label-Free Fluorescent Assay for the Rapid and Sensitive Detection of Adenosine Deaminase Activity and Inhibition. Sensors 2018, 18, 2441. [Google Scholar] [CrossRef]
- Wang, J.; Liu, H.; Ma, C.; Wang, J.; Zhong, L.; Wu, K. Label-free monitoring of DNA polymerase activity based on a thrombin-binding aptamer G-quadruplex. Mol. Cell. Probes 2017, 32, 13–17. [Google Scholar] [CrossRef]
- Tuerk, C.; Gold, L. Systematic evolution of ligands by exponential enrichment: RNA ligands to bacteriophage T4 DNA polymerase. Science 1990, 249, 505–510. [Google Scholar] [CrossRef]
- Zaidi, S.; Hassan, M.I.; Islam, A.; Ahmad, F. The role of key residues in structure, function, and stability of cytochrome-c. Cell. Mol. Life Sci. 2014, 71, 229–255. [Google Scholar] [CrossRef]
- Ge, J.; Li, X.P.; Jiang, J.H.; Yu, R.Q. A highly sensitive label-free sensor for Mercury ion (Hg2+) by inhibiting thioflavin T as DNA G-quadruplexes fluorescent inducer. Talanta 2014, 122, 85–90. [Google Scholar] [CrossRef]
- Wu, K.; Ma, C.; Zhao, H.; He, H.; Chen, H. Label-Free G-Quadruplex Aptamer Fluorescence Assay for Ochratoxin A Using a Thioflavin T Probe. Toxins 2018, 10, 198. [Google Scholar] [CrossRef] [PubMed]
- Zhao, H.; Ma, C.; Chen, M. A novel fluorometric method for inorganic pyrophosphatase detection based on G-quadruplex-thioflavin T. Mol. Cell. Probes 2019, 43, 29–33. [Google Scholar] [CrossRef] [PubMed]
- Liu, X.; Hua, X.; Fan, Q.; Chao, J.; Su, S.; Huang, Y.Q.; Wang, L.; Huang, W. Thioflavin T as an Efficient G-Quadruplex Inducer for the Highly Sensitive Detection of Thrombin Using a New Föster Resonance Energy Transfer System. ACS Appl. Mater. Interfaces 2015, 7, 16458–16465. [Google Scholar] [CrossRef] [PubMed]
- Fang, C.; Yang, Y.; Zou, S.; Ouyang, P.; Qing, Y.; Han, J.; Li, H.; Wang, Z.; Du, J. Signal-On Fluorescence Biosensor for Highly Sensitive Detection of miRNA-21 Based on DNAzyme Assisted Double-Hairpin Molecular Beacon. Biosensors 2022, 12, 276. [Google Scholar] [CrossRef] [PubMed]
- Gao, J.; Liu, Q.; Liu, W.; Jin, Y.; Li, B. Comparative evaluation and design of a G-triplex/thioflavin T-based molecular beacon. Analyst 2021, 146, 2567–2573. [Google Scholar] [CrossRef] [PubMed]
- Jiang, H.; Guo, Q.; Zhang, C.; Sun, Z.; Weng, X. Microfluidic origami nano-aptasensor for peanut allergen Ara h1 detection. Food Chem. 2021, 365, 130511. [Google Scholar] [CrossRef]
- Jiang, J.; Cai, Q.; Deng, M. Construction of Electrochemical Aptamer Sensor Based on Pt-Coordinated Titanium-Based Porphyrin MOF for Thrombin Detection. Front Chem. 2021, 9, 812983. [Google Scholar] [CrossRef]
- Hong, M.-L.; Li, L.-J.; Han, H.-X.; Chu, X. A Label-free Fluorescence Assay for Trypsin Based on the Electron Transfer between Oligonucleotide-stabilized Ag Nanoclusters and Cytochrome c. Anal. Sci. 2014, 30, 811–815. [Google Scholar] [CrossRef]
- Li, H.; Yang, M.; Kong, D.; Jin, R.; Zhao, X.; Liu, F.; Yan, X.; Lin, Y.; Lu, G. Sensitive fluorescence sensor for point-of-care detection of trypsin using glutathione-stabilized gold nanoclusters. Sens. Actuators B Chem. 2019, 282, 366–372. [Google Scholar] [CrossRef]
- Zhu, Q.; Zhan, R.; Liu, B. Homogeneous Detection of Trypsin in Protein Mixtures Based on Fluorescence Resonance Energy Transfer between Anionic Conjugated Polymer and Fluorescent Probe. Macromol. Rapid Commun. 2010, 31, 1060–1064. [Google Scholar] [CrossRef]
- Poon, C.-Y.; Li, Q.; Zhang, J.; Li, Z.; Dong, C.; Lee, A.W.-M.; Chan, W.-H.; Li, H.-W. FRET-based modified graphene quantum dots for direct trypsin quantification in urine. Anal. Chim. Acta 2016, 917, 64–70. [Google Scholar] [CrossRef] [PubMed]
- Chen, T.; Tian, X.; Liu, C.; Ge, J.; Chu, X.; Li, Y.-F. Fluorescence activation imaging of cytochrome c released from mitochondria using aptameric nanosensor. J. Am. Chem. Soc. 2015, 137, 982–989. [Google Scholar] [CrossRef] [PubMed]
Publisher’s Note: MDPI stays neutral with regard to jurisdictional claims in published maps and institutional affiliations. |
© 2022 by the authors. Licensee MDPI, Basel, Switzerland. This article is an open access article distributed under the terms and conditions of the Creative Commons Attribution (CC BY) license (https://creativecommons.org/licenses/by/4.0/).