Abstract
Lipid components in green coffee were clarified to provide essential data support for green coffee processing. The types, components, and relative contents of lipids in green coffee were first analyzed by ultra-performance liquid chromatography–time-of-flight tandem mass spectrometry (UPLC-TOF-MS/MS). The results showed that the main fatty acids in green coffee were linoleic acid (43.39%), palmitic acid (36.57%), oleic acid (8.22%), and stearic acid (7.37%). Proportionally, the ratio of saturated fatty acids/unsaturated fatty acids/polyunsaturated fatty acids was close to 5.5:1:5.2. A total of 214 lipids were identified, including 15 sterols, 39 sphingosines, 12 free fatty acids, 127 glycerides, and 21 phospholipids. The main components of sterols, sphingosines, free fatty acids, glycerides, and phospholipids were acylhexosyl sitosterol, ceramide esterified omega-hydroxy fatty acid sphingosine, linoleic acid, and triglyceride, respectively. UPLC-TOF-MS/MS furnished high-quality and accurate information on TOF MS and TOF MS/MS spectra, providing a reliable analytical technology platform for analyzing lipid components in green coffee.
1. Introduction
Coffee, mainly composed of protein, fat, total sugar, crude fiber, water, caffeine, water leachate, and free amino acids, is a genus of coffee in the Rubiaceae family. Taking Yunnan coffee as an example, the protein content is 14.0–17.7%, caffeine 1.02–1.33%, hydrolysable sugar 9.4–11.4%, acid lytic sugars 31.4–40.4%, crude fiber 21.50–28.74%, free amino acids 0.7–1.2%, and fat 4.7–7.1% [1]. Functional components in green coffee, mainly composed of alkaloids, phenolic acids, flavonoids, and terpenoids, play an important role in contributing to biological functions such as lowering blood sugar and protecting the liver and nerves [2].
Researchers have focused on coffee pretreatment processes, roasting methods, and coffee types [3,4,5,6,7]. For example, Yu et al. [8] used headspace solid-phase microextraction (HS-SPME) coupled with gas chromatography–mass spectrometry (GC-MS) to identify 82, 72, and 76 volatile organic compounds (VOCs) from green coffee roasted at three roasting speeds (namely, fast roast, medium roast, and slow roast), respectively, and the different roasting speeds affected the types and contents of VOCs. Juerg et al. [9] investigated the effect of roasting temperature and time on VOCs in green coffee. They found significant differences in aroma kinetic properties between high- and low-temperature conditions, and the concentration of compounds such as pyridine and dimethyl trisulfide in the aroma declined sharply. Some compounds increased when the temperature exceeded a certain level.
The coffee flavor was used as a critical indicator to assess coffee quality [10], and the results showed that fat in green coffee played a crucial role in flavor [11]. However, there have been few studies on the lipid analysis of coffee oil. Lipids play an essential physiological function in plant and animal growth and are closely related to human metabolism. However, there was a diversity of lipid structures, with over 40,000 lipids in the existing LIPIDMAPS lipid database and a narrow mass distribution range (0–1000 Da) [12], which posed a great difficulty for our analytical work. With the development of analytical techniques such as ultra-performance liquid chromatography–mass spectrometry (UPLC-MS), the analyses of lipids in Prinsepia utilis Royle oil and other samples have significantly developed. Among them, ultra-performance liquid chromatography–time-of-flight tandem mass spectrometry (UPLC-TOF-MS/MS) has been used to detect lipid components in samples because of its high detection sensitivity, short analysis time, simple pretreatment, and separation of lipid components at the mass spectrometry ion source. Xie et al. [13] performed qualitative and quantitative analysis of twenty triglyceride (TAG) molecules in cold-pressed rapeseed oil obtained before and after microwave pretreatment using direct injection multiplexed neutral loss scanning tandem mass spectrometry, and the results showed that the method could be applied to the detection of large sample volumes. This study aimed to establish a lipid analysis method based on high-performance liquid chromatography–time-of-flight tandem mass spectrometry (UPLC-TOF-MS/MS) and apply it to the analysis of lipids in green coffee and provide basic data for the development and utilization of green coffee. Meanwhile, profiling the microscopic lipid composition in green coffee helped reveal its functional mechanism.
2. Results and Discussion
2.1. Analysis of Fatty Acid Composition in Green Coffee
The relative percentages were calculated according to the chromatographic peak area normalization method concerning the time characterization of each fatty acid standard. The content of green coffee was 111.48 ± 3.56 mg/g, and its fatty acid composition and relative percentages were palmitic acid (C16:0) 36.57%, stearic acid (C18:0) 7.37%, oleic acid (C18:1n9c) 8.22%, linoleic acid (C18:2n6c) 43.39%, linolenic acid (C18:3n3) 1.13%, arachidic acid (C20:0) 2.56%, gadoleic acid (C20:1) 0.26%, behenic acid (C22:1) 0.26%, and behenic acid (C22:0) 0.50%. The fatty acids of green coffee were mainly composed of palmitic and linoleic acids, both of which were above 35%, followed by oleic and stearic acids. Koshima et al. [14] determined the fatty acid composition in green coffee oil using gas chromatography, and the results were consistent with the present experiment, except for with behenic acid. In addition, the variability in the types of coffee led to differences in the fatty acid types and contents in the results of this study and the analysis of Hong et al. [15].
According to their saturation, fatty acids are divided into saturated fatty acids (SFAs), monounsaturated fatty acids (MUFAs), and polyunsaturated fatty acids (PUFAs), which have different nutritional values. Green coffee contained 47% saturated fatty acids and 53% unsaturated fatty acids, of which 8.48% were monounsaturated fatty acids and 44.52% were polyunsaturated fatty acids, and the ratio of fatty acid composition (SFA/MUFA/PUFA) was approximately 5.5:1:5.2.
2.2. Identification of Lipids
In lipid molecules in mass spectrometry, relatively weak chemical bonds in the molecule are broken due to ionization, forming specific product ions or neutral lost fragment ions. This study identified sterols, sphingosines, glycerolipids, phospholipids, and fatty acids in green coffee from the perspective of mass spectrometry cleavage patterns. The fatty acids were identified as ASG (acylhexose glutathione) 29:1; O; Hex; FA 16:0 in acylhexosyl sitosterol (AHexSIS), ceramide esterified omega-hydroxy fatty acid-sphingosine (Cer_EOS) in Cer 60:12, and diacylglycerol (DG) in DG 34:2 |DG 16:0_18:2 as examples to analyze their mass spectrometric behaviors and fracture mechanisms in detail.
The molecular species of the compounds were identified by retention time, isotope distribution, MS mass-to-charge ratio, and MS/MS secondary mass spectrometry pattern in positive and negative ion modes. ASG had an excellent mass spectrometric response in both positive and negative ion modes. In positive ion mode, specific diagnostic fragment ions could be generated to identify its sterol lipid molecular species. In negative ion mode, fatty acid acyl chain composition could be identified by forming free state fatty acid fragment ions through ester bond breakage.
Figure 1A represents the MS/MS spectrum of ASG 29:1 Hex; FA 16:0 in positive ion mode; m/z 832.6495 was the precursor ion [M+NH4]+, and m/z 397.3795 was the diagnostic fragment ion of the acyl hexose glutamate ST 29:1+ [C29H49]+ sterol ester. Figure 1B displays the MS/MS mass spectra of ASG 29:1 Hex; FA 16:0 in the negative ion mode, where m/z 873.6855 was the precursor ion [M+CH3COO]+, and m/z 255.2280 was the characteristic fragment ion [FA 16:0-H]−. Since it was an ion formed by the loss of an H in the negative ion mode of the fatty acid formed in the free state after the ester bond was broken, it could be inferred that the fatty acid chain of this compound was Hex; FA 16:0. Figure 1C shows the MS/MS spectrum of DG 34:2 (16:0_18:2) in positive ion mode. From the figure, m/z 610.5323 could be tentatively determined as [M+NH4]+ of DG34:2, m/z 575.5026 represented [M+NH4-NH3-H2O]+, which was the fragment ion formed after the precursor ion [M+NH4]+ lost NH3 and H2O, and m/z 313.2735 and m/z 337.2728 represented [M+NH4-NH3-FA18:2]+ and [M+NH4-NH3-FA16:0]+, respectively, both of which were diagnostic fragment ions for fatty acid acyl chain characteristics. The monoglyceride sheet ions 16:0 DMAG+ and 18:2 DMAG+ formed after the loss of one fatty acid FA18:2 and FA16:0 from the precursor ion m/z 610.5323, respectively. Both di- and triglycerides were nonpolar lipids, forming ammonium addition ions [M+NH4]+ only in the positive ion mode, with no display in the negative ion mode, and the characteristic fragments were monoglyceride fragments and diglyceride fragments formed after the loss of one fatty acid, respectively. Figure 1D shows the MS/MS spectra of Cer 60:12;4O|Cer 42:9;3° (FA 18:2) in negative ion mode. m/z 910.7186 was the precursor ion [M-H]− of Cer 60:12;4°, m/z 648.4904 was the fragment ion after the neutral loss of FA 18:2 of the precursor ion, and m/z 279.2293 was the characteristic fragment ion [FA 18:2-H]−.
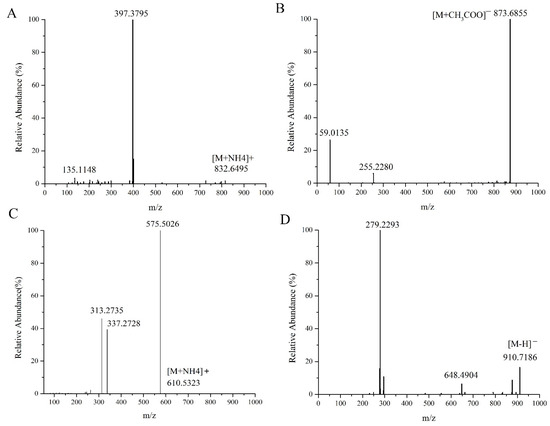
Figure 1.
MS/MS spectra of ASG 29:1; O;Hex;FA 16:0 (A), DG 34:2 |DG 16:0_18:2 (C) in the positive ion mode and ASG 29:1;O;Hex;FA 16:0 (B), Cer 60:12 (D) in the negative ion mode.
2.3. Analysis of Lipid Composition in Green Coffee
UPLC-TOF-MS/MS analyzed the lipids in green coffee, and information on the precise relative molecular masses, isotopic distribution, and secondary mass spectrometry cleavage fragments of the lipids were obtained in compound scanning mode. As shown in Figure 2, a total of 214 lipids were identified in green coffee, including fifteen sterols, thirty-nine sphingomyelins, twelve free fatty acids, 127 glycerides, and twenty-one phospholipids. The above fifteen sterols mainly included four types of acylhexosyl campesterol (AHexCAS), five acylhexosyl sitosterols (AHexSIS), three acylhexosyl stigmasterols (AHexSTS), and three stigmasterol hexosides (SHex). The thirty-nine sphingosine species included seven types of ceramide alpha-hydroxy fatty acid phytosphingosine (Cer_AP), twenty-one types of ceramide esterified omega-hydroxy fatty acid dihydrosphingosine (Cer_EOS), one ceramide esterified omega-hydroxy fatty acid dihydrosphingosine (Cer_EODS), four ceramide nonhydroxy fatty acid phytosphingosine (Cer_NP), and six Hexosylceramide alpha-hydroxy fatty acid phytosphingosine (HexCer_AP). The twenty-one phospholipids included five types of phosphatidylcholine (PC), seven phosphatidylethanolamines (PE), one phosphatidylglycerol (PG), and eight phosphatidylinositols (PI). The 127 glycerol esters included twenty-four types of diacylglycerol (DG), three ether-linked triacylglycerols (EtherTG), three oxidized triglycerides (OxTG), one phosphatidylethanolamine (PE), one phosphatidylglycerol (PG), eight phosphatidylinositols (PI), twenty-five triglycerides (OxTG), seventy-one triglycerides (TG), and four monoacylglycerols (MG).

Figure 2.
Lipid species in green coffee.
As shown in Table 1, the total number of carbon atoms in the fatty acid side chains of lipids in green coffee was 28–64, and the double bond number was 0–13. Most lipids contained at least one fatty acid side chain with a carbon number of 18 and a double bond number of 0–3. Among the sphingomyelinols, Cer_EOS had the highest number of double bonds. The number of carbon atoms of AHexCAS in sterols was 28, and the double bond number was one. The number of carbon atoms of AHexSTS and AHexSIS was 29, and the number of double bonds was one and two, respectively. The number of carbon atoms of Cer_EOS in sphingosine was 54–64, and the number of double bonds was 7–13. The number of carbon atoms of Cer_NP was 34–44, and the double bond number was 0–1. The number of carbon atoms of HexCer_AP was 36–44, and the number of double bonds was one. FA had a carbon atom number of 14–24 and a double bond number of 0–3. The number of carbon atoms of PC in phospholipids was 28, and the double bond number was 1–4. PE had a carbon atom number of 32–38 and a double bond number of 0–4. PG had a carbon atom number of 36 and a double bond number of zero. PI had a carbon atom number of 32–40 and a double bond number of 0–4. The number of carbon atoms of DG in glycerolipids was 32–4, and the number of double bonds was 0–5. EtherTG had a carbon atom number of 53–59 and a double bond number of 2–5. OxTG had a carbon atom number of 50–58 and a double bond number of 1–8. TG had a carbon atom number of 48–62 and a double bond number of 0–7. MG had a carbon atom number of 16–20 and a double bond number of 0–1.

Table 1.
Composition of the 214 lipids in green coffee.
2.4. Lipids’ Content in Green Coffee
Since the mass spectra of lipids of the same class under the same detection conditions should be similar and comparable, the peak areas of the extracted ion chromatographic peaks from the primary mass spectra in green coffee were used in this experiment for the quantitative calculation of similar lipids, as shown in Figure 3.

Figure 3.
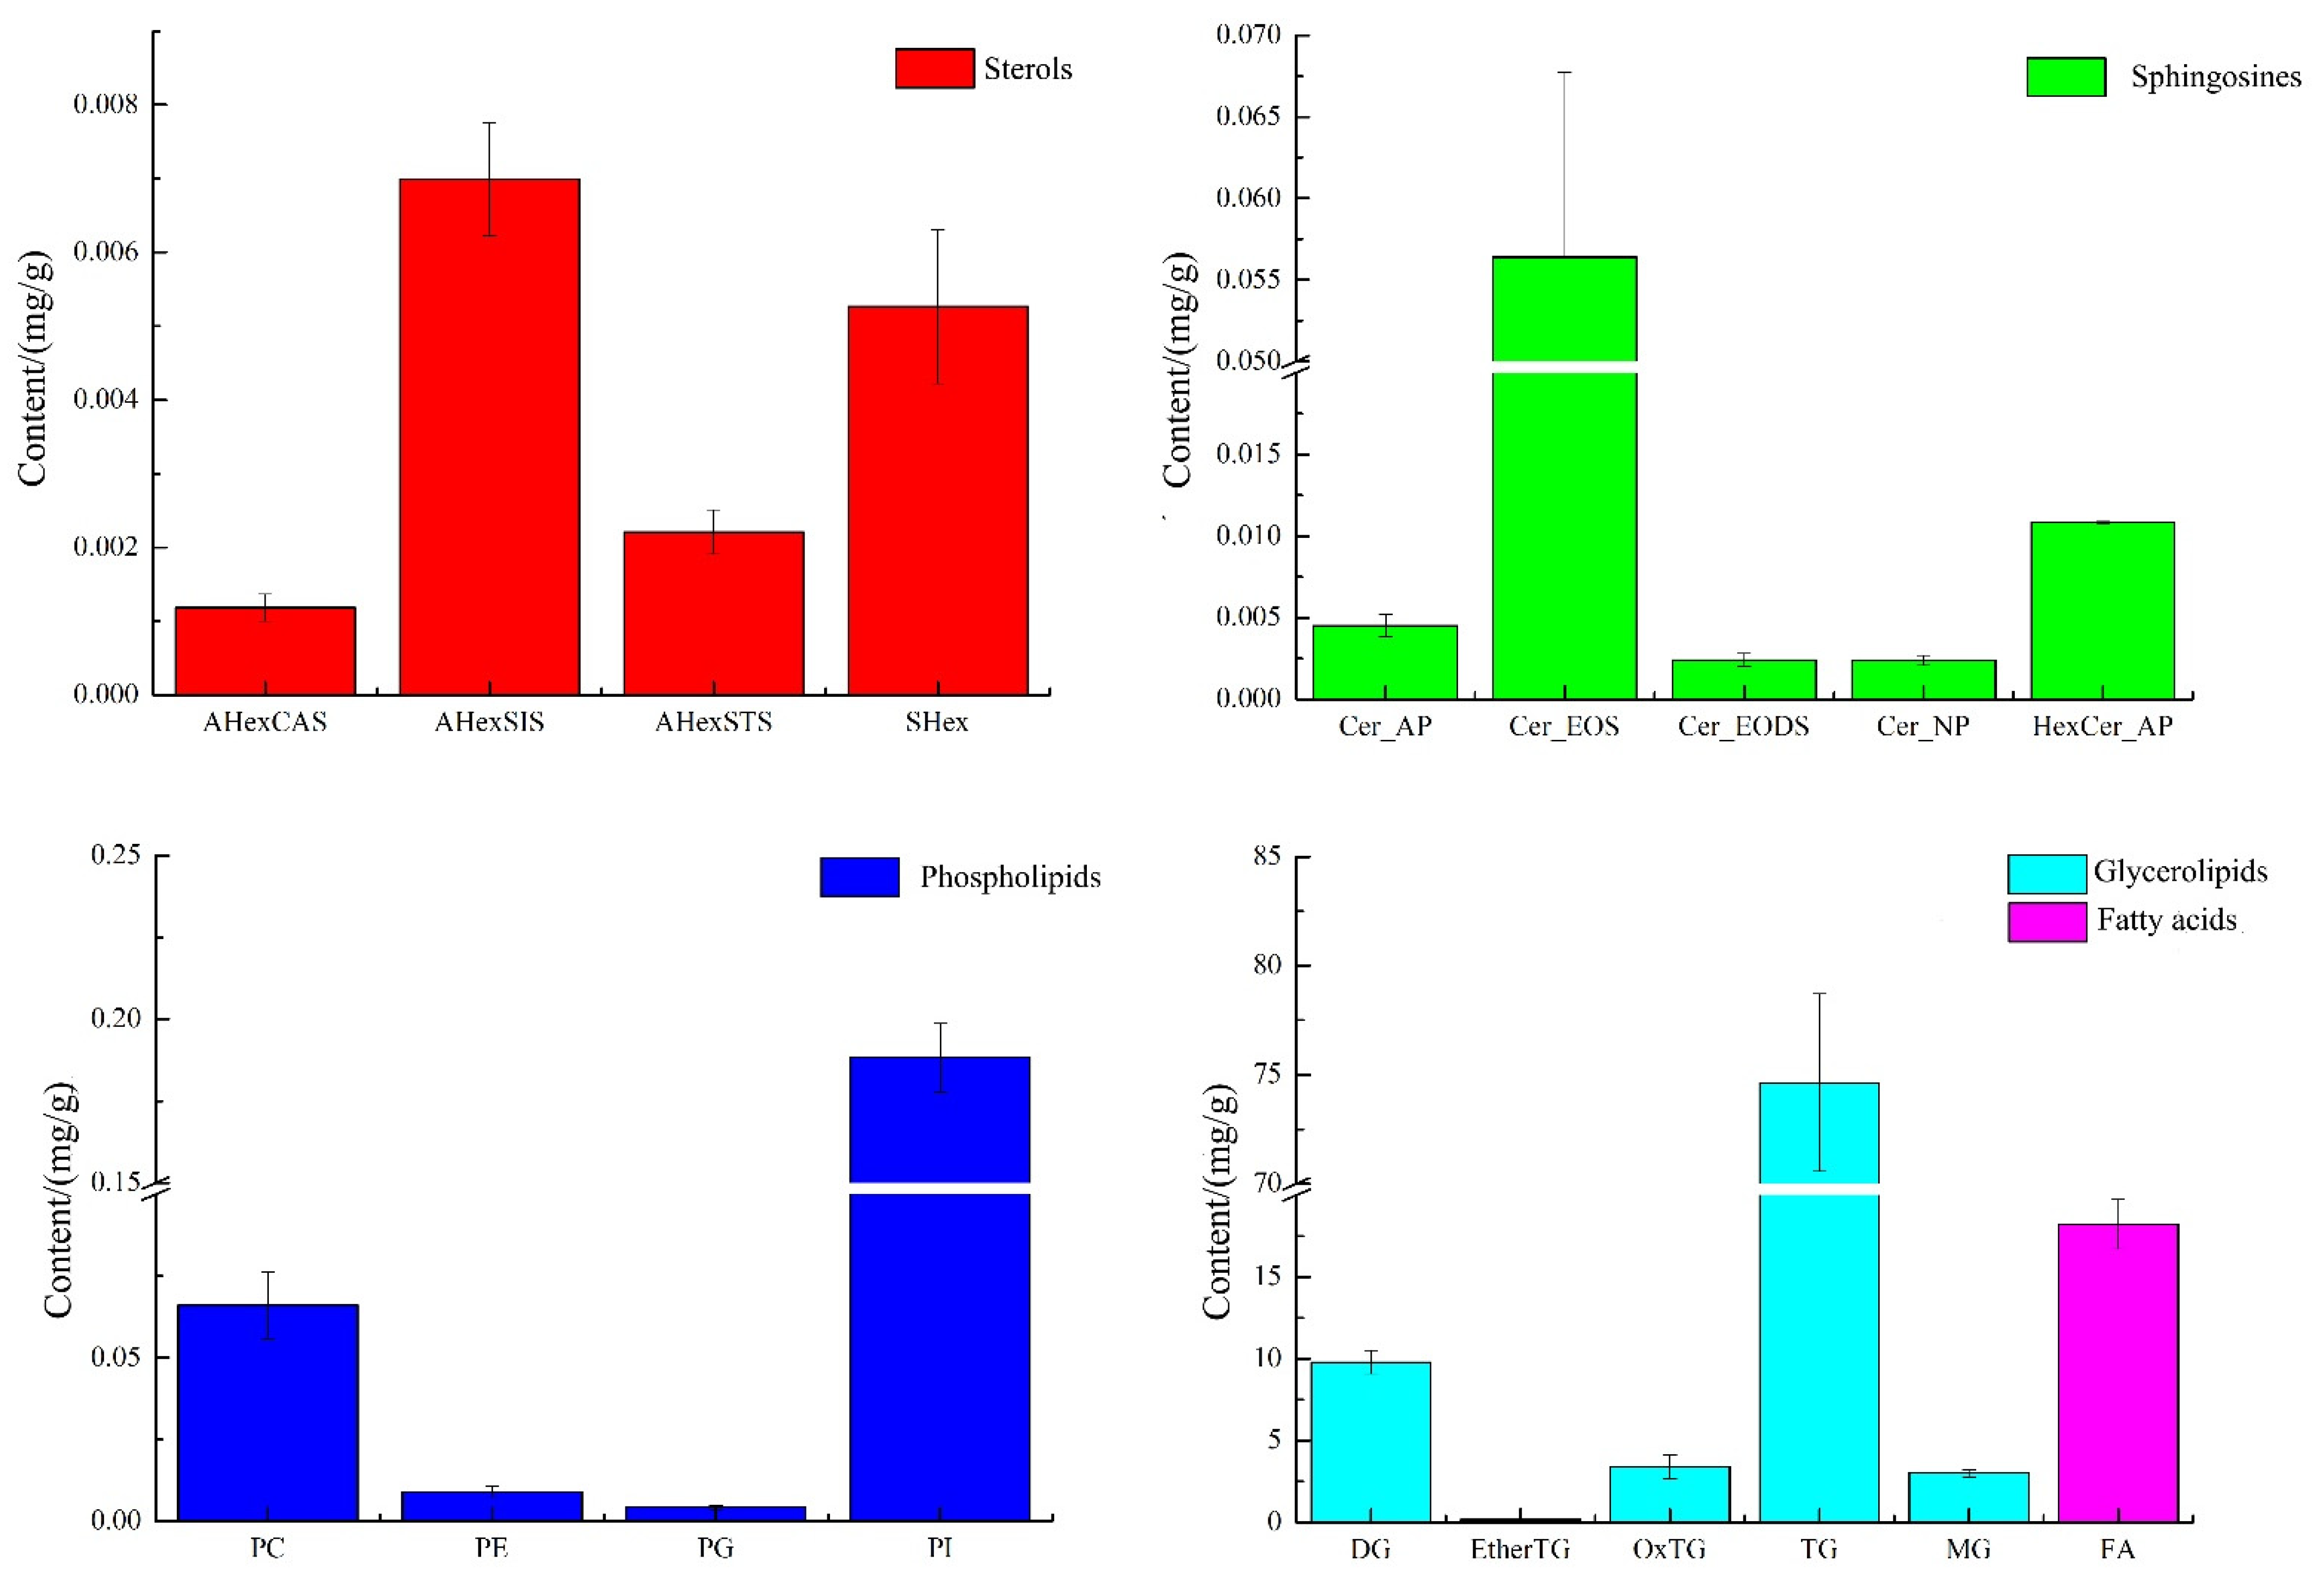
The composition of sterols, sphingosine, phospholipids, glycerides, and fatty acids in green coffee.
As shown in Figure 3, green coffee was mainly dominated by glycerides and fatty acids, 90.96 mg/g and 18.23 mg/g, respectively, followed by phospholipids 0.27 mg/g, sphingomyelin 0.076 mg/g, and sterols 0.016 mg/g, of which phospholipids were mainly PI and PC, with 0.188 mg/g and 0.066 mg/g, accounting for 70.38% and 24.70% of the total phospholipids, respectively. The sterols were mainly AHexSIS and SHex, with 0.007 mg/g and 0.005 mg/g, accounting for 44.68% and 33.64% of the total sterols, respectively. The sphingosine was mainly Cer_EOS at 0.056 mg/g, accounting for 73.69% of the total sphingosine. The glycerol esters were mainly TG with 74.632 mg/g, accounting for 82.04% of the total glycerol esters. Dietary triglycerides are the main component of vegetable oils, and their main functions are to supply and store energy, fix and protect internal organs, participate in the energy supply in several aspects of maternal and intrauterine fetal growth and development during pregnancy, and play a key role in lipid metabolism [16,17]. In addition to being absorbed by the body, gut microbes may also act upon dietary phospholipids to produce various phospholipids and choline. When the acetylcholine content in the brain increases, the speed of information transfer between nerve cells in the brain is accelerated and memory function is enhanced. In addition, intervention with phospholipid nutrients could improve the composition of arterial blood vessels, maintain esterase activity, improve the metabolism of lipids in the body, emulsify neutral esters and cholesterol deposited in the walls of blood vessels, promote the absorption of fats and fat-soluble vitamins, and improve intelligence and cellular activity [18,19], so green coffee is very rich in phospholipids and triglycerides and has a critical exploitation value.
Additionally, lipid composition and content vary significantly with raw materials, extraction processes, and other factors. Differential metabolites based on lipids can provide data support for food traceability [20,21], quality control during food processing, storage [22], etc. Wang et al. [23] used the phospholipid profiles of fish muscle to reveal the phospholipid oxidation and hydrolysis. Therefore, fish phospholipid molecules can be used as indicators of fish muscle freshness. Gao [24] used the UHPLC-MS method to screen 27 lipid molecules that could be used as biomarkers for identifying bacilli and fermented milk, providing a database for analyzing the effect of hot processing treatment on yogurt and fermented milk lipid quality. Liu et al. [25] demonstrated the efficiency of lipidomic analysis in identifying the geographic region and secretion period of goat milk in China. Similarly, this study’s results are instrumental in providing data support for the later identification of coffee species and the determination of used treatment processes.
3. Materials and Methods
3.1. Materials
Green coffee was provided by the Yunnan International Coffee Trading Center, made by wet processing technology, and originated from the variety of Catimor, which belongs to the Arabica coffee family. Triglyceride deuterium TAG 48:1 (15:0/18:1(D7)/15:0) and carbon XVII fatty acid methyl ester standard (internal standard) were purchased from Avanti Polar Lipids, pure chromatographic methanol, ammonia, chloroform, and hexane were purchased from Fisher, and chromatographic pure 10% ammonia was purchased from Shanghai Ampoule Experimental Technology Co. Ltd. (Shanghai, China). Chromatographic purity: dichloromethane for chromatographic purity was purchased from Sinopharm Chemical Reagent Co (Shanghai, China).
3.2. Methods
3.2.1. Determination of Fatty Acid Composition by Gas Chromatography
The method was performed according to Wei et al. [26,27] with some modification of the parameters. Then, 1–2 mg of green coffee powder was added to the headspace vial, and 50 μL of 5 mg/mL of the internal standard carbon XVII fatty acid methyl ester, 2 mL of 5% concentrated sulfuric acid methanol solution, and 300 μL of toluene were pipetted sequentially. The headspace vial with an aluminum cap with a Teflon pad was sealed with a crimper, mixed with slight shaking, and extracted in a water bath at 95 °C for 1.5 h. At the end of extraction, the mixture was cooled to room temperature, 2 mL of 0.9% NaCl solution was added, mixed well, 1 mL of hexane was added for extraction, and the supernatant was centrifuged at 5000 rpm for 5 min in the supernatant bottle.
The GC-MS analytical conditions were equipped with a hydrogen flame ionization detector and DB-Fast FAME column (7890A gas chromatograph tandem hydrogen flame ionization detector, Agilent, Santa Clara, CA, USA). A total of 1.0 μL of the sample was driven through the column under nitrogen gas with an inlet temperature of 250 °C and a splitting ratio of 20:1, in which the initial temperature of the column was 80 °C for 5 min, 165 °C with a 40 °C/min for 1 min, 230 °C with a 4 °C/min for 6 min, and the detector temperature was 260 °C.
3.2.2. Determination of Lipid Composition Using UPLC-TOF-MS/MS
The method was performed according to Xie et al. [28], with some modification of the parameters. Weigh approximately 20 mg of green coffee powder into a 10 mL tube, add 10 μL of 10 μg/mL of triglyceride deuterium internal standard and 2 mL of methanol, precipitate the protein overnight at −20 °C, add 2 mL of dichloromethane, vortex at 2000 rpm for 60 min and then add 2 mL of dichloromethane and 1.6 mL of ultrapure water, vortex and centrifuge, extract the lower clear, and add 4 mL of dichloromethane to extract the lower clear. The extraction was repeated twice, while the lower clear solution was collected three times. The supernatant was transferred into a 10 mL tube, blown dry with nitrogen, and then redissolved with 200 µL of dichloromethane/methanol (1:1, v/v), and the resulting solution was passed through a 0.22 μm organic filter membrane in the injection bottle for detection.
UPLC–mass spectrometry conditions of the chromatographic system: The analytical instrument was a Shimadzu UPLC LC-30A system (LC-30A liquid chromatograph, Shimadzu Corporation, Tokyo, Japan) equipped with a Phenomenex Kinete C18 column (100 × 2.1 mm, 2.6 µm). One microliter of the sample was pumped onto the column at a rate of 0.4 mL/min. The column temperature was 60 °C, and the sample chamber temperature was 4 °C. Gradient elution was performed using phase A (H2O:MeOH:ACN = 1:1:1, containing 5 mM NH4Ac) and phase B (isopropanol/acetonitrile = 5:1, containing 5 mM NH4Ac) with elution conditions of 20% B for 0.5 min, 40% B for 1.5 min, 60% B for 3 min, 98% B for 13 min, 20% B for 13 min, and 20% B for 17 min. In addition, the mass spectrometry system (Q-TOF-6600 Mass Spectrometer, AB Sciex, Concord, Ontario, Canada) was an AB Sciex TripleTOF® 6600 coupled with an ESI source in positive and negative modes. The mass number collected by mass spectrometry ranged from m/z 100 to 1200, the ion spray voltage was 5500.00 V(+)/−4500 V(−), and the temperature was 600 °C.
3.3. Data Processing
Freely available MSDIAL, version 4.00 (http://prime.psc.riken.jp/Metabolomics_Software/MS-DIAL/index2.html, accessed on 5 November 2021), and commercially available software packages, Peak View, Master View, and Multiquanta (SCIEX, Washington, DC, USA), were used for lipid profiling. For lipid identification, the MS/MS spectrum of each feature was matched by MS-DIAL software with an integrated LipidBlast database [18]. Qualitative analysis of shotgun-MS data was performed using Lipid View software (v2.0, ABSciex, Concord, Ontario, Canada). Software parameter settings: Mass Tolerance = 0.5, Min % Intensity = 1, Minimum S/N = 10, Flow Injection Average Spectrum from Top = 30% TIC, Total Double Bonds ≤12.
3.4. Statistical Analysis
All data in this study were repeatedly measured three times, and data were analyzed statistically and significantly using IBM SPSS Statics analysis software and plotted using Origin Pro 2021.
4. Conclusions
In this study, 214 lipids were isolated and identified from green coffee by UPLC-TOF MS for the first time. The lipid content of green coffee lipids was 111.48 mg/g. The lipid components mainly consisted of sterols, sphingomyelin, free fatty acids, glycerides, and phospholipids at 0.016 mg/g, 0.076 mg/g, 18.23 mg/g, 90.96 mg/g, and 0.27 mg/g, respectively. The method combined high sensitivity, scanning speed, accuracy, and reproducibility. It processed the TOF MS/MS spectral information with high accuracy, providing a reliable analytical platform for the analysis of the lipid components of green coffee.
Author Contributions
Conceptualization, Y.L. (Yijun Liu) and Y.L. (Yimin Li); software, X.F.; validation, L.L. and M.C.; formal analysis, Y.C.; data curation, Y.C. and Y.L. (Yijun Liu); writing—original draft preparation, Y.L. (Yijun Liu) and Y.L. (Yimin Li); writing—review and editing, M.C. and L.L.; funding acquisition, M.C. and L.L. All authors have read and agreed to the published version of the manuscript.
Funding
This research was funded by [the Natural Science Foundation of the Hainan Province of China] grant number [320QN326], [the Guangdong Province Special Fund for Promoting High-Quality Economic Development] grant number [2110024000461], [the National and Industry Standard Formulation and Revision Project] grant number [NY/Y 604-2020].
Institutional Review Board Statement
Not applicable.
Informed Consent Statement
Not applicable.
Data Availability Statement
The data presented in this study are available on request from the corresponding author.
Conflicts of Interest
The authors declare no conflict of interest. The founding sponsors had no role in the study’s design, in the collection, analyses, or interpretation of data, in the writing of the manuscript, and in the decision to publish the results.
Sample Availability
Samples of the compounds are not available from the authors.
References
- Zheng, H.F.; Chen, N.P.; Zhou, J.; Qi, Z.Y.; Lu, Y. Investigation and detection of main components of green coffee beans in Yunnan Province. China Food Saf. Mag. 2019, 14, 76–80. [Google Scholar] [CrossRef]
- Shen, X.J.; Zi, C.T.; Hui, S.L.; Yang, J.T.; Wang, Q.; Cao, M.T.; Fang, J.P. Advances on chemical components and biological activities of coffee. J. Trop. Subtrop. Bot. 2021, 29, 112–122. [Google Scholar] [CrossRef]
- Bhumiratana, N.; Adhikari, K.; Chambers, E. Evolution of sensory aroma attributes from coffee beans to brewed coffee. LWT–Food Sci. Technol. 2011, 44, 2185–2192. [Google Scholar] [CrossRef]
- Dong, W.J.; Hu, R.S.; Zong, Y.; Long, Y.Z.; Zhao, J.P. Application of HS-SPME/GC-MS in volatile components analysis of green coffee from major production areas in Yunnan Province. J. Agric. 2018, 8, 71–79. [Google Scholar] [CrossRef]
- Chen, Y.L.; Chen, Z.H.; Jiang, K.L.; Dao, B.; Li, X.L. Influence of different primary processes on the quality of arabica coffee in Yunnan Province. Mod. Food Sci. Technol. 2019, 35, 149–156. [Google Scholar] [CrossRef]
- Cheong, M.W.; Tong, K.H.; Ong, J.J.M.; Liu, S.Q.; Curran, P.; Yu, B. Volatile composition and antioxidant capacity of Arabica coffee. Food Res. Int. 2013, 51, 388–396. [Google Scholar] [CrossRef]
- Dong, W.J.; Hu, R.S.; Long, Y.Z.; Li, H.H.; Zhang, Y.J.; Zhu, K.X.; Chu, Z. Comparative evaluation of the volatile profiles and taste properties of roasted coffee beans as affected by drying method and detected by electronic nose, electronic tongue, and HS-SPME-GC-MS. Food Chem. 2019, 272, 723–731. [Google Scholar] [CrossRef]
- Yu, F.; Dong, W.J.; Hu, R.S.; Long, Y.Z.; Chen, Z.H.; Jiang, K.L. Effects of roasting speed on the volatile components of Xinglong Coffee Beans. Chin. J. Trop. Crops 2021, 42, 3316–3326. [Google Scholar] [CrossRef]
- Juerg, B.; Luigi, P.; Ruth, K.; Rainer, P.; Felix, E. Coffee roasting and aroma formation: Application of different time-temperature conditions. J. Agric. Food Chem. 2008, 56, 5836–5846. [Google Scholar] [CrossRef]
- Claudia, G.V.; Eden, T.; Sigfredo, F. Integrating a Low-Cost electronic nose and machine learning modeling to assess coffee aroma profile and intensity. Sensors 2021, 21, 2016. [Google Scholar] [CrossRef]
- Panagiota, Z.; Fotini, P.; Anthia, M.; EvdoxiaMaria, V.; Georgios, B.; Adamantini, P. Single-origin coffee aroma: From optimized flavor protocols and coffee customization to instrumental volatile characterization and chemometrics. Molecules 2021, 26, 4609. [Google Scholar] [CrossRef]
- Wu, B.F.; Wei, F.; Xie, Y.; Xu, S.L.; Lv, X.; Chen, H. Ion mobility mass spectrometry and its applications in lipids analysis. J. Instrum. Anal. 2018, 37, 1388–1395. [Google Scholar] [CrossRef]
- Xie, Y.; Wei, F.; Lv, X.; Dong, X.Y.; Chen, H. Analysis of triacylglycerols in cold-pressed rapeseed oil by shotgun electrospray ionization tandem mass spectrometry. J. Chin. Inst. Food Sci. Technol. 2018, 18, 292–300. [Google Scholar] [CrossRef]
- Koshima, Y.; Kitamura, Y.; Islam, M.Z.; Kokawa, M. Quantitative and qualitative evaluation of fatty acids in coffee oil and coffee residue: Notes. Food Sci. Technol. Res. 2020, 26, 545–552. [Google Scholar] [CrossRef]
- Hong, Q.D.; Dong, W.J.; Mei, L.B.; Long, Y.Z.; Hu, R.S.; Chu, Z.; Wang, H.R. Exploration of the accelerated oxidation process and change rule of bioactive components from green coffee based on thermal in-duction. Chin. J. Trop. Crops 2021, 42, 3327–3338. [Google Scholar] [CrossRef]
- Tang, C.H.; Xu, J.X.; Peng, Z.Y. The latest research on nutrition and function of fatty acids. China Oils Fats 2000, 06, 20–23. [Google Scholar] [CrossRef]
- Liu, Q.Y.; Xin, J.Y.; Lu, X.C.; Xiao, J.H.; Xia, C.G. Research progress on glyceryls ferulate. J. Chin. Cereals Oils Assoc. 2021, 36, 194–202. [Google Scholar] [CrossRef]
- Luo, X.; Sun, W.C.; Luo, Y.H. Research progress in detection and function of sphingomyelin in food. Food Res. Dev. 2020, 41, 211–218. [Google Scholar] [CrossRef]
- Rang, S.; Zhu, Y.F.; Xu, S.L.; Chen, X.F.; Xie, Y.; Lv, X.; Xiang, J.Q.; Wei, F.; Chen, H. Progress on structure, dietary source and nutrition of phospholipid. China Oils Fats 2022, 47, 68–74. [Google Scholar] [CrossRef]
- Mi, S.; Shang, K.; Li, X.; Zhang, C.H.; Liu, J.Q.; Huang, D.Q. Characterization and discrimination of selected China’s domestic pork using an LC-MS-based lipidomics approach. Food Control 2019, 100, 305–314. [Google Scholar] [CrossRef]
- Fiorino, G.M.; Losito, I.; De Angelis, E.; Arlorio, M.; Logrieco, A.F.; Monaci, L. Assessing fish authenticity by direct analysis in real time-high resolution mass spectrometry and multivariate analysis: Discrimination between wild-type and farmed salmon. Food Res. Int. 2019, 116, 1258–1265. [Google Scholar] [CrossRef] [PubMed]
- Xie, Y.; Wei, F.; Xu, S.; Wu, B.F.; Zheng, C.; Lv, X.; Wu, Z.Y.; Chen, H.; Huang, F.H. Profiling and quantification of lipids in cold-pressed rapeseed oils based on direct infusion electrospray ionization tandem mass spectrometry. Food Chem. 2019, 285, 194–203. [Google Scholar] [CrossRef]
- Wang, Y.; Zhang, H. Tracking phospholipid profiling of muscle from Ctennopharyngodon idellus during storage by shotgun lipidomics. J. Agric. Food Chem. 2011, 59, 11635–11642. [Google Scholar] [CrossRef] [PubMed]
- Gao, W.H.; Yin, Q.L.; Wang, Y.D.; Teng, X.Y.; Ren, H.W.; Liu, N. Investigation of the Effects of Heat Treatment and Fermentation on Milk Lipids Based on Lipidomics Techniques. Food Sci. 2021. Available online: https://kns.cnki.net/kcms/detail/11.2206.TS.20211202.2006.018.html (accessed on 12 August 2022).
- Liu, H.Y.; Guo, X.Q.; Zhao, Q.Y.; Qin, Y.C.; Zhang, J.M. Lipidomics analysis for identifying the geographical origin and lactation stage of goat milk. Food Chem. 2020, 309, 125765. [Google Scholar] [CrossRef] [PubMed]
- Wei, H.L.; Lv, X.; Xie, Y.; Xu, S.L.; Chen, H.; Wei, F. Lipid of Principia utilis Royle oil by ultra-performance liquid chromatography-time of flight-tandem mass spectrometry. Chin. J. Oil Crop. Sci. 2019, 41, 947–955. [Google Scholar] [CrossRef]
- Hu, A.P.; Wei, F.; Huang, F.H.; Xie, Y.; Wu, B.F.; Lv, X.; Chen, H. Comprehensive and high-coverage lipidomic analysis of oilseeds based on ultrahigh-performance liquid chromatography coupled with electrospray ionization quadrupole time-of-flight mass spectrometry. J. Agric. Food Chem. 2021, 69, 8964–8980. [Google Scholar] [CrossRef] [PubMed]
- Xie, Y.; Wu, B.F.; Wu, Z.Y.; Tu, X.H.; Xu, S.L.; Lv, X.; Yin, H.Q.; Xiang, J.Q.; Chen, H.; Wei, F. Ultrasound-assisted one-phase solvent extraction coupled with liquid chromatography-quadrupole time-of-flight mass spectrometry for efficient profiling of egg yolk lipids. Food Chem. 2020, 319, 126547. [Google Scholar] [CrossRef]

Publisher’s Note: MDPI stays neutral with regard to jurisdictional claims in published maps and institutional affiliations. |
© 2022 by the authors. Licensee MDPI, Basel, Switzerland. This article is an open access article distributed under the terms and conditions of the Creative Commons Attribution (CC BY) license (https://creativecommons.org/licenses/by/4.0/).