
Design, Synthesis and Biological Evaluation of 1,3,5-Triazine Derivatives Targeting hA1 and hA3 Adenosine Receptor

 , , and
Abstract
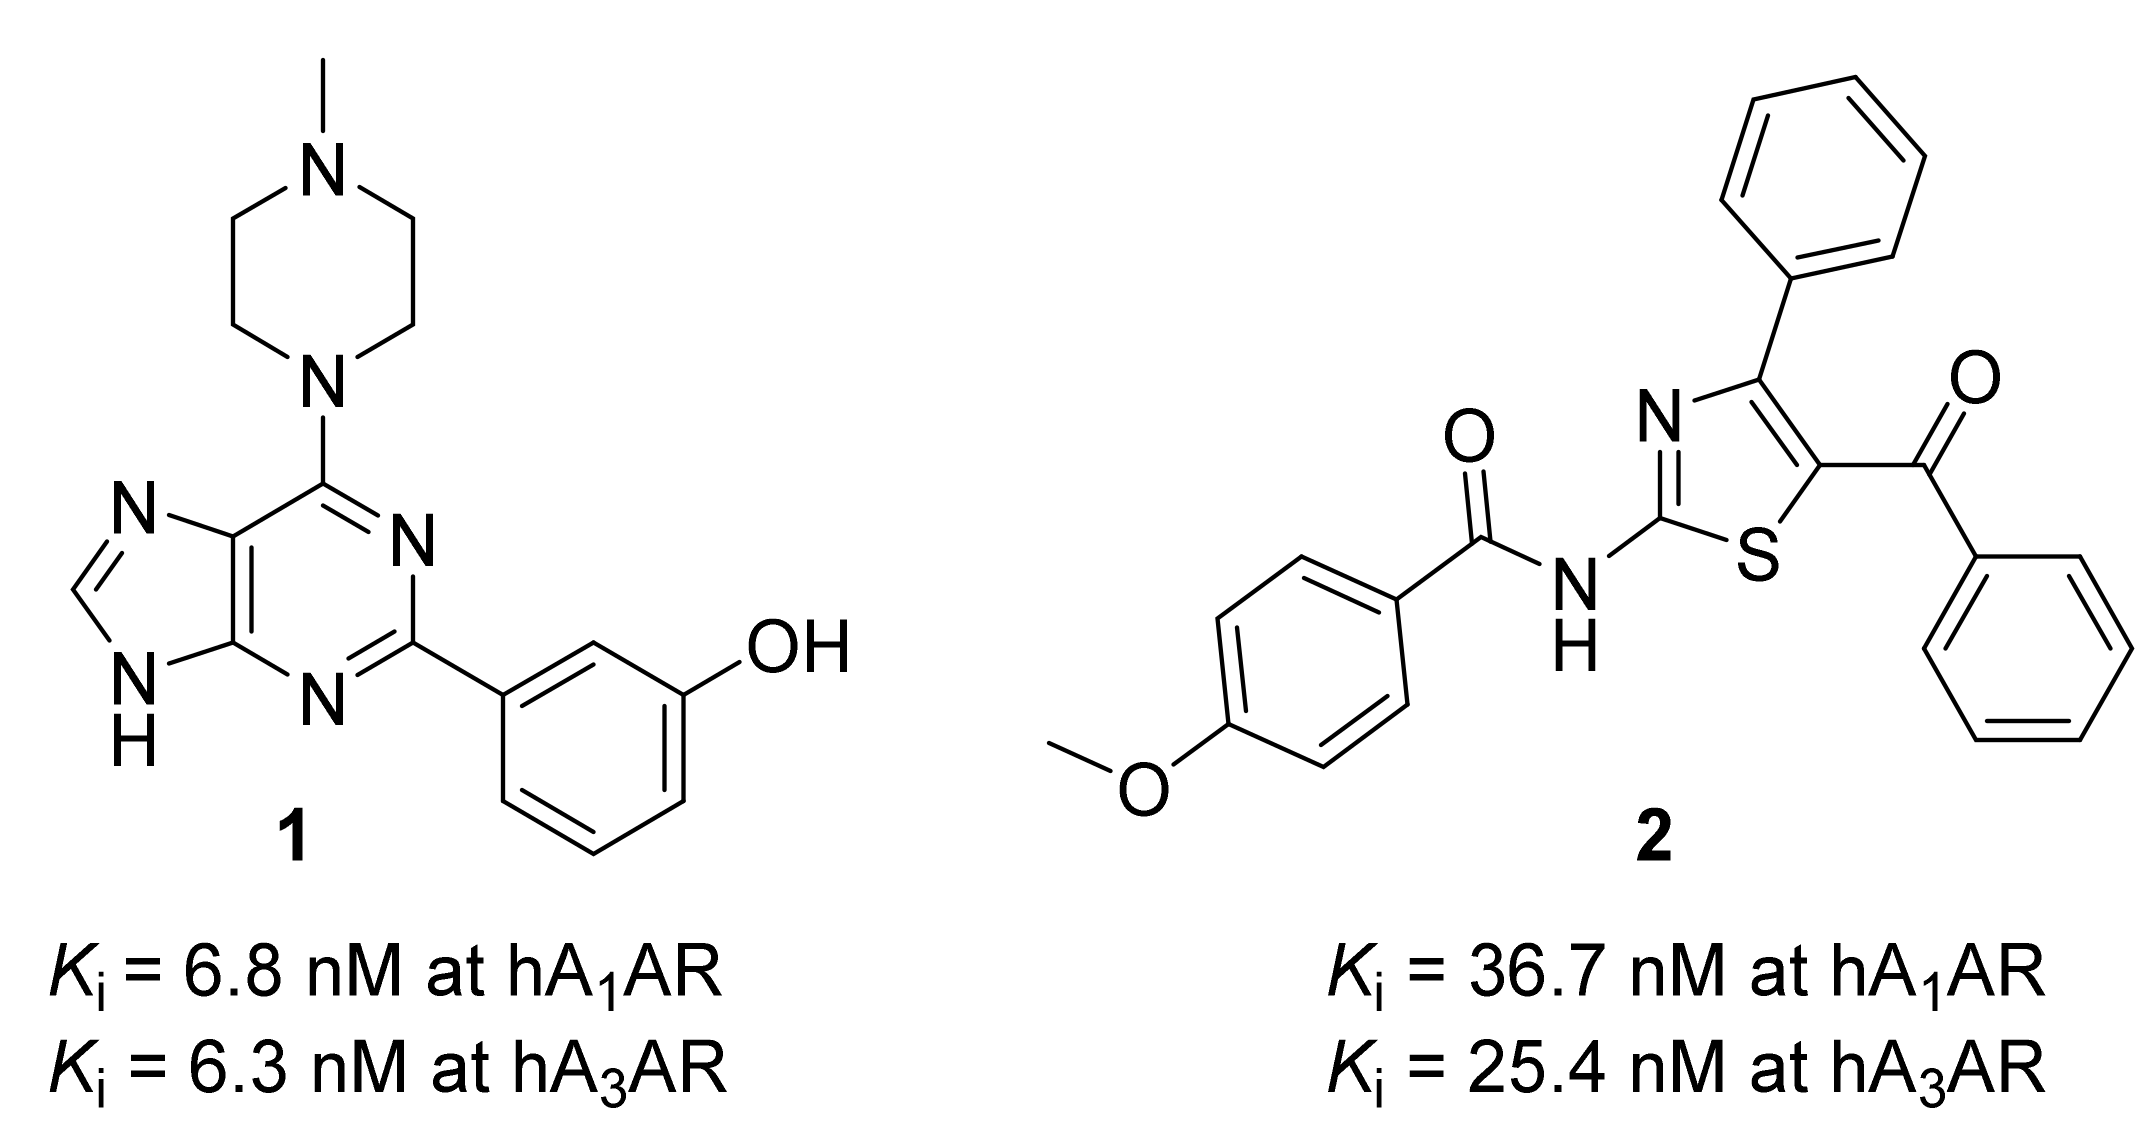
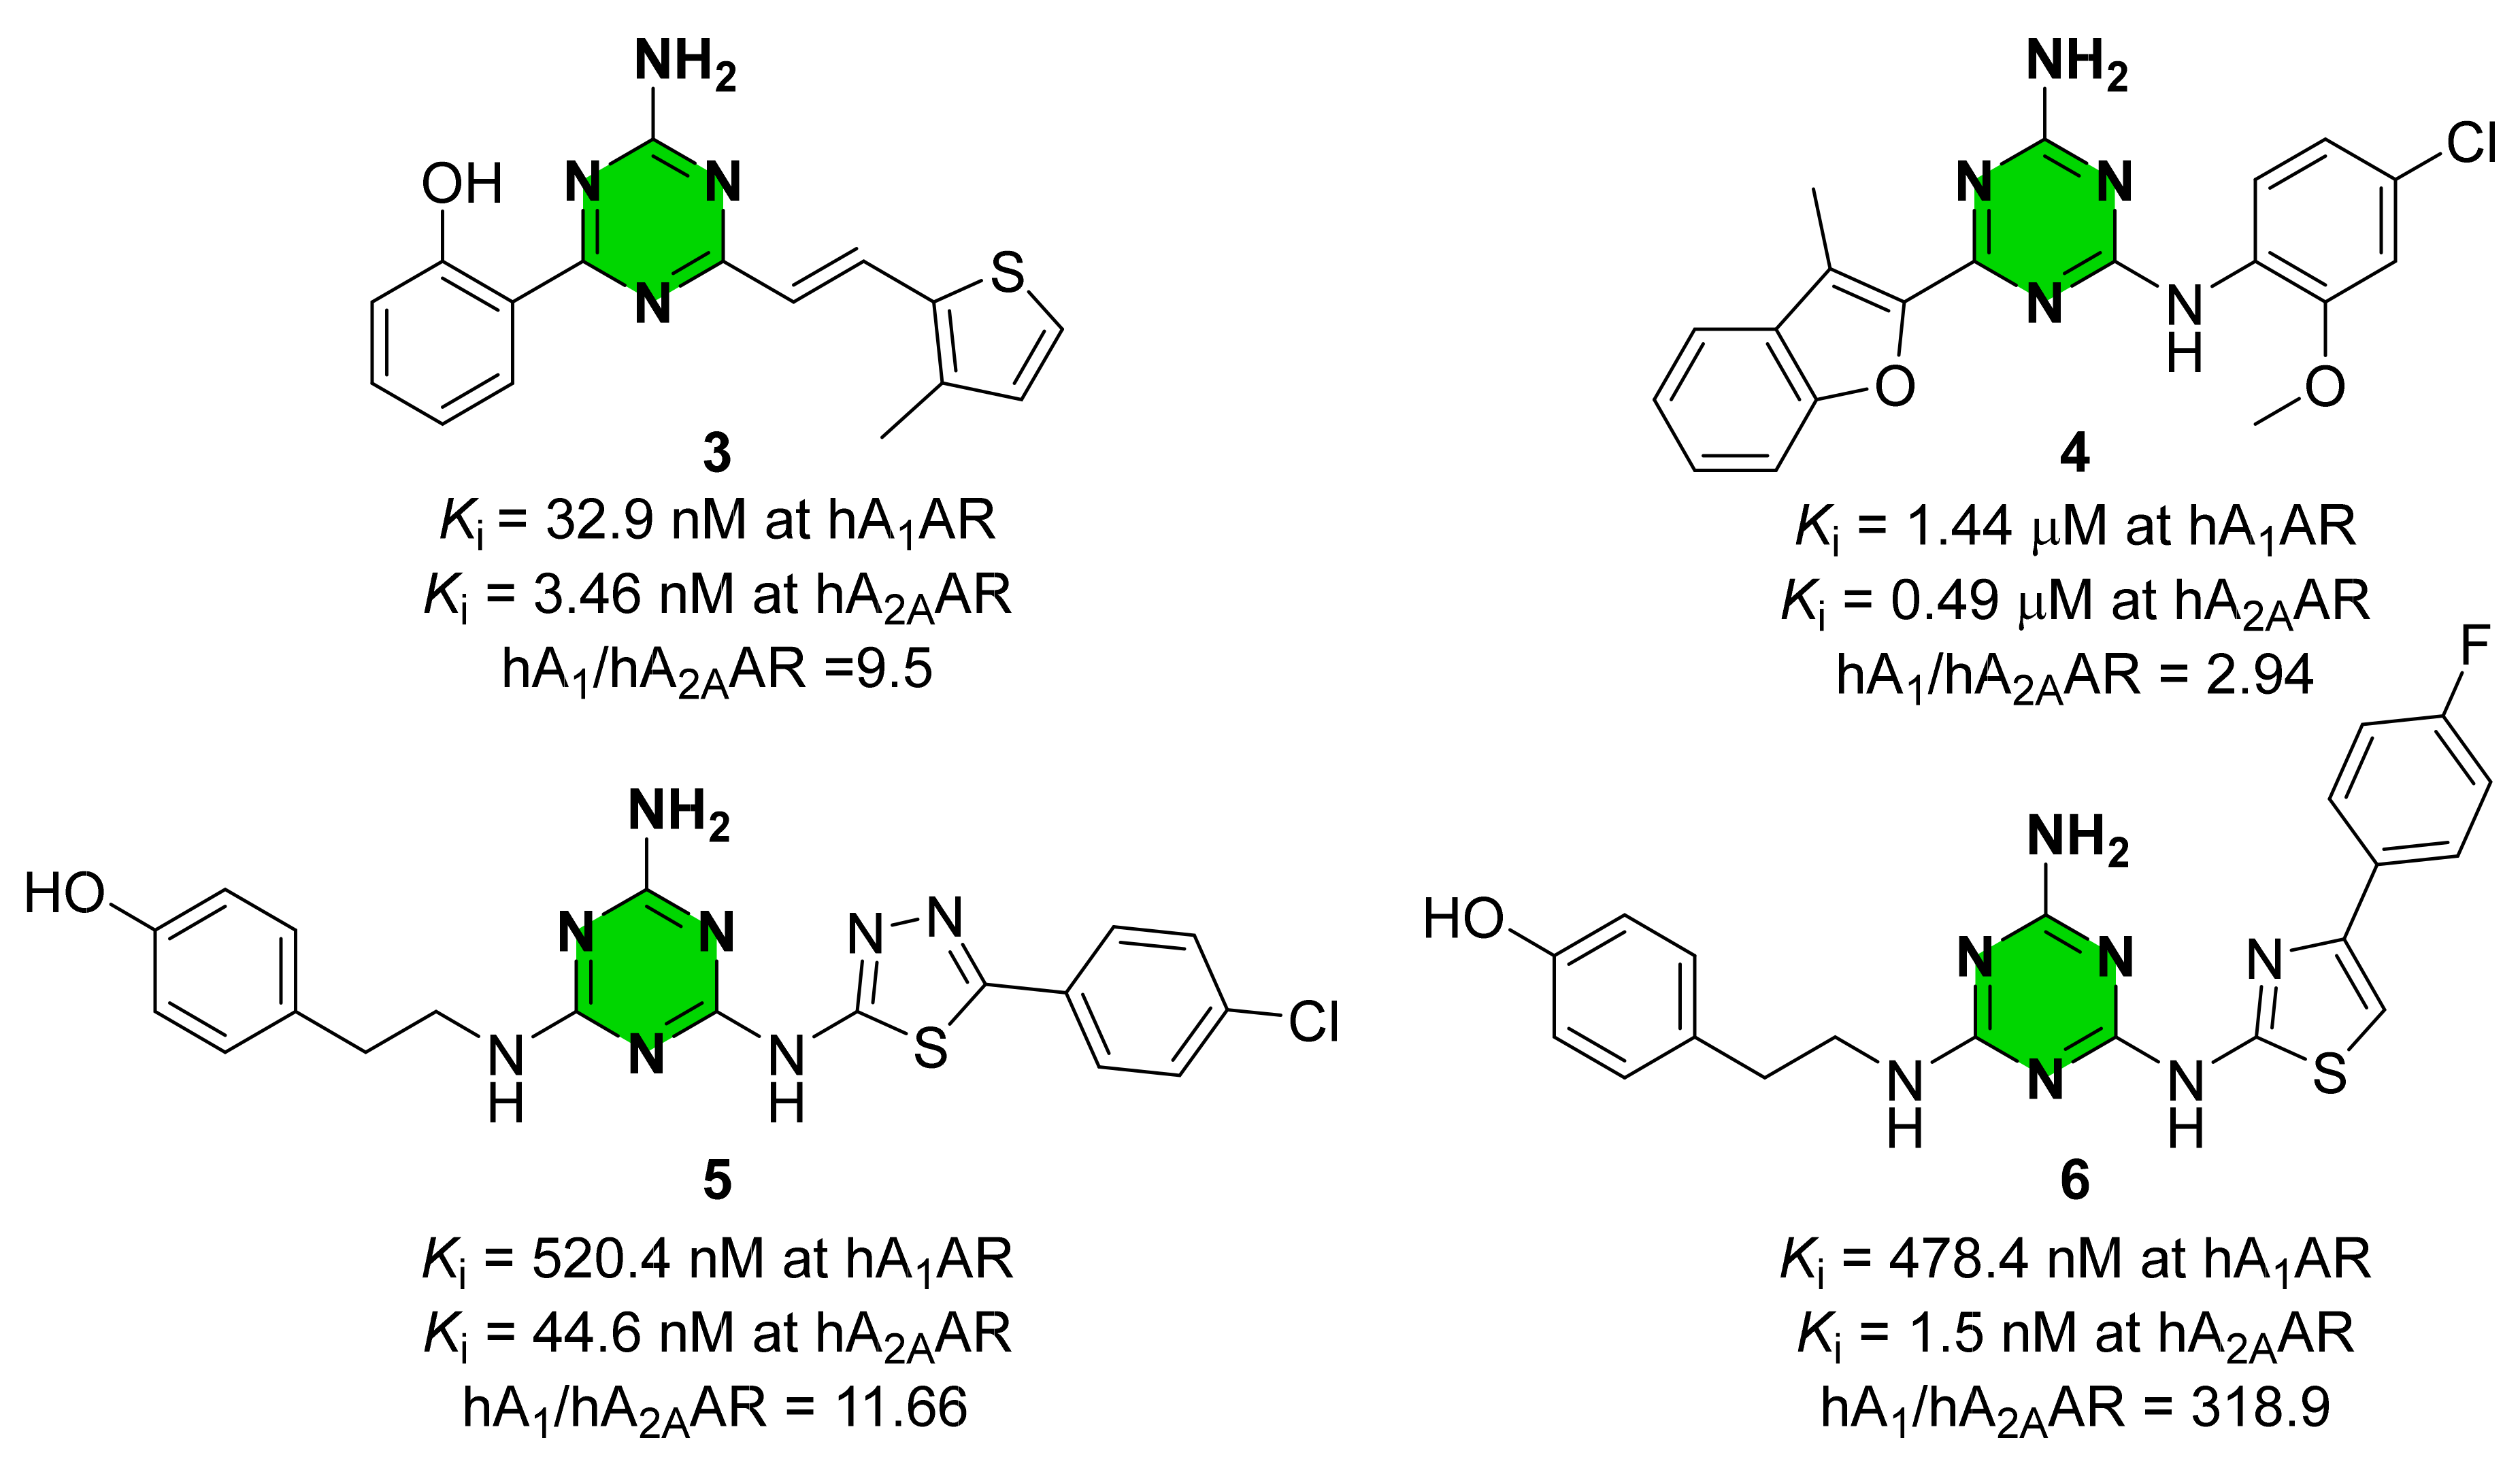
:1. Introduction
2. Results and Discussion
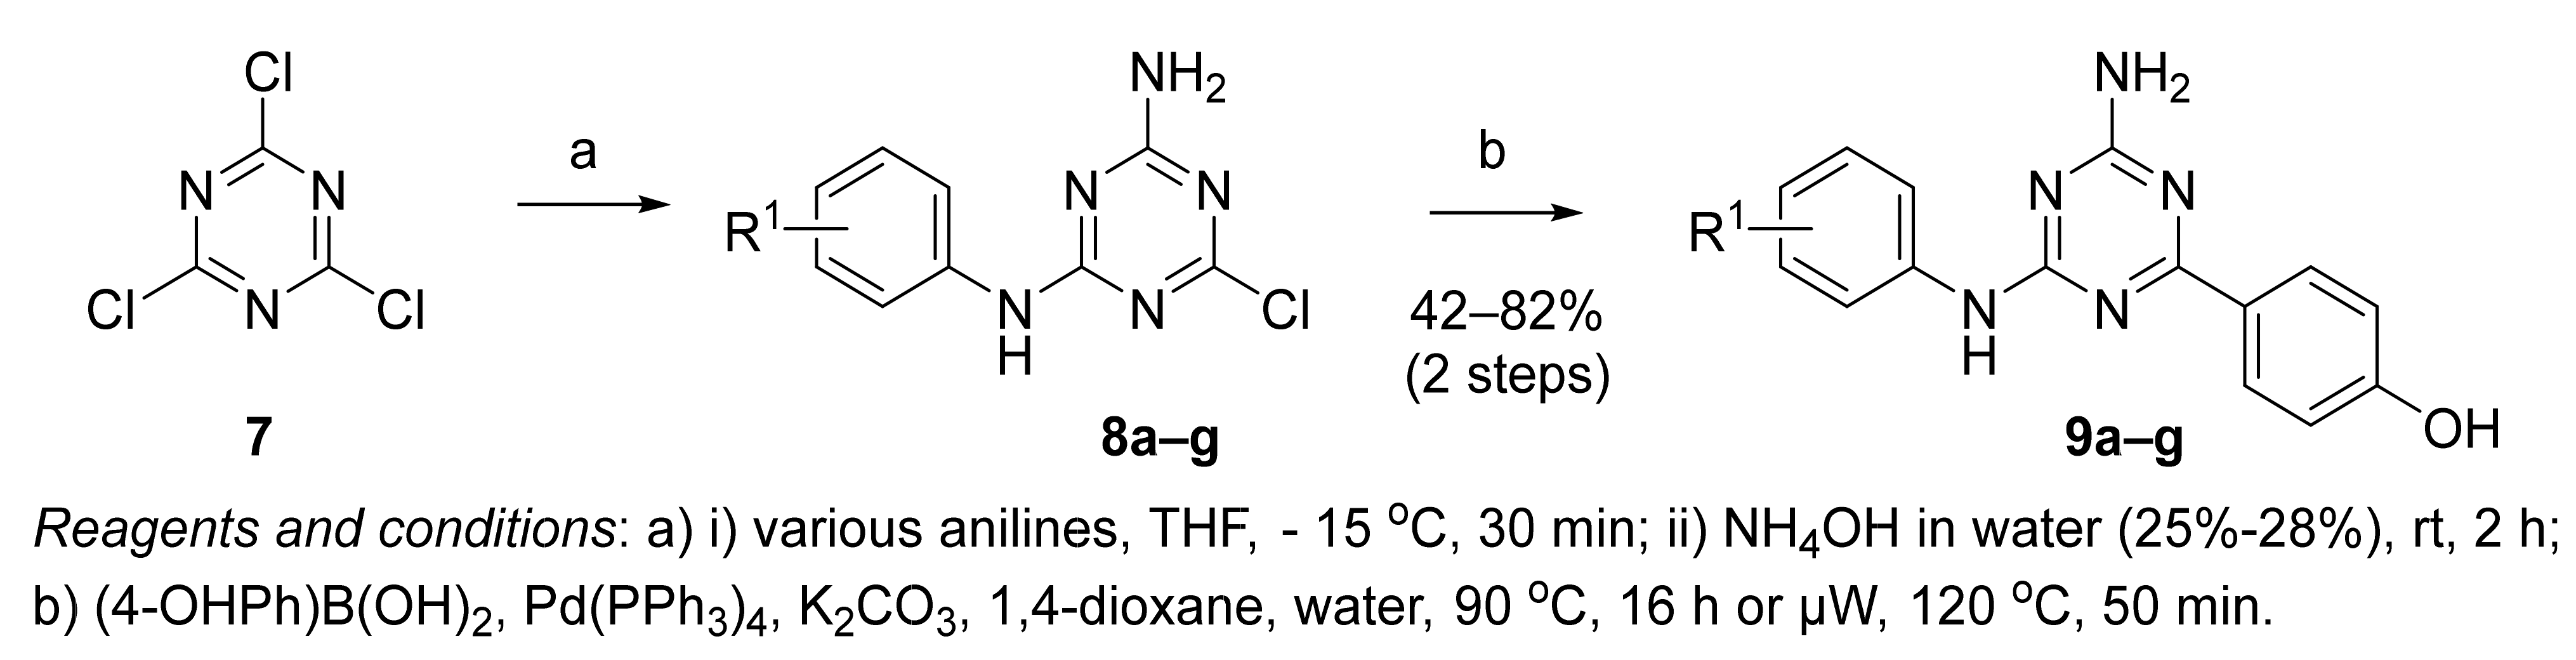
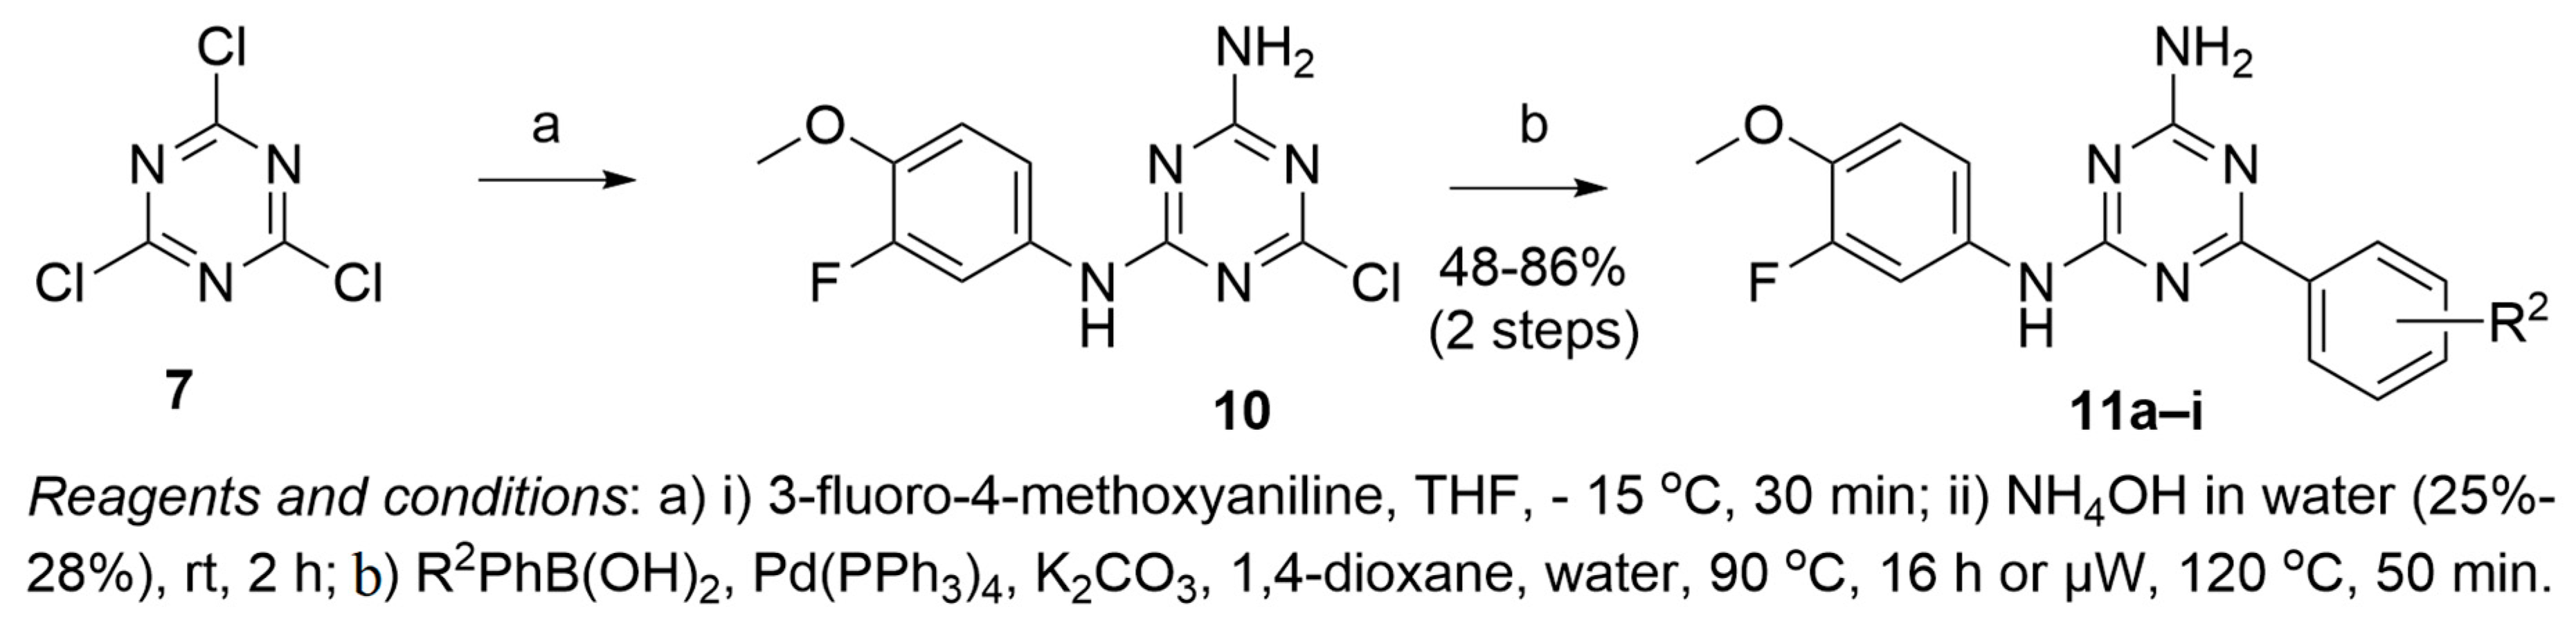
2.1. Synthesis of 1,3,5-Triazine Derivatives
2.2. Radioligand Binding Assays at Human Adenosine Receptors
2.3. cAMP Assay at hA1 and hA3 AR Adenosine Receptors
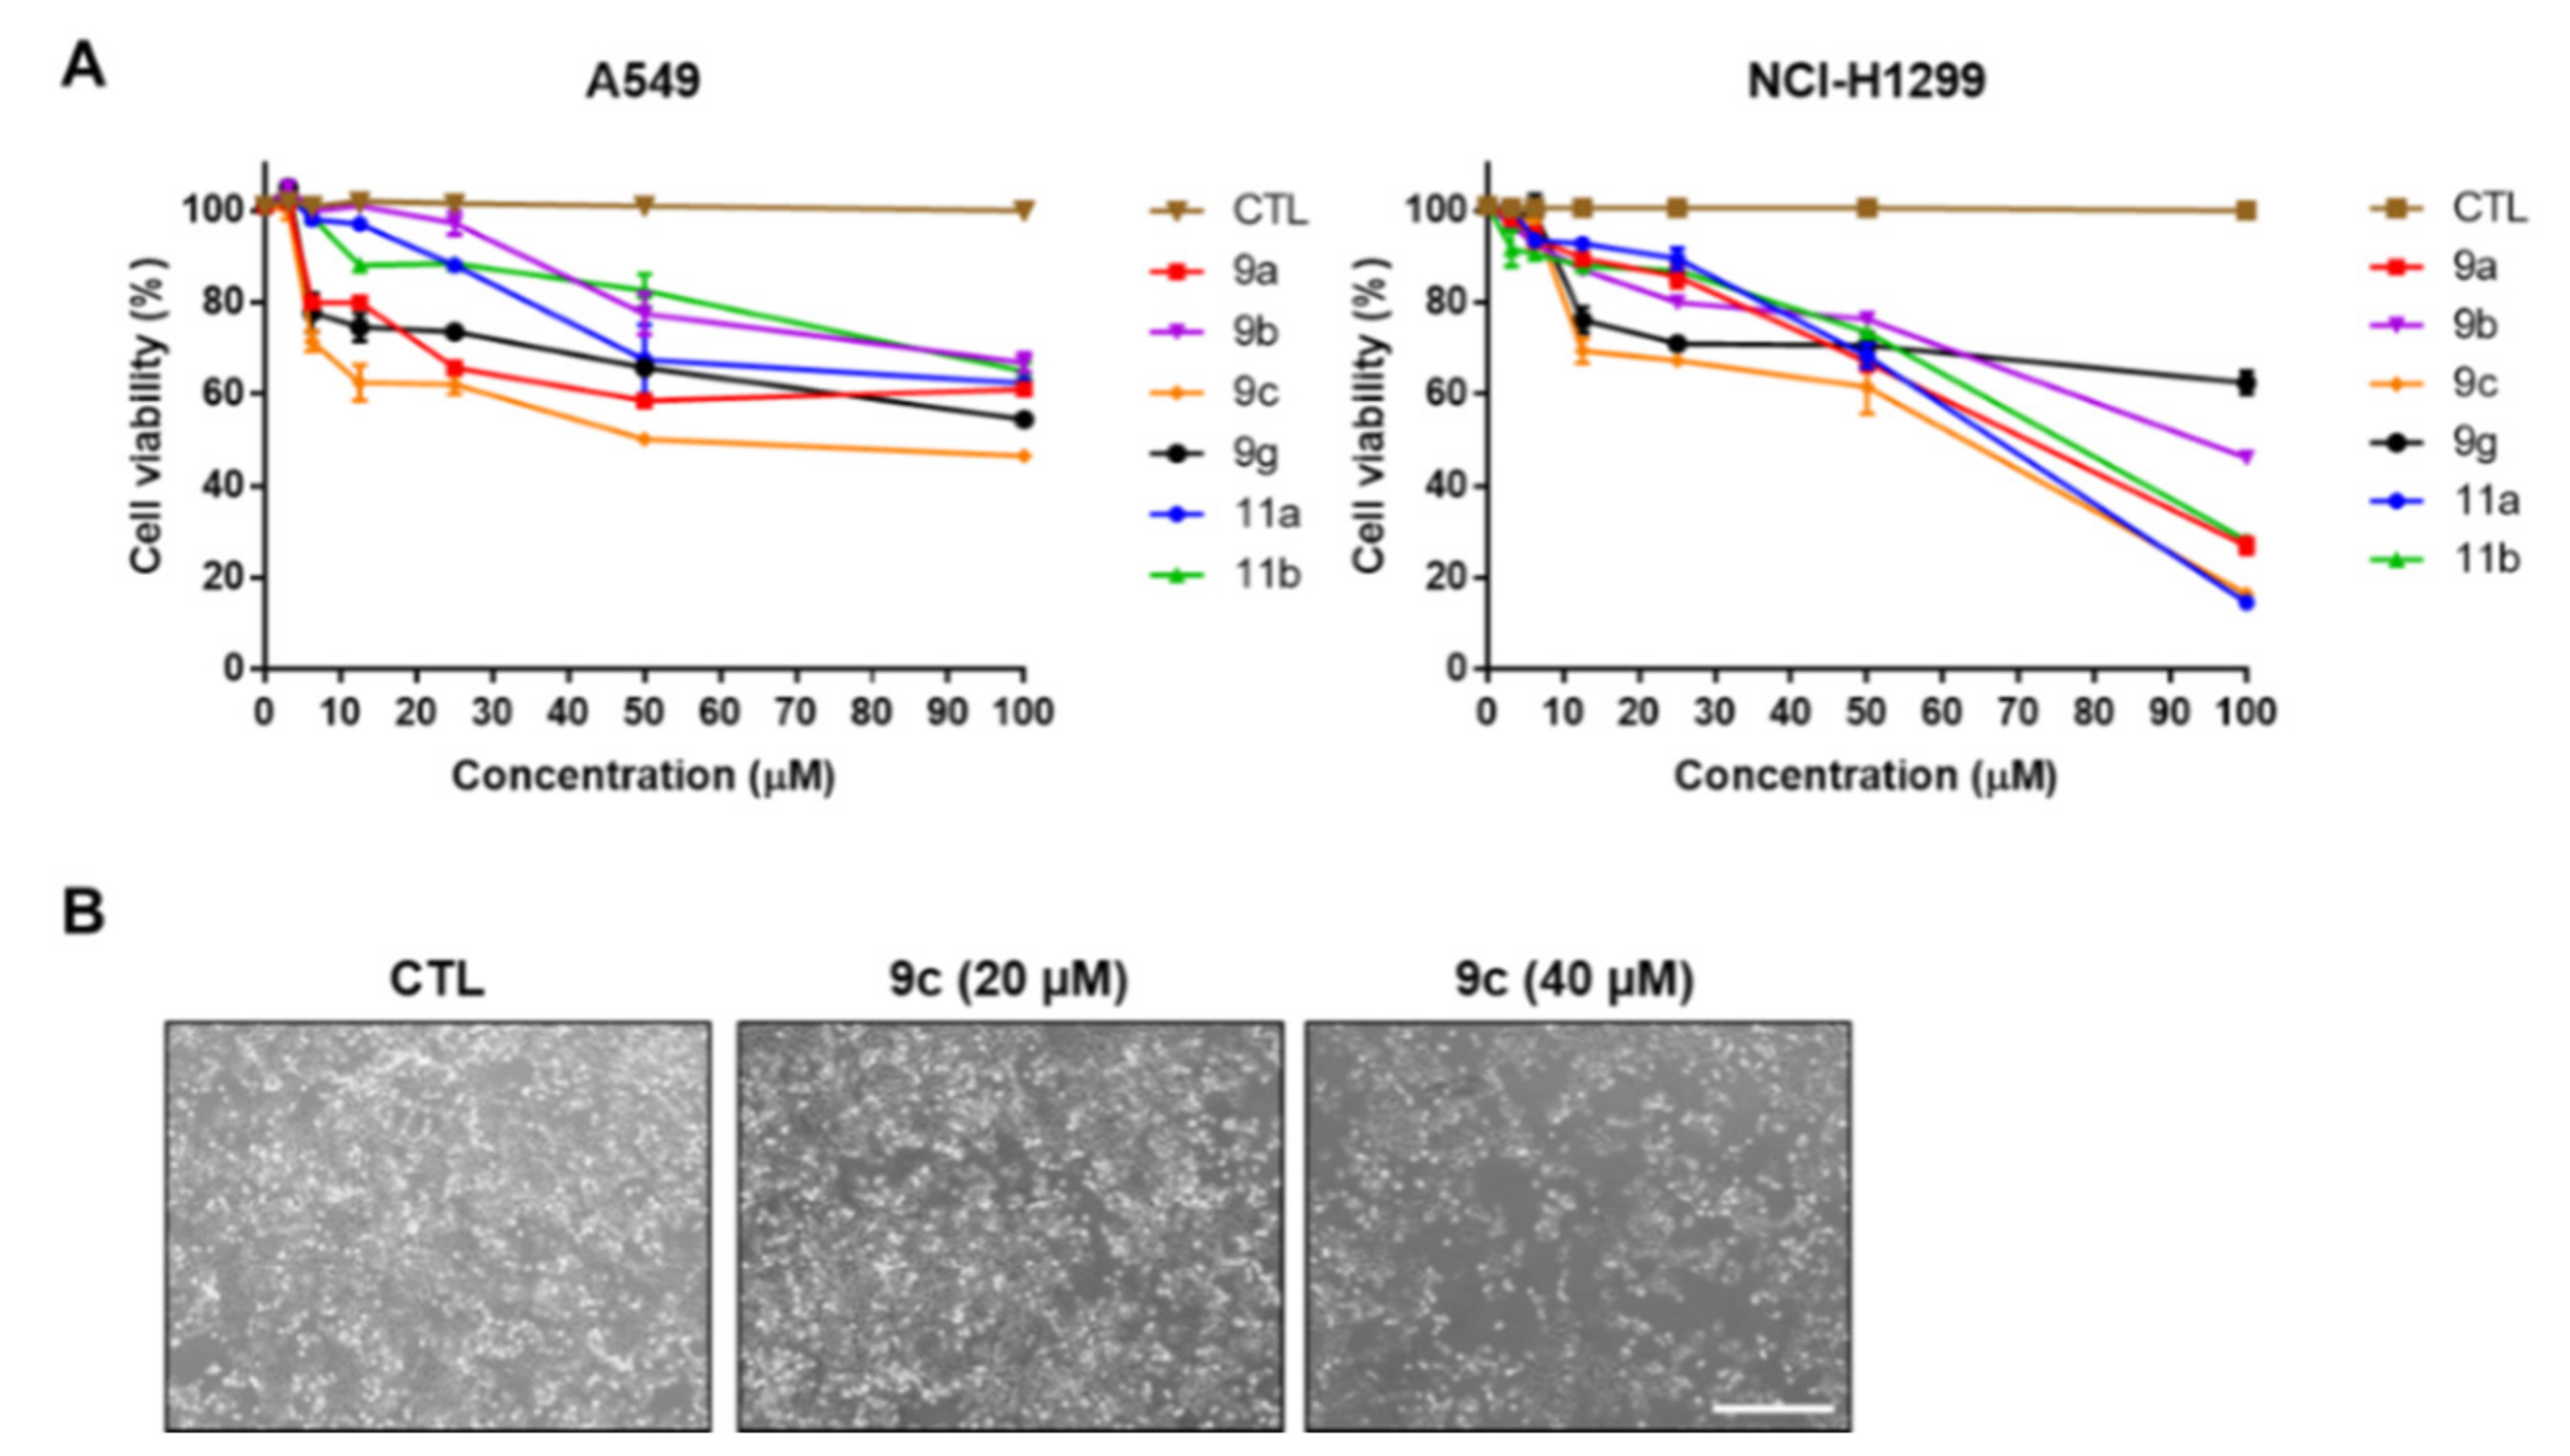
2.4. Cell Viability of 1,3,5-Triazine Derivatives 9a–c, 9g, and 11a–b
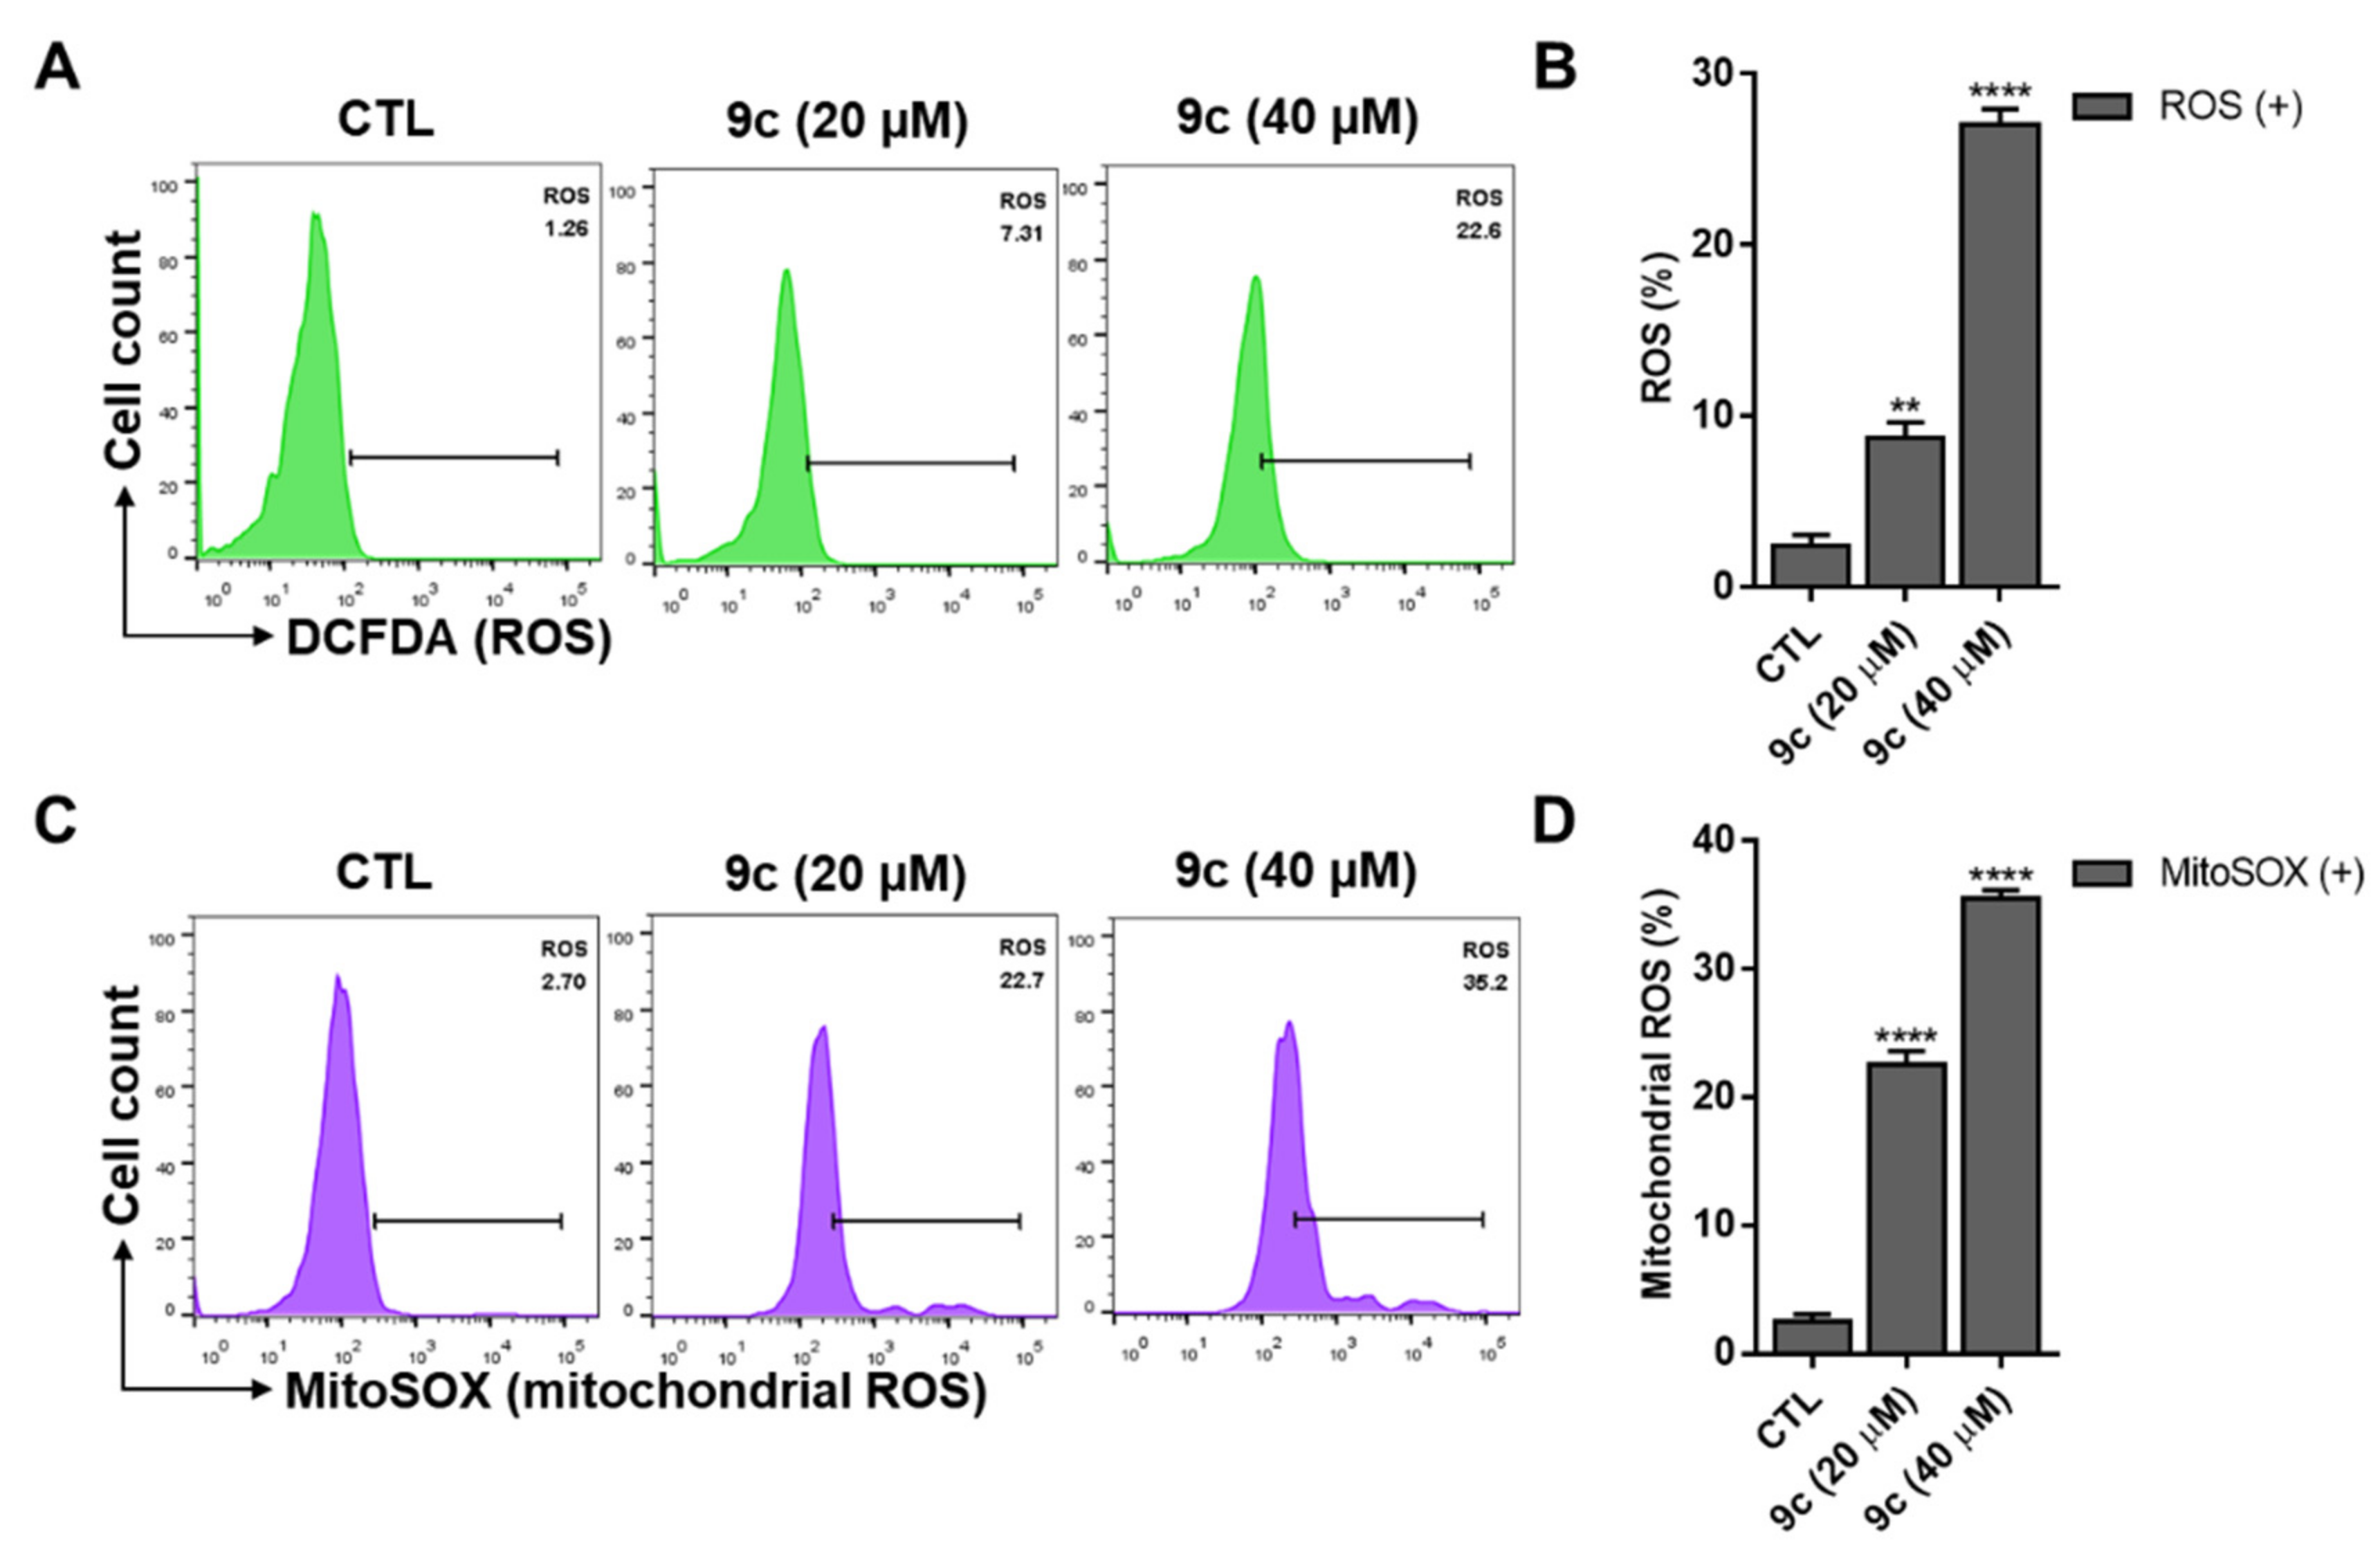
2.5. Compound 9c-Induced Intracellular ROS and Mitochondrial ROS
2.6. Compound 9c-Induced Mitochondrial Membrane Dysfunction
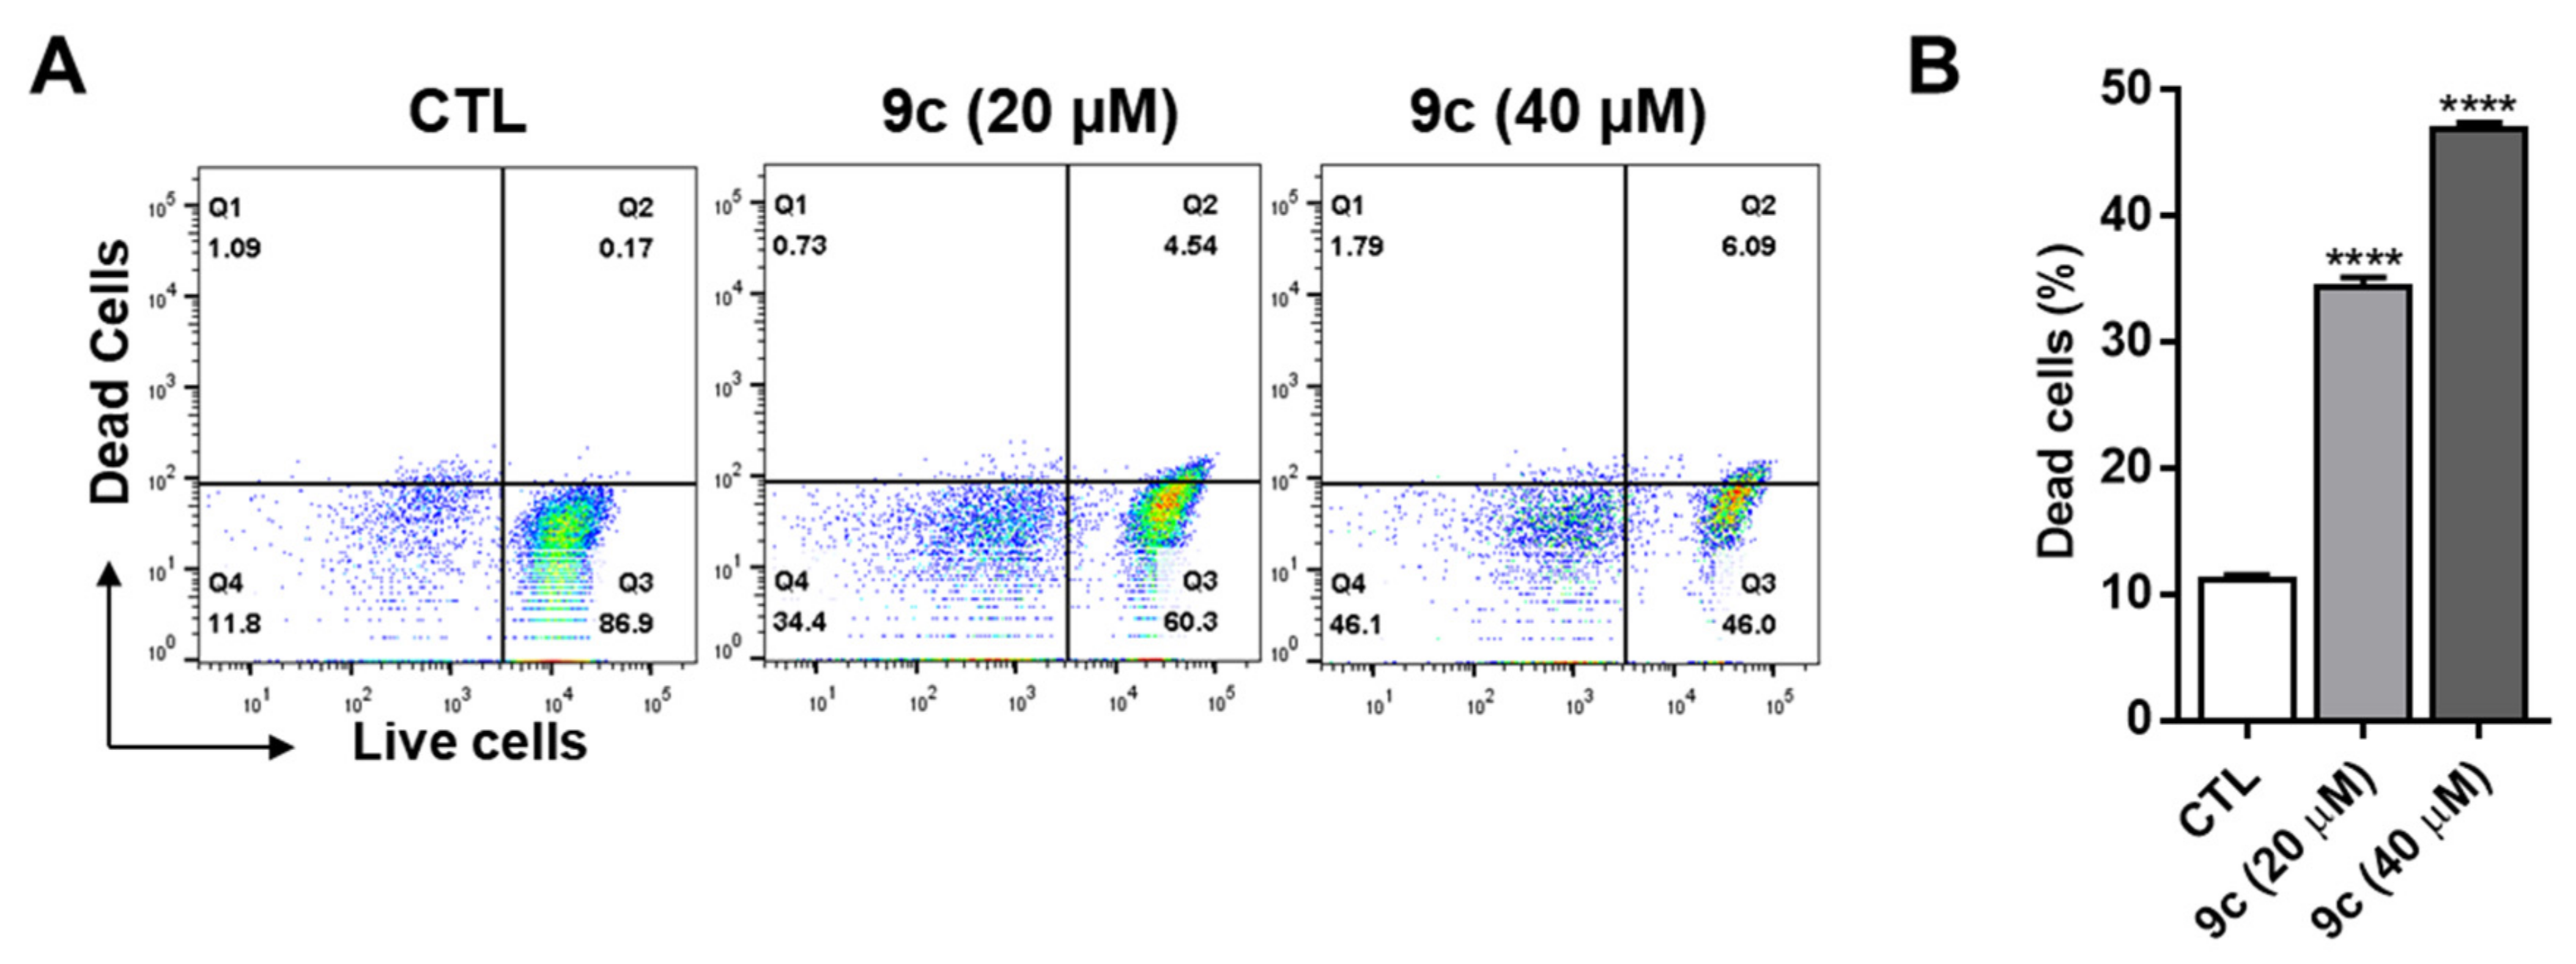
2.7. Compound 9c Effects on Lung Cancer Cell Death
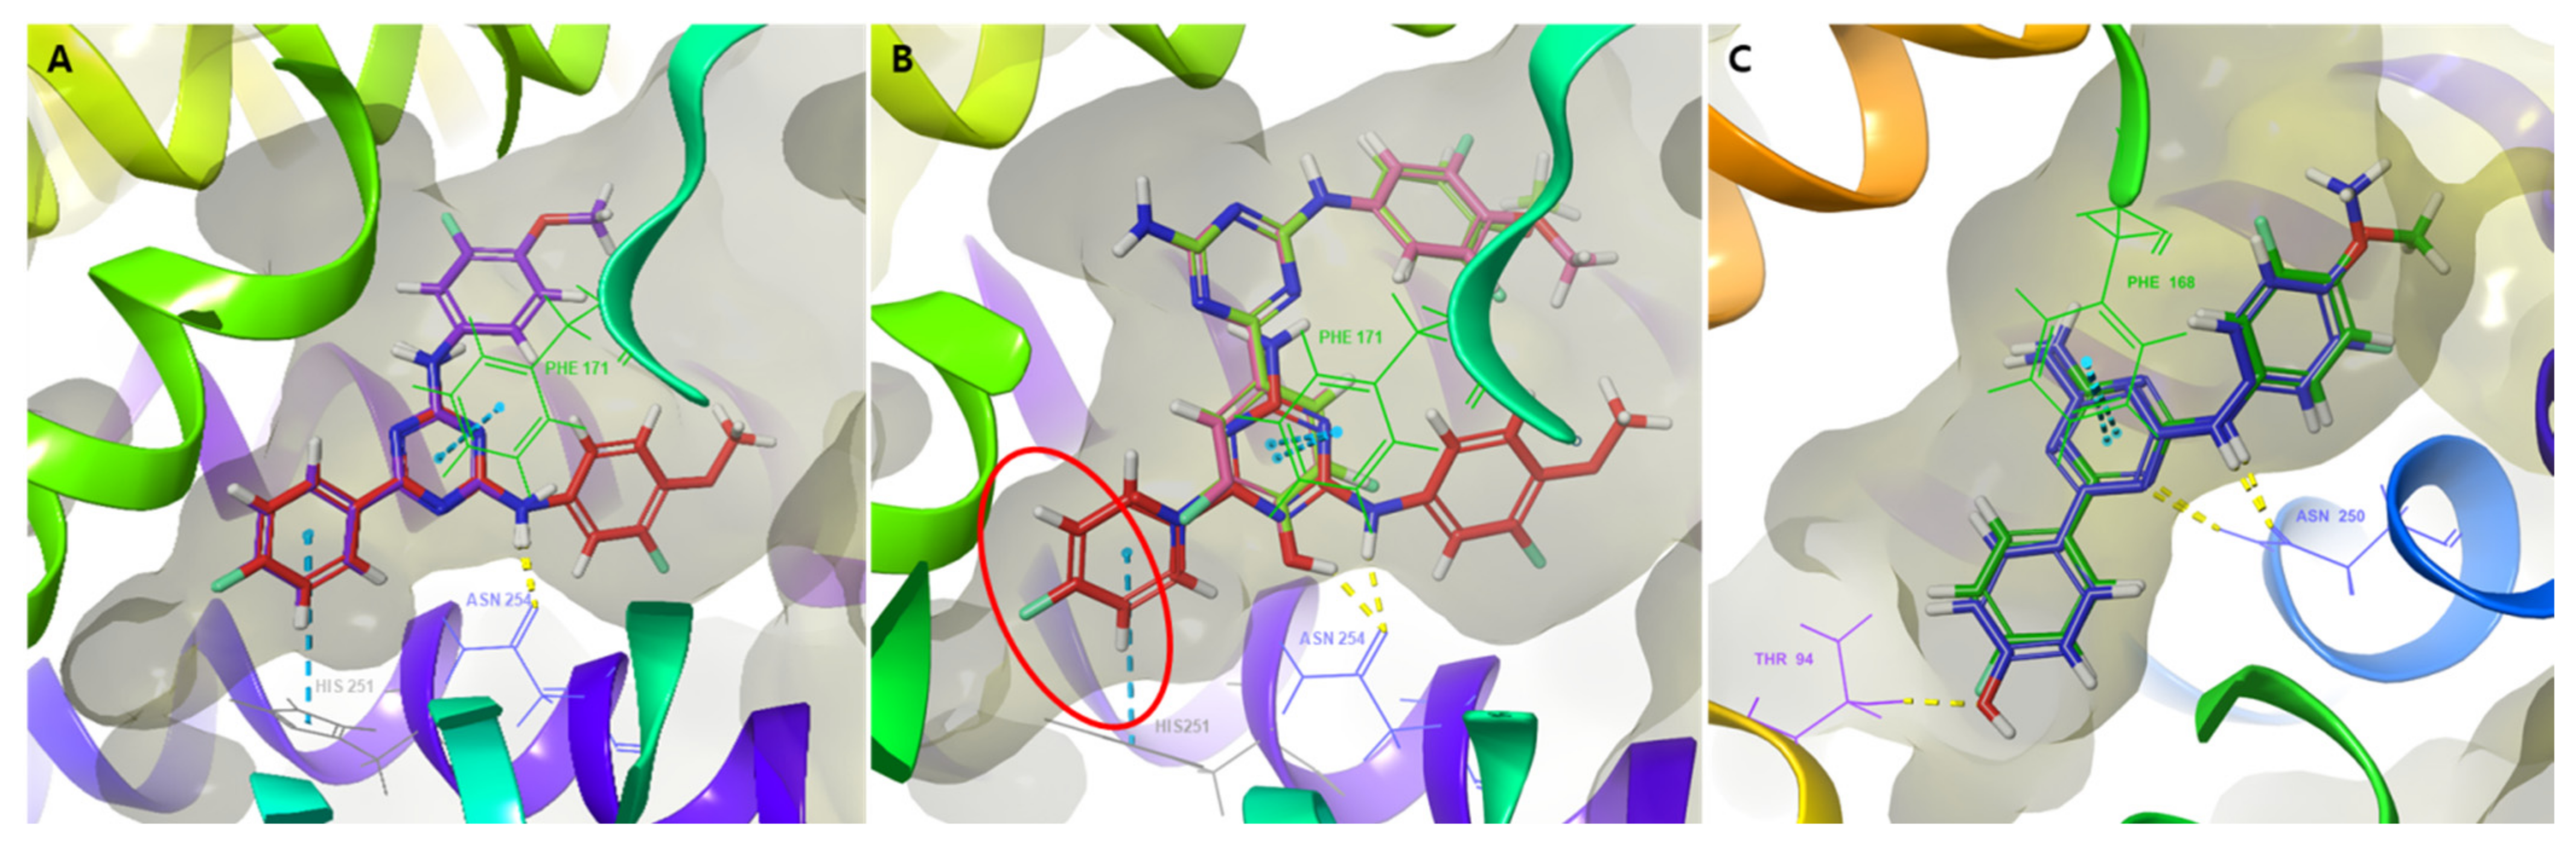
2.8. Molecular Docking Study of 1,3,5-Triazine Derivatives
3. Materials and Methods
3.1. Chemical Synthesis
3.1.1. General Chemical Synthesis
3.1.2. General Procedure for the Synthesis of 8a–g
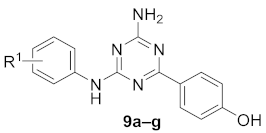
3.1.3. General Procedure for the Synthesis of 9a–g
Compound 9a
Compound 9b
Compound 9c
Compound 9d
Compound 9e
Compound 9f
Compound 9g
3.1.4. Procedure for the Synthesis of Intermediate 10
3.1.5. General Procedure for the Synthesis of 11a–i
Compound 11a
Compound 11b
Compound 11c
Compound 11d
Compound 11e
Compound 11f
Compound 11g
Compound 11h
Compound 11i
3.2. Biological Evaluation
3.2.1. Binding Assay at Human Adenosine Receptors
Binding Assay at hA1, hA2A, and hA3 AR
Binding Assay at hA2B AR
3.2.2. cAMP Accumulation Assay
Antagonist Mode at hA1 or hA3 AR
Agonist Mode at hA1 or hA3 AR
3.2.3. Cell Culture
3.2.4. Cell Viability Assay
3.2.5. Microscopy
3.2.6. Mitochondrial Membrane Potential (MMP) and Reactive Oxygen Species (ROS) Assay
3.2.7. Live–Dead Assay
3.2.8. Statistical Analysis
3.3. Molecular Modeling
4. Conclusions
Supplementary Materials
Author Contributions
Funding
Institutional Review Board Statement
Informed Consent Statement
Data Availability Statement
Conflicts of Interest
Sample Availability
References
- Chen, J.F.; Eltzschig, H.K.; Fredholm, B.B. Adenosine receptors as drug targets—What are the challenges? Nat. Rev. Drug Discov. 2013, 12, 265–286. [Google Scholar] [CrossRef] [PubMed] [Green Version]
- Saini, A.; Patel, R.; Gaba, S.; Singh, G.; Gupta, G.D.; Monga, V. Adenosine receptor antagonists: Recent advances and therapeutic perspective. Eur. J. Med. Chem. 2022, 227, 113907. [Google Scholar] [CrossRef] [PubMed]
- Jacobson, K.; Gao, Z.G. Adenosine receptors as therapeutic targets. Nat. Rev. Drug Discov. 2006, 5, 247–264. [Google Scholar] [CrossRef] [PubMed] [Green Version]
- Headrick, J.P.; Peart, J.N.; Reichelt, M.E.; Haseler, L.J. Adenosine and its receptors in the heart: Regulation, retaliation and adaptation. Biochim. Biophys. Acta 2011, 1808, 1413–1428. [Google Scholar] [CrossRef] [PubMed] [Green Version]
- Marchi, M.; Raiteri, L.; Risso, F.; Vallarino, A.; Bonfanti, A.; Monopoli, A.; Ongini, E.; Raiteri, M. Effects of adenosine A1 and A2A receptor activation on the evoked release of glutamate from rat cerebrocortical synaptosomes. Br. J. Pharmacol. 2002, 136, 434–440. [Google Scholar] [CrossRef] [PubMed] [Green Version]
- Vannucci, S.J.; Klim, C.M.; Martin, L.F.; LaNoue, K.F. A1-adenosine receptor-mediated inhibition of adipocyte adenylate cyclase and lipolysis in Zucker rats. Am. J. Physiol. 1989, 257, E871–E878. [Google Scholar] [CrossRef]
- Gottlieb, S.S. Renal effects of adenosine A1-receptor antagonists in congestive heart failure. Drugs 2001, 61, 1387–1393. [Google Scholar] [CrossRef] [PubMed]
- Kunduri, S.S.; Mustafa, S.J.; Ponnoth, D.S.; Dick, G.M.; Nayeem, M.A. Adenosine A1 receptors link to smooth muscle contraction via CYP4a, protein kinase C-α, and ERK1/2. J. Cardiovasc. Pharmacol. 2013, 62, 78–83. [Google Scholar] [CrossRef] [Green Version]
- Gao, Z.G.; Tosh, D.K.; Jain, S.; Yu, J.; Suresh, R.R.; Jacobson, K.A. A1 adenosine receptor agonists, antagonists, and allosteric modulators. In The Adenosine Receptors; Humana Press: Cham, Switzerland, 2018; pp. 59–89. [Google Scholar]
- Fishman, P.; Bar-Yehuda, S.; Liang, B.T.; Jacobson, K.A. Pharmacological and therapeutic effects of A3 adenosine receptor agonists. Drug Discov. Today 2012, 17, 359–366. [Google Scholar] [CrossRef] [Green Version]
- Borea, P.A.; Gessi, S.; Merighi, S.; Vincenzi, F.; Varani, K. Pharmacology of Adenosine Receptors: The State of the Art. Physiol Rev. 2018, 98, 1591–1625. [Google Scholar] [CrossRef]
- Zhou, Y.; Tong, L.; Chu, X.; Deng, F.; Tang, J.; Tang, Y.; Dai, Y. The Adenosine A1 Receptor Antagonist DPCPX Inhibits Tumor Progression via the ERK/JNK Pathway in Renal Cell Carcinoma. Cell. Physiol. Biochem. 2017, 43, 733–742. [Google Scholar] [CrossRef]
- Mlejnek, P.; Dolezel, P.; Frydrych, I. Effects of synthetic A3 adenosine receptor agonists on cell proliferation and viability are receptor independent at micromolar concentrations. J. Physiol. Biochem. 2013, 69, 405–417. [Google Scholar] [CrossRef]
- Borea, P.A.; Gessi, S.; Bar-Yehuda, S.; Fishman, P. A3 adenosine receptor: Pharmacology and role in disease. In Handbook of Experimental Pharmacology; Springer: Berlin/Heidelberg, Germany, 2009; pp. 297–327. [Google Scholar]
- Mazziotta, C.; Rotondo, J.C.; Lanzillotti, C.; Campione, G.; Martini, F.; Tognon, M. Cancer biology and molecular genetics of A3 adenosine receptor. Oncogene 2022, 41, 301–308. [Google Scholar] [CrossRef]
- Effendi, W.I.; Nagano, T.; Kobayashi, K.; Nishimura, Y. Focusing on Adenosine Receptors as a Potential Targeted Therapy in Human Diseases. Cells 2020, 9, 785. [Google Scholar] [CrossRef] [Green Version]
- Gessi, S.; Merighi, S.; Varani, K.; Leung, E.; Lennan, S.M.; Borea, P.A. The A3 adenosine receptor: An enigmatic player in cell biology. Pharmacol. Ther. 2008, 117, 123–140. [Google Scholar] [CrossRef]
- Anighoro, A.; Bajorath, J.; Rastelli, G. Polypharmacology: Challenges and Opportunities in Drug Discovery. J. Med. Chem. 2014, 57, 7874–7887. [Google Scholar] [CrossRef]
- Peters, J.-U. Polypharmacology—Foe or Friend? J. Med. Chem. 2013, 56, 8955–8971. [Google Scholar] [CrossRef]
- Areias, F.; Correia, C.; Rocha, A.; Brea, J.; Castro, M.; Rosa, M.I.; Proença, M.F.; Carvalho, M.A. 2-Aryladenine derivatives as a potent scaffold for A1, A3, and dual A1/A3 adenosine receptor antagonists: Synthesis and structure-activity relationships. Bioorg. Med. Chem. 2019, 27, 3551–3558. [Google Scholar] [CrossRef]
- Abdelrahman, A.; Yerande, S.G.; Namasivayam, V.; Klapschinski, T.A.; Alnouri, M.W.; El-Tayeb, A.; Müller, C.E. Substituted 4-phenylthiazoles: Development of potent and selective A1, A3 and dual A1/A3 adenosine receptor antagonists. Eur. J. Med. Chem. 2020, 186, 111879. [Google Scholar] [CrossRef]
- Burbiel, J.C.; Ghattas, W.; Küppers, P.; Köse, M.; Lacher, S.; Herzner, A.-M.; Kombu, R.S.; Akkinepally, R.R.; Hockemeyer, J.; Müller, C.E. 2-Amino[1,2,4]triazolo[1,5-c]quinazolines and derived novel heterocycles: Synthesis and structure-activity relationships of potent adenosine receptor antagonists. Chem. Med. Chem. 2016, 11, 2272–2286. [Google Scholar] [CrossRef]
- Langmead, C.J.; Andrews, S.P.; Congreve, M.; Errey, J.C.; Hurrell, E.; Marshall, F.H.; Jonathan, S.M.; Richardson, C.M.; Robertson, N.; Zhukov, A.; et al. Identification of Novel Adenosine A2A Receptor Antagonists by Virtual Screening. J. Med. Chem. 2012, 55, 1904–1909. [Google Scholar] [CrossRef]
- Katritch, V.; Jaakola, V.-P.; Lane, J.R.; Lin, J.; Ijzerman, A.P.; Yeager, M.; Kufareva, I.; Stevens, R.C.; Abagyan, R. Structure-Based Discovery of Novel Chemotypes for Adenosine A2A Receptor Antagonists. J. Med. Chem. 2010, 53, 1799–1809. [Google Scholar] [CrossRef] [Green Version]
- Masih, A.; Singh, S.; Agnihotri, A.K.; Giri, S.; Shrivastava, J.K.; Pandey, N.; Bhat, H.R.; Singh, U.P. Design and development of 1,3,5-triazine-thiadiazole hybrids as potent adenosine A2A receptor (A2AR) antagonist for benefit in Parkinson’s disease. Neurosci. Lett. 2020, 735, 135222. [Google Scholar] [CrossRef]
- Masih, A.; Agnihotri, A.K.; Srivastava, J.K.; Pandey, N.; Bhat, H.R.; Singh, U.P. Discovery of novel 1,3,5-triazine as adenosine A2A receptor antagonist for benefit in Parkinson’s disease. J. Biochem. Mol. Toxicol. 2020, 35, e22659. [Google Scholar]
- Lee, Y.; Hou, X.; Lee, J.H.; Nayak, A.; Alexander, V.; Sharma, P.K.; Chang, H.; Phan, K.; Gao, Z.; Jacobson, K.A.; et al. Subtle Chemical Changes Cross the Boundary between Agonist and Antagonist: New A3 Adenosine Receptor Homology Models and Structural Network Analysis Can Predict This Boundary. J. Med. Chem. 2021, 64, 12525–12536. [Google Scholar] [CrossRef]
- Gao, Z.G.; Blaustein, J.B.; Gross, A.S.; Melman, N.; Jacobson, K.A. N6-Substituted adenosine derivatives: Selectivity, efficacy, and species differences at A3 adenosine receptors. Biochem Pharmacol. 2003, 65, 1675–1684. [Google Scholar] [CrossRef] [Green Version]
- Nogueira, V.; Hay, N. Molecular pathways: Reactive oxygen species homeostasis in cancer cells and implications for cancer therapy. Clin. Cancer Res. 2013, 19, 4309–4314. [Google Scholar] [CrossRef] [PubMed] [Green Version]
- Milkovic, L.; Gasparovic, A.C.; Cindric, M.; Mouthuy, P.A.; Zarkovic, N. Short Overview of ROS as Cell Function Regulators and Their Implications in Therapy Concepts. Cells 2019, 8, 793. [Google Scholar] [CrossRef] [PubMed] [Green Version]
- Park, J.; Lee, J.; Choi, C. Mitochondrial network determines intracellular ROS dynamics and sensitivity to oxidative stress through switching inter-mitochondrial messengers. PLoS ONE 2011, 6, e23211. [Google Scholar] [CrossRef]
- Schrödinger Release 2022-2: Maestro; Schrödinger, LLC: New York, NY, USA, 2021.
- Cousins, K.R. Computer Review of ChemDraw Ultra 12.0. J. Am. Chem. Soc. 2011, 133, 8388. [Google Scholar] [CrossRef]
- Schrödinger Release 2022-2: LigPrep; Schrödinger, LLC: New York, NY, USA, 2021.
- Greenwood, J.R.; Calkins, D.; Sullivan, A.P.; Shelley, J.C. Towards the comprehensive, rapid, and accurate prediction of the favorable tautomeric states of drug-like molecules in aqueous solution. J. Comput. Aided Mol. Des. 2010, 24, 591–604. [Google Scholar] [CrossRef]
- Shelley, J.C.; Cholleti, A.; Frye, L.; Greenwood, J.R.; Timlin, M.R.; Uchimaya, M. Epik: A software program for pKa prediction and protonation state generation for drug-like molecules. J. Comput. Aid. Mol. Des. 2007, 21, 681–691. [Google Scholar] [CrossRef]
- Sastry, G.M.; Adzhigirey, M.; Day, T.; Annabhimoju, R.; Sherman, W. Protein and ligand preparation: Parameters, protocols, and influence on virtual screening enrichments. J. Comput. Aid. Mol. Des. 2013, 27, 221–234. [Google Scholar] [CrossRef]
- Friesner, R.A.; Murphy, R.B.; Repasky, M.P.; Frye, L.L.; Greenwood, J.R.; Halgren, T.A.; Sanschagrin, P.C.; Mainz, D.T. Extra Precision Glide: Docking and Scoring Incorporating a Model of Hydrophobic Enclosure for Protein-Ligand Complex-es. J. Med. Chem. 2006, 49, 6177–6196. [Google Scholar] [CrossRef] [Green Version]
- Halgren, T.A.; Murphy, R.B.; Friesner, R.A.; Beard, H.S.; Frye, L.L.; Pollard, W.T.; Banks, J.L. Glide: A New Approach for Rapid, Accurate Docking and Scoring. 2. Enrichment Factors in Database Screening. J. Med. Chem. 2004, 47, 1750–1759. [Google Scholar] [CrossRef]
- Friesner, R.A.; Banks, J.L.; Murphy, R.B.; Halgren, T.A.; Klicic, J.J.; Mainz, D.T.; Repasky, M.P.; Knoll, E.H.; Shaw, D.E.; Shelley, M.; et al. Glide: A New Approach for Rapid, Accurate Docking and Scoring. 1. Method and Assessment of Docking Accuracy. J. Med. Chem. 2004, 47, 1739–1749. [Google Scholar] [CrossRef]


 | |||||
| Compound | R1 | Percentage Inhibition (%) at 10 μM a | |||
| hA1 AR | hA2A AR | hA2B AR | hA3 AR | ||
| 9a | 3-F-4-OCH3 | 99 ± 1 | 58 ± 1 | 72 ± 2 | 97 ± 1 |
| 9b | 3,5-(OCH3)2 | 99 ± 1 | 84 ± 4 | 62 ± 2 | 93 ± 1 |
| 9c | 3-OCH3-4-Cl | 99 ± 1 | 94 ± 3 | 90 ± 1 | 95 ± 1 |
| 9d | 3-CF3 | 69 ± 2 | 40 ± 5 | 74 ± 1 | 95 ± 1 |
| 9e | 3,5-(CH3)2 | 96 ± 3 | 58 ± 3 | 42 ± 2 | 92 ± 1 |
| 9f | 4-N-piperidine | 28 ± 1 | 28 ± 3 | 44 ± 4 | 38 ± 1 |
| 9g | 2,4-(CH3)2 | 99 ± 1 | 80 ± 4 | 47 ± 2 | 91 ± 1 |
| Compound | R1 | Ki(nM) a | Selectivity (hA1 AR:hA3 AR) | |
|---|---|---|---|---|
| hA1 AR | hA3 AR | |||
| 9a | 3-F-4-OCH3 | 139.3 | 55.5 | 2.51 |
| 9b | 3,5-(OCH3)2 | 69.7 | ND | - |
| 9c | 3-OCH3-4-Cl | 57.9 | 661.1 | 0.0875 |
| 9d | 3-CF3 | ND | 1258 | - |
| 9e | 3,5-(CH3)2 | 872.1 | ND | - |
| 9f | 4-N-piperidine | ND | ND | - |
| 9g | 2,4-(CH3)2 | 116.5 | ND | - |
 | |||||
| Compound | R2 | Percentage Inhibition (%) at 10 μM a | |||
| hA1 AR | hA2A AR | hA2B AR | hA3 AR | ||
| 9a | 4-OH | 99 ± 1 | 56 ± 3 | 66 ± 3 | 97 ± 1 |
| 11a | 4-OCH3 | 95 ± 1 | 83 ± 1 | 65 ± 2 | 97 ± 1 |
| 11b | 4-F | 98 ± 1 | 49 ± 1 | 56 ± 1 | 95 ± 4 |
| 11c | 4-OCF3 | 48 ± 4 | 81 ± 1 | 27 ± 6 | 60 ± 1 |
| 11d | 4-CF3 | 74 ± 1 | 30 ± 1 | 93 ± 3 | 79 ± 1 |
| 11e | 4-CN | 45 ± 5 | 50 ± 2 | 52 ± 1 | 72 ± 3 |
| 11f | 4-C(O)OCH3 | 52 ± 1 | 35 ± 6 | 55 ± 2 | 85 ± 1 |
| 11g | 4-C(O)OCH2CH3 | 56 ± 1 | 48 ± 6 | 35 ± 2 | 78 ± 3 |
| 11h | 3,5-diF-4-OH | 88 ± 1 | 26 ± 5 | 66 ± 6 | 79 ± 1 |
| 11i | 3-NO2-4-F | 53 ± 1 | 57 ± 2 | 72 ± 6 | 83 ± 1 |
| Compound | R2 | Ki (nM) a | Selectivity (hA1 AR:hA3 AR) | |
|---|---|---|---|---|
| hA1 AR | hA3 AR | |||
| 9a | 4-OH | 139.3 | 55.5 | 2.51 |
| 11a | 4-OCH3 | 78.1 | 13.3 | 5.87 |
| 11b | 4-F | 98.3 | 56.6 | 1.74 |
Publisher’s Note: MDPI stays neutral with regard to jurisdictional claims in published maps and institutional affiliations. |
© 2022 by the authors. Licensee MDPI, Basel, Switzerland. This article is an open access article distributed under the terms and conditions of the Creative Commons Attribution (CC BY) license (https://creativecommons.org/licenses/by/4.0/).
Share and Cite
Park, S.; Ahn, Y.; Kim, Y.; Roh, E.J.; Lee, Y.; Han, C.; Yoo, H.M.; Yu, J. Design, Synthesis and Biological Evaluation of 1,3,5-Triazine Derivatives Targeting hA1 and hA3 Adenosine Receptor. Molecules 2022, 27, 4016. https://doi.org/10.3390/molecules27134016
Park S, Ahn Y, Kim Y, Roh EJ, Lee Y, Han C, Yoo HM, Yu J. Design, Synthesis and Biological Evaluation of 1,3,5-Triazine Derivatives Targeting hA1 and hA3 Adenosine Receptor. Molecules. 2022; 27(13):4016. https://doi.org/10.3390/molecules27134016
Chicago/Turabian StylePark, Sujin, Yujin Ahn, Yongchan Kim, Eun Joo Roh, Yoonji Lee, Chaebin Han, Hee Min Yoo, and Jinha Yu. 2022. "Design, Synthesis and Biological Evaluation of 1,3,5-Triazine Derivatives Targeting hA1 and hA3 Adenosine Receptor" Molecules 27, no. 13: 4016. https://doi.org/10.3390/molecules27134016
APA StylePark, S., Ahn, Y., Kim, Y., Roh, E. J., Lee, Y., Han, C., Yoo, H. M., & Yu, J. (2022). Design, Synthesis and Biological Evaluation of 1,3,5-Triazine Derivatives Targeting hA1 and hA3 Adenosine Receptor. Molecules, 27(13), 4016. https://doi.org/10.3390/molecules27134016