
Attachment of Single-Stranded DNA to Certain SERS-Active Gold and Silver Substrates: Selected Practical Tips


Abstract
1. Introduction
2. Results and Discussion
2.1. Modification of the Adsorption Procedure
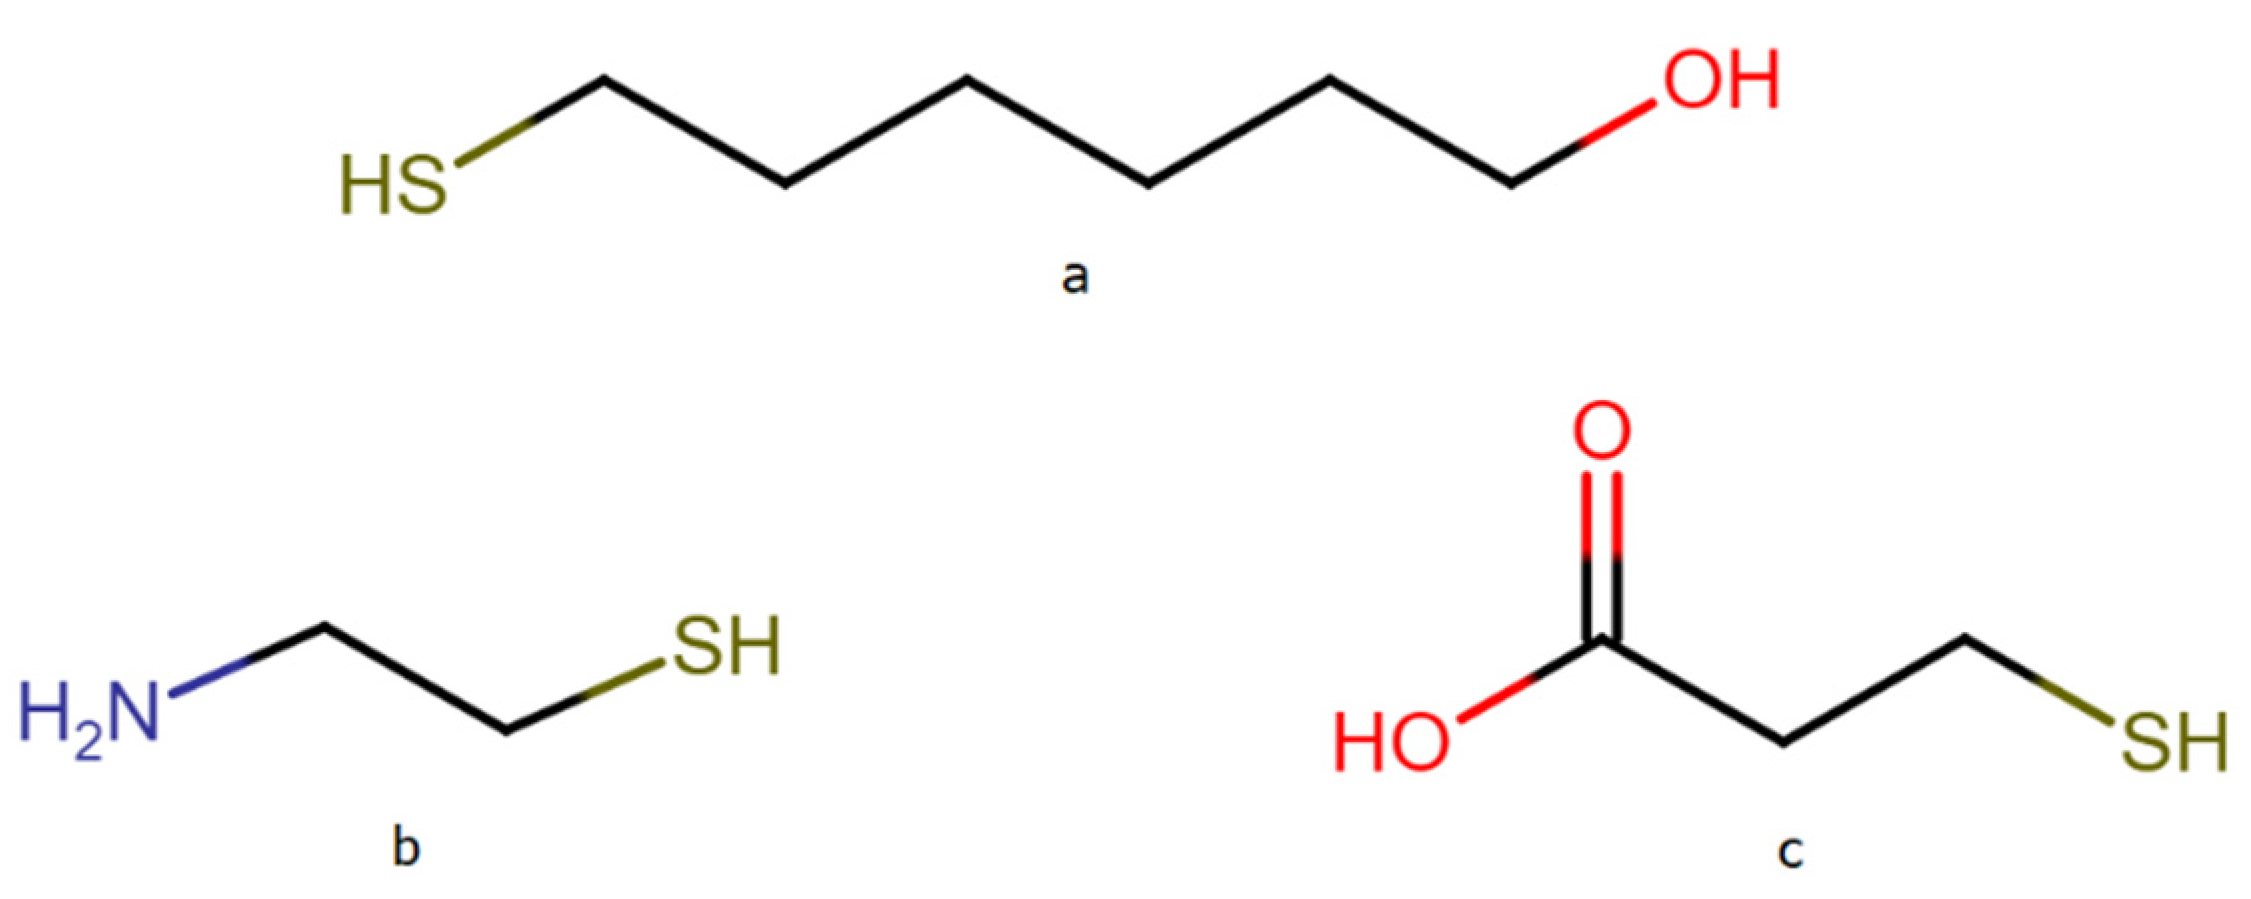
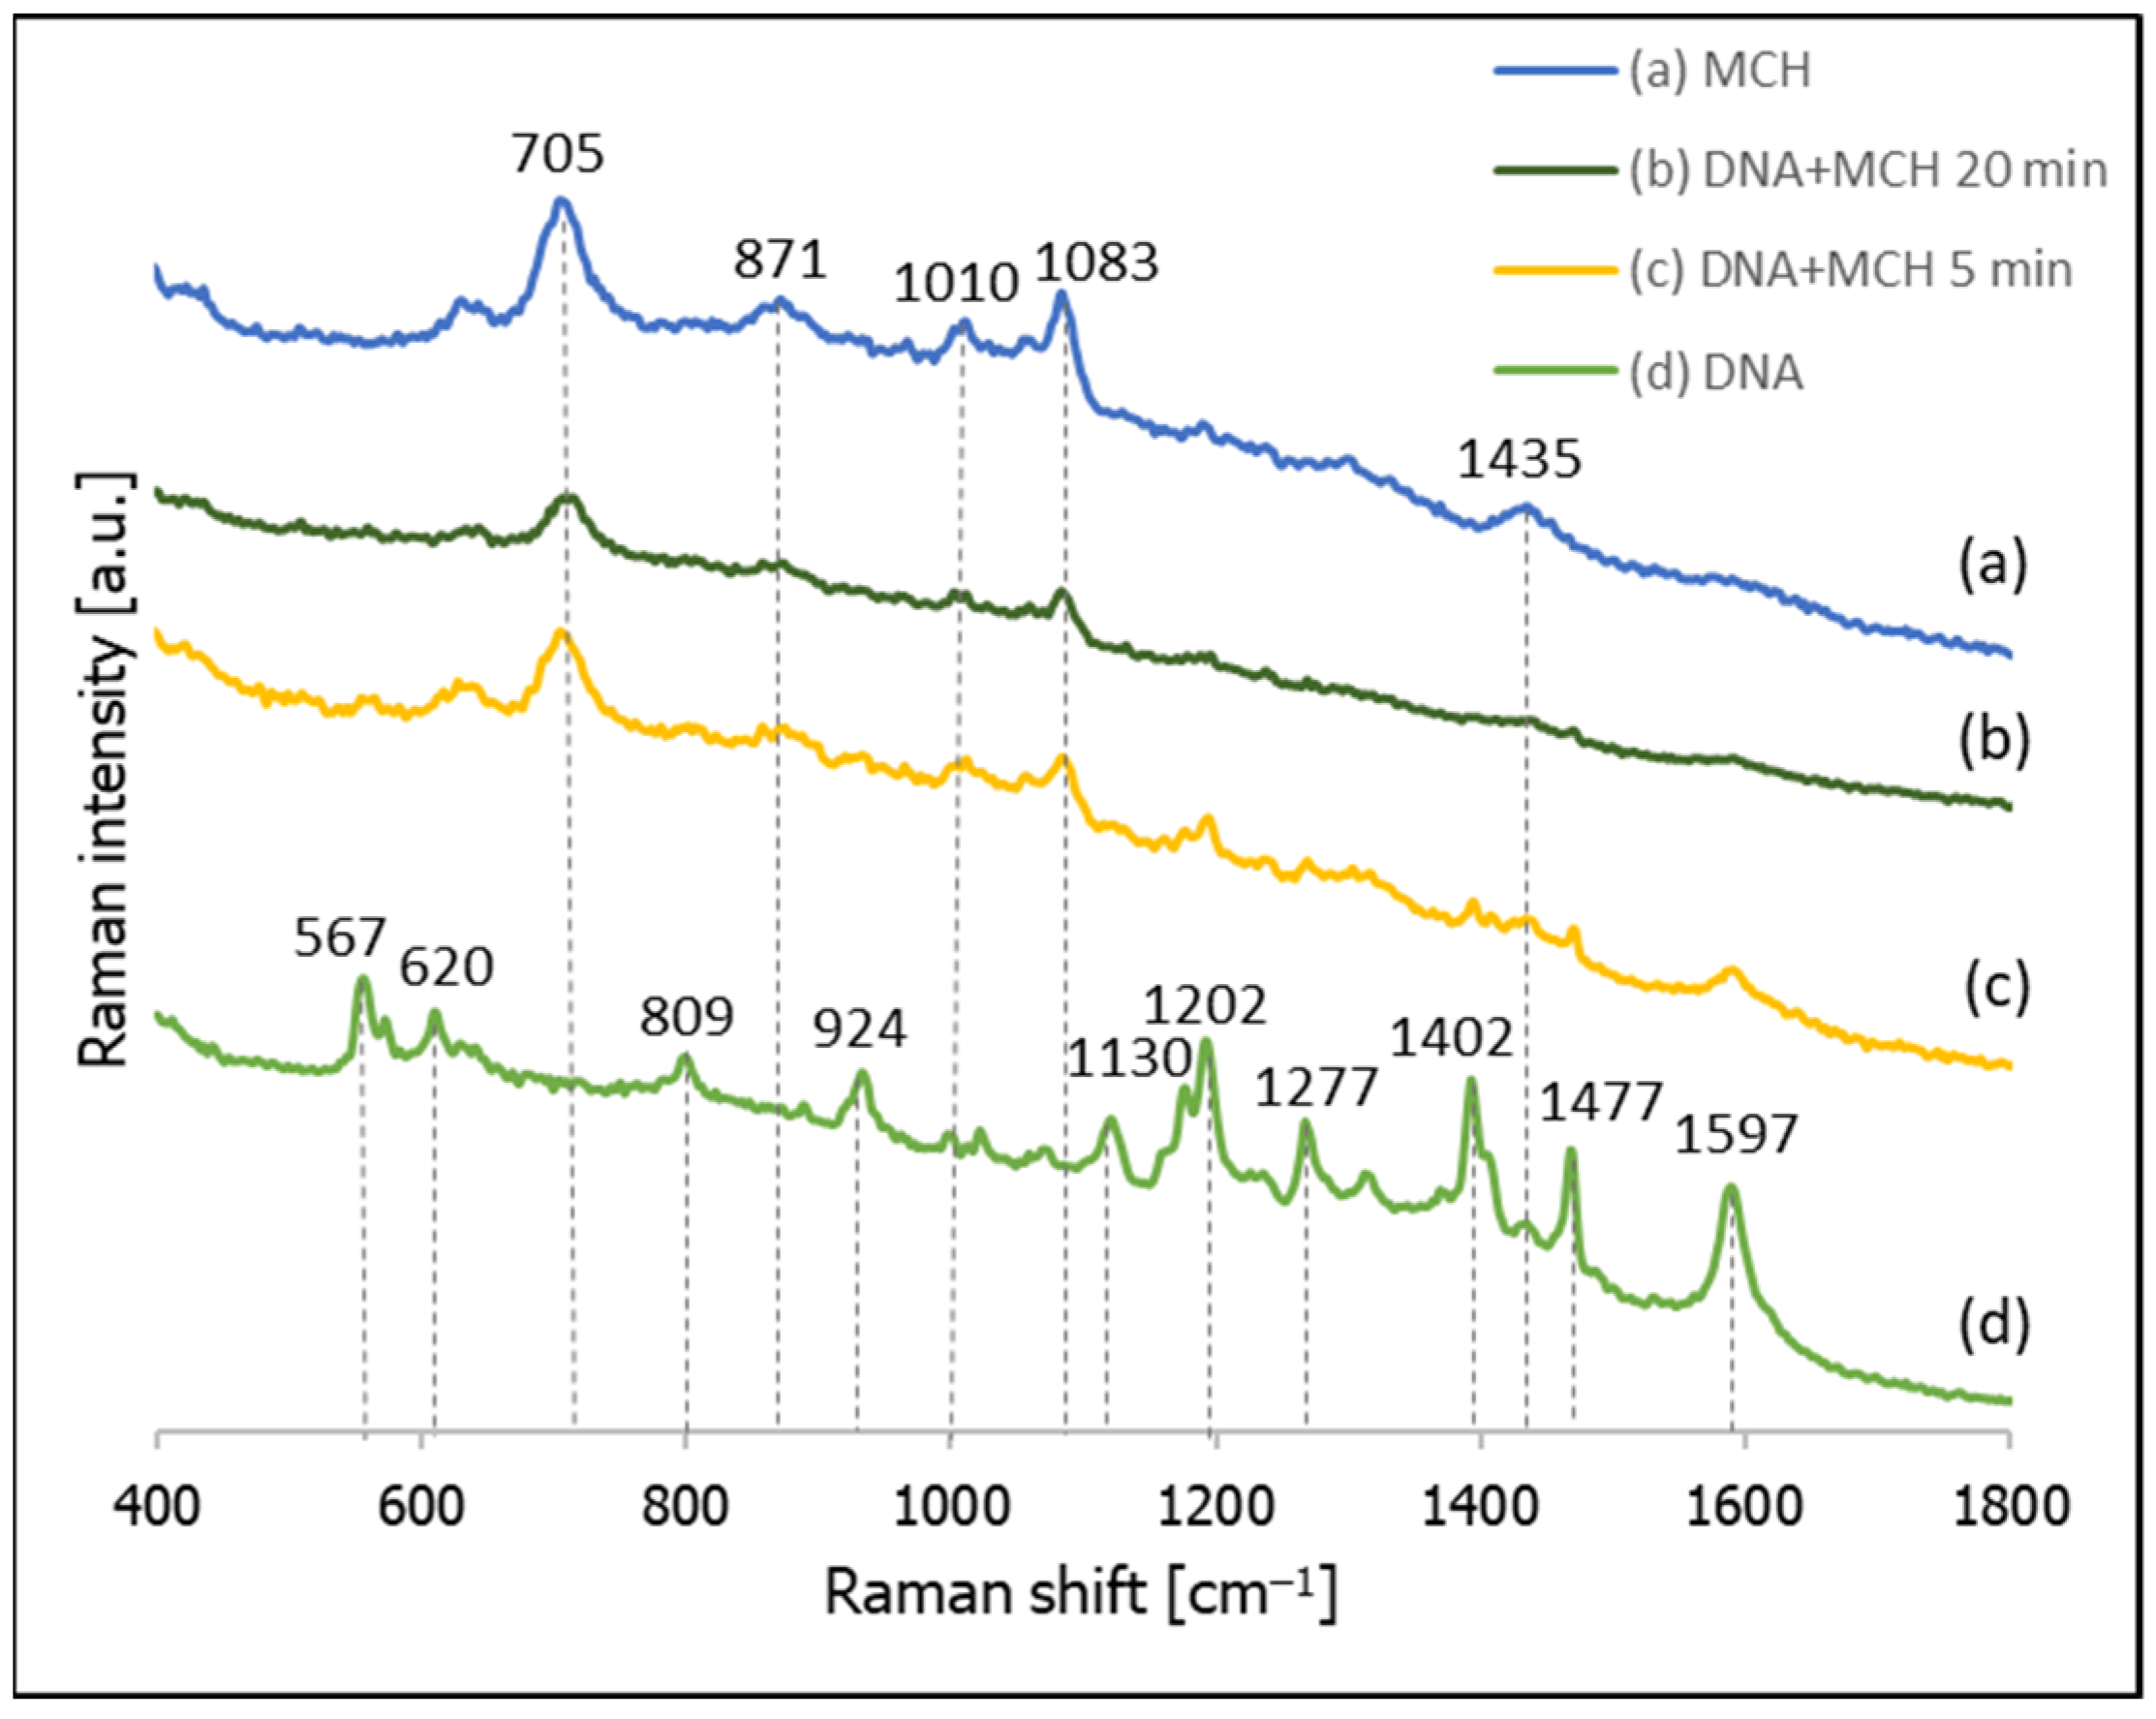
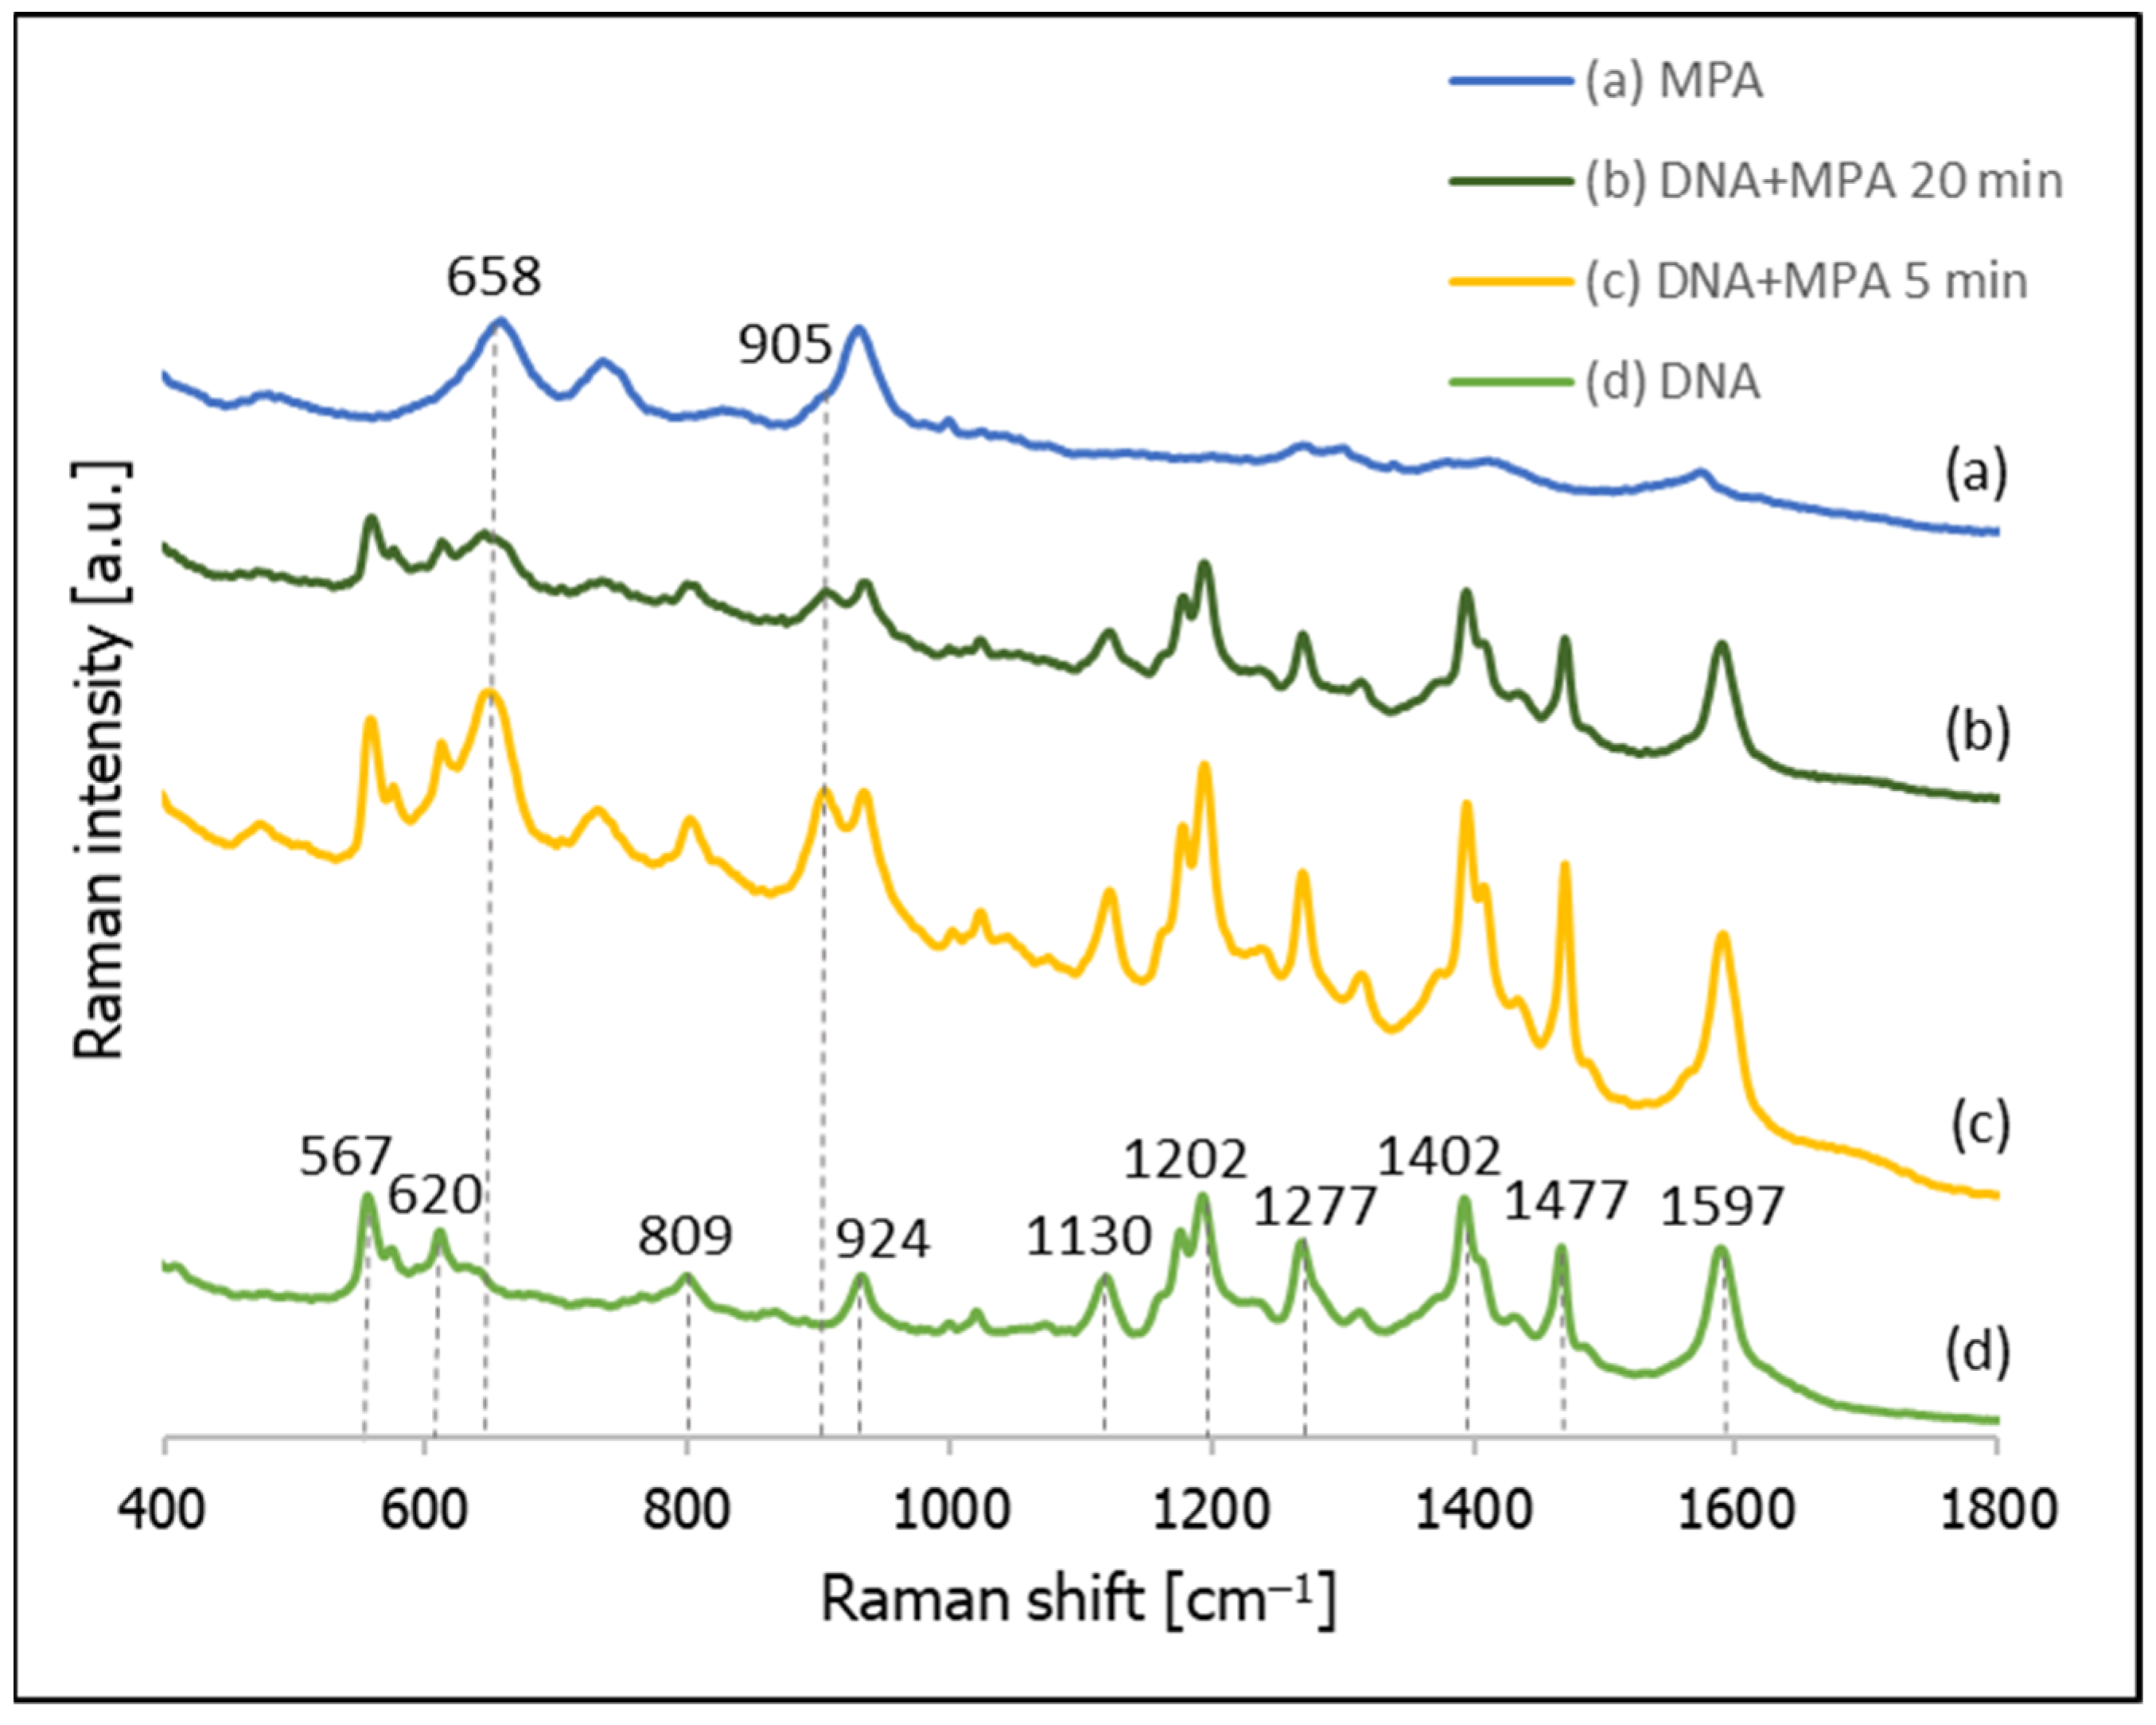
2.2. Influence of Chemisorption of Various Alkanethiols Used for Preventing Contact between the DNA Backbones and the Metal Surface
3. Materials and Methods
4. Conclusions
Supplementary Materials
Author Contributions
Funding
Institutional Review Board Statement
Informed Consent Statement
Data Availability Statement
Conflicts of Interest
Sample Availability
References
- Drummond, T.G.; Hill, M.G.; Barton, J.K. Electrochemical DNA sensors. Nat. Biotechnol. 2003, 21, 1192–1199. [Google Scholar] [CrossRef]
- Diehl, F.; Schmidt, K.; Choti, M.A.; Romans, K.; Goodman, S.; Li, M.; Thornton, K.; Agrawal, N.; Sokoll, L.; Szabo, S.A.; et al. Circulating mutant DNA to assess tumor dynamics. Nat. Med. 2008, 14, 985–990. [Google Scholar] [CrossRef]
- Shu, Y.; Wu, X.; Tong, X.; Wang, X.; Chang, Z.; Mao, Y.; Chen, X.; Sun, J.; Wang, Z.; Hong, Z.; et al. Circulating tumor DNA mutation profiling by targeted next generation sequencing provides guidance for personalized treatments in multiple cancer types. Sci. Rep. 2017, 7, 583. [Google Scholar] [CrossRef]
- Darawi, M.N.; Ai-Vyrn, C.; Ramasamy, K.; Hua, P.P.J.; Pin, T.M.; Kamaruzzaman, S.B.; Majeed, A.B.A. Allele-specific polymerase chain reaction for the detection of Alzheimer’s disease-related single nucleotide polymorphisms. BMC Med. Genet. 2013, 14, 27. [Google Scholar] [CrossRef] [PubMed]
- Chen, X.; Roozbahani, G.M.; Ye, Z.; Zhang, Y.; Ma, R.; Xiang, J.; Guan, X. Label-free detection of DNA mutations by nanopore analysis. ACS Appl. Mater. Interfaces 2018, 10, 11519–11528. [Google Scholar] [CrossRef]
- Patolsky, F.; Lichtenstein, A.; Willner, I. Detection of single-base DNA mutations by enzyme-amplified electronic transduction. Nat. Biotechnol. 2001, 19, 253–257. [Google Scholar] [CrossRef] [PubMed]
- Culha, M.; Stokes, D.; Allain, L.R.; Vo-Dinh, T. Surface-enhanced Raman scattering substrate based on a self-assembled monolayer for use in gene diagnostics. Anal. Chem. 2003, 75, 6196–6201. [Google Scholar] [CrossRef] [PubMed]
- Lee, S.; Ongko, A.; Kim, H.Y.; Yim, S.-G.; Jeon, G.; Jeong, H.J.; Lee, S.; Kwak, M.; Yang, S.Y. Sub-100 nm gold nanohole-enhanced Raman scattering on flexible PDMS sheets. Nanotechnology 2016, 27, 315301. [Google Scholar] [CrossRef]
- Wang, H.-N.; Vo-Dinh, T.V. Multiplex detection of breast cancer biomarkers using plasmonic molecular sentinel nanoprobes. Nanotechnology 2009, 20, 065101. [Google Scholar] [CrossRef]
- Wang, H.-N.; Dhawan, A.; Du YBatchelor, D.; Leonard, D.N.; Misrad, V.; Vo-Dinh, T. Molecular sentinel-on-chip for SERS-based biosensing. Phys. Chem. Chem. Phys. 2013, 15, 6008–6015. [Google Scholar] [CrossRef]
- Wu, L.; Garrido-Maestu, A.; Guerreiro, J.R.L.; Carvalho, S.; Abalde-Cela, S.; Prado, M.; Diéguez, L. Amplification-free SERS analysis of DNA mutation in cancer cells with single-base sensitivity. Nanoscale 2019, 11, 7781–7789. [Google Scholar] [CrossRef] [PubMed]
- Culha, M.; Stokes, D.; Vo-Dinh, T. Surface-enhanced Raman scattering for cancer diagnostics: Detection of the BCL2 gene. Expert Rev. Mol. Diagn. 2003, 3, 669–675. [Google Scholar] [CrossRef] [PubMed]
- Zengin, A.; Tamer, U.; Caykara, T. SERS detection of hepatitis B virus DNA in a temperature-responsive sandwich-hybridization assay. J. Raman Spectrosc. 2017, 48, 668–672. [Google Scholar] [CrossRef]
- Kang, T.; Yoo, S.M.; Yoon, I.; Lee, S.Y.; Kim, B. Patterned multiplex pathogen DNA detection by Au particle-on-wire SERS sensor. Nano Lett. 2010, 10, 1189–1193. [Google Scholar] [CrossRef] [PubMed]
- Khalil, I.; Yehye, W.A.; Muhd Julkapli, N.; Sina, A.A.; Rahmati, S.; Basirun, W.J.; Seyfoddin, A. Dual platform based sandwich assay surface-enhanced Raman scattering DNA biosensor for the sensitive detection of food adulteration. Analyst 2020, 145, 1414–14268. [Google Scholar] [CrossRef] [PubMed]
- Wang, X.; Choi, N.; Cheng, Z.; Ko, J.; Chen, L.; Choo, J. Simultaneous detection of dual nucleic acids using a SERS-based lateral flow assay biosensor. Anal. Chem. 2017, 89, 1163–1169. [Google Scholar] [CrossRef]
- Graham, D.; Thompson, D.G.; Smith, W.E.; Faulds, K. Control of enhanced Raman scattering using a DNA-based assembly process of dye-coded nanoparticles. Nat. Nanotechnol. 2008, 3, 548–551. [Google Scholar] [CrossRef]
- Kowalczyk, A.; Krajczewski, J.; Kowalik, A.; Weyher, J.L.; Dziecielewski, I.; Chłopek, M.; Gozdz, S.; Nowicka, A.M.; Kudelski, A. New strategy for the gene mutation identification using surface enhanced Raman spectroscopy (SERS). Biosens. Bioelectron. 2019, 132, 326–332. [Google Scholar] [CrossRef]
- Pyrak, E.; Krajczewski, J.; Kowalik, A.; Kudelski, A.; Jaworska, A. Surface enhanced Raman spectroscopy for DNA biosensors—How far are we? Molecules 2019, 24, 4423. [Google Scholar] [CrossRef]
- Aroca, R. Surface-Enhanced Vibrational Spectroscopy; John Wiley & Sons: Chichester, UK, 2006. [Google Scholar]
- Szaniawska, A.; Kudelski, A. Applications of surface-enhanced Raman scattering in biochemical and medical analysis. Front. Chem. 2021, 9, 664134. [Google Scholar] [CrossRef]
- Nie, S.; Emory, S.R. Probing single molecules and single nanoparticles by surface-enhanced Raman scattering. Science 1997, 275, 1102–1106. [Google Scholar] [CrossRef]
- Kneipp, J.; Kneipp, H.; Kneipp, K. SERS—A single-molecule and nanoscale tool for bioanalytics. Chem. Soc. Rev. 2008, 37, 1052–1060. [Google Scholar] [CrossRef] [PubMed]
- Zhou, W.; Tian, Y.F.; Yin, B.C.; Ye, B.C. Simultaneous surface-enhanced Raman spectroscopy detection of multiplexed microRNA biomarkers. Anal. Chem. 2017, 89, 6120–6128. [Google Scholar] [CrossRef] [PubMed]
- Guo, R.; Yin, F.; Sun, Y.; Mi, L.; Shi, L.; Tian, Z.; Li, T. Ultrasensitive simultaneous detection of multiplex disease-related nucleic acids using double-enhanced surface-enhanced Raman scattering nanosensors. ACS Appl. Mater. Interfaces 2018, 10, 25770–25778. [Google Scholar] [CrossRef] [PubMed]
- Pang, Y.; Wang, C.; Lu, L.C.; Wang, C.; Sun, Z.; Xiao, R. Dual-SERS biosensor for one-step detection of microRNAs in exosome and residual plasma of blood samples for diagnosing pancreatic cancer. Biosens. Bioelectron. 2019, 130, 204–213. [Google Scholar] [CrossRef] [PubMed]
- Lee, J.U.; Kim, W.H.; Lee, H.S.; Park, K.H.; Sim, S.J. Quantitative and specific detection of exosomal miRNAs for accurate diagnosis of breast cancer using a surface-enhanced Raman scattering sensor based on plasmonic head-flocked gold nanopillars. Small 2019, 15, 1804968. [Google Scholar] [CrossRef]
- Jiang, T.; Minunni, M.; Wilson, P.; Zhang, J.; Turner, A.P.F.; Mascini, M. Detection of TP53 mutation using a portable surface plasmon resonance DNA-based biosensor. Biosens. Bioelectron. 2005, 20, 1939–1945. [Google Scholar] [CrossRef] [PubMed]
- Liu, B.; Liu, J. Freezing directed construction of bio/nano interfaces: Reagentless conjugation, denser spherical nucleic acids, and better nanoflares. J. Am. Chem. Soc. 2017, 139, 9471–9474. [Google Scholar] [CrossRef]
- Liu, B.; Wu, T.; Huang, Z.; Liu, Y.; Liu, J. Freezing-directed stretching and alignment of DNA oligonucleotides. Angew. Chem. Int. Ed. Engl. 2019, 58, 2109–2113. [Google Scholar] [CrossRef]
- Liu, B.; Liu, J. Freezing-driven DNA adsorption on gold nanoparticles: Tolerating extremely low salt concentration but requiring high DNA concentration. Langmuir 2019, 35, 6476–6482. [Google Scholar] [CrossRef]
- Kudelski, A. Characterization of thiolate-based mono- and bilayers by vibrational spectroscopy: A review. Vib. Spectrosc. 2005, 39, 200–213. [Google Scholar] [CrossRef]
- Levicky, R.; Herne, T.M.; Tarlov, M.J.; Satija, S.K. Using self-assembly to control the structure of DNA monolayers on gold: A neutron reflectivity study. J. Am. Chem. Soc. 1998, 120, 9787–9792. [Google Scholar] [CrossRef]
- Carpini, G.; Lucarelli, F.; Marrazza, G.; Mascini, M. Oligonucleotide-modified screen-printed gold electrodes for enzyme-amplified sensing of nucleic acids. Biosens. Bioelectron. 2004, 20, 167–175. [Google Scholar] [CrossRef] [PubMed]
- Whitesides, G.M.; Laibinis, P.E. Wet chemical approaches to the characterization of organic surfaces: Self-assembled monolayers, wetting, and the physical-organic chemistry of the solid-liquid interface. Langmuir 1990, 6, 87–96. [Google Scholar] [CrossRef]
- Bain, C.D.; Whitesides, G.M. Modeling organic surfaces with self-assembled monolayers. Angew. Chem. Int. Ed. Engl. 1989, 28, 506–512. [Google Scholar] [CrossRef]
- Bryant, M.A.; Pemberton, J.E. Surface Raman scattering of self-assembled monolayers formed from 1-alkanethiols: Behavior of films at gold and comparison to films at silver. J. Am. Chem. Soc. 1991, 113, 8284–8293. [Google Scholar] [CrossRef]
- Joo, T.H.; Kim, K.; Kim, M.S. Surface-enhanced Raman scattering (SERS) of 1-propanethiol in silver sol. J. Phys. Chem. 1986, 90, 5816–5819. [Google Scholar] [CrossRef]
- Bryant, M.A.; Pemberton, J.E. Surface Raman scattering of self-assembled monolayers formed from 1-alkanethiols at silver [electrodes]. J. Am. Chem. Soc. 1991, 113, 3629–3637. [Google Scholar] [CrossRef]
- Otto, C.; van den Tweel, T.J.J.; de Mul, F.F.M.; Greve, J. Surface-enhanced Raman spectroscopy of DNA bases. J. Raman Spectrosc. 1986, 17, 289–298. [Google Scholar] [CrossRef]
- Priyadarshini, E.; Pradhan, N. Metal-induced aggregation of valine capped gold nanoparticles: An efficient and rapid approach for colorimetric detection of Pb2+ ions. Sci. Rep. 2017, 7, 9278. [Google Scholar] [CrossRef]
- Krajczewski, J.; Kołataj, K.; Kudelski, A. Plasmonic nanoparticles in chemical analysis. RSC Adv. 2017, 7, 17559–17576. [Google Scholar] [CrossRef]
- Moerl, L.; Pettinger, B. The role of Cu atoms on silver electrodes in surface enhanced Raman scattering from pyridine: Giant enhancement by a minority of adsorbed molecules. Solid State Commun. 1982, 43, 315–320. [Google Scholar] [CrossRef]
- Kudelski, A.; Pettinger, B. SERS on carbon chain segments: Monitoring locally surface chemistry. Chem. Phys. Lett. 2000, 321, 356–362. [Google Scholar] [CrossRef]
- Jang, N.H. The coordination chemistry of DNA nucleosides on gold nanoparticles as a probe by SERS. Bullet. Korean Chem. Soc. 2002, 23, 1790–1800. [Google Scholar]
- Pyrak, E.; Jaworska, A.; Kudelski, A. SERS studies of adsorption on gold surfaces of mononucleotides with attached hexanethiol moiety: Comparison with selected single-stranded thiolated DNA fragments. Molecules 2019, 24, 3921. [Google Scholar] [CrossRef] [PubMed]
- Kudelski, A. Raman study on the structure of 3-mercaptopropionic acid monolayers on silver. Surf. Sci. 2002, 502–503, 219–223. [Google Scholar] [CrossRef]


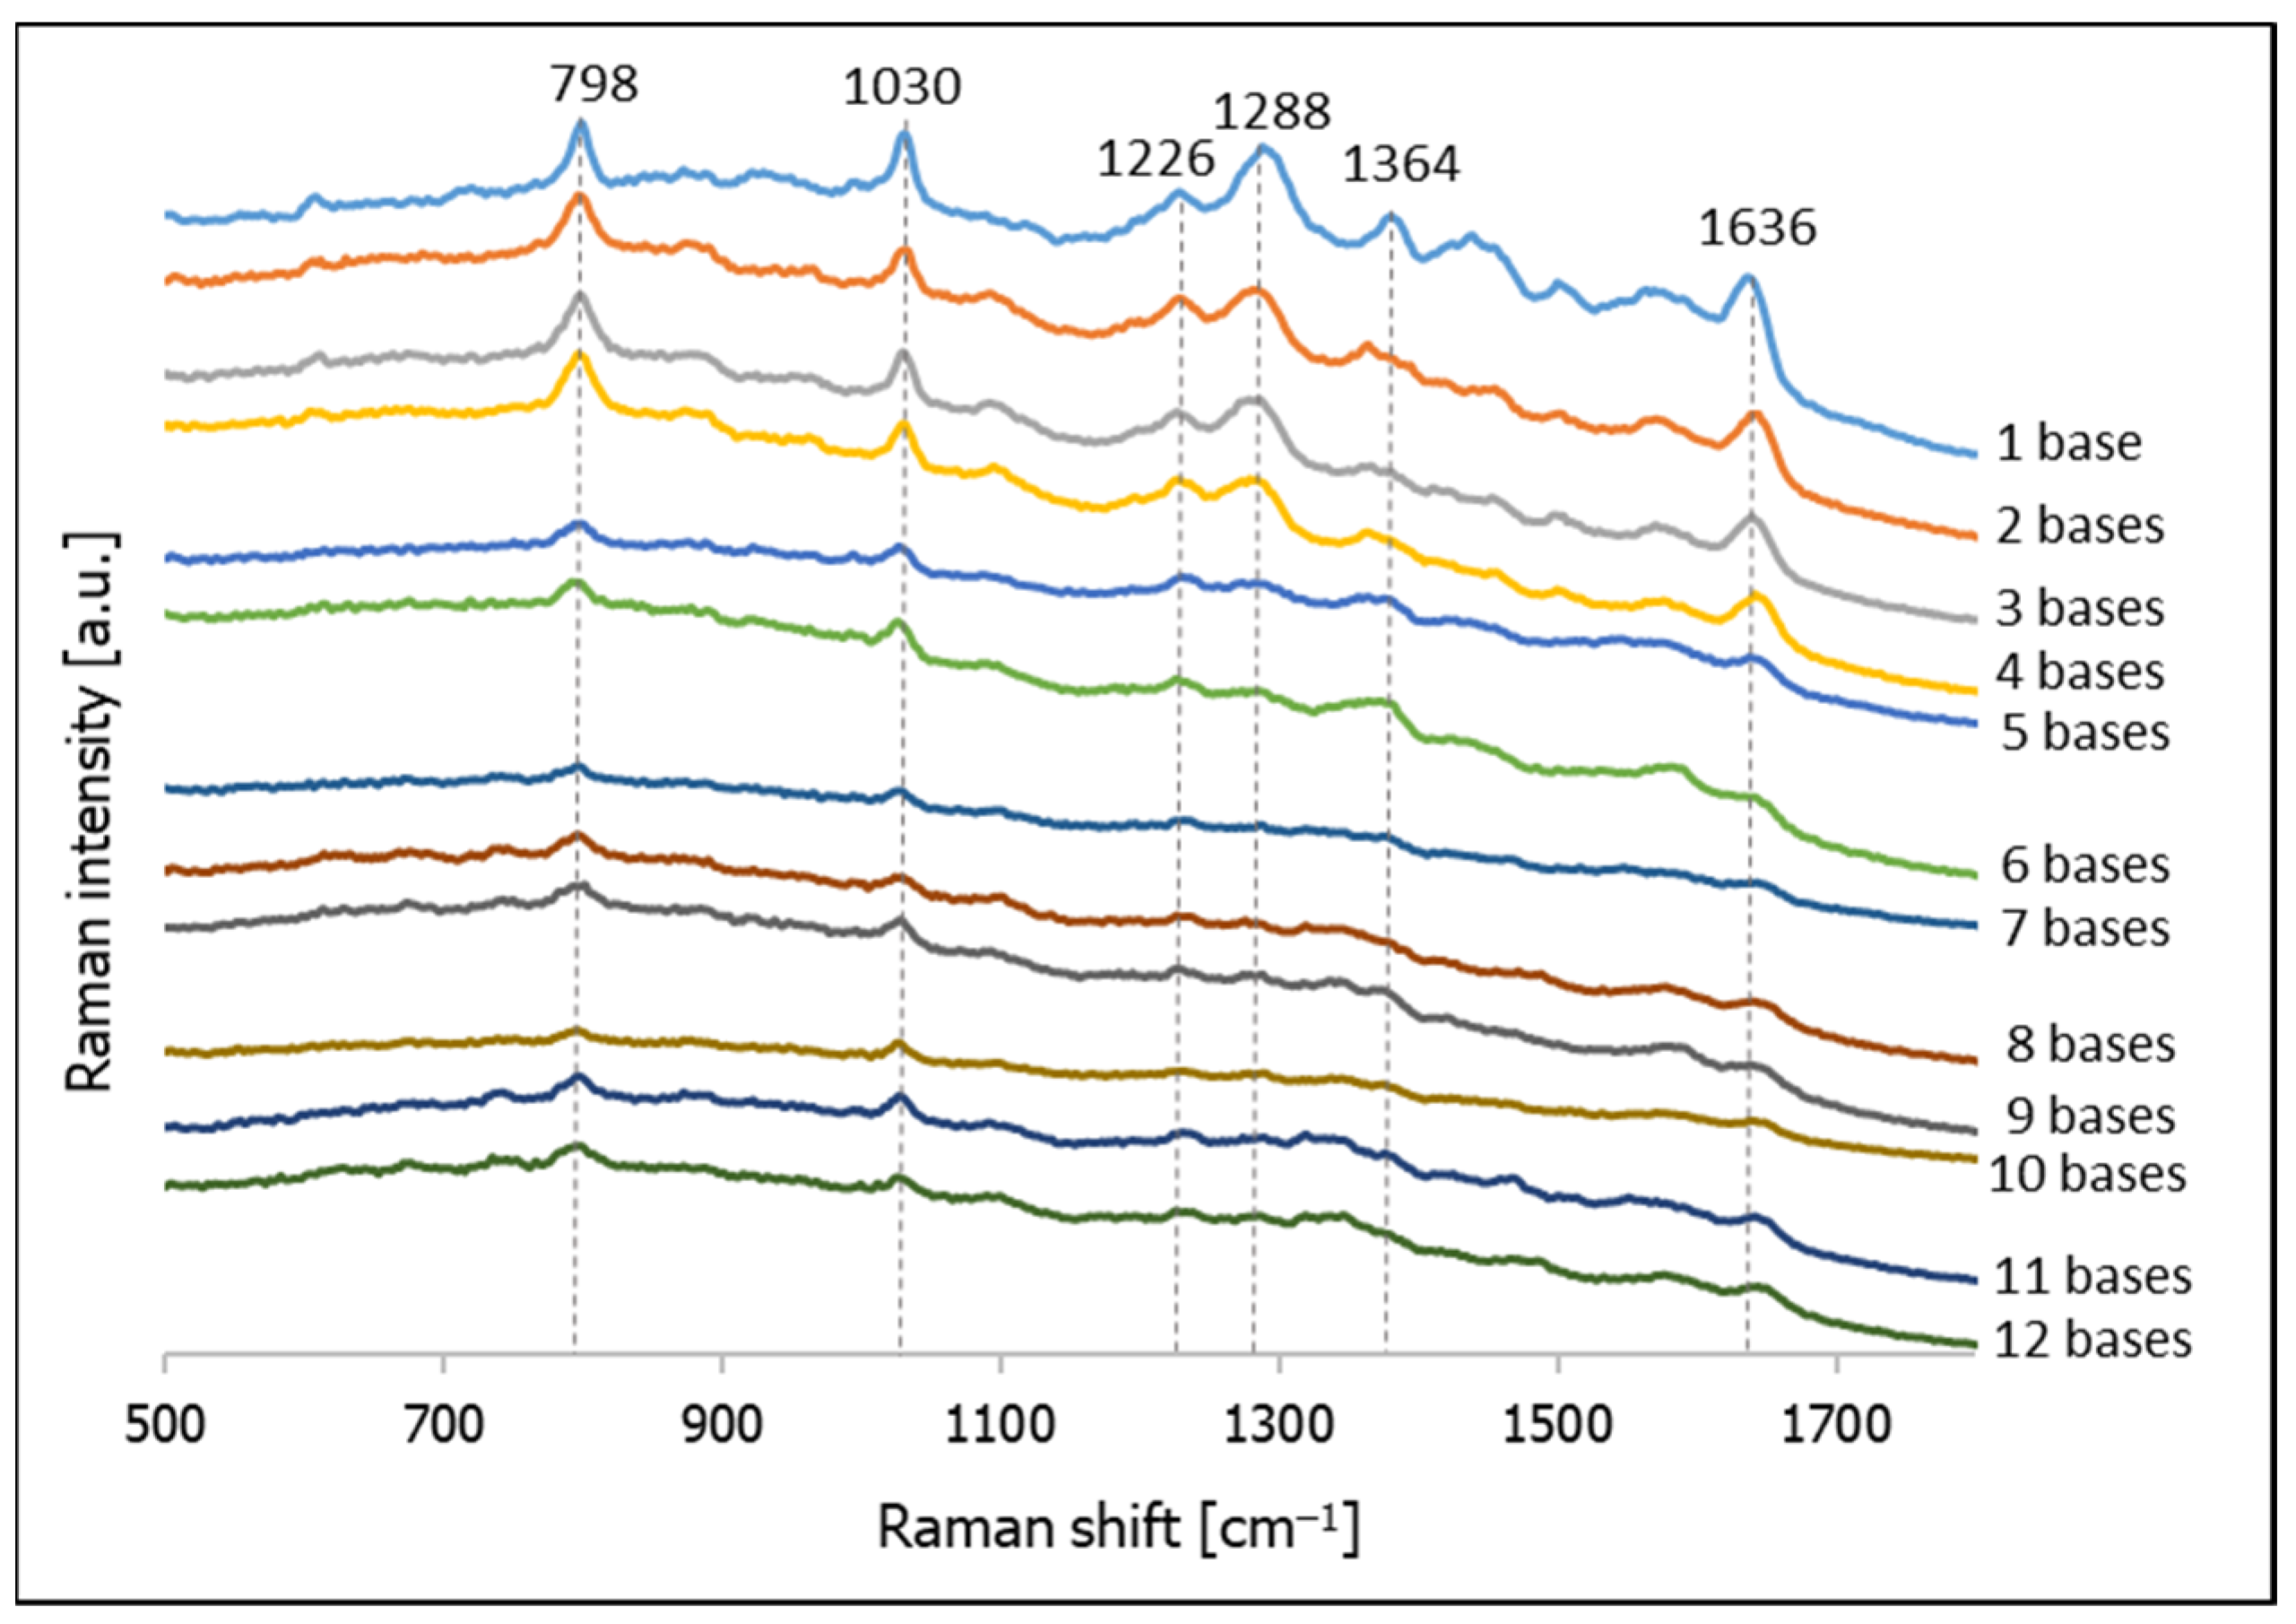
| DNA Composed of Following Number of Bases: | Assignments [40,45,46] | |||||||||||
|---|---|---|---|---|---|---|---|---|---|---|---|---|
| 1 | 2 | 3 | 4 | 5 | 6 | 7 | 8 | 9 | 10 | 11 | 12 | |
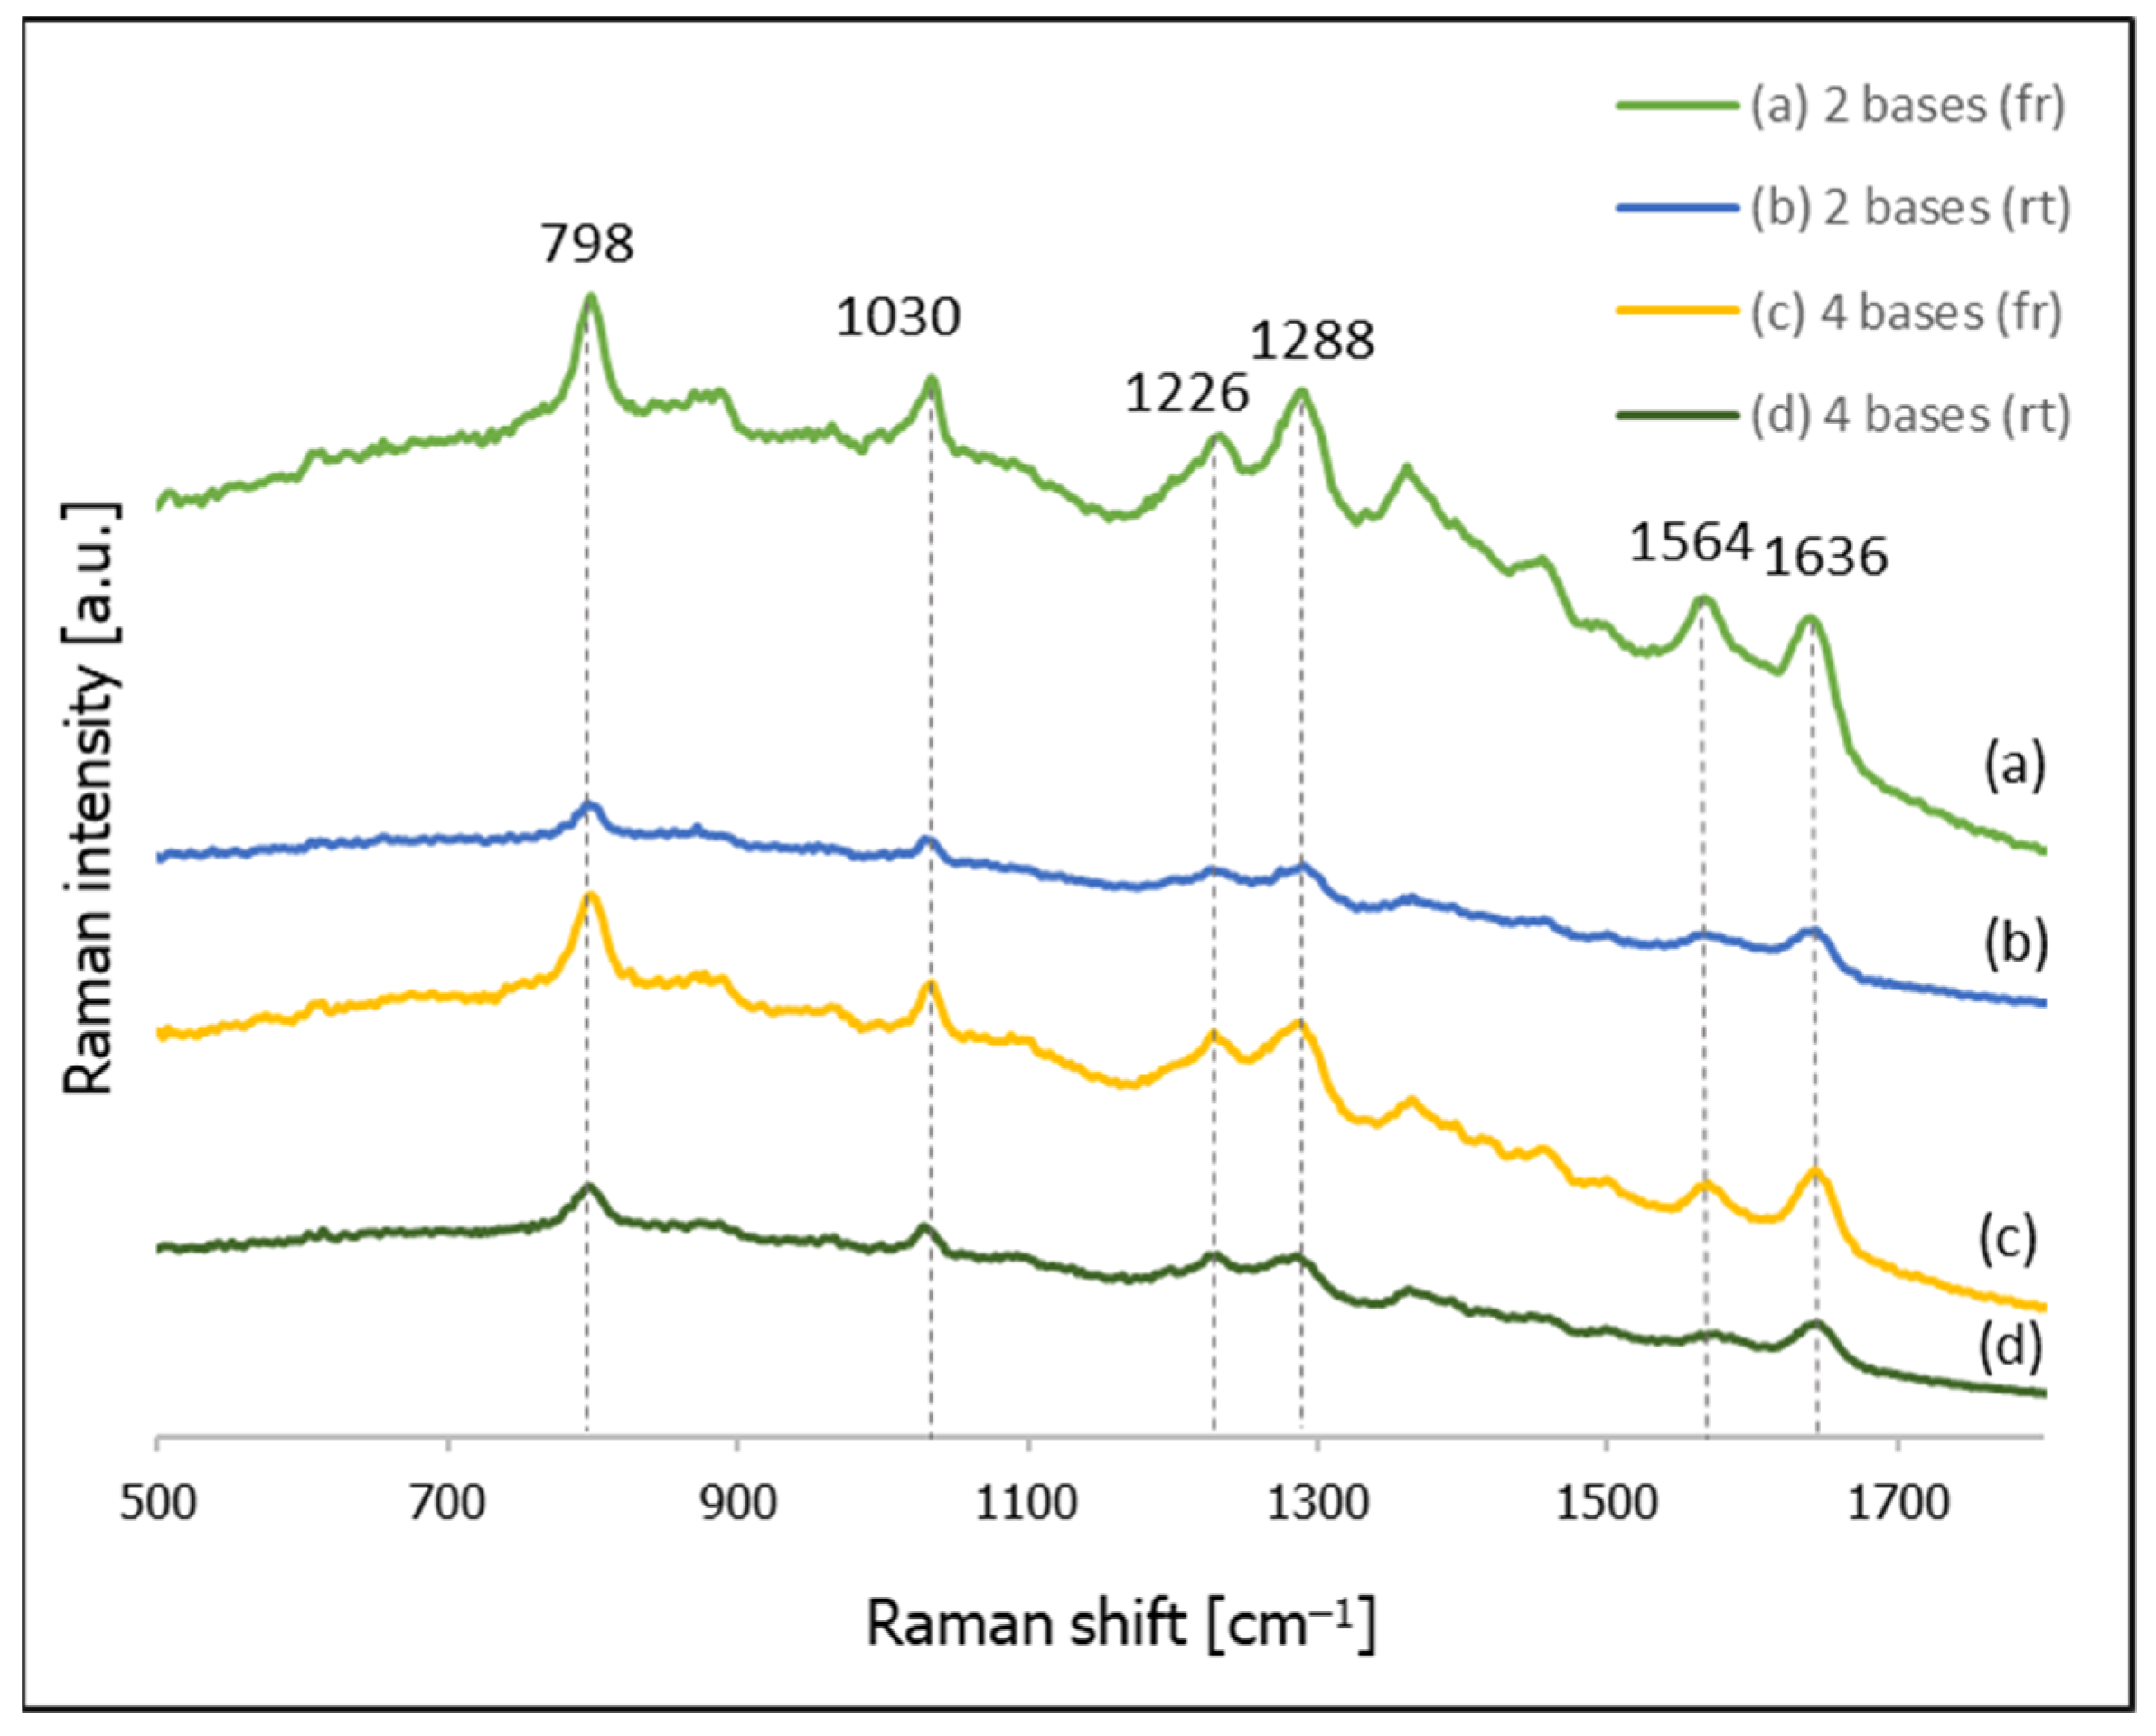
| 1636 | 1642 | 1640 | 1642 | 1638 | 1640 | 1643 | 1641 | 1638 | 1638 | 1641 | 1644 | C=O |
| 1564 | 1571 | 1571 | 1576 | 1580 | 1578 | 1580 | 1571 | 1576 | ring str (C) | |||
| 1548 | 1550 | ring str (A) | ||||||||||
| 1500 | 1501 | 1498 | 1500 | NH2 def | ||||||||
| 1466 | 1467 | C=N str (Im) | ||||||||||
| 1457 | 1455 | 1452 | C=N str (Py) | |||||||||
| 1380 | 1363 | 1366 | 1363 | 1364 | 1364 | 1378 | 1368 | 1376 | C-N str (Py) | |||
| 1319 | 1319 | 1319 | C-N str (Im) | |||||||||
| 1288 | 1281 | 1285 | 1279 | 1280 | 1284 | 1276 | 1288 | 1282 | 1286 | C-N str | ||
| 1228 | 1228 | 1226 | 1226 | 1230 | 1226 | 1231 | 1227 | 1231 | 1230 | 1226 | C-N str | |
| 1030 | 1030 | 1030 | 1030 | 1027 | 1026 | 1028 | 1029 | 1027 | 1026 | 1027 | 1026 | N-sugar |
| 798 | 797 | 798 | 796 | 795 | 792 | 796 | 796 | 801 | 796 | 796 | 798 | ring br (C) |
| 734 | 743 | 742 | 738 | 742 | 735 | ring br (A) | ||||||
| 675 | 673 | 678 | 676 | ring br (G) | ||||||||
Publisher’s Note: MDPI stays neutral with regard to jurisdictional claims in published maps and institutional affiliations. |
© 2021 by the authors. Licensee MDPI, Basel, Switzerland. This article is an open access article distributed under the terms and conditions of the Creative Commons Attribution (CC BY) license (https://creativecommons.org/licenses/by/4.0/).
Share and Cite
Pyrak, E.; Jędrzejewski, K.; Szaniawska, A.; Kudelski, A. Attachment of Single-Stranded DNA to Certain SERS-Active Gold and Silver Substrates: Selected Practical Tips. Molecules 2021, 26, 4246. https://doi.org/10.3390/molecules26144246
Pyrak E, Jędrzejewski K, Szaniawska A, Kudelski A. Attachment of Single-Stranded DNA to Certain SERS-Active Gold and Silver Substrates: Selected Practical Tips. Molecules. 2021; 26(14):4246. https://doi.org/10.3390/molecules26144246
Chicago/Turabian StylePyrak, Edyta, Kacper Jędrzejewski, Aleksandra Szaniawska, and Andrzej Kudelski. 2021. "Attachment of Single-Stranded DNA to Certain SERS-Active Gold and Silver Substrates: Selected Practical Tips" Molecules 26, no. 14: 4246. https://doi.org/10.3390/molecules26144246
APA StylePyrak, E., Jędrzejewski, K., Szaniawska, A., & Kudelski, A. (2021). Attachment of Single-Stranded DNA to Certain SERS-Active Gold and Silver Substrates: Selected Practical Tips. Molecules, 26(14), 4246. https://doi.org/10.3390/molecules26144246