3.1. Conformers and Barriers to Internal Rotation
A throughout conformational search on the B3LYP/6-311++G(d,p) potential energy surfaces of the studied molecules (the mono- and di-
ortho fluoro- or/and chloro- substituted benzoic acids, plus the parent benzoic acid, for completeness) was undertaken. The identified conformers are presented in
Figure 1 and
Figure 2.
All studied molecules have two conformationally relevant degrees of freedom, corresponding to the internal rotations around the exocyclic C-C and C-O bonds. For the last, two minimum energy structures exist, which maximize the π-electron delocalization within the carboxylic moiety: the intrinsically most stable
cis configuration (O=C-O-H dihedral equal to ~0°), and the higher-energy
trans arrangement (O=C-O-H dihedral equal to ~180°). The reasons for the usual higher stability of the
cis carboxylic acid structure have been discussed in details elsewhere [
49,
50,
51]. The major reason is the existence of more favorable bond-dipole/bond-dipole interactions in the
cis structure, where the dipoles associated to the C=O and O-H bonds are nearly anti-paralellely aligned, compared to those existing in the
trans structure, where these bond-dipoles are approximately parallel. For each carboxylic acid stable configuration (
cis or
trans), the number and type of the minimum energy structures differing in the orientation of the carboxylic acid moiety relatively to the aromatic ring (i.e., differing from each other by internal rotation about the exocyclic C-C bond) could be anticipated to be very much dependent on the substitution pattern in the aromatic ring. The obtained results plently confirmed these expectations, and stressed the structural relevance of the intramolecular interactions between the
ortho substituents and the carboxylic group as well as of the nature of the substituents (H vs. F vs. Cl).
In the case of the parent compound,
benzoic acid (BA), two conformers exist (
Figure 1). The lower-energy
cis conformer is planar and has two equivalent-by-symmetry forms, corresponding to the experimentally observed species [
52,
53,
54,
55,
56]. On the other hand, the
trans conformer has a non-planar structure and has a predicted energy 28.56 kJ·mol
−1 above that of the
cis conformer. In the
cis conformer, the
ortho hydrogen atoms participate in stabilizing attractive interactions with the oxygen atoms of the carboxylic group (carbonyl, O=, and acid, OH), which favor the planarity of the molecule, while in the
trans conformer the repulsion between the carboxylic hydrogen atom and the nearby located ring
ortho hydrogen atom leads to the observed tilt of the carboxylic noiety out of the plane of the ring. Due to its non-planarity and the symmetric substitution in the ring, the
trans BA conformer has four symmetry equivalent forms. The calculated O=C-O-H angle in this conformer is −171.4° (taking as reference the structure shown in
Figure 1) and the two C-C-C=O dihedrals are −157.4° and 24.0°. To the best of our knowledge,
trans BA has never been experimentally observed (we will return to this point later on in this article).
The calculated potential energy profiles for interconversion between the two conformers of BA (internal rotation around the C-O bond) and for internal rotation about the exocyclic C-C bond in the
cis and
trans conformers are shown in
Figure 3. The
trans→
cis barrier is predicted as 23.4 kJ·mol
−1 (52.0 kJ·mol
−1 in the reverse direction), with the transition state corresponding to a structure where the carboxylic hydrogen atom is nearly perpendicular to the molecular plane. At the geometry of the transition state, conjugation in the carboxylic fragment is minimal, justifying its high energy.
The profiles for internal rotation around the exocyclic C-C bond are considerably different for the two arrangements of the carboxylic group. For the
cis arrangement, the energy barrier (28.2 kJ·mol
−1) is more than twice larger than for the
trans arrangement (13.4 kJ·mol
−1). In the
cis form, the high energy of the transition state for rotation around the C-C bond is a consequence of the break down of the abovementioned stabilizing interactions between the ring
ortho hydrogen atoms and the oxygen atoms of the carboxylic acid substituent (that operate in the minimum energy structure), as well as the lack of conjugation between the carboxylic substituent and the aromatic ring. This latter effect can be noticed, for example, by looking to the exocyclic C-C bond lengths in the
cis conformer and in the transition state, respectively 1.486 and 1.500 Å. In the equivalent transition state for the
trans carboxylic group geometry, there is a favorable interaction between the π–system of the aromatic ring and the O-H carboxylic group (O-H
…π), which considerably lowers the energy barrier for rotation about the C-C bond. This type of O-H
…π stabilizing interactions (and similars) has been described for other, structurally related systems [
57].
The four symmetry-equivalent
trans forms can be grouped in two pairs, whose members are separated from each other by a small energy barrier (1.1 kJ·mol
−1) at the planar transition state geometry (see
Figure 3, top panel). Although low, this barrier is still above the zero-point level for the τC-O torsion in the
trans conformer (calculated as 0.4 kJ·mol
−1), so that the non-planar structures do indeed correspond to potentially experimentally observable minima.
Both
2-fluorobenzoic acid (2FBA) and
2-chlorobenzoic acid (2CBA) have two low-energy
cis conformers and two higher-energy
trans conformers (see
Figure 1). In the fluoro-substituted compound, three conformers are planar, the two
cis conformers (
cis-I and
cis-II) and one
trans conformer (
trans-II), all being unique structures. The additional
trans conformer (
trans-I) is non planar, being two-fold degenerate by symmetry. The two
cis conformers have rather similar energies, with
cis-II (where the fluoro-substituent stays the same side of the molecule as the acid oxygen atom and a C-H
…O= stabilizing interaction exists), being the most stable form. The
cis-I conformer has a relative energy of 2.82 kJ·mol
−1. In this conformer, the C-H
…O= interaction present in
cis-II is replaced by a weaker stabilizing C-H
…OH interaction. The C-H
…O= interaction is more efficient in stabilizing
cis-II than the C-H
…OH interaction in stabilizing
cis-I due to the more favorable localization of the interacting carbonyl oxygen lone electron pair, which stays in the molecular plane, whereas in
cis-I both lone electron pairs of the acid oxygen atom are out of the molecular plane. On the other hand, the interactions between the fluoro-substituent and the oxygen atoms, which are of repulsive nature, also favor a lower energy for
cis-II compared to
cis-I. This can be rationalized in similar terms as for the interactions involving the
ortho hydrogen atom discussed above. In
cis-I, the F
…O= repulsion is stronger than the F
…OH repulsion in
cis-II because the interacting lone electron pair of the carbonyl oxygen atom is in the same plane as the fluorine atom in the former conformer, while the lone electron pairs of the acid oxygen atom in
cis-II are both out of the plane in relation to the fluoro-substituent. The calculated atomic charges (Mulliken charges) for the two oxygen atoms, and for the
ortho fluorine and hydrogen atoms also point to a stronger repulsive F
…O interaction in
cis-I and to a stronger attractive H
…O interaction in
cis-II. The charges (in units of
e) of the interacting pairs of atoms are: +0.213(H)/−0.193(OH) and −0.133(F)/−0.293(O=) in
cis-I, and +0.206(H)/−0.295(O=) and −0.139(F)/−0.196(OH) in the most stable
cis-II conformer.
The planar
trans 2FBA conformer (
trans-II) is stabilized by a O-H
…F intramolecular hydrogen bond, and has a relative energy of 7.69 kJ·mol
−1. This energy can be compared with that of the second
trans 2FBA conformer (
trans-I), where no such stabilizing interaction exists, which amounts to 29.36 kJ·mol
−1, very similar to the energy difference between the
trans and
cis conformers of benzoic acid (28.56 kJ·mol
−1; see above). Like for the
trans BA conformer, in the
trans-I conformer of 2FBA the OH
…H repulsive interaction dominates, being the main factor determining the high relative energy and the non-planaritry of the conformer (the C(F)-C-C=O and C(H)-C-C=O angles in
trans-I are 44.3° and −132.5°, respectively, for the structure shown in
Figure 1, which has a symmetry equivalent form where these angles are −44.3° and 132.5°).
The potential energy profiles for conversion between the pairs of related
cis and
trans 2FBA conformers (
cis-I and
trans-I;
cis-II and
trans-II) and those for internal rotation about the exocyclic C-C bond in keeping the conformation of the carboxylic acid fragment as
cis or
trans are represented in
Figure 4. The
trans-II→
cis-II conversion takes place over a barrier of 40.4 kJ·mol
−1 (48.1 kJ·mol
−1 in the reverse direction), which is more than 3 times higher than that converting
trans-I into
cis-I (13.9 kJ·mol
−1; 50.6 kJ·mol
−1 in the reverse direction) due to the strong stabilization of
trans-II originated by the O-H
…F hydrogen bond.
The internal rotation about the C-C bond for the cis carboxylic acid conformation interconverts cis-I and cis-II and has an associated energy barrier of 13.1 kJ·mol−1 in the cis-I→cis-II direction (15.9 kJ·mol−1 in the reverse direction). Interestingly, this barrier is considerably lower than the equivalent one in benzoic acid (28.2 kJ·mol−1). Since the intramolecular interactions at the transition states for the C-C internal rotation of both molecules can be expected to be very similar when the carboxylic acid group is in the cis conformation, the lower barrier observed in 2FBA compared to BA demonstrates that, globally, the cis conformers of 2FBA are destabilized compared to the cis form of BA, i.e., F…O repulsions dominate over H…O attractions.
The interconversion pathway between the two
trans 2FBA is strikingly affected by the presence of the O-H
…F hydrogen bond in
trans-II. Indeed, when the conformation of the carboxylic group is
trans, the potential energy profile for internal rotation about the C-C bond in 2FBA strongly differs from that of benzoic acid (compare
Figure 3, top panel, with
Figure 4, top-right panel). The stabilization of
trans-II, due to the intramolecular H-bond makes the energy barrier for its conversion into the
trans-I form (24.2 kJ·mol
−1) to be almost twice the equivalent barrier in
trans BA (13.4 kJ mol
−1), while the barrier for the reverse reaction reflects the dominance of strong repulsive interactions in
trans-I 2FBA, amounting only to 2.5 kJ·mol
−1. The conversion between the two symmetry-equivalent
trans-I forms has an associated barrier of 8.5 kJ·mol
−1, at the planar transition state. Note, also that the
trans-I→
trans-II barrier is small, but still considerably above the zero-point energy level of the τC-C torsional vibration in
trans-I, so that the non-planar
trans-I conformer should in principle be observable experimentally. We will return to this point later on in this article.
In the case of 2-chlorobenzoic acid, all minimum energy structures are predicted by the calculations as being non-planar. Compared to 2FBA, the order of energy of the two
cis conformers is predicted by the calculations to be the opposite, with
cis-I being the most stable conformer. In spite of the small energy difference between the two
cis conformers predicted by the calculations (0.24 kJ·mol
−1), their relative order of stability is predicted correctly. In fact, previously reported infrared spectroscopy experiments for the compound isolated in a low temperature argon matrix [
17] have unequivocally demonstrated that the
cis-I form is the lowest energy conformer of 2CBA. The different order of stability of the two
cis conformers in 2FBA and 2CBA can be rationalized taking into account that the Cl
…O repulsions are considerably stronger in 2CBA than in 2FBA and that, contrarily to what happens for this latter molecule (see above), in 2CBA, due to the large volume of the chlorine atom, the repulsive Cl
…O interactions are not significantly affected by the spatial location of the interacting lone electron pair(s) of the oxygen atoms, i.e., the Cl
…O interaction is as much effective when involving the “in-plane” lone eletron pair of the carbonyl O= atom or the “out-of-plane” lone electron pairs of the acid oxygen atom. In fact, under these assumptions it can even be expected the repulsion to be slightly more important when involving the acid oxygen atom than the carbonyl one (in agreement with the predicted and experimentally observed order of energies of the two conformers of 2CBA), since it is well-known that an acid oxygen atom has a larger effective volume than a carbonyl oxygen [
49,
50,
51].
It should also be noticed that the analysis of the potential energy profile for rotation around the exocyclic C-C bond for the
cis conformation of the carboxylic group in 2CBA (see
Figure 5, top-left panel) reveals that the two-equivalent-by-symmetry
cis-I forms and the two symmetry-equivalent
cis-II forms are separated by low energy barriers, at planar transition states. For
cis-I, the energy barrier (0.9 kJ·mol
−1) is above the zero-point energy associated with the torsion around the C-C bond (0.2 kJ·mol
−1), showing that the non-planar structures correspond to experimentally observable species. On the contrary, the energy barrier separating the two
cis-II minima (0.1 kJ·mol
−1) is below their zero-point torsional level (0.2 kJ·mol
−1), so that the experimentally relevant structure of conformer
cis-II shall be the planar form. According to these conclusions, the gas phase population of the
cis-I conformer could be expected to be approximately twice that of the
cis-II conformer. Such result is confirmed by the experimental data reported in [
17]. The ratio of the intensities of the infrared bands assigned to these two conformers (
cis-I:
cis-II) measured immediately after deposition of an argon matrix of 2CBA was indeed found to be ~2:1.
The main structural characteristics of the
trans conformers of 2CBA generically follow those described above for the
trans conformers of 2FBA. Although, two symmetry equivalent minima, corresponding to non-planar geometries, were predicted for the lower energy
trans-II conformer, the energy barrier separating these minima is lower than 0.1 kJ·mol
−1 (see
Figure 5, top-right panel) and stays below the τC-C zero point level of this conformer (slightly above 0.1 kJ·mol
−1), so that the planar structure is the experimentally relevant species. Then, like for 2FBA, the lower energy
trans conformer in 2CBA is a planar unique structure. Moreover, it is also stabilized by an intramolecular hydrogen bond (O-H
…Cl, in this case). The stabilization of
trans-II by this interaction is, as it could be anticipated considering the relative strengths of typical O-H
…Cl and O-H
…F hydrogen bonds, not as large as in the case of the equivalent conformer of 2FBA: the relative energy of
trans-II in 2FBA is 7.69 kJ·mol
−1; in 2CBA,
trans-II has a relative energy of 9.7 kJ·mol
−1. The higher-energy
trans-I conformer has a relative energy of 22.02 kJ·mol
−1 and is structurally similar to its counterpart in 2FBA (the angles between the planes of the ring and of the carboxylic group are 44.3°, in 2CBA, and 54.9°, in 2FBA). This conformer can be converted into conformer
trans-II by rotation around the exocyclic C-C bond (
Figure 5, top-right panel), the energy barrier for this process being only 0.6 kJ·mol
−1, but still above the τC-C zero-point level of
trans-I (~0.3 kJ·mol
−1). The barrier for the reverse transformation (
trans-II→
trans-I) is 12.7 kJ·mol
−1, which is about half of the equivalent one in 2FBA (21.7 kJ·mol
−1) and is consistent with the relative strengths of the distinct intramolecular hydrogen bonds present in the
trans-II conformers of the two molecules.
The potential energy profiles for interconversion between the
cis and
trans conformers (
Figure 5, bottom panels) follow the trends, already mentioned above, when comparing the
cis↔
trans potential energy profiles of 2FBA with the
cis↔
trans one in benzoic acid. The
cis-II→
trans-II and
cis-I→
trans-I transformations all have similar energy barriers (52.0 kJ·mol
−1 in BA, 48.1 and 50.6 kJ·mol
−1 in 2FBA, 46.3 and 49.5 kJ·mol
−1 in 2CBA), but the barriers for the reverse reactions involving the hydrogen bonded conformers (
trans-II) in 2FBA and 2CBA show the stabilization effect of this intramolecular interaction, increasing along the series BA > 2CBA > 2FBA (23.4, 36.6, 40.4 kJ·mol
−1, respectively).
It is interesting to examine the available experimental data on benzoic acid, 2FBA and 2CBA in relation to conformational isomerization at light of the above discussed potential energy landscapes. For the three compounds, only the lower energy
cis conformers were observed in low temperature infrared matrix isolation experiments [
16,
17,
54,
55]. The
cis conformer of BA was also observed in the gas phase both by electron diffraction experiments and microwave spectroscopy [
52,
53], and the gas phase infrared spectrum of this species has also been reported [
56]. On the other hand, the
trans conformer of BA has never been observed experimentally. In the case of 2FBA, the intramolecularly hydrogen bonded conformer of 2FBA (
trans-II) was detected in gas phase (together with the two
cis conformers) by microwave spectroscopy [
18], and it has been produced in argon and N
2 cryomatrices as result of vibrational excitation of the
cis conformers (using infrared narrowband in situ irradiation) [
16]. The existence of the highest energy
trans-I conformer of 2FBA was inferred indirectly in the matrix isolation conformational studies reported in Ref. [
16], but it could not be directly observed due to its fast spontaneous conversion to the lowest-energy
cis conformers. For 2CBA, in situ UV irradiation of the matrix-isolated
cis conformers was shown to lead to their conversion into their
trans counterparts, which were then found to decay by quantum mechanical tunneling back to the
cis forms [
17]. In Ref. [
17], the intramolecularly hydrogen bonded
trans-II conformer was directly observed, while the highest-energy
trans-I conformer was only possible to observe experimentally upon OH→OD isotopic substitution, in order to make its tunneling conversion into the
cis form slow enough.
The experimental observation of the
cis forms was expected for all molecules, considering their low energies (see
Figure 1) and the fact that they correspond to deep minima in the potential energy surfaces. The intramolecularly hydrogen bonded
trans-II conformer of 2FBA is also a well-defined minimum with a high energy barrier (40.4 kJ·mol
−1) of conversion into
cis-II (see
Figure 4, bottom-left panel), and has an expected population in the gas phase at room temperature of ca. 2% [
16], justifying its experimental observation in the microwave experiment [
18].
Trans-II was not detected in the deposited cryogenic matrices [
16] most probably because its expected population in the matrix is below the sensitivity of the technique (the infrared spectra is complex, showing the vibrational signatures of the two
cis conformers and the spectra of
trans-II conformer is not much different from those of the
cis forms, which complicates its experimental detection by this technique). However, once
trans-II is produced in situ by vibrational excitation (upon infrared irradiation) of the matrix-isolated conformer
cis-II, the high energy barrier for the
trans-II→
cis-II conversion precludes this transformation to take place (the over the barrier thermal process is not possible at all, and the experiments showed that quantum mechanical tunneling is also inneficient in this case). It can then be concluded that the
trans-II conformer of 2FBA is a stable species. In its turn, the higher-energy
trans-I conformer of 2FBA is unstable, decaying fastly into
cis-I by tunneling (through a low barrier of only 13.9 kJ·mol
−1; see
Figure 4, bottom right panel) or into
trans-II both via thermal over-the-barrier and tunneling (through a barrier of only 2.5 kJ·mol
−1). The occurrence of these decay processes justify the experimental results described in [
16], and are in agreement with the fact that this conformer was not observed in the microwave study (in any case, considering the relative energy of
trans-I, even in the absence of the spontaneous tunneling decay reactions its population in the room temperature gas phase could be expected to be negligible).
In the case of 2CBA, the highest energy
trans-I conformer could only be detected [
17] upon deuteration of the carboxylic group, which reduces its tunneling decay rate substantially allowing its experimental detection under cryogenic conditions. The barrier for the
trans-I→
cis-I conversion is, for 2CBA, of 27.5 kJ·mol
−1, which is still low enough to allow fast tunneling. On the other hand, the 2CBA intramolecularly hydrogen bonded conformer
trans-II could be experimentally detected after its in situ photoproduction in a cryogenic matrix [
17], but found to decay slowly by quantum mechanical tunneling into
cis-II (half-live of ~10–30 min, at 9–45 K in a Xe matrix). The
trans-II→
cis-II energy barrier in 2CBA is 36.6 kJ·mol
−1, i.e., intermediate between that of
trans-II in 2FBA, which is a stable species (barrier: 40.4 kJ·mol
−1) and the barriers for all other
trans→
cis isomerizations in BA, 2FBA and 2CBA (between 27.5 and 13.9 kJ·mol
−1) that lead to fast tunneling and unstable
trans conformers.
Taking into account the discussion above for 2FBA and 2CBA, the reasons why the
trans conformer of benzoic acid was not experimentally detected both in the gas phase experiments [
52,
53,
56] and in the matrix isolation studies [
54,
55] also became clear: the barrier for its conversion into the
cis form is only 23.4 kJ·mol
−1, intermediate between those for conversion of
trans-I into
cis-I forms in 2FCB and 2CBA, and lying within the range of values, which enables fast tunneling; the
trans conformer of BA is then also unstable, even at cryogenic temperatures.
The conformational spaces of the three investigated di-substituted compounds,
2,6-difluoro-, 2-6-dichloro-, and 2-chloro-6-fluoro- benzoic acids (abbreviated here as 26DFBA, 26DCBA and 2C6FBA, respectively; see also
Figure 2) are relatively more simple than those of the mono-substituted compounds. In practical terms, all these compounds have only one
cis and one
trans conformer, though in the case of 2C6FBA three non-equivalent minima exist on the potential energy surface (one
cis and two
trans). No structural experimental data has been reported for the isolated molecules of these compounds.
The two conformers of 26DCBA have the carboxylic moiety exactly perpendicular to the plane of the ring, in order to minimize the repulsion between the chlorine ortho substituents and the oxygen atoms of the carboxylic group. Each form is two-fold degenerate, the trans conformer being higher in energy than the cis by 17.05 kJ·mol−1. On the contrary, for 26DFBA the conformers are 4-fold degenerate and the planes of the carboxylic group and the aromatic ring make angles of 47.1 and 26.6°, respectively for the cis and trans conformer. The trans conformer is 14.87 kJ·mol−1 higher in energy than the cis form. No intramolecularly hydrogen bonded conformers exist for these two molecules, as the required geometries would also imply strong repulsions between the ring halogen atoms and the oxygen atoms of the carboxylic moiety.
The potential energy profiles for internal rotations about the C-O and exocylic C-C bonds in these two molecules are shown in
Figure 6 and
Figure 7.
The
trans→
cis energy barrier in 26DCBA is predicted as being 31.7 kJ·mol
−1, which is intermediate between those associated with the
trans-I→
cis-I and
trans-II→
cis-II transformations in 2CBA (27.5 and 36.6 kJ·mol
−1, respectively; see above). This result suggests that
trans 26DCBA is unstable, decaying spontaneously to the
cis form via tunelling if produced in some way. The barrier for the reverse
cis→
trans transformation (48.7 kJ·mol
−1) is identical to those predicted for BA, 2FBA and 2CBA. The barriers of internal rotation about the C-C bond in 26DCBA are similar for both
cis and
trans carboxylic acid group conformations (26.6 and 24.9 kJ·mol
−1, for
cis and
trans respectively), stressing the dominance of the Cl
…O repulsive interactions at the planar transition states. These barriers are also similar to the overall energy barrier for internal rotation about the C-C bond in
trans 2DCBA (25.5 kJ·mol
−1; see
Figure 5, top-right panel), which is also dominated by the repulsive Cl
…O (and OH
…H) interactions, but more than 3-times higher that in
cis 2DCBA (7.8 kJ·mol
−1;
Figure 5, top-left panel), where the Cl
…O repulsive interaction at the transition state is partially compensated by a stabilizing C-H
…O= interaction.
Due to the asymmetrical position of the minimum energy conformations along the C-C internal rotation in both
cis and
trans 26DFBA relatively to the two fluoro-
ortho substituents, the
trans↔
cis interconversion in this molecule can take place through two different transition states, depending on the direction of the rotation of the moving carboxylic hydrogen atom along the transformation (see
Figure 6, bottom panel). The two barriers are, nevertheless, not much different, amounting to 30.6 and 36.9 kJ·mol
−1 in the
trans→
cis direction and to 45.5 and 51.8 kJ·mol
−1 in the reverse direction. The latter barriers are similar to
cis→
trans barriers found for the remaining studied molecules (including 2C6FBA; see below), allowing us to conclude that a barrier in the 45–52 kJ·mol
−1 range is characteristics for the carboxylic group
cis→
trans transformation in this type of molecules. In the reverse (
trans→
cis) direction, the barriers found for 26DFBA are similar to those predicted for both 26DCBA and 2CBA (see above), being of intermediate size within the set of values for these barriers in the whole set of studied molecules, but they are significantly different from those observed for the
trans-I→
cis-I and
trans-II→
cis-II transformations in 2FBA (13.9 and 40.4 kJ·mol
−1, respectively). As for the
trans conformer of 26DCBA, the
trans 26DFBA conformer shall be unstable and convert to the
cis form spontaneously by tunneling.
The potential energy profiles for internal rotation about the exocyclic C-C bond in 26DFBA, for
cis and
trans arrangements of the carboxylic group (
Figure 6, top and middle panels), reveal the 4 symmetry-equivalent minima in both cases, which can be grouped in two pairs, separated by a transition state where the carboxylic group and the aromatic ring are nearly perpendicular. Within each group, the two forms are connected by a planar transition state. For the
cis arrangement of the carboxylic group, the first transition state is the lowest energy one (1.8 kJ·mol
−1), while the planar transition state separating the members of each pair of symmerey-equivalent forms has an energy of 4.8 kJ·mol
−1. This result highlights the dominance of the F
…O repulsions at the planar
cis transition state. On the other hand, for the
trans arrangement of the carboxylic group the planar transition state has a lower energy (1.5 kJ·mol
−1) than the perpendicular one (4.8 kJ·mol
−1), a result that indicates that the O-H
…F interaction established with one of the F
ortho atoms partially compensates the effect of the repulsive interaction between the carbonyl oxygen atom and the second
ortho fluoro-substituent. Compared with the C-C barriers in 26DCBA, the barriers in 26DFBA are much lower, mostly because of the much smaller size of the fluorine atom compared with the chlorine atom, which reduce the strength of the repulsive halogen-oxygen interactions in the fluorinated compound.
The asymmetrically substituted 2-chloro-6-fluorobenzoic acid has one
cis conformer, which, as for the remaining molecules studied, is the lowest energy conformer, and is lower in energy than the
trans conformer by 17.07 kJ·mol
−1. As already mentioned, the
cis→
trans barrier (47.5 kJ·mol
−1; see
Figure 8) is similar to those in the other compounds, while the barrier for the reverse transformation amounts to 30.4 kJ·mol
−1, similar to those found for 26DFBA, 26DCBA and 2CBA, and thus, as for these molecules, the
trans conformer of 2C6FBA can also be expected to decay spontaneously by tunneling to the
cis conformer. 2C6FBA has been investigated in a Xe matrix before [
58] and, in consonance with these results, only the
cis conformer was observed in the matrix. In the present study, we attempted to produce the
trans conformer by using both UV and IR irradiation of the
cis 2C6FBA conformer isolated in a Xe matrix (see
Section 3.4), but we were unable to detect this form (as expected).
The
cis and
trans potential energy profiles for internal rotation about the exocyclic C-C bond in 2C6FBA are similar (see
Figure 8, top and middle panels), with shallow wells at the position of the conformers. In the case of the
cis conformer, the two symmetry-equivalent forms are separated by barriers of 16.0 and 11.5 kJ·mol
−1, for the planar transitions states with the carbonyl oxygen atom positioned close to the fluorine and chlorine atoms respectively (and the acid oxygen atom positioned close to the second halogen atom). This result indicates that the sum of the energies associated with the F
…O= and Cl
…OH repulsions is larger than the sum of the Cl
…O= and F
…OH interactions, as expected taking into account the conclusions from the discussion made above for the mono-substituted compounds. In the case of the
trans arrangement of the carboxylic group, rotation about the C-C bond reveals two non-equivalent 2-fold degenerated minima (named as
trans and
trans’ in
Figure 2 and also in
Figure 8, top panel). However, the barrier separating
trans’ from
trans (0.1 kJ·mol
−1) stays below the zero-point energy for the τC-C torsional vibration of
trans’ (0.2 kJ·mol
−1) so that this structure is better described as a vibrationally excited state of
trans, resulting that 2C6FBA has a single 2-fold degenerate by symmetry
trans conformer with experimental significance. The barriers separating the two symmetry equivalent
trans forms of 2C6FBA amount to 13.7 and 5.2 kJ·mol
−1, for the planar transitions states with the OH carboxylic group pointing to the chlorine and fluorine atoms, respectively. This result can be directly correlated with the relative strengths of the stabilizing O-H
…F and O-H
…Cl stabilizing interactions.
3.2. Other Molecular Properties: Internal Strain, Acidity, and Dipole Moment
As detailed in the previous section, the nature of the ortho substituents (H, F, Cl), and the relative amount of internal strain they introduce in the studied molecules, play an important role in determining their conformational preferences. Internal strain is also of fundamental importance in determining structural features like bond lengths, and in particular, within the carboxylic moiety, and, together with the relative indutive and resonance abilities of the substituents, also in defining the acidity and the dipole moment of the studied compounds.
The relative internal strain in the experimentally relevant
cis conformers of the investigated molecules can be promptly estimated by considering the relative lengths of the exocyclic C-C bond connecting their carboxylic acid group to the aromatic ring. As seen in
Figure 9, the C-C bond length increases in the order BA < 2FBA < 2CBA < 26DFBA < 2C6FCA < 26DCBA, as it could be anticipated (in the plot shown in
Figure 9, the average of the C-C bond lengths in the two
cis conformers for both 2FBA and 2CBA is used). As pointed in the previous section, from the practical point of view the
cis conformers of benzoic acid and of the two mono-substituted compounds are planar, while those of the three di-substituted compounds are toughly non-planar. This fact influences decisively the properties of the carboxylic acid group, making the two sets of molecules intrinsically different regarding its characteristics.
Indeed, the resonance stabilization within the carboxylic group (represented in
Scheme 1 by the structure
B) is weak in benzoic acid and in the two mono-substituted compounds, due to the cross conjugation with the aromatic ring (
C, in
Scheme 1), which competes with the first effect. On the other hand, because of the non-planarity due to the stronger steric effects in the di-substituted derivatives, the cross conjugation is diminished in these compounds, so that the resonance stabilization within the carboxylic group becomes considerably more important. This has relevant structural implications, and it also plays a major role in determining the relative acidity of the two groups of molecules (for this latter property, one has also to count with the strain induced by the
ortho substituents in the ionized carboxylate group of the conjugated bases of the acids, but for these species the effect can even be expected to be more relevant, due to the larger effective volume of the carboxylate moiety when compared with the non-ionized carboxylic acid group [
49,
50,
51].
Figure 10 shows plots of the calculated C-O, C=O and O-H bond lengths, as well as of vibrational frequencies associated of these bonds in the studied molecules [the localized ν(O-H) and ν(C=O) stretching and the τ(C-O) torsion modes; ν(C-O) is extensively coupled with the δ(C-O-H) in-plane bending], as a function of their acidity, as expressed by the corresponding pK
a values in water at room temperature (25°) [
25,
26,
27,
28,
29,
59]. To fully understand the plots, one shall recall that both F and Cl have negative (electron withdrawing) indutive effect (–I), which is more important for fluorine than for chlorine (in view of the corresponding relative electronegativities), and positive (electron donating) mesomeric effect (+M), which is also stronger in fluorine compared to chlorine (due to the better orbital interactions of the 2
p C or O orbitals with the closest in energy 2
p orbitals of the fluorine atom, compared to the chlorine 3
p orbitals). Noteworthy, when both +M and –I effects are operating simultaneously, both fluorine and chlorine are globally electron attractors (i.e., the –I effect dominates), but the much stronger +M effect of fluorine compared to chlorine reduces its total electron attractor power substantially compared to the later, so that fluorine becomes a total weaker electron attractor than chlorine. One consequence of this is that 2-fluorobenzoic acid has a lower acidity compared to 2-chlorobenzoic acid (the experimental pK
a values for 2FBA and 2CBA at 25 °C in water are respectively 3.27 and 2.94 [
25,
27]). Of course, both compounds are considerably more acidic than the unsubstituted benzoic acid (pK
a = 4.20 [
59]).
The pK
a values for the difluoro- and dichloro-
ortho substituted benzoic acids are 2.34 and 1.69, respectively [
26,
28], with 2-chloro-6-fluorobenzoic acid having an intermediate pK
a (2.04 [
29]). In these compounds, besides the indutive and mesomeric effects of the substituents, the internal strain leading to non-planarity between the carboxylic group and the aromatic ring has also to be taken into account. The last, as shown in
Figure 9, follows the order 26DFBA < 2C6FBA < 26DCBA (which is also the order of the degree of non-planarity of the
cis conformers of the three molecules, whose angles made by the planes of the carboxylic group and the aromatic ring are 47.1°, 67.6°, and 90.0°, respectively, see
Figure 2).
It is clear from the data plotted in
Figure 10 that for the two groups of molecules (BA, 2FBA and 2CBA, in one side, and 26DFBA, 2C6FBA and 26DCBA in the other) the correlations between the O-H, C-O and C=O bond lengths within the carboxylic group as well as between the characteristic vibrational frequencies associated to these moieties (ν(O-H), τ(C-O), and ν(C=O)) and the pK
as follow different linear trends. As expected, the trend lines for all the correlations have a larger slope for the di-substituted molecules, where the number of halogen substituents is higher and the internal strain is large enough to make the molecules non-planar, thereby, increasing the importance of the stabilizing resonance effect within the carboxylic acid group (which directly correlates with the lability of the acid hydrogen). Interestingly, with a single exception the slopes of the trend lines for the di-substituted compounds in the plots shown in
Figure 10 are approximately twice those for the mono-substituted compounds.
An increase in the acidity of the compounds correlates with a longer O-H, as well as with a shorter C-O bond (as expressed by the resonance structure
B in
Scheme 1). Alongside, the ν(O-H) stretching frequency decreases (since the bond becomes weaker), while the frequency of the τ(C-O) torsion increases (because the C-O bond increases its double bond character, implying a higher force constant for the torsional vibration). The results show also that the C=O bond length decreases with the acidity and, concomitantly, ν(C=O) increases. Since the electronic charge in the carbonyl π-bond shall reduce (see
Scheme 1), these results indicate that the carbonyl σ-bond has to become stronger. In fact, this is in consonance with previous investigations on the behavior of the π and σ electronic systems in the carbonyl moiety [
50,
60], which have shown that the changes in the strengths of the two components of the carbonyl double bond in general take place in opposite directions, i.e., a weakening of the π-bond leads to strengthen the σ-bond, and vice-versa. It shall also be noticed that the correlations between pK
a and the vibrational frequencies do also verify if instead of the calculated frequencies one considers the experimentally measured ones in the gas phase (
Figure 10, right-side panels), although the complex band profiles and band overlappings, observed in the experimental spectra introduce, in some cases, some uncertainty in the experimental frequencies.
Contrary to what happens in the case of acidity, the relative polarity of the different studied molecules, as measured by their total dipole moments, is mostly determined by the intrinsic polarity of the substituents, despite the dipole moment orientation reflects also their degree of planarity.
Figure 11 shows the absolute value and the direction of the dipole moments for the experimentally relevant
cis conformers of the various studied compounds. For benzoic acid and the mono-substituted compounds, the dipole moment is located in the molecular plane. In BA and in the
cis-I conformers of 2FBA and 2CBA, it has approximately the same orientation, pointing from the C-H
meta bond opposed to the carbonyl bond towards between this bond and the nearly located C-X (X = H, F, Cl)
ortho bond, and increases along the series BA > 2CBA < 2FBA (2.12, 3.30, 3.50 D), while in the
cis-II conformers of 2FBA and 2CBA the dipole moment points from the
para C-H boind to the middle of the O=C-O angle of the carboxylic acid group, being also larger in the fluoro-substituted compound than in the chloro-substituted one (2.16 vs. 1.99 D). On the other hand, in the di-substituted compounds the dipole moment stays in the plane of the carboxylic acid and makes an angle of approximately 25° with the plane of the aromatic ring. In both 2F6CBA and 26DCBA the dipole moment points from below the
para C-H bond up towards the carbonyl oxygen atom, while in the difluoro-substituted molecule it points from below the middle of the ring C-C bond connecting the
para carbon atom to the
meta one opposing to the carbonyl atom up towards this latter atom (see
Figure 11). In the di-substituted molecules the order of increasing dipole moment is 26DCBA < 2C6FBA < 26DFBA, the magnitude of the dipole moments (2.63, 2.70, 2.94 D, respectively) being in between those of the
cis-I and of the
cis-II conformers of the mono-substituted molecules. If we consider the average values of the dipole moments of the two
cis conformers in these latter molecules (2.83 and 2.64 D, respectively for 2FBA and 2CBA), the absolute values of the calculated dipole moments in the whole series of investigated substituted benzoic acids stay in the rather narrow range of values 2.63–2.94 D.
Unfortunately, to the best of our knowledge no gas phase experimental data on dipole moments for the studied molecules have been reported. For benzoic acid, values in the range 1.7–2.1 D have been reported in dioxane and CCl
4 solution [
61], and for 2FBA a value of 2.46 D has been reported [
62], but without specification of the experimental conditions. These values seem to indicate that the dipole moments obtained in our calculations are probably within 10% accuracy, but a definitive conclusion on this matter must await for experimental confirmation.
3.3. Gas Phase IR Spectra
All the molecules studied are asymmetric tops, with 39 fundamental vibrations, all active in infrared. The experimentally relevant
cis conformers of benzoic acid, 2FBA and 26DBA are
Cs symmetry. The symmetry plane for the first two molecules corresponds to the molecular plane and the vibrations spawn the irreducible representations 27A′ + 12A′′, while in 26DCBA the plane of symmetry is perpendicular to the aromatic ring and contains the carboxylic group, the vibrations spawning the irreducible representations 23A′ + 16A′′. The
cis conformers of 26DFBA and 2C6FBA, as well as the most stable conformer of 2CBA (
cis-I), are
C1 symmetry. On the other hand, as discussed in
Section 3.1, from the practical point of view the
cis-II conformer of 2CBA is planar, thus belonging to the symmetry point group
Cs and, as in 2FBA, its vibrations spawn the irreducible representations 27A′ + 12A′′.
In the gas phase, infrared spectra are complicated by rotational contributions to the vibrational bands, which, together with the symmetry of the vibration, determine the band contours. For asymmetric top molecules of the size of those studied here, a detailed analysis of the band contours is a cumbersome task unless the molecule is approximately a symmetric top (either prolate, or oblate). In this case, band contour analysis may help to perform the assignment of bands that are not extensively overlapped or complicated by other effects (e.g., Fermi resonances and isotopic contributions, the latter being particularly relevant for the chloro-substituted molecules, since chlorine has two isotopes of large natural abundance).
The extent to which an asymmetric top molecule resembles a symmetric top is usually quantified by means of the Ray’s parameter
κ, which can be estimated from the rotational constants, A, B, C (which directly relate with the moments of inertia,
IA,
IB,
IC):
κ = −1 for a prolate top (A > B = C), and
κ = 1 for an oblate top (A = B > C).
Table 1 shows the calculated rotational constants and the value of the
κ parameter for the relevant conformers of the studied molecules. As it can be seen, only benzoic acid approaches the condition of being an approximate symmetric top (prolate; with
κ = −0.80), with all the other molecules having |
κ| < 0.50 with the exception of 2C6FBA, where
κ = 0.73 (i.e., 2C6FBA has still a relatively significant oblate character). Considering these results, in the following discussion of the gas phase infrared spectra of the compounds, band contour analysis is only attempted for benzoic acid. In order to do this, it is relevant to known that the orientation of the principal inertial axes, which are depicted in
Figure 12 for all the studied molecules.
For benzoic acid and the mono- and difluoro- substituted compounds, the A and B axes are nearly in the plane of the aromatic ring, the A axis being almost coincident with the
para C-H bond and bisecting the O=C-O angle. In the case of benzoic acid, this means that all in-plane vibrations (
A′ symmetry) shall show A, B or mixed AB band contours, while all out-of-the-plane vibrations (
A′′ symmetry) shall exhibit C contour profiles. The orientation of the principal inertial axes in the remaining molecules can be seen in
Figure 12, the striking case being 26DCBA, where the A axis (of lower momentum of inertia) stays in the plane of the aromatic ring, but aligned perpendicularly to the plane of symmetry of the molecule and passing through the two
ortho chlorine atoms. In this regard, this molecule substantially differs from all the others being studied, which have the A axis located approximately in the plane of the aromatic ring and roughly oriented (or almost precisely oriented, as in benzoic acid) in a direction defined by the
para C-H bond and the exocyclic C-C bond connecting the carboxylic acid substitent to the aromatic ring.
The gas phase infrared spectra for all the six studied compounds are shown in
Figure 13, together with the B3LYP/6-311++G(d,p) calculated spectra. For simplicity, only the calculated spectra of the most stable conformers of 2FBA (
cis-II) and 2CBA (
cis-I) are shown in the figure, since the spectra of the second populated conformers of these molecules in the gas phase (
cis-I for 2FBA and
cis-II for 2CBA) are very much similar to those of the corresponding dominant conformers [
16,
17].
The agreement between the calculated and experimental data is excellent, allowing the assignment of the spectra to be carried out straighforwardely. In
Table 2,
Table 3,
Table 4,
Table 5,
Table 6 and
Table 7, which show the proposed assignments, previously reported data obtained for jet-cooled gaseous benzoic acid [
56] and for the monomer of this compound as well as of 2FBA, 2CBA and 2C6FBA isolated in low-temperature noble gas (Ar or Xe) matrices [
16,
17,
54,
55,
58] are also presented. As decribed below, the present assignments agree with the general ones previously proposed for those molecules, but expand them providing assignment of additional bands and more evidence justifying the undertaken assignments (in particular for the unsubstituted compound). No vibrational studies have been reported on both 26DFBA and 26DCBA monomers hitherto.
According to the performed calculations,
benzoic acid has 33 vibrations with frequencies lying in the studied spectral region (4000–450 cm
−1), from which 26 are assigned in the present study. The 7 non-assigned vibrations have very low intensity (≤ 0.6 km·mol
−1; see
Table 2) and have never been observed experimentally with exception of the δ(CH) 0+–+0 mode (for the adopted notation of the vibrational modes see footnote
b of
Table 2) that has been tentatively assigned to a band at 1099 cm
−1 in the IR spectrum of jet-cooled benzoic acid [
56] (1110/1100 cm
−1 in the Ar matrix spectrum of the compound [
54,
55]). In the gas phase spectrum of BA investigated in the present study (where the band profiles are, as expected, considerably broader than those recorded for the jet-cooled or matrix-isolated compound), the band ascribable to this vibration is hidden by the more intense band due to an essentially delocalized vibration with a significant contribution of the ν(C-O) stretching coordinate (1095 cm
−1; predicted at 1090 cm
−1 with an intensity of 44.6 km·mol
−1). In the work on jet-cooled benzoic acid [
56] only 19 modes of the molecule were assigned; moreover, the description of the modes was given in a very general way. In the matrix isolation investigations [
54,
55], the number of modes assigned within the 4000–450 cm
−1 region is equal to the one achieved in the present work (plus the above mentioned δ(CH) 0+–+0 mode), and the observed frequencies in the two studies are within the expected agreement. However, the assignments done in the matrix isolation studies were in large amount based on low-level AM1 semi-empirical calculated spectral data. Therefore, the present study strongly improves the description of the infrared spectrum of gaseous benzoic acid.
The spectrum of BA is dominated by 6 intense bands which are ascribable to vibrations whose major contributors are associated with the polar carboxylic group, ν(O-H) (3578 cm
−1), (C=O) (1765 cm
−1), ν(C-O) (1354, 1078 cm
−1) and δ(COH) (1354, 1184/1177 cm
−1), as it could be anticipated. The band at 714 cm
−1 is assigned to the γ(CH) all-in-phase out-of-the-plane bending mode (γ(CH) +++++, according to the notation adopted in the present study), having also a smaller contribution from the γ(C=O) coordinate. The calculated frequencies and relative intensities for these modes agree very well with the experimentally observed values (see
Figure 13 and
Table 2). The remaining two vibrations belonging to the carboxylic acid group which are expected to absorb in the studied spectral region give also rise to bands of considerable intensity, at 631 (δ(OCO)) and 574 (τ(C-O)) cm
−1. The aromatic ring modes are also well-described by the calculations both, in terms of frequencies and intensities (see
Figure 13 and
Table 2), so that their assignment could also be made in a straightforward manner.
There are a few bands in the experimental spectra shown in
Figure 13 that deserve here an additional comment. The first is observed at 1388 cm
−1, and is probably due to the 2 × τ(ring)
1 overtone enhanced by Fermi interaction with the fundamental mode assigned to the mixed {ν(C-O), δ(COH)} mode. The second is observed at 560 cm
−1 and can be tentatively attributed to the combination tone τ(ring)
3 + w(COOH) (calculated value: 404 + 155 = 559 cm
−1). The last band is observed at 817 cm
−1, and shall be ascribed to an unknown impurity, since it is absent in the spectra of both the jet-cooled and matrix-isolated monomer of benzoic acid and it is also not present in the spectrum of gaseous benzoic acid available in the Wiley Spectral Database [
64].
The band contour analysis proved to be particularly interesting in the 800–450 cm
−1 range, where bands predicted to exhibit different profiles (A, AB, B and C) are observed. As shown in
Figure 14, the profiles of the experimental bands fit nicely the predicted contour types, giving additional support to the proposed assignments.
In the case of
2-fluorobenzoic acid, from the 32 vibrations predicted by the calculations to absorb in the investigated spectral region (4000–450 cm
−1), 27 were assigned to bands observed in the experimental spectra (see
Table 3). Three of the 5 modes not assigned have very low predicted IR intensities (less than ~1 km·mol
−1), while the remaining two are expected to give rise to bands of small intensity at about the positions of the very intense bands of the {ν(C-O), δ(COH)} (1340 cm
−1) and {ν(C-O), δ(CH) 0++–} (1111/1105 cm
−1) modes, and are then buried underneath those bands.
Like for benzoic acid, the infrared spectrum of 2FBA is dominated by intense bands originated in the carboxylic acid substituent, e.g., ν(O-H) (3576 cm
−1), ν(C=O) (1765 cm
−1), ν(C-O) (1340, 1184, 1111/1105 cm
−1), δ(COH) (1340, 1184 cm
−1), and τ(C-O) (575 cm
−1). Also, as with BA, the γ(CH) all-in-phase out-of-the-plane bending mode (γ(CH) ++++) in 2FBA gives rise to an intense band at 755 cm
−1. All these bands are well predicted by the calculations (see
Figure 13 and
Table 3).
The ν(CF) stretching mode is assigned to the band at 1238 cm
−1, in fairly good agreement with the predicted value (1217 cm
−1). As suggested in [
16], the in-plane (δ(CF)) and out-of-the-plane (γ(CF)) bending modes give some contribution to the vibrations predicted at 531 cm
−1 (observed at 525 cm
−1) and 516 cm
−1 (with a very low predicted intensity and not observed experimentally), respectively, which are, however, better described as skeletal ring deformation modes, due to major contributions from the ring coordinates. The δ(CF) and γ(CF) modes have been reassigned to the calculated vibrations with frequencies at 344, and 244 cm
−1, respectively, rectifying the approximate description given previously for these modes as ring skeletal deformations [
16].
For 2FBA, besides the lowest energy
cis-II conformer, the higher energy
cis-I conformer shall also contribute to the spectrum. As mentioned before, the infrared spectra of the two conformers are predicted to be very similar and in the gas phase spectrum the evidence of
cis-I can only be clearly noticed in a few spectral regions, where this conformer gives rise to intense bands at positions sufficiently distinct from the corresponding bands of the dominant
cis-II conformer. The bands of
cis-I predicted to have a large intensity and obeying the condition of not being to close in frequency to those of
cis-II are calculated at 3691 (ν(O-H)), 1760 (ν(C=O)), 1226 (ν(CF)), 1175 ({ν(C-O), δ(COH)}, 1048 (δ(ring)
1), 841 (δ(ring)
2) and 557 (τ(C-O)) cm
−1. In the case of the ν(O-H) and τ(C-O) modes, no clear bands due to
cis-I could be identified, though the bands assigned to these modes are considerably asymmetric, with a more extended wing in the side where the bands due to
cis-I are expected (respectively for higher and lower frequencies). In all the other cases, the bands due to the
cis-I conformer are clearly seen in the experimental spectrum, at frequencies matching well the predicted values (1778, 1245, 1162, 1059 and 845 cm
−1; see also
Figure 13 and
Table 3).
The presence of two conformers at equilibrium in the gas phase occurs also for
2-chlorobenzoic acid. Being nearly degenerate, the expected relative population of the two conformers is determined by their symmetry. As mentioned in
Section 3.1, these considerations lead to an expected population of the slightly more stable
cis-I conformer of 2CBA that is approximately twice that of the less stable
cis-II conformer. However, compared to 2FBA, the spectra of the two
cis conformers of 2CBA are considerably more similar, so that in this case the band overlapping is more extensive. In fact, only one band in the experimental gas phase IR spectrum of 2CBA could be clearly assigned to the
cis-II conformer. This band is observed at 1371 cm
−1, and is ascribable to the {ν(C-O), δ(COH)} mode, in fairly good agreement with the calculated frequency (1344 cm
−1).
As for BA and 2FBA, the most intense bands in the infrared spectrum of 2CBA are due to vibrations mostly localized in the carboxylic acid fragment, ν(O-H) (3576 cm
−1), ν(C=O) (1767 cm
−1), ν(C-O) (1334, 1103, 1083 cm
−1), δ(COH) (1334, 1185 cm
−1) and τ(C-O) (576 cm
−1), plus the γ(CH) all-in-phase out-of-the-plane bending mode (γ(CH) ++++) (746 cm
−1). The stretching of the
ortho C-Cl bond contributes significantly to two bands, being strongly mixed with the ν(C-O) coordinate in the vibration giving rise to the intense band at 1103 cm
−1 (predicted at 1083 cm
−1), and with both the δ(OCO) and δ(ring)
3 coordinates in the vibration giving rise to the band observed at 690 cm
−1 (predicted at 677 cm
−1). The in-plane and out-of-the-plane bending CCl vibrations are predicted to originate bands of low intensity outside the investigated spectral region (respectively at 293 and 205 cm
−1; see
Table 4).
As a whole, 25 from the 27 fundamental vibrations of 2CBA predicted to absorb above 450 cm
−1 with an intensity larger than 2.5 km·mol
−1 have been assigned in the present investigation, the two non-assigned modes corresponding to low-intensity vibrations whose bands are hiden by intense bands due to other closely located in frequency modes, specifically {ν(C-O), δ(COH)} and τ(C-O) (see
Figure 13 and
Table 4). In the matrix isolation study of 2CBA [
17] only 14 modes were assigned.
The general spectroscopic pattern described above for BA, 2FBA and 2CBA in relation to the dominance of the bands originated in the carboxylic group regarding intensities is also observed for the studied
di-substituted compounds. For both 26DFBA and 26DCBA no previous vibrational data have been reported. In here, 24 from 25 fundamental vibrations with intensities over 1 km·mol
−1 predicted to occur in the studied spectral region (4000–550 cm
−1) were assigned in the spectrum of 26DFBA, while for 26DCBA all 23 vibrations matching these criteria were ascribed to bands in the experimental spectrum (
Table 5 and
Table 7). The symmetric stretching vibration of the
ortho fluorine substituents in 26DFBA is observed at 1295 cm
−1 as a mid intensity band (predicted at 1266 cm
−1), while the anti-symmetric mode gives rise to an intense band at 1020 cm
−1 (predicted at 1002 cm
−1). As for the mono-fluoro-substituted compound, the CF stretching frequencies in 26DFBA are underestimated by ca. 20 cm
−1 by the calculations upon scaling. Interestingly, the unscaled calculated frequencies almost exactly match the experimental ones in both molecules (1294, 1024 versus 1295, 1020 cm
−1 for 26DFBA, and 1244 vs. 1238 cm
−1 for 2FBA), and the same trends are also observed for 2C6FBA (1266 cm
−1, calculated unscaled versus 1258
−1, observed versus 1239 cm
−1, calculated scaled; see
Table 6). The in-plane and out-of-the-plane CF
2 bending vibrations in 26DFBA as well as the CCl
2 bending modes in 26DCBA are predicted to absorb below 550 cm
−1, i.e., outside the studied spectral region. All bands associated to these vibrations are predicted to have very low intensity (< 3 km·mol
−1; see
Table 5 and
Table 7).
The infrared spectrum of 2F6CBA isolated in a cryogenic Xe matrix has been reported before [
58] and assigned with help of calculated data obtained at the B3LYP/6-311++G(d,p) level of theory. The interpretation of the gas phase spectrum of the compound closely follows that made in the matrix isolation study, though a few bands are reassigned, in particular the streching of the exocyclic C-C bond, now assigned to the band at 779 cm
−1 (which has also contributions from the δ(OCO), γ(C=O) and γ(CH) +++ coordinates; see
Table 6). This band was previously mis-assigned to the stretching vibration of the CF bond, which is now reassigned to the band at 1258 cm
−1 that appears at approximately the same frequency as the identical vibration in 2FBA (1238 cm
−1). The νCCl stretching (not assigned in the matrix isolation study) is ascribed to the experimentally observed band at 1151 cm
−1, in good agreement with the calculated data (1149 cm
−1) and also not very much different from the frequency of the νCCl mode in 2CBA (1103 cm
−1; calculated: 1083 cm
−1; see
Table 4). Both νCF and νCCl coordinates also contribute (in opposition of phase) to the intense band observed at 909 cm
−1. Another way to describe the vibrations of the CF and CCl bonds is to state that the two stretchings combine anti-symmetrically to give rise to the band at 909 cm
−1, while the putative symmetric combination is replaced by vibrations where each one of the coordinates combine with δ(CH) ring bending modes (see
Table 6). According to the calculations, the in-plane bending associated with the CF and CCl bonds also combine to give rise to symmetric (predicted at 230 cm
−1) and anti-symmetric vibrations (predicted at 418 cm
−1). Interestingly, the out-of-plane deformations are predicted to be independent from each other. For 2C6FBA, all 23 vibrations predicted to absorb in the studied spectral region with an intensity >1 km·mol
−1 are here assigned to experimental bands in the gas phase spectrum of the compound.
3.5. Structural Characteristics of the Crystalline Materials
The crystal structures for all the compounds investigated here have been previously reported [
20,
21,
22,
23,
24,
30].
Table 8 summarizes the crystal data, while
Figure 18,
Figure 19 and
Figure 20 depict the crystal packing schemes observed for the different compounds. All compounds except 26DCBA crystalyze in the monoclinic system, the crystals belonging to the P2
1/c (or P2
1/n) space group N° 14 (BA, and all fluoro-containing compounds) or to the closely related C2/c space group N° 15 (2CBA). The crystals of the dichloro-substituted compound are triclinic, space group P
, and also differs in the number of non-equivalent molecules in the unit cell (
Z′), which is 2, instead of 1 as for all other compounds. The fundamental dissimilarity of the crystal of 26DCBA compared to those of the remaining compounds can be ascribed to the different packing constrains imposed by the favored nearly perpendicular arrangement of the carboxylic acid substituent and the aromatic ring in the 26DCBA molecules (see
Section 3.1). The average value of the angle between the planes of the carboxylic acid substituent and the aromatic ring (
φ) in 26DCBA is ~85°, slightly smaller than in the isolated molecule (90.0°), but much larger than in the remaining studied compounds. For all compounds, the monomeric units exist in a carboxylic acid
cis conformation and are associated in centrosymmetric dimers connected by two O-H
…O intermolecular hydrogen bonds. In the BA crystal, the molecules are planar, as for the isolated molecule. The crystals of the two mono-substituted compounds (2FBA and 2CBA) show molecules slightly non-planar: for 2CBA, the angle between the carboxylic acid substituent and the aromatic ring is ~14°, very much similar to that predicted for the most stable conformer of the molecule,
cis-I (18.0°; see
Figure 1); for 2FBA, this angle is ~10°, while the minimum energy
cis structures of the isolated molecule are planar. Interestingly, 2FBA is the only compound among all those studied here where the conformer selected to form the crystal (
cis-I) is not the most stable conformer found for the isolated molecule (
cis-II, as discussed in
Section 3.1). Both 26DFBA and 2C6FBA crystals are constituted by non-planar molecules where the
φ angle is somewhat smaller than in the corresponding minimum energy structures of the isolated molecules (~34° vs. 47.1° in the case of 26DFBA, and ~46° vs. 67.6°, for 2C6FBA). In practical terms, the trends described above lead to geometries adopted by the different
ortho halogeno-susbtituted benzoic acids molecules in crystalline phase that are more similar to each other than for the isolated molecules, this being particularly noticeable for the compounds crystallyzing in the monoclinic system.
It is interesting to note the similarity of the cell parameters for the pairs BA/2FBA and 26DFBA/2C6FBA (see
Table 8), which follows the general pattern of greater structural similarity between these pairs of molecules already pointed out in the previous sections of this article. In this regard, the two chloro-substituted compounds, 2CBA and 26DCBA, have unique characteristics, though in the case of the mono-substituted compound this is mostly due to the different number of molecules in the unit cell, which is twice those of the remaining compounds (indeed, the cell parameters for 2CBA can also be made in close correspondence with those of the pair 26DFBA and 2C6FBA if one takes ½ of the value of the
c axis and interchanges the
a and
b axes; see
Table 8).
The cell volumes for the crystals of the different compounds shown in
Table 7 follow the expected order, tacking into account the size of the respective molecules, i.e., BA < 2FBA < 26DFBA < ½2CBA < 2C6FBA < 26DCBA, though the cell volume of the crystal of the unsubstituted compound (BA) given in
Table 8 is comparatively larger. However, this is in a large amount due to the higher temperature used in the X-ray structure determination measurements, since neutron diffraction studies performed at 130 K [
30] render a cell volume for BA crystal of only 589 Å
3.
Intermolecular interactions in the studied crystals are here characterized in details using the Hirshfeld surface analysis approach [
43,
70,
71] and the CE-B3LYP method [
42,
43].
Hirshfeld surfaces are obtained from electron distributions that are calculated as sums of spherical atomic electron densities [
43,
70,
71]. The Hirshfeld surface of a molecule in a crystal defines the region where the electron distribution given by the sum of the electron densities of the spherical atoms of a given molecule (the
promolecule) exceeds that from all other promolecules in the crystal. Structure-related properties can then be mapped on the Hirshfeld surface. The normalized contact distance (
dnorm) is calculated from the distances of a given point of the surface to the nearest atom outside (
de) and inside (
di) of the surface (normalized by the corresponding van der Waals radii,
and
, respectively), as defined by Equation (3), and allows the identification of the regions of the molecule where intermolecular interactions are more important [
71,
72]. Additionally, the combination of
de and
di in the form of a two-dimensional (2D)-fingerprint plot allows to condense information about the intermolecular contacts present in the crystal [
71,
73,
74,
75]. The 2D-fingerprint plots provide a visual summary of the frequency of each combination of
de and
di across the surface of a molecule, thus indicating not just which intermolecular interactions are present, but also the relative area of the surface corresponding to each kind of interaction, which is a measure of the relative amount of each interaction in the crystal:
The CE-B3LYP method has been described in details in refs. [
42,
43], and alows the partition of the interaction energies in a crystal in components which are of electrostatic, polarization, dispersion and exchange-repulsion nature. As described in
Section 2 of this article, this method enables the computation of lattice energies (E
lat), which can be then related with sublimation enthalpies ΔH
sub(
T).
Table 9 summarizes the results of the Hirshfeld analysis performed on the crystals of the studied compounds regarding the relative importance of the different intermolecular interactions, expressed as atom
…atom interactions according to the
dnorm signatures. The total and atom
…atom
dnorm plots and 2D-fingerprint plots (
de,
di) are shown in
Figure 21 and
Figure 22. It can be seen that, as expected, the O
…H interactions are of fundamental importance in all crystals, since they are mostly related with the intermolecular H-bond interactions joining individual molecules in the centrosymmetric dimers present in the crystals. The O
…H interactions percent contribution is in the short range of 23.1–24.9% in the series of compounds studied, testifying the similar nature of this type of interaction in all of them. It is interesting to point out that the strengths of the intermolecular O-H
…O interactions in the dimers present in the crystals, as measured by the O
…O distances (the shorter the distance, the stronger the H-bonding) correlate approximately in an inverse way with the pK
a of the compounds (grouping the mono-substituted and di-substituted compounds;
Figure 23), once again 26DCBA being a notorious exception to this trend.
Besides the O
…H interactions, in the BA crystal the other two most relevant types of interactions are the H
…H and C
…H contacts, accounting for 43.0 and 21.1% of the Hirshfeld surface
dnorm values, respectively. As shown in
Figure 21, the H
…H interactions are mapped on the Hirshfeld surface around all ring hydrogen atoms and are related with the dispersion interactions involving these atoms, which occur both paralelelly and perpendicularly to the aromatic ring plane, as seen in
Figure 18. On the other hand, the C
…H interactions are a measure of the C-H
…π interactions involving the π system of the aromatic ring and the
meta and
para hydrogens of neighboring molecules, as shown in
Figure 18. Note that in the crystal of BA the π-π stacking between the aromatic rings is limited, since the rings of neighbor dimers are dephased (see
Figure 18), what justifies the small importance of the C
…C interactions in the crystal (only 3.6%;
Table 9). This strongly contrasts with what happens in the case of 2FBA, where the π-π stacking between adjacent rings is perfect and, consequently, the C
…C interactions increase of importance (10.8%) at cost of the C
…H interactions (which account only for 8.7% of the Hirshfeld
dnorm surface area), and are mapped, as expected, above the aromatic ring carbon atoms (see
Figure 18 and
Figure 21). In the crystal of 2FBA, besides the O
…H and C
…C interactions, the most importante interactions are the H
…H and H
…F ones, accounting respectively for 26.4 and 20.0% of the Hirshfeld
dnorm surface area and representing mostly H
…H dispersive and C-H
…F-C bond-polar interactions. Interestingly, the F
…F interactions are practically inexistent (0.2%), in consonance with the fact that in the crystal the atoms close to the fluorine atoms are essentially hydrogen atoms.
A similar picture can be traced for the difluoro-substituted compound, whose percentual assignment of the Hirshfeld
dnorm surface area to the diferent atom
…atom interactions is very much identical to that of 2FBA (see
Table 9 and also
Figure 18,
Figure 19 and
Figure 21). The major difference is the increase of percentage allocated to the F
…H interactions and the reduction of that assigned to the H
…H interactions, as expecting considering the replacement of one H atom by a F atom in going from 2FBA to 26DFBA.
The patterns of atom
…atom interactions in the crystals of 2CBA and 26DCBA generally follow those discussed above for the two fluoro-substituted compounds, as it can be noticed by the percentual values for the different interactions shown in
Table 9, and also by comparing the plots depicted in
Figure 21 and
Figure 22 for these molecules. It shall, however, be emphasised that the specific geometry adopted by the molecules of 26DCBA, with the planes of the aromatic ring and of the carboxylic group nearly perpendicular to each other, leads to a reduction of the π-π staking between the aromatic rings (as measured by the C
…C interaction, which has the lowest percent value among all these four molecules; see also
Figure 20 for 26DCBA crystal packing), and also to an increase of the relevance of the Cl
…O interactions (which are by far more important in 26DCBA than in 2CBA, and also much more important than the F
…O interactions in both 2FBA and 16DFBA; see
Table 9).
Finally, in the crystal of 2C6FBA, whose structural organization resembles that of 26DFBA (
Figure 19), the intermolecular atom
…atom interactions do also resemble those opperating in the difluoro-substituted compound, with the relevant O
…H, H
…H and C
…C interactions having identical percentual contributions to the Hirshfeld
dnorm surface area (
Table 9 and
Figure 21 and
Figure 22). Naturally, the percentage assigned to the F
…H interactions in 26DFBA (31.1%) are split in 2C6FBA among the F
…H (11.1%), Cl
…H (15.8%) and F
…Cl (6.3%) interactions. Additionally, the Hirshfeld
dnorm surface maps for 2C6FBA clearly reveal that the F
…H interactions occur predominantly with the
para hydrogen atom, while the Cl
…H interactions involve essentially the
meta hydrogen atoms (
Figure 22), in consonance with its characteristic crystal packing, shown in
Figure 19. For 26DFBA, the F
…H interactions extend to both
para and
meta hydrogen atoms (
Figure 19 and
Figure 21).
The results obtained using the CE-B3LYP interaction energy decomposition model [
42,
43] are summarized in
Table 10. A comparative analysis of the data for the 6 studied crystals was done by using the Ward’s clustering method [
77] with squared Euclidian distances, and is presented in
Figure 24. The clustering analysis clearly shows the similarity of the pairs of crystals BA/2FBA and 26DFBA/2C6FBA already pointed out above, with the latter pair being that whose components show the highest degree of similarity. The crystals of the chlorosubstituted compounds (2CBA and 26DCBA) are also grouped together in the clustering analysis, but their degree of similarity is considerably smaller than those exhibited by the remaining pairs of crystals, as seen by the relative distances of the branching points of the dendogram for the different groups.
The electrostatic and polarization components of the intermolecular interactions (E_ele; E_pol) are larger for all fluoro-containing compounds (including 2C6FBA), compared to the chloro-substituted ones (see
Table 10), as it could be expected taking into account the relative electronegativities of the two halogen atoms. The maximum value of these terms are observed for 26DFBA, and are ca. 30%, and ~70% higher, respectively, than for 26DCBA. Interestingly, the results indicate that these terms are also large for the unsubstituted BA.
The dispersion component of the intermolecular interactions (E_dis) is, as expected, smaller in BA, compared with all halogenated benzoic acids (with the notorious exception of 26DCBA), and in these latter, also as it could be anticipated that it is larger in the di-substituted compounds than in the mono-substituted ones. The fact that the crystal of 26DCBA appears (again) as an outlier shall be ascribed to its significant structural differences compared to the remaining crystals, which were already pointed out above.
In its turn, the exchange-repulsion component (E_rep) of BA has an intermediate value, being larger than those found for 2CBA and 26DCBA and smaller than those calculated for all the fluoro-containing derivatives. Assuming a similar compactness of the crystals, these results can be correlated with the relative hardness of the halogen atoms, fluorine being a harder atom than hydrogen and chlorine being considerably softer [
78,
79].
The CE-B3LYP calculated lattice energies of the crystals E
lat = E_tot (see
Table 10) appear in the following order: 26DFBA < 2C6FBA = 2FBA ≈ BA < 2CBA < 26DCBA. From the obtained values of E
lat, the sublimation enthalpies were estimated as described in
Section 2 as being 109 (26DFBA), 102 (2C6FBA and 2FBA), 101 (BA), 94 (2CBA) and 82 (26DCBA) kJ·mol
−1. The estimated values are expected to have an absolute error within 8 kJ·mol
−1 [
42], so that the obtained results compare fairly well with the available experimental data: 94.4 ± 0.8, 93.3 ± 1.2 and 79 ± 2 kJ·mol
−1, for 2FBA, BA and 2CBA, respectively [
80,
81,
82] (no experimental data is available for the remaining compounds).
We have also looked to the influence of the crystal environment on the properties of the aromatic ring. Aromaticity can be estimated using the harmonic oscillator model of aromaticity (HOMA) index [
83,
84,
85], which is defined as,
where
ri are the C-C bond lengths.
Table 11 presents the values of the ring C-C bond lengths for the isolated molecule, as calculated in the present study, and those obtained experimentally for the crystals [
20,
21,
22,
23,
24,
30]. For both situations, the less aromatic rings are present in the mono-substituted compounds due to pronouncedly different nature of the
ortho substituents, with 2CBA being the compound exhibiting the smaller HOMA index. Interestingly, the aromaticity index in the di-substituted compounds assumes higher values than in BA, both in the crystalline state and for the isolated molecules. It is also worth noticing that, with no exceptions, the intermolecular interactions present in the crystals lead to a reduction of the aromaticity degree of the aromatic moiety (from a reduction of ~0.15% in the HOMA index, in both 26DFBA and 26DCBA, to ~5% in 2CBA).


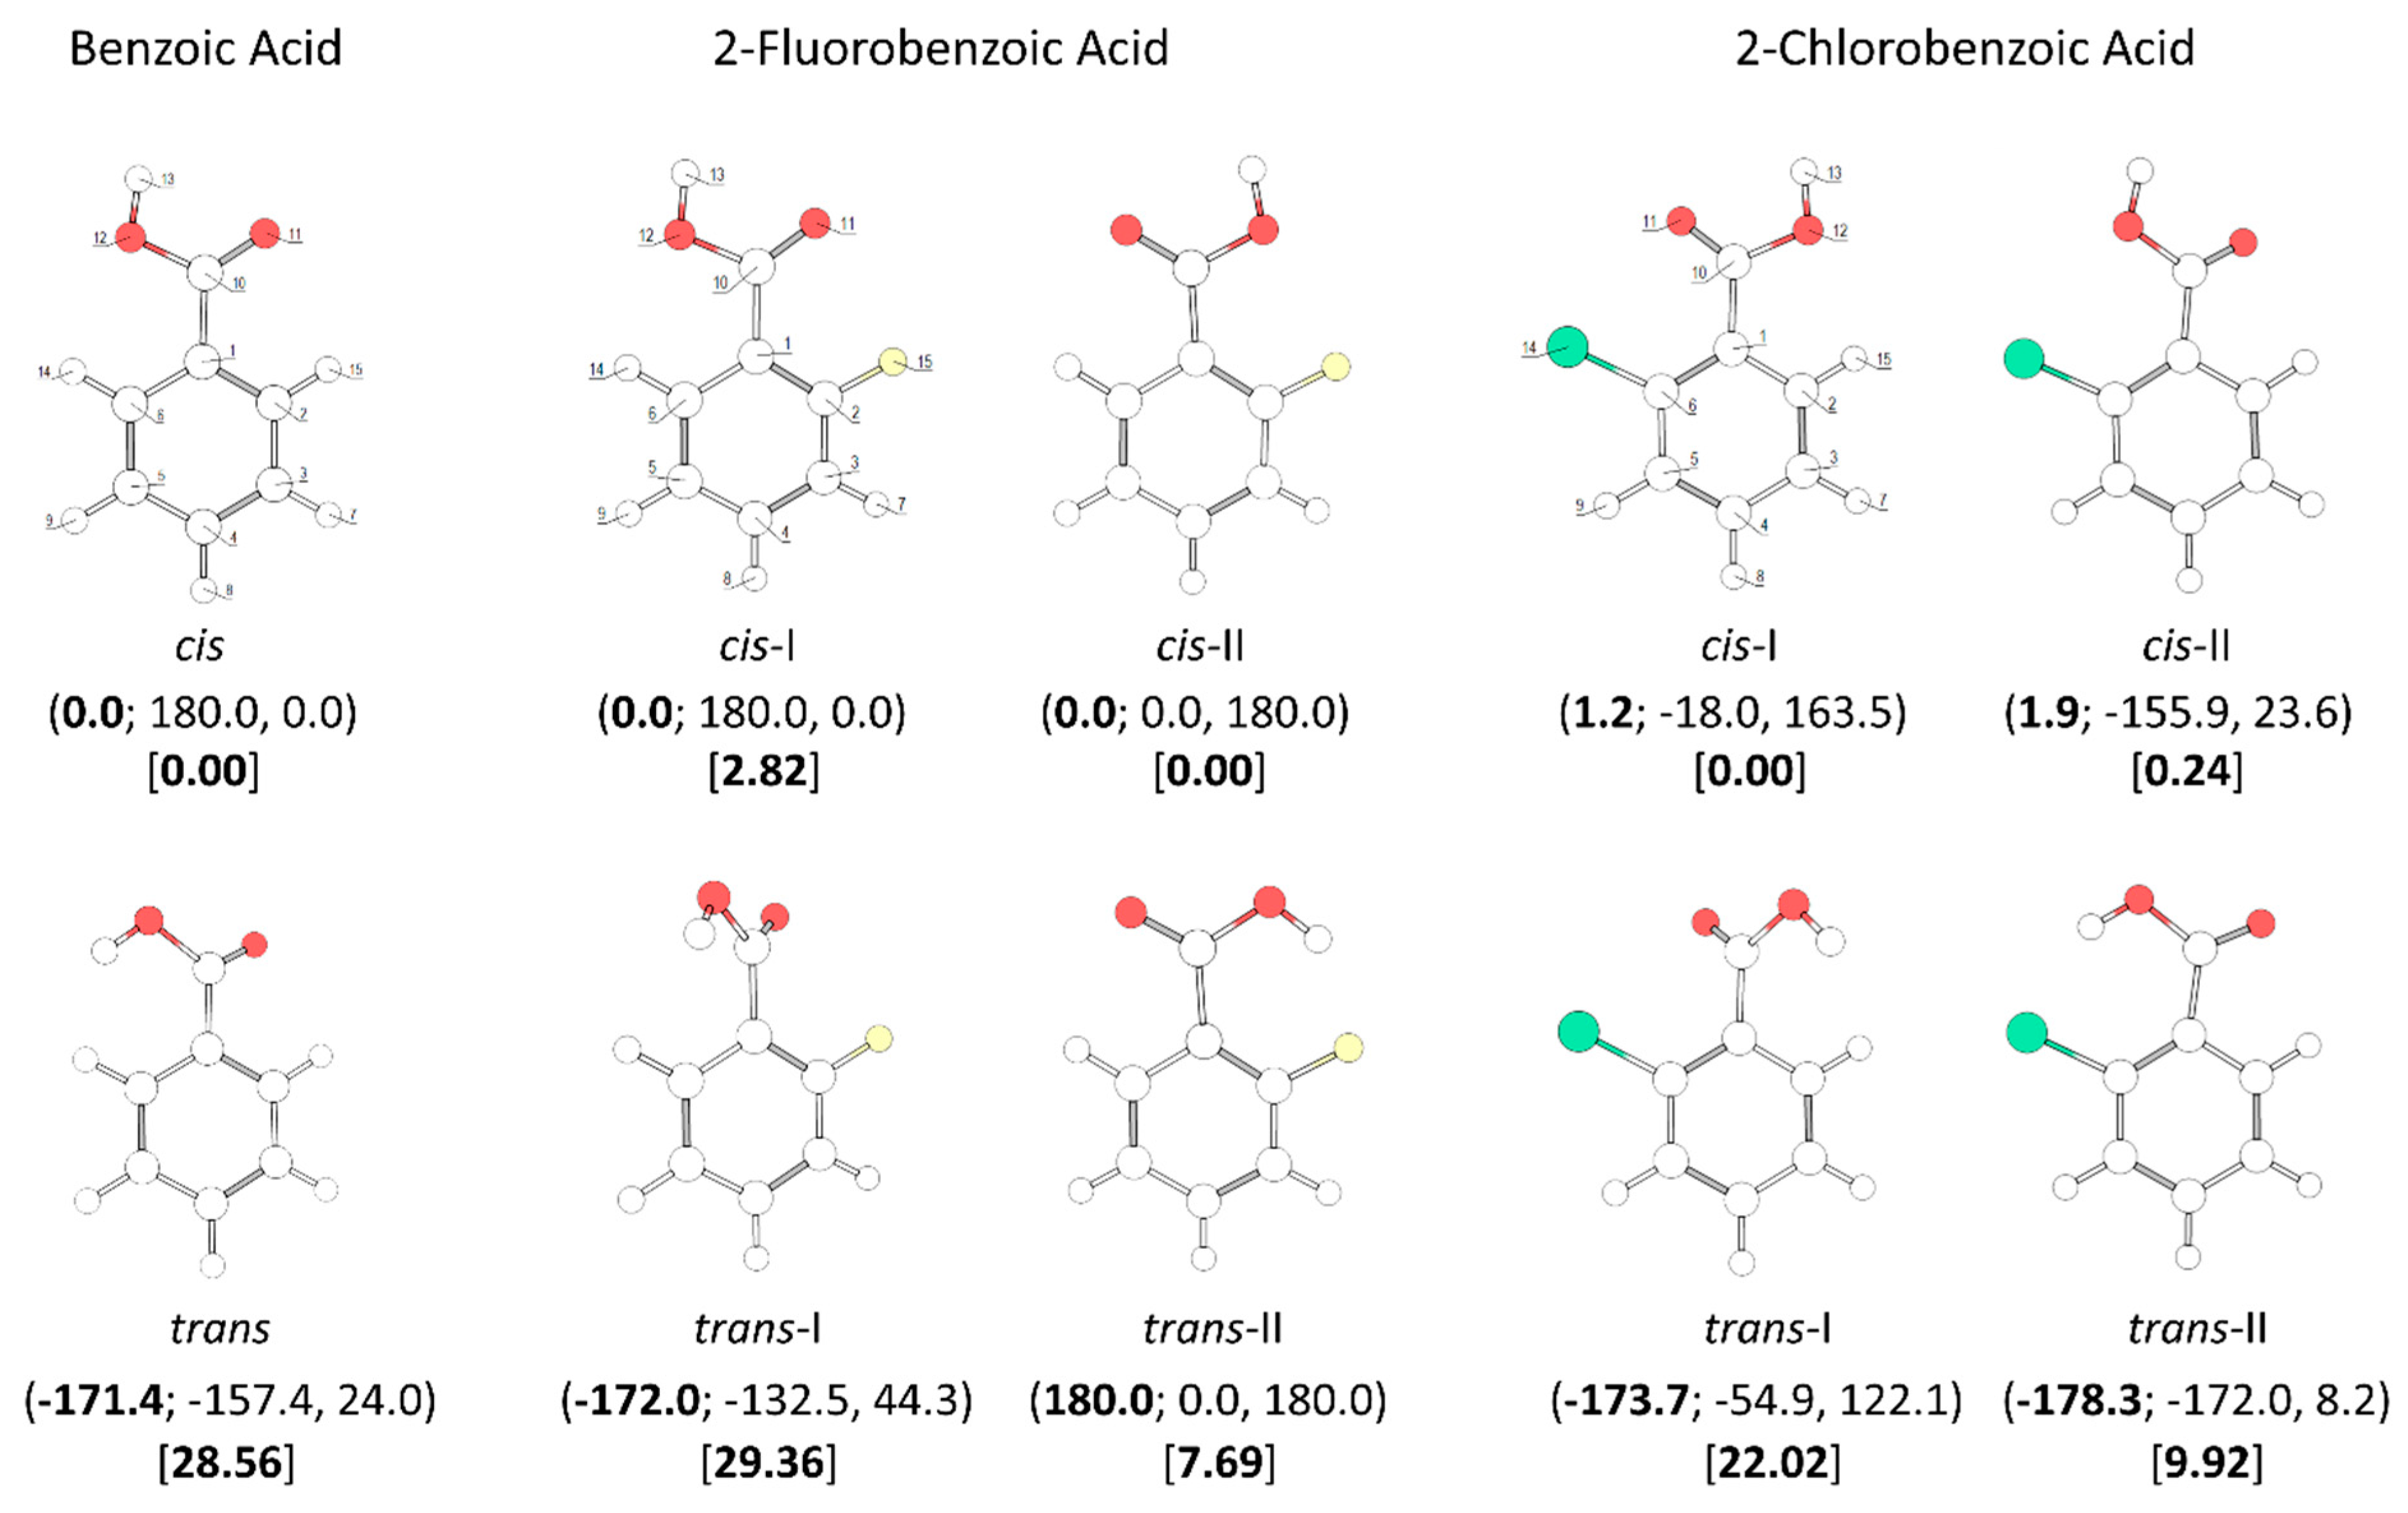
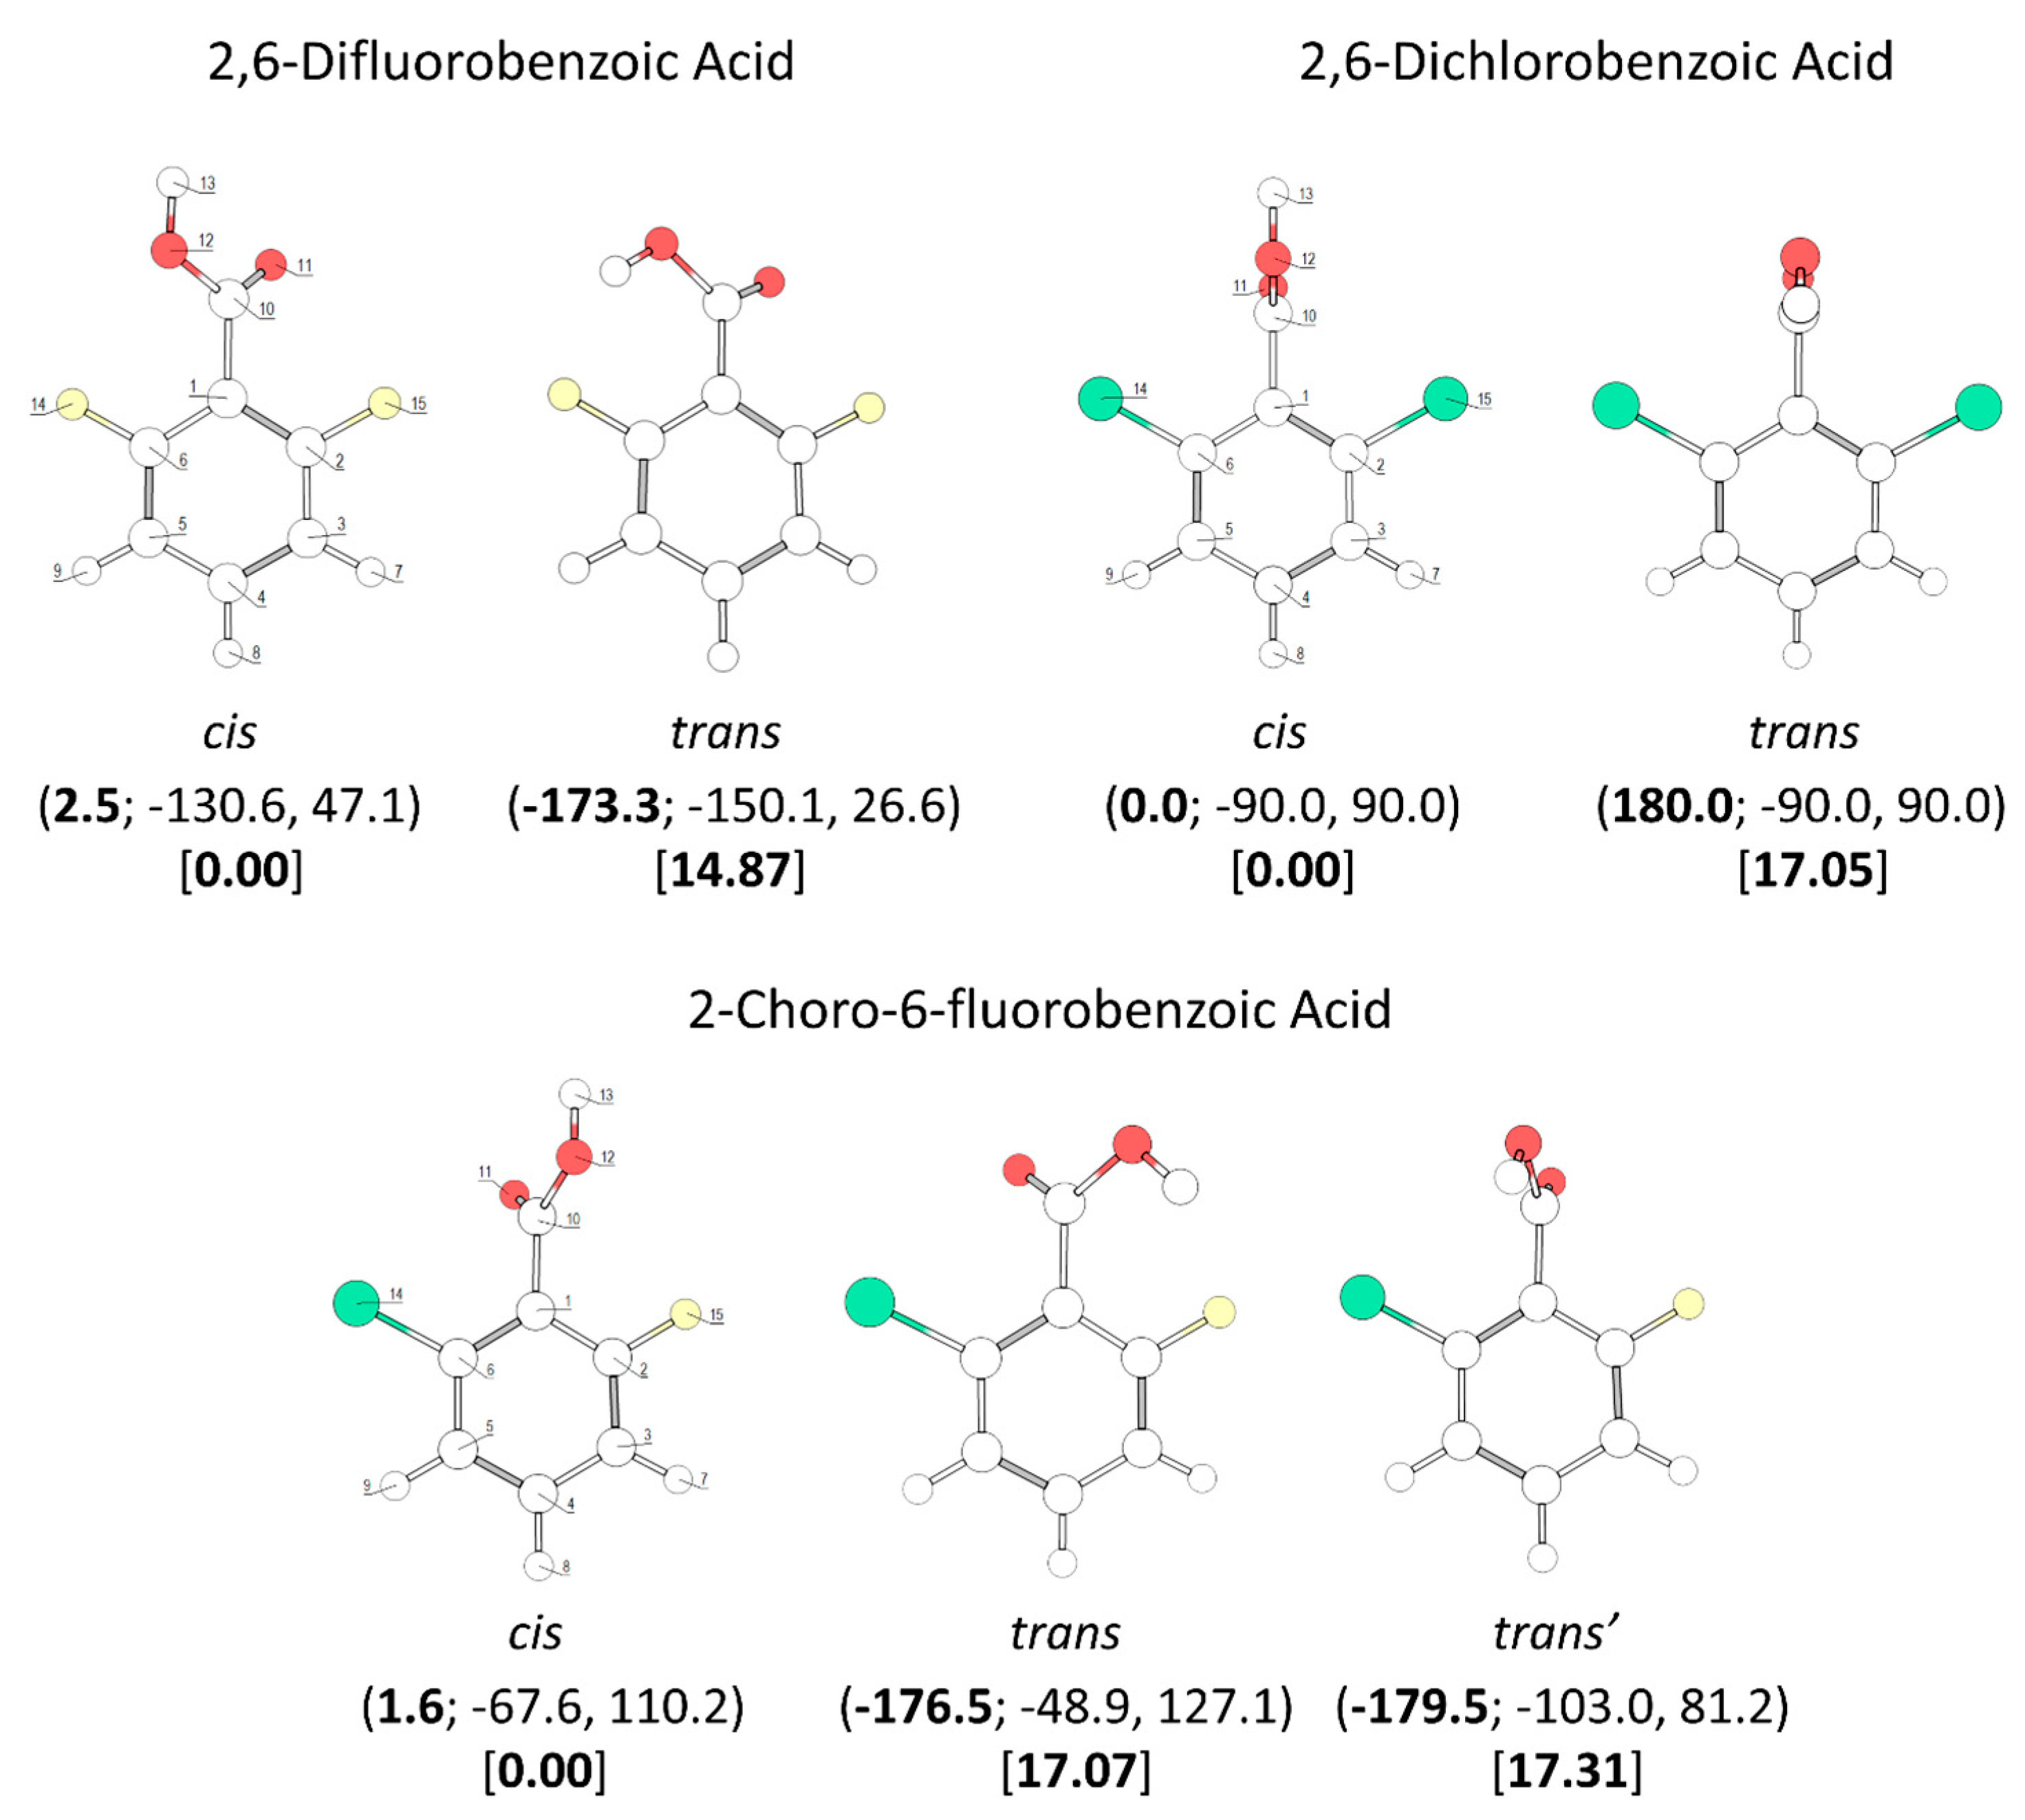
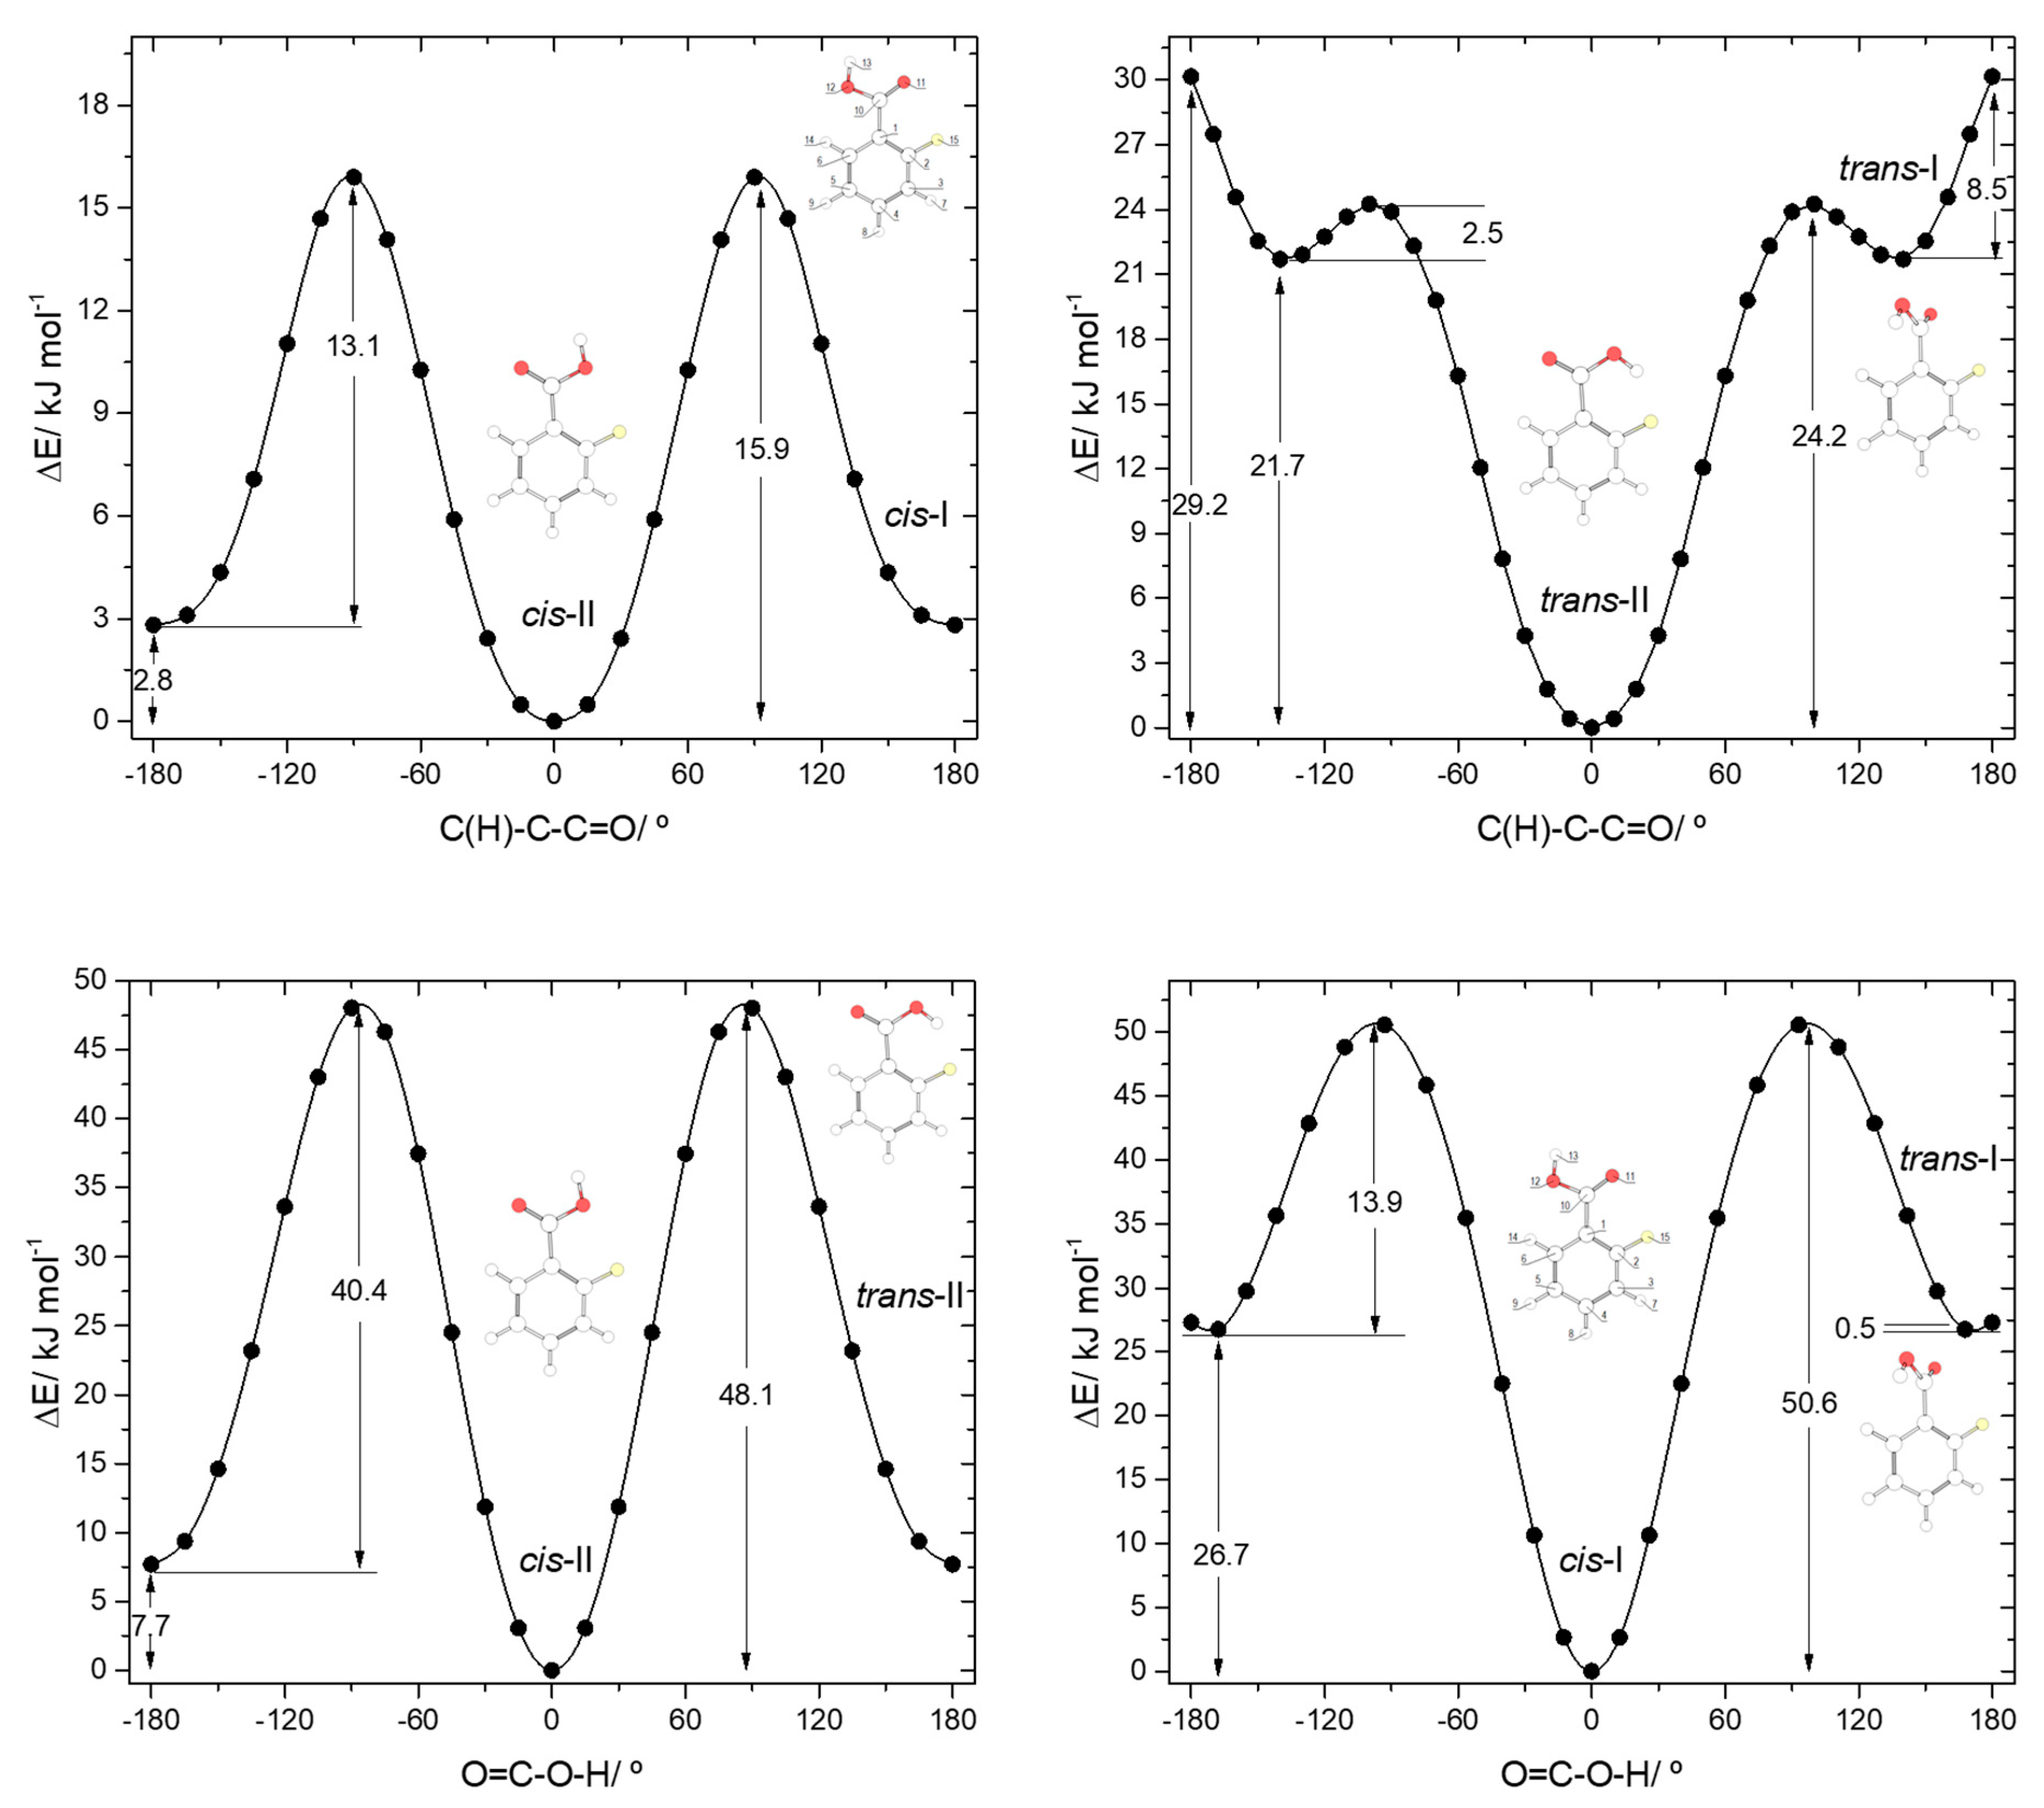
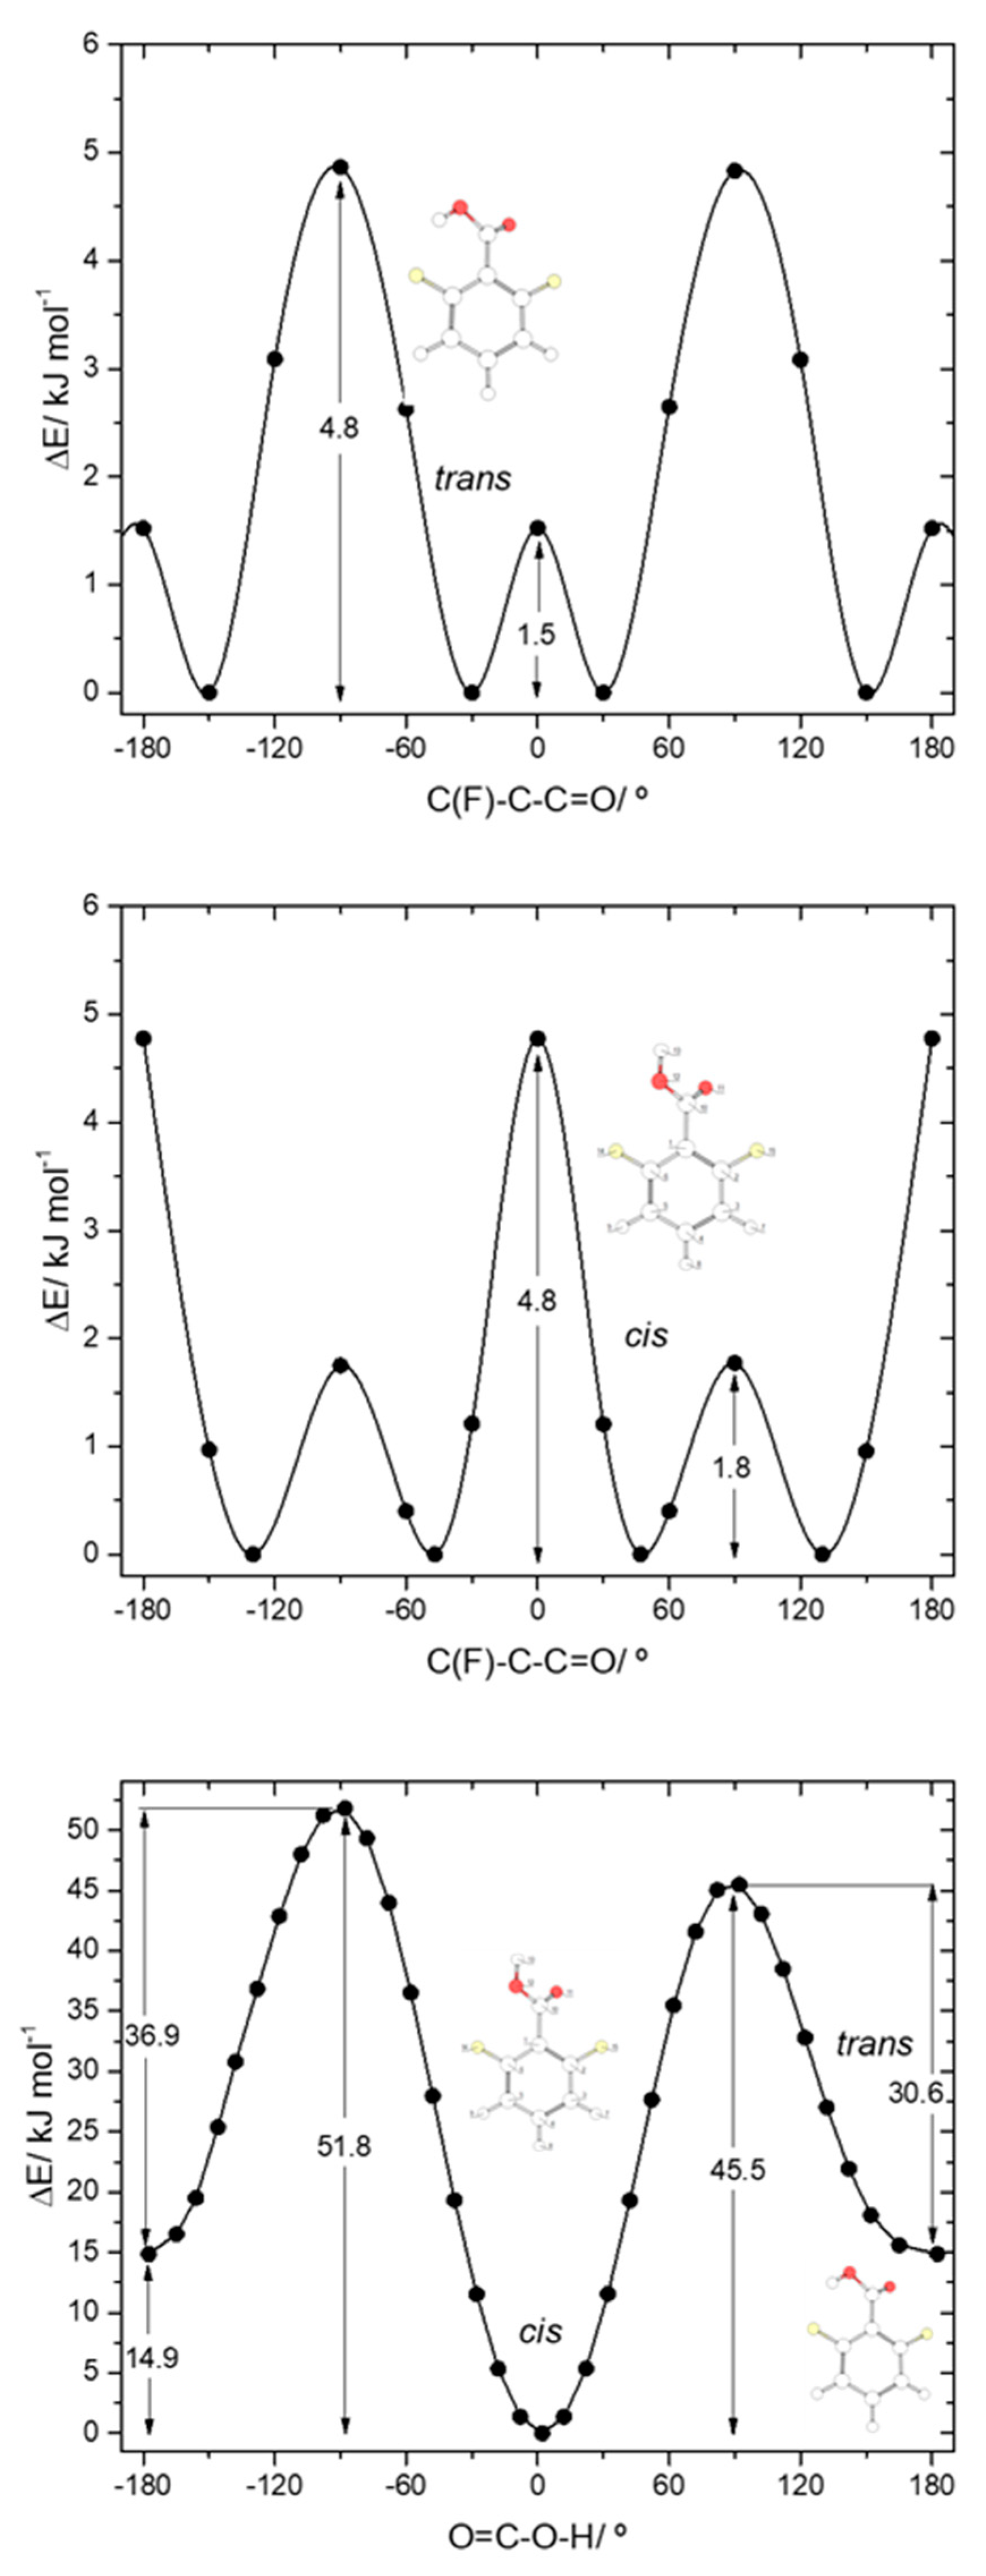
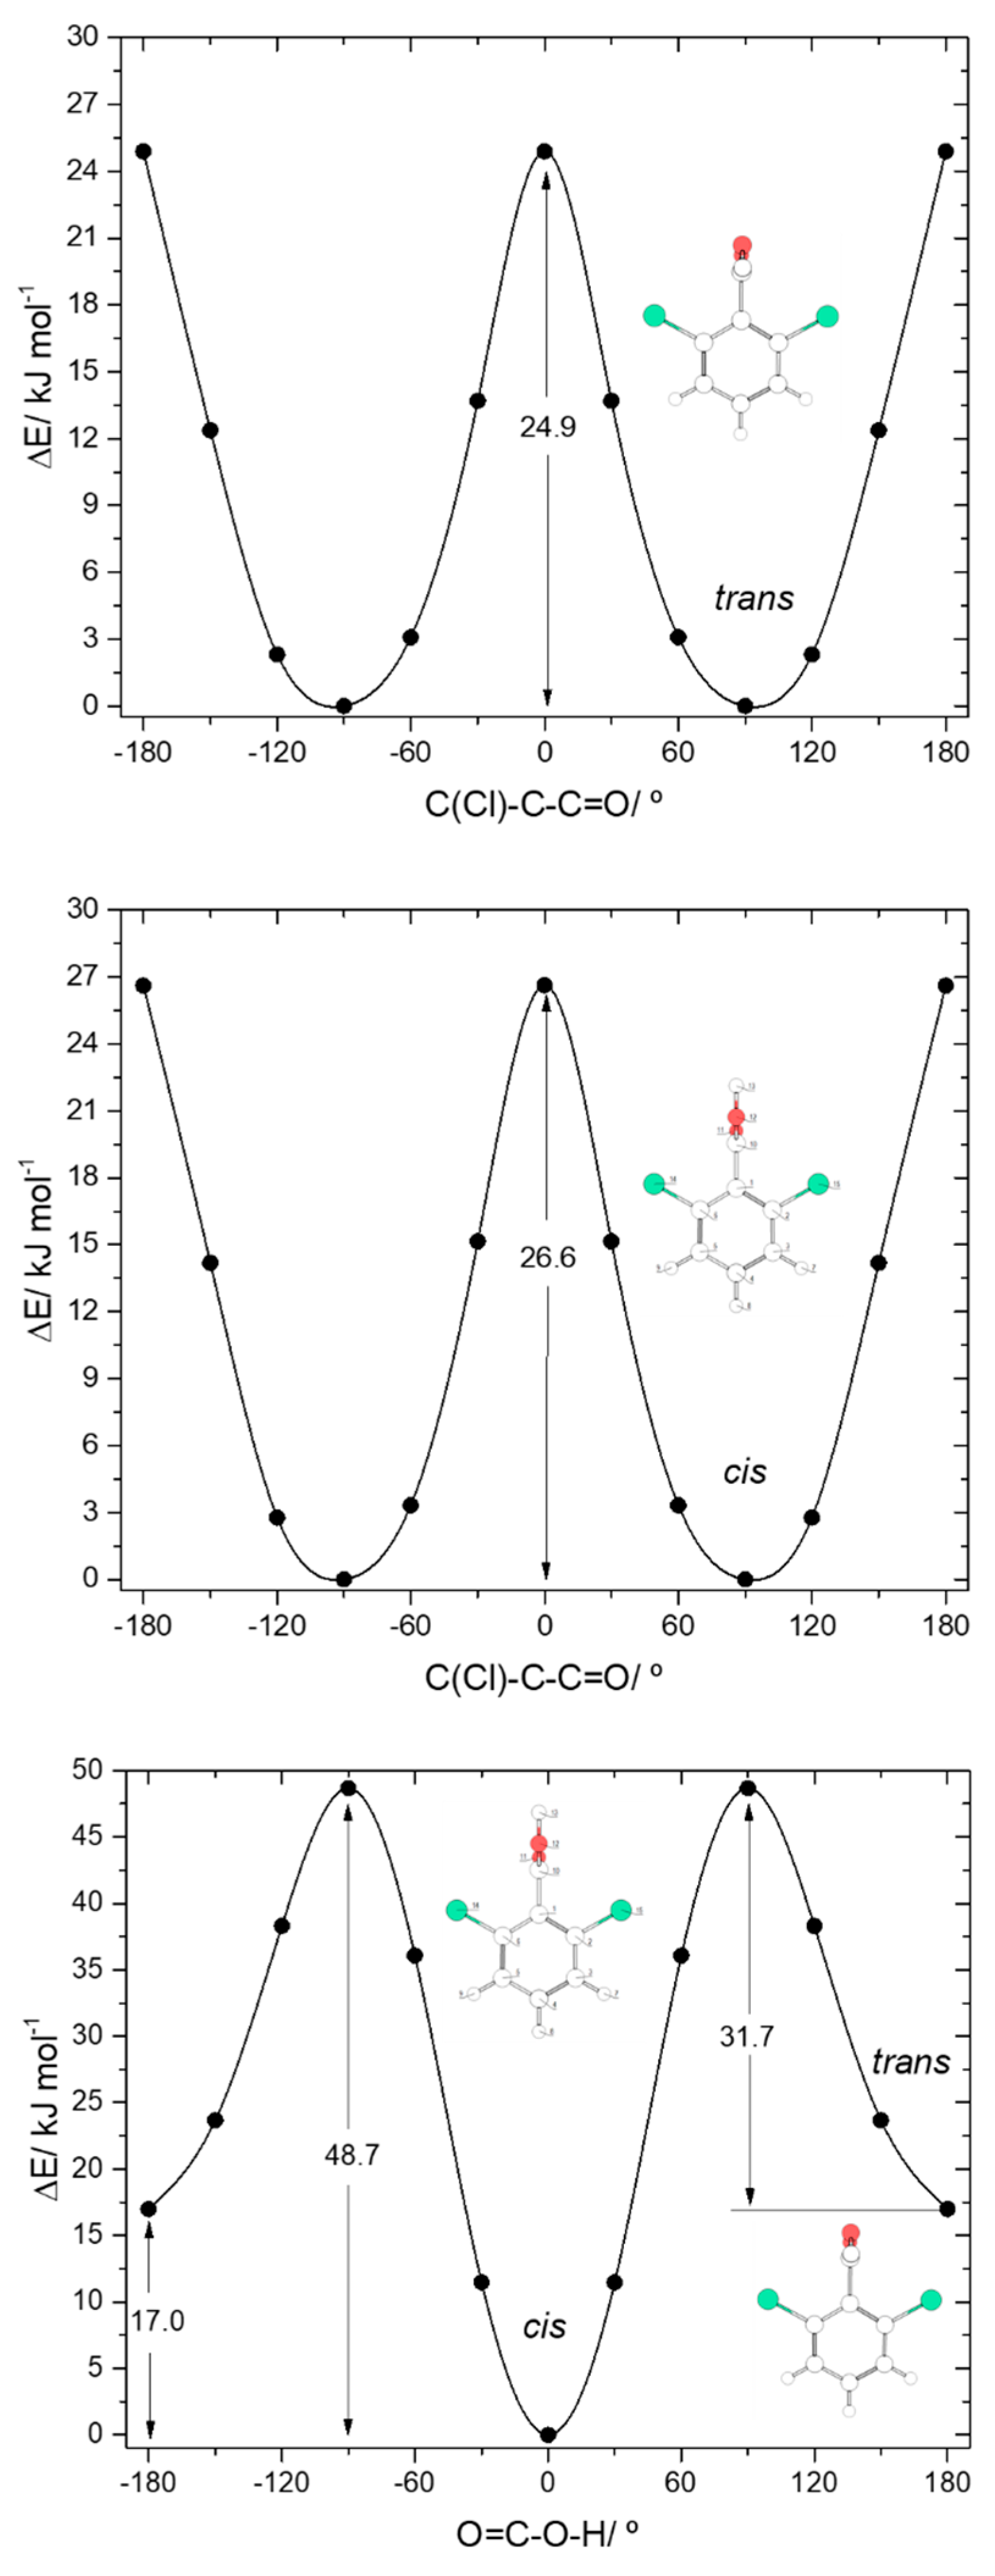
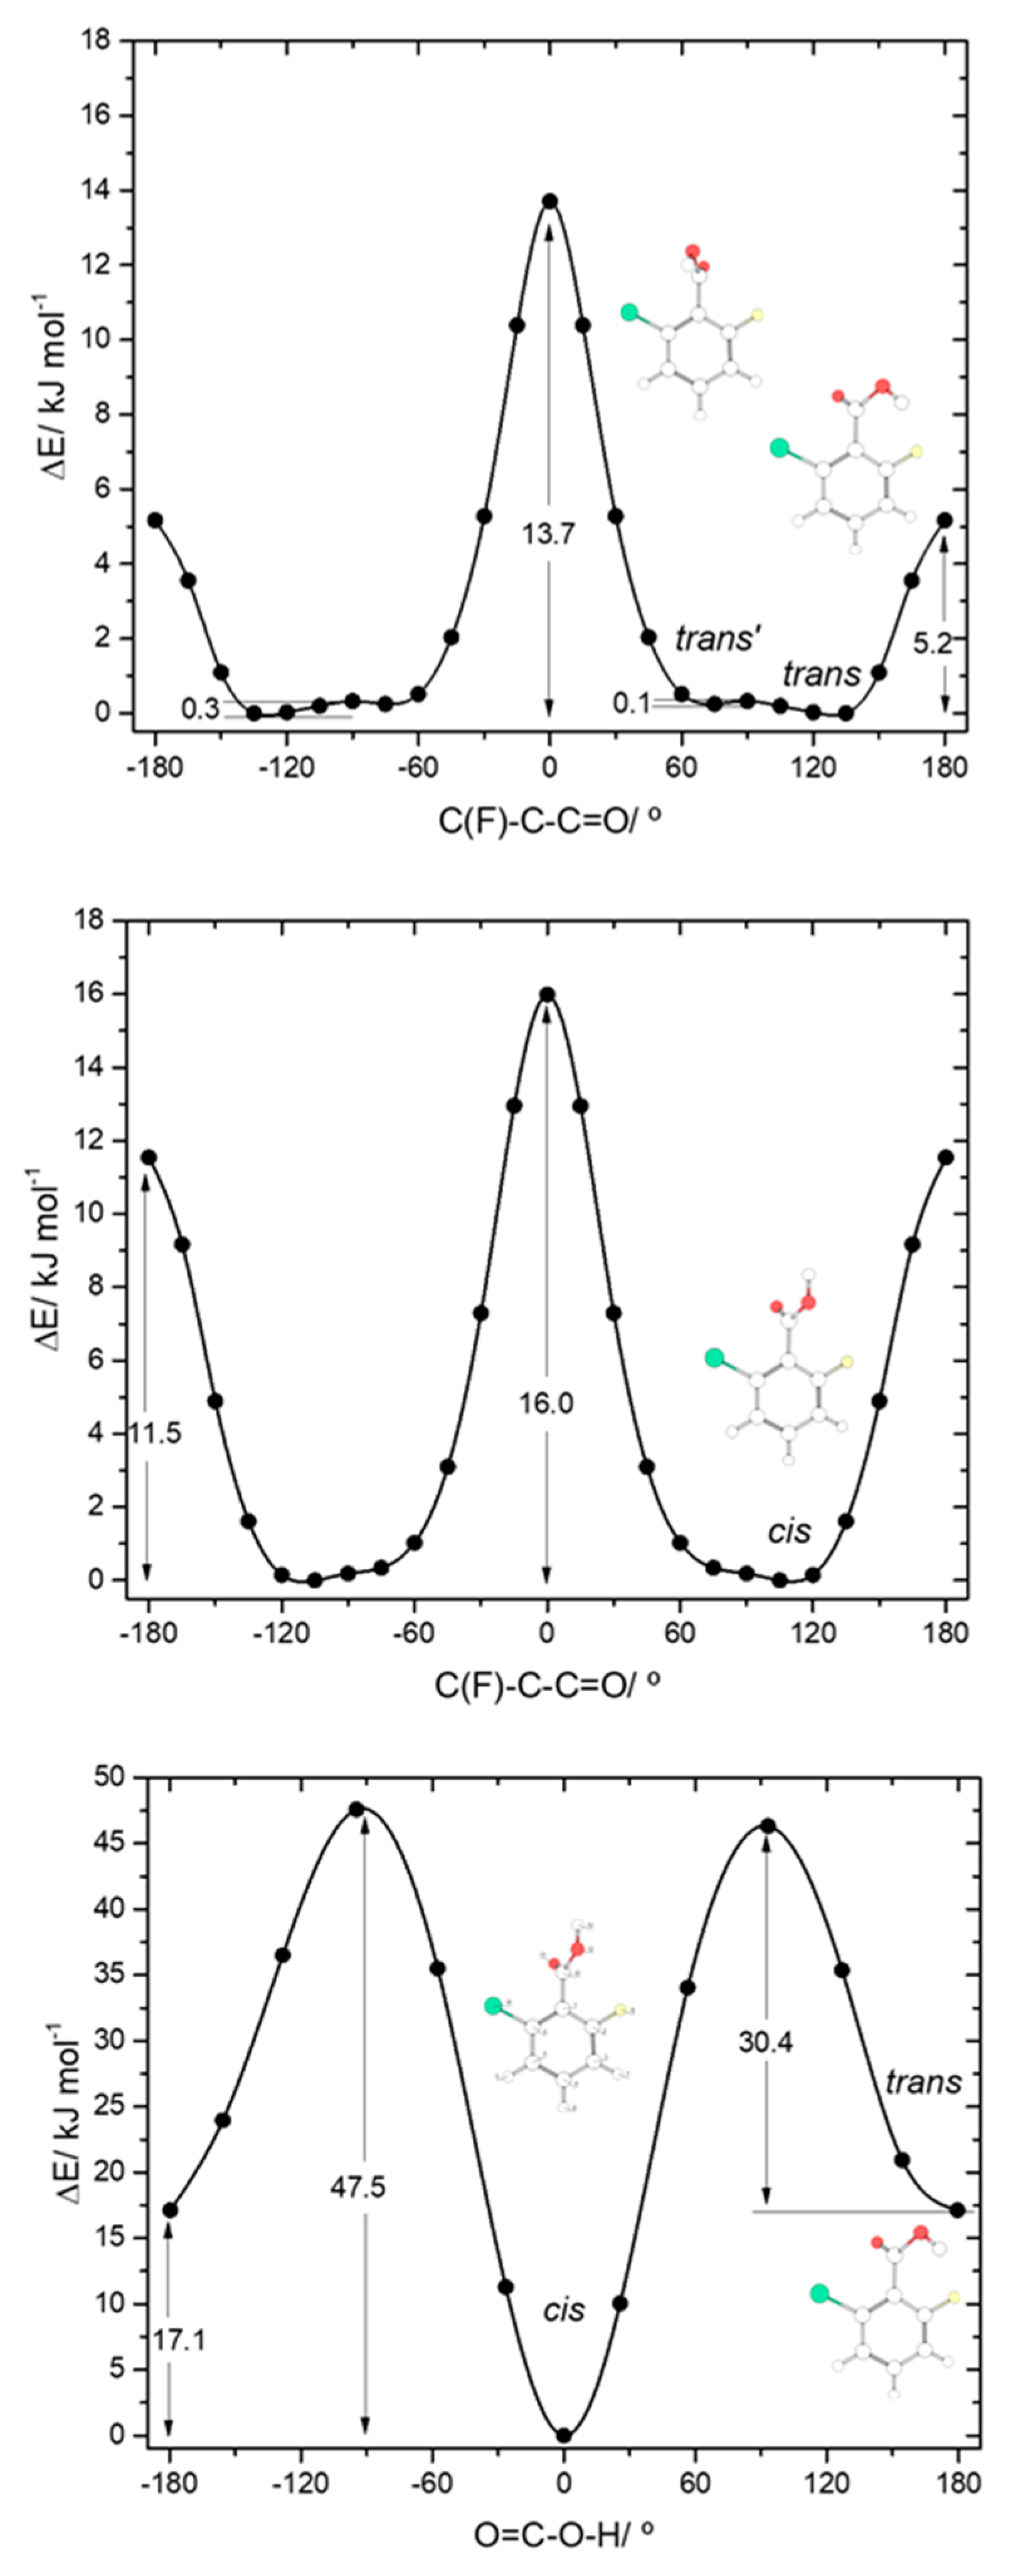
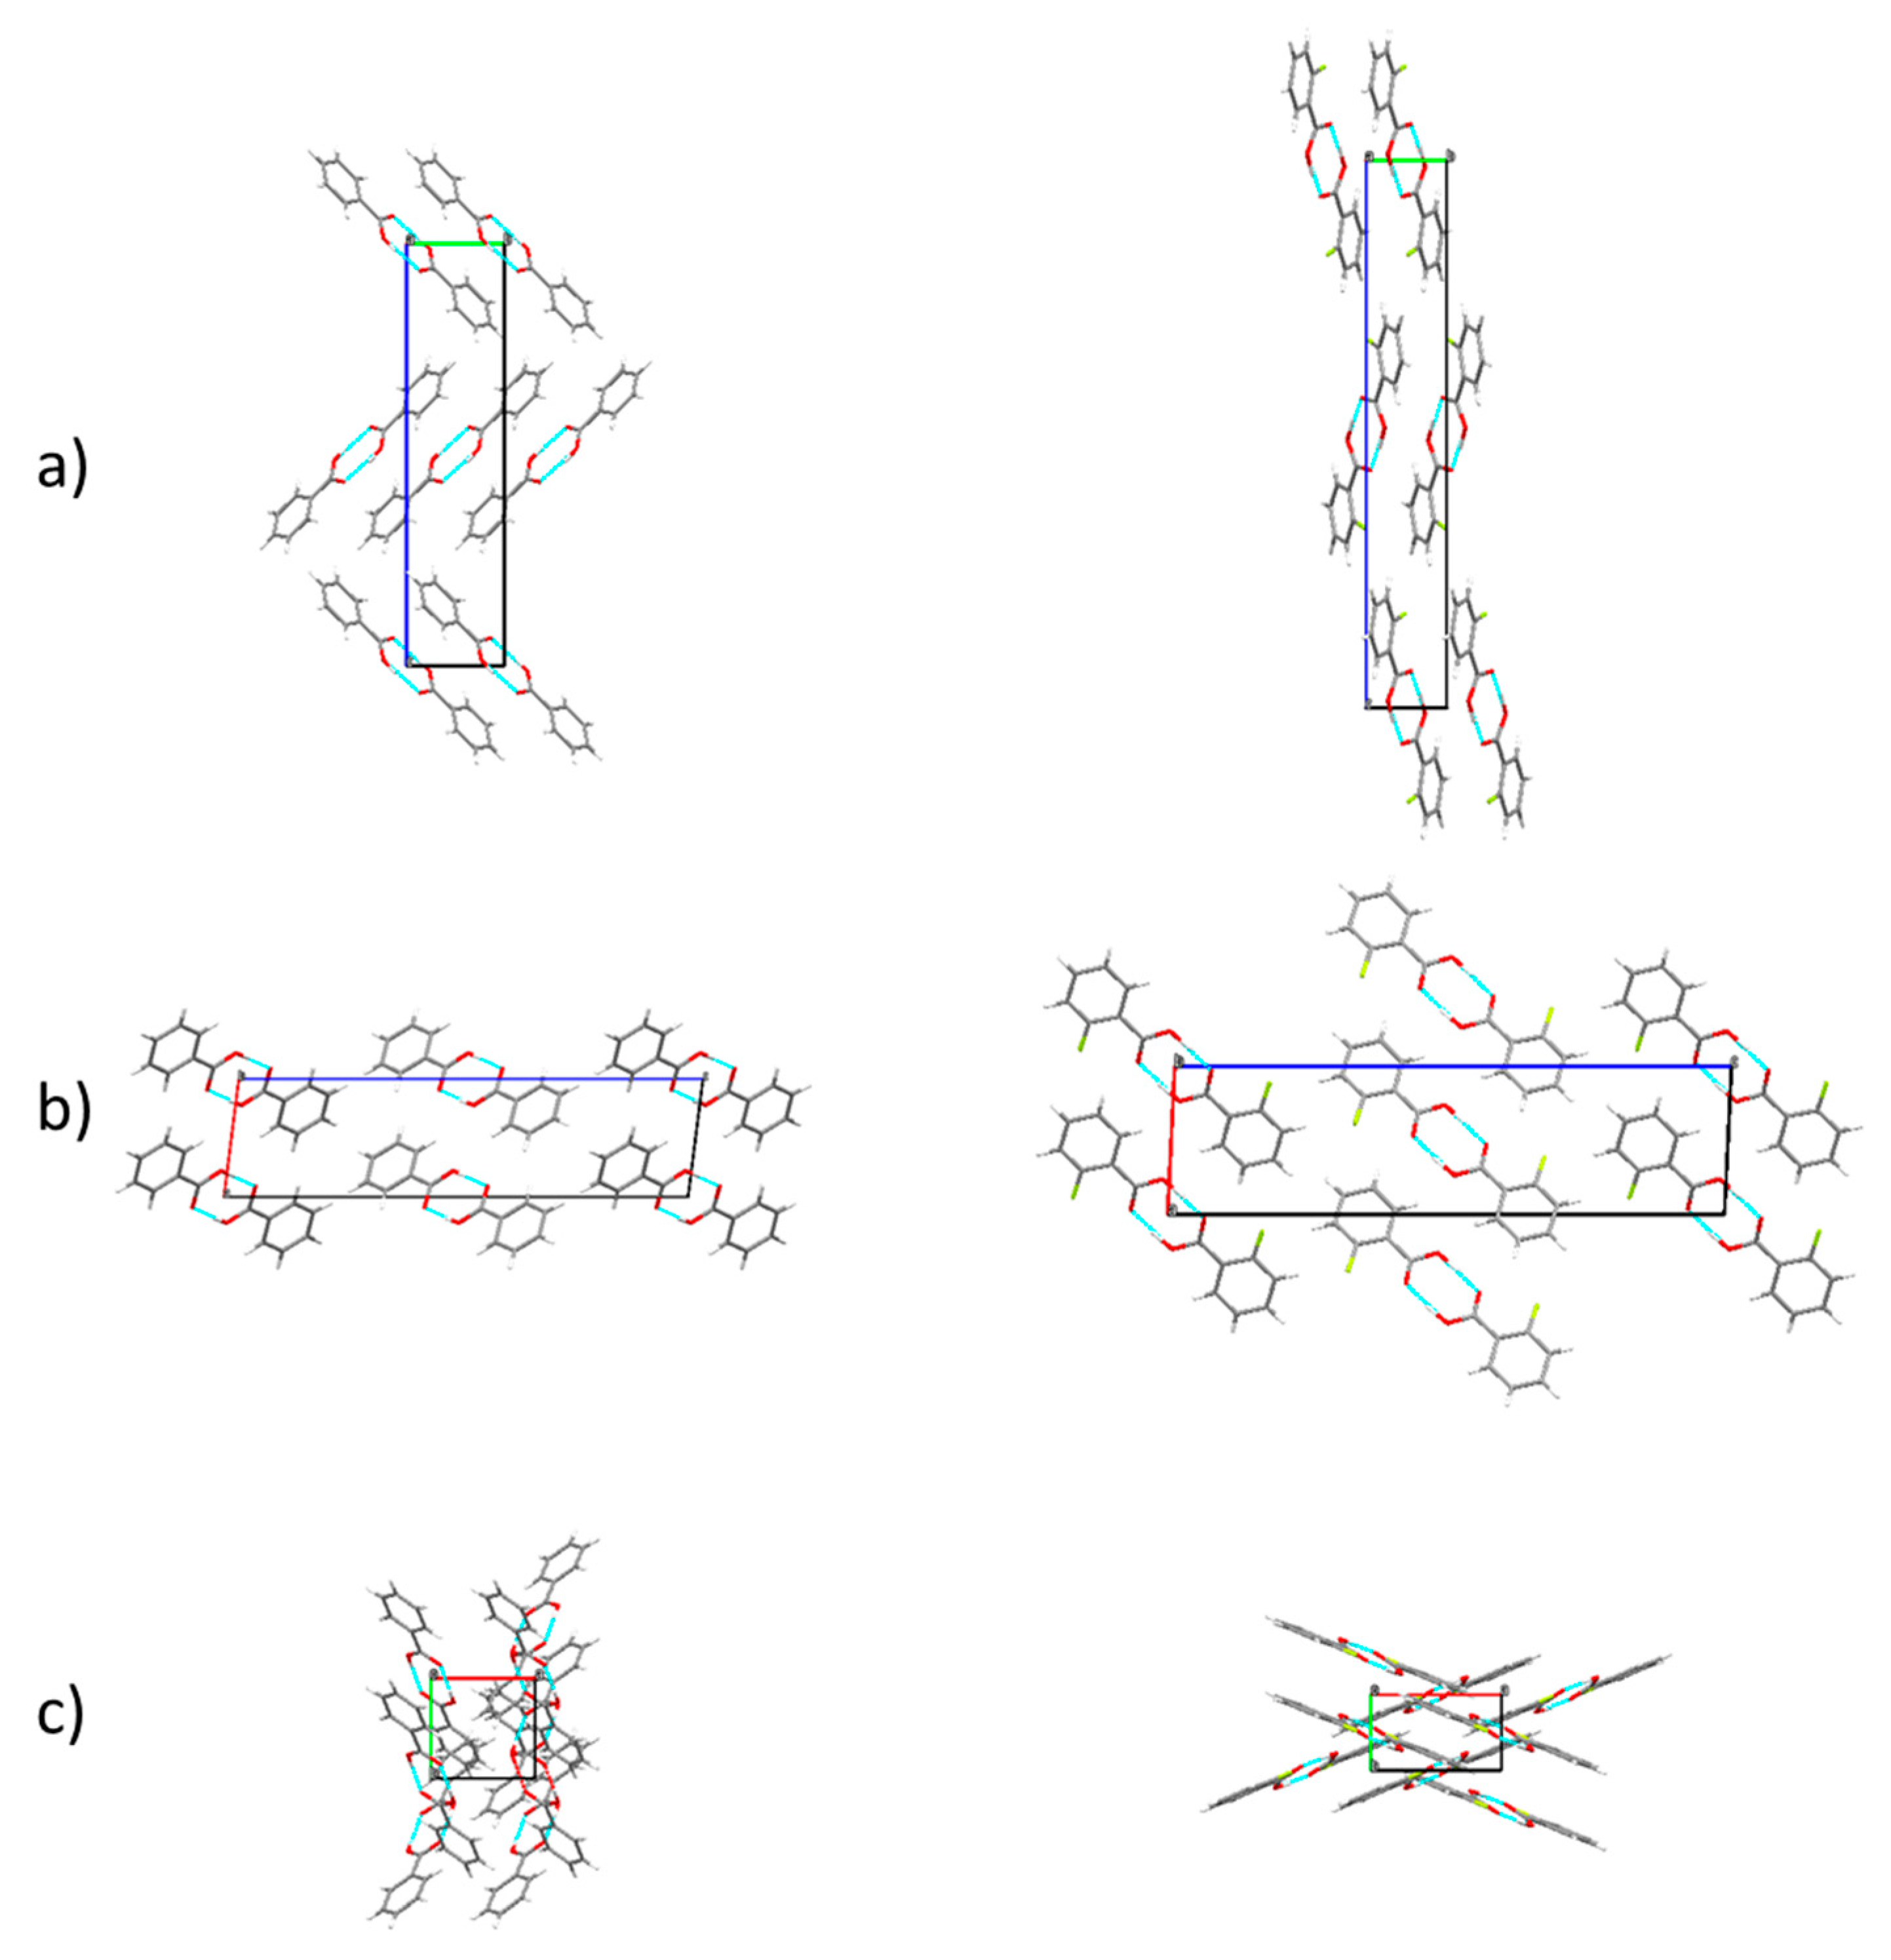
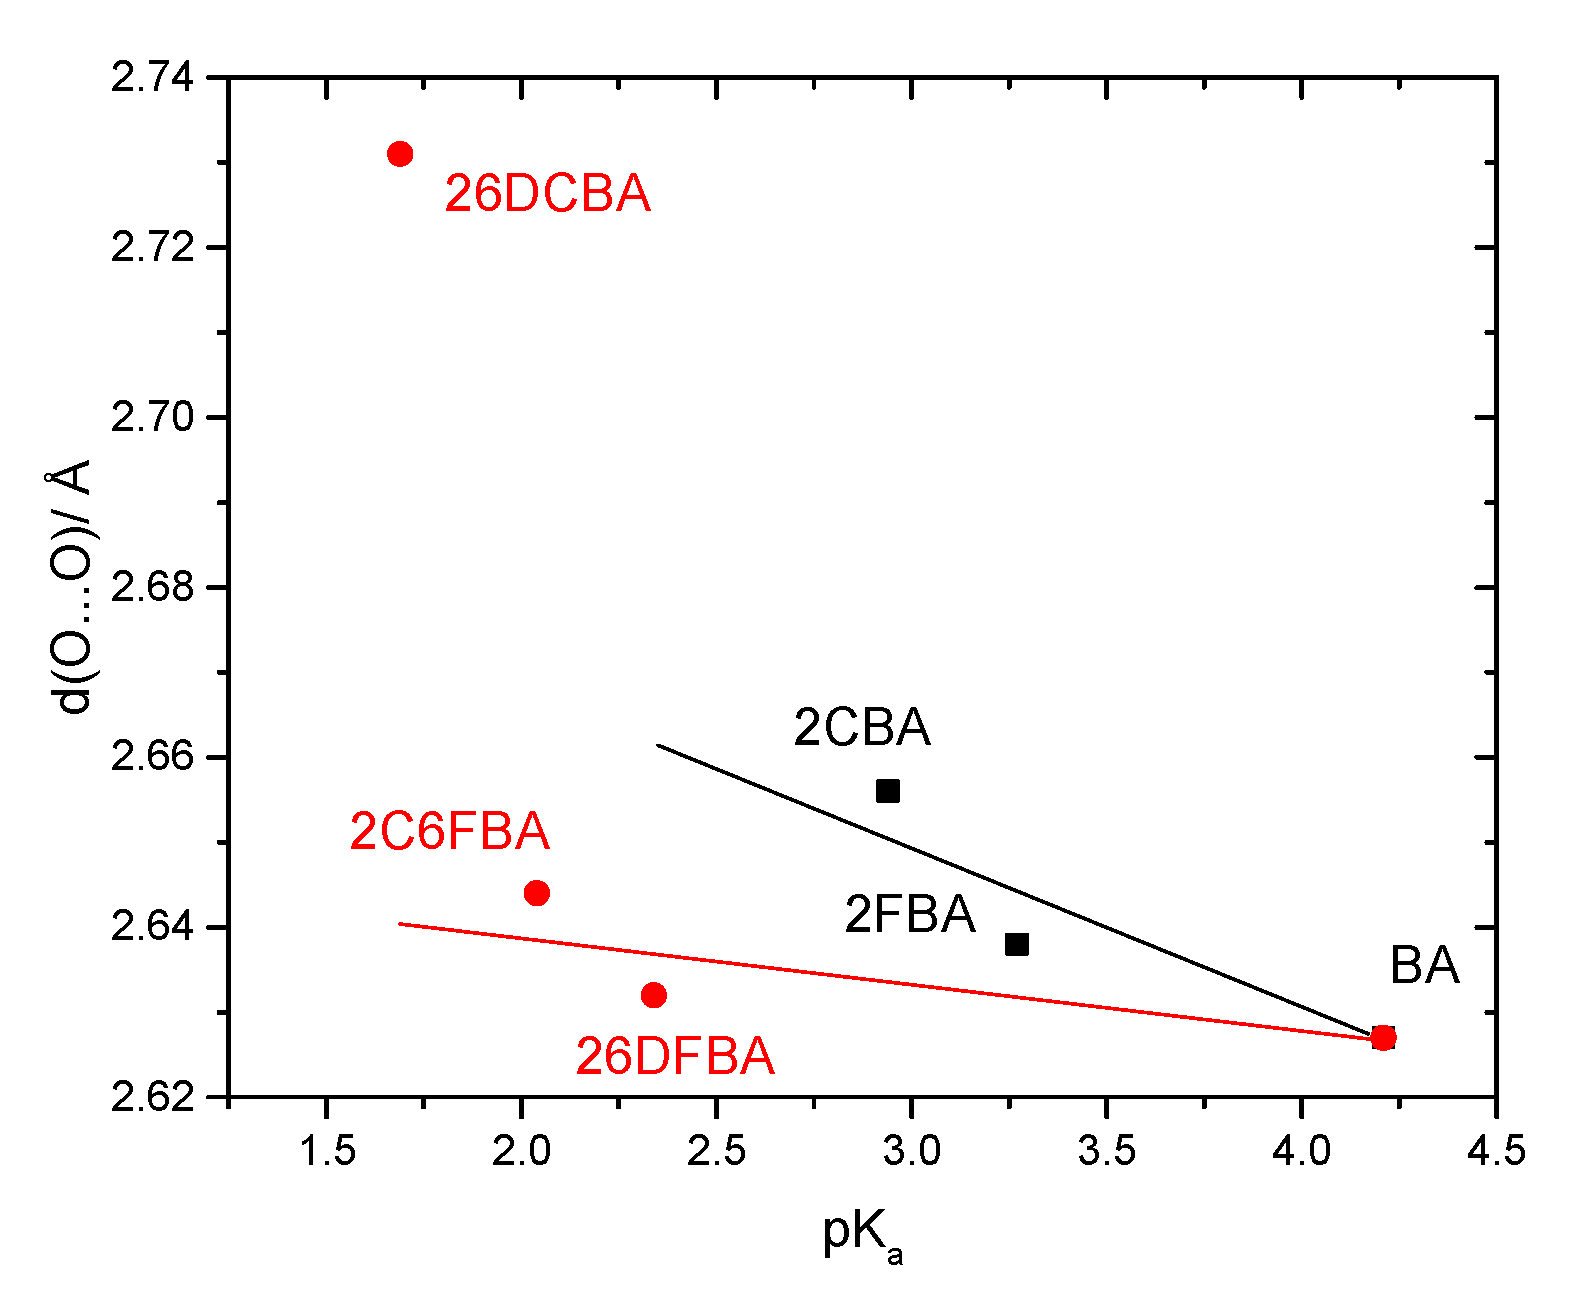
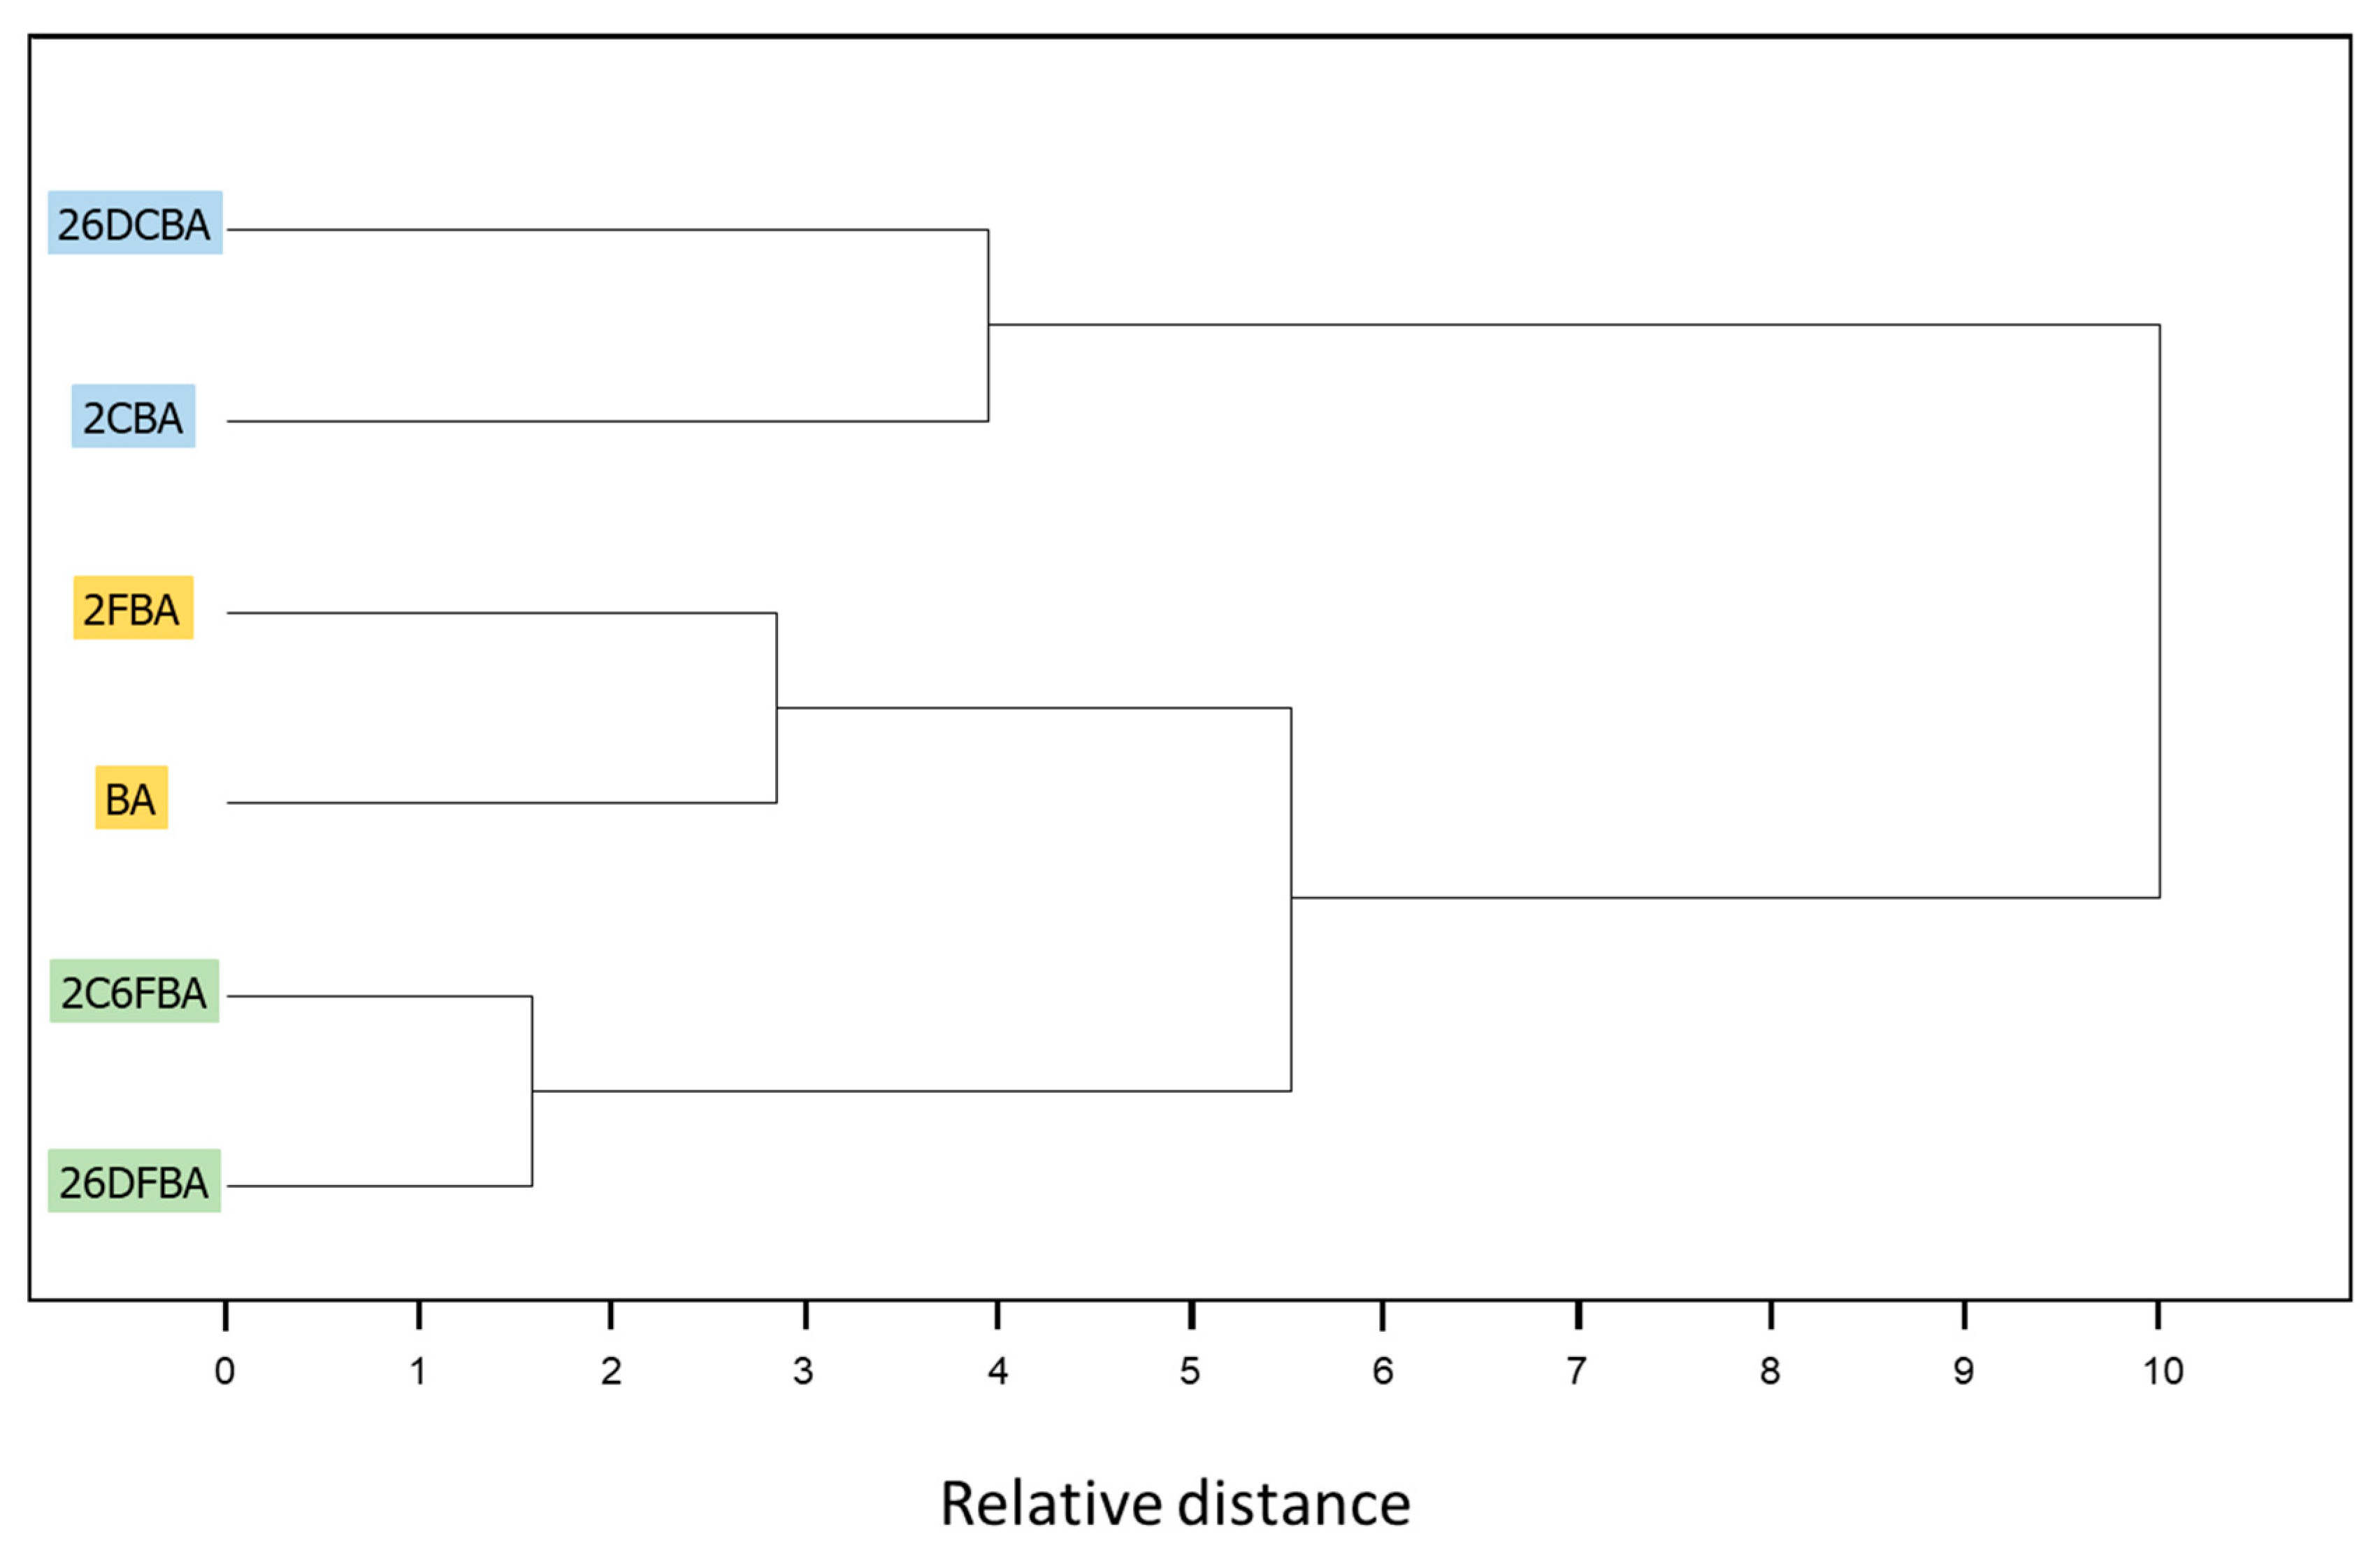