
Stacking Interactions of Poly Para-Phenylene Vinylene Oligomers with Graphene and Single-Walled Carbon Nanotubes: A Molecular Dynamics Approach


 , , and
Abstract
1. Introduction
2. Materials and Methods
2.1. Simulation Method
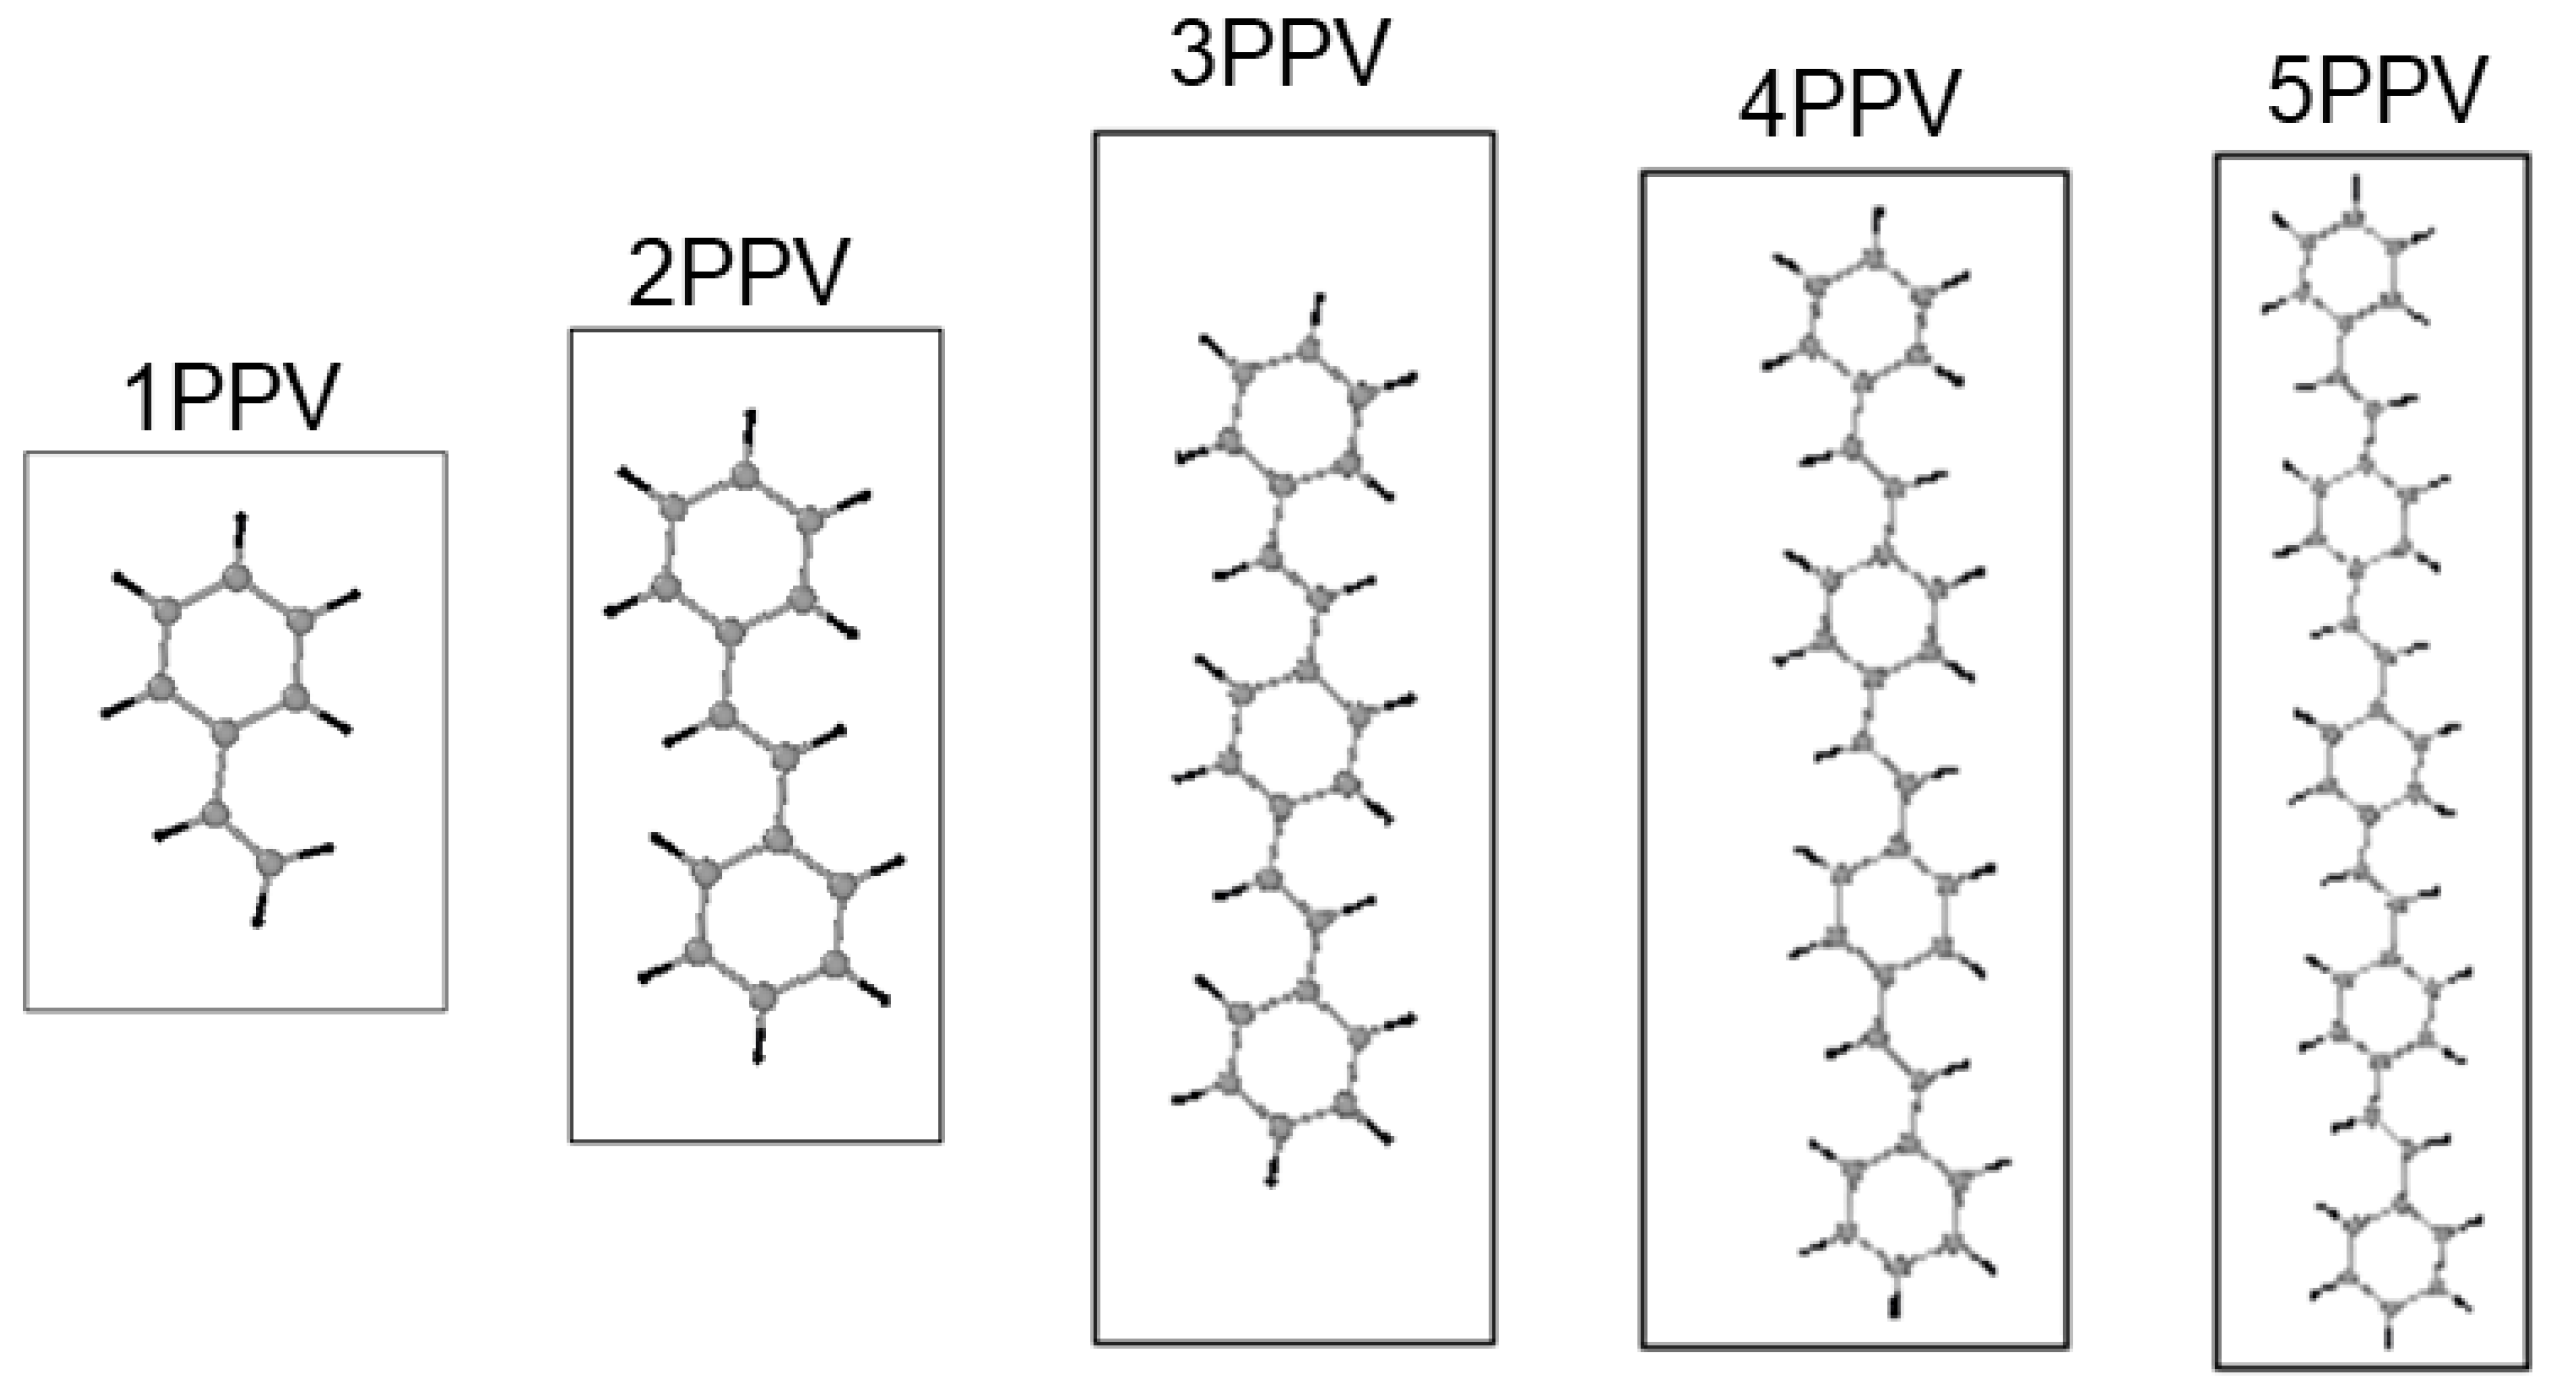
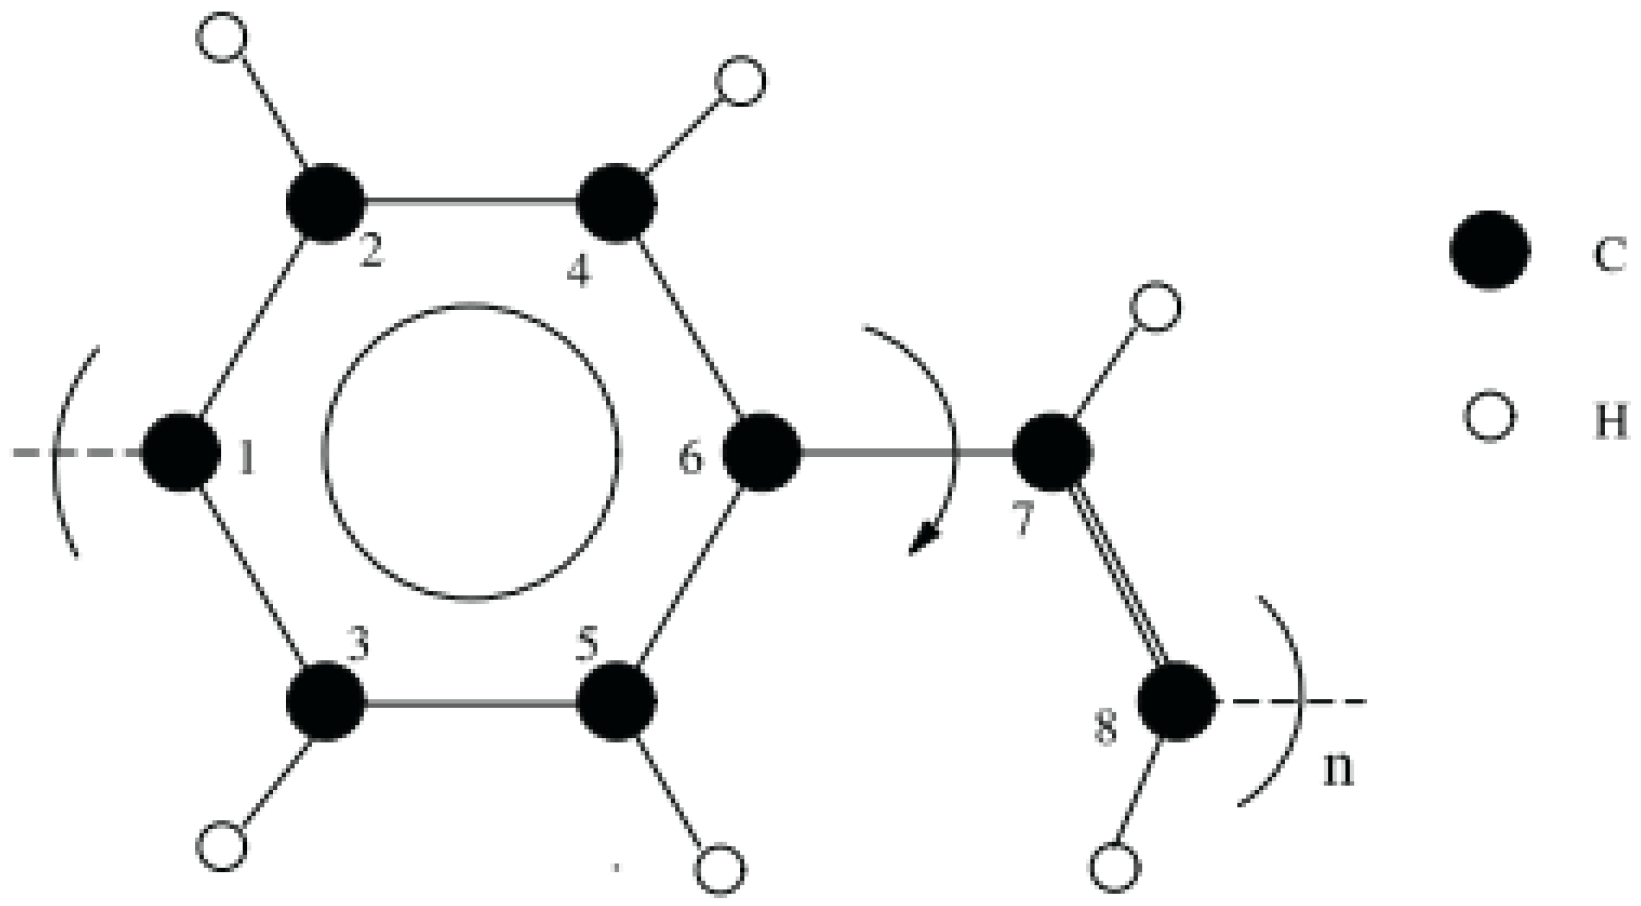
2.2. Simulation Models
3. Results
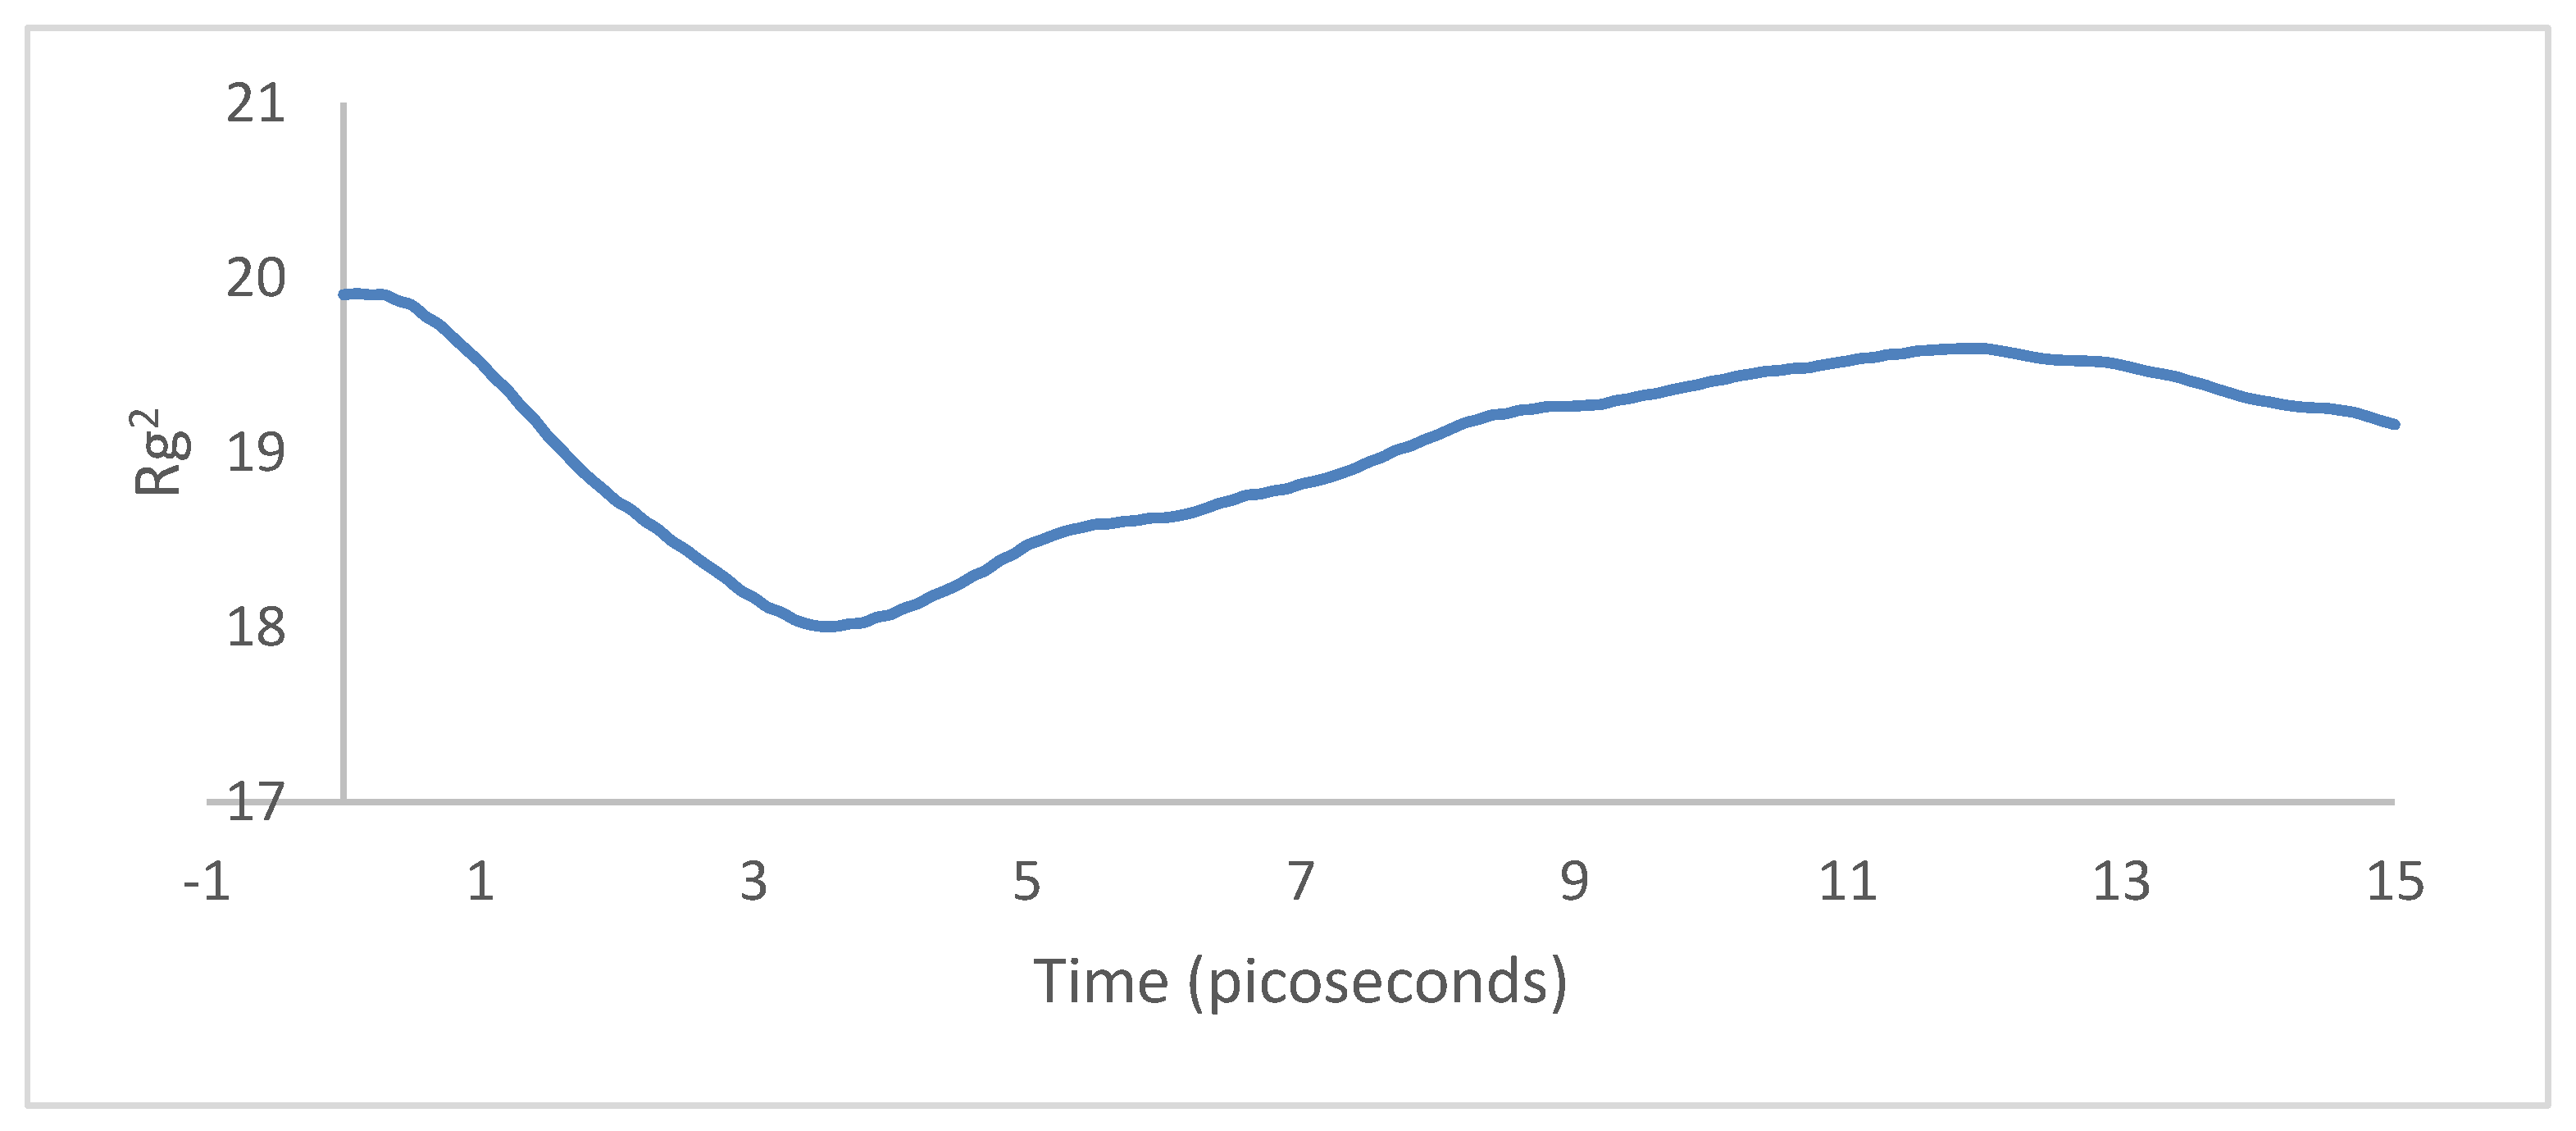
3.1. Geometry Optimization
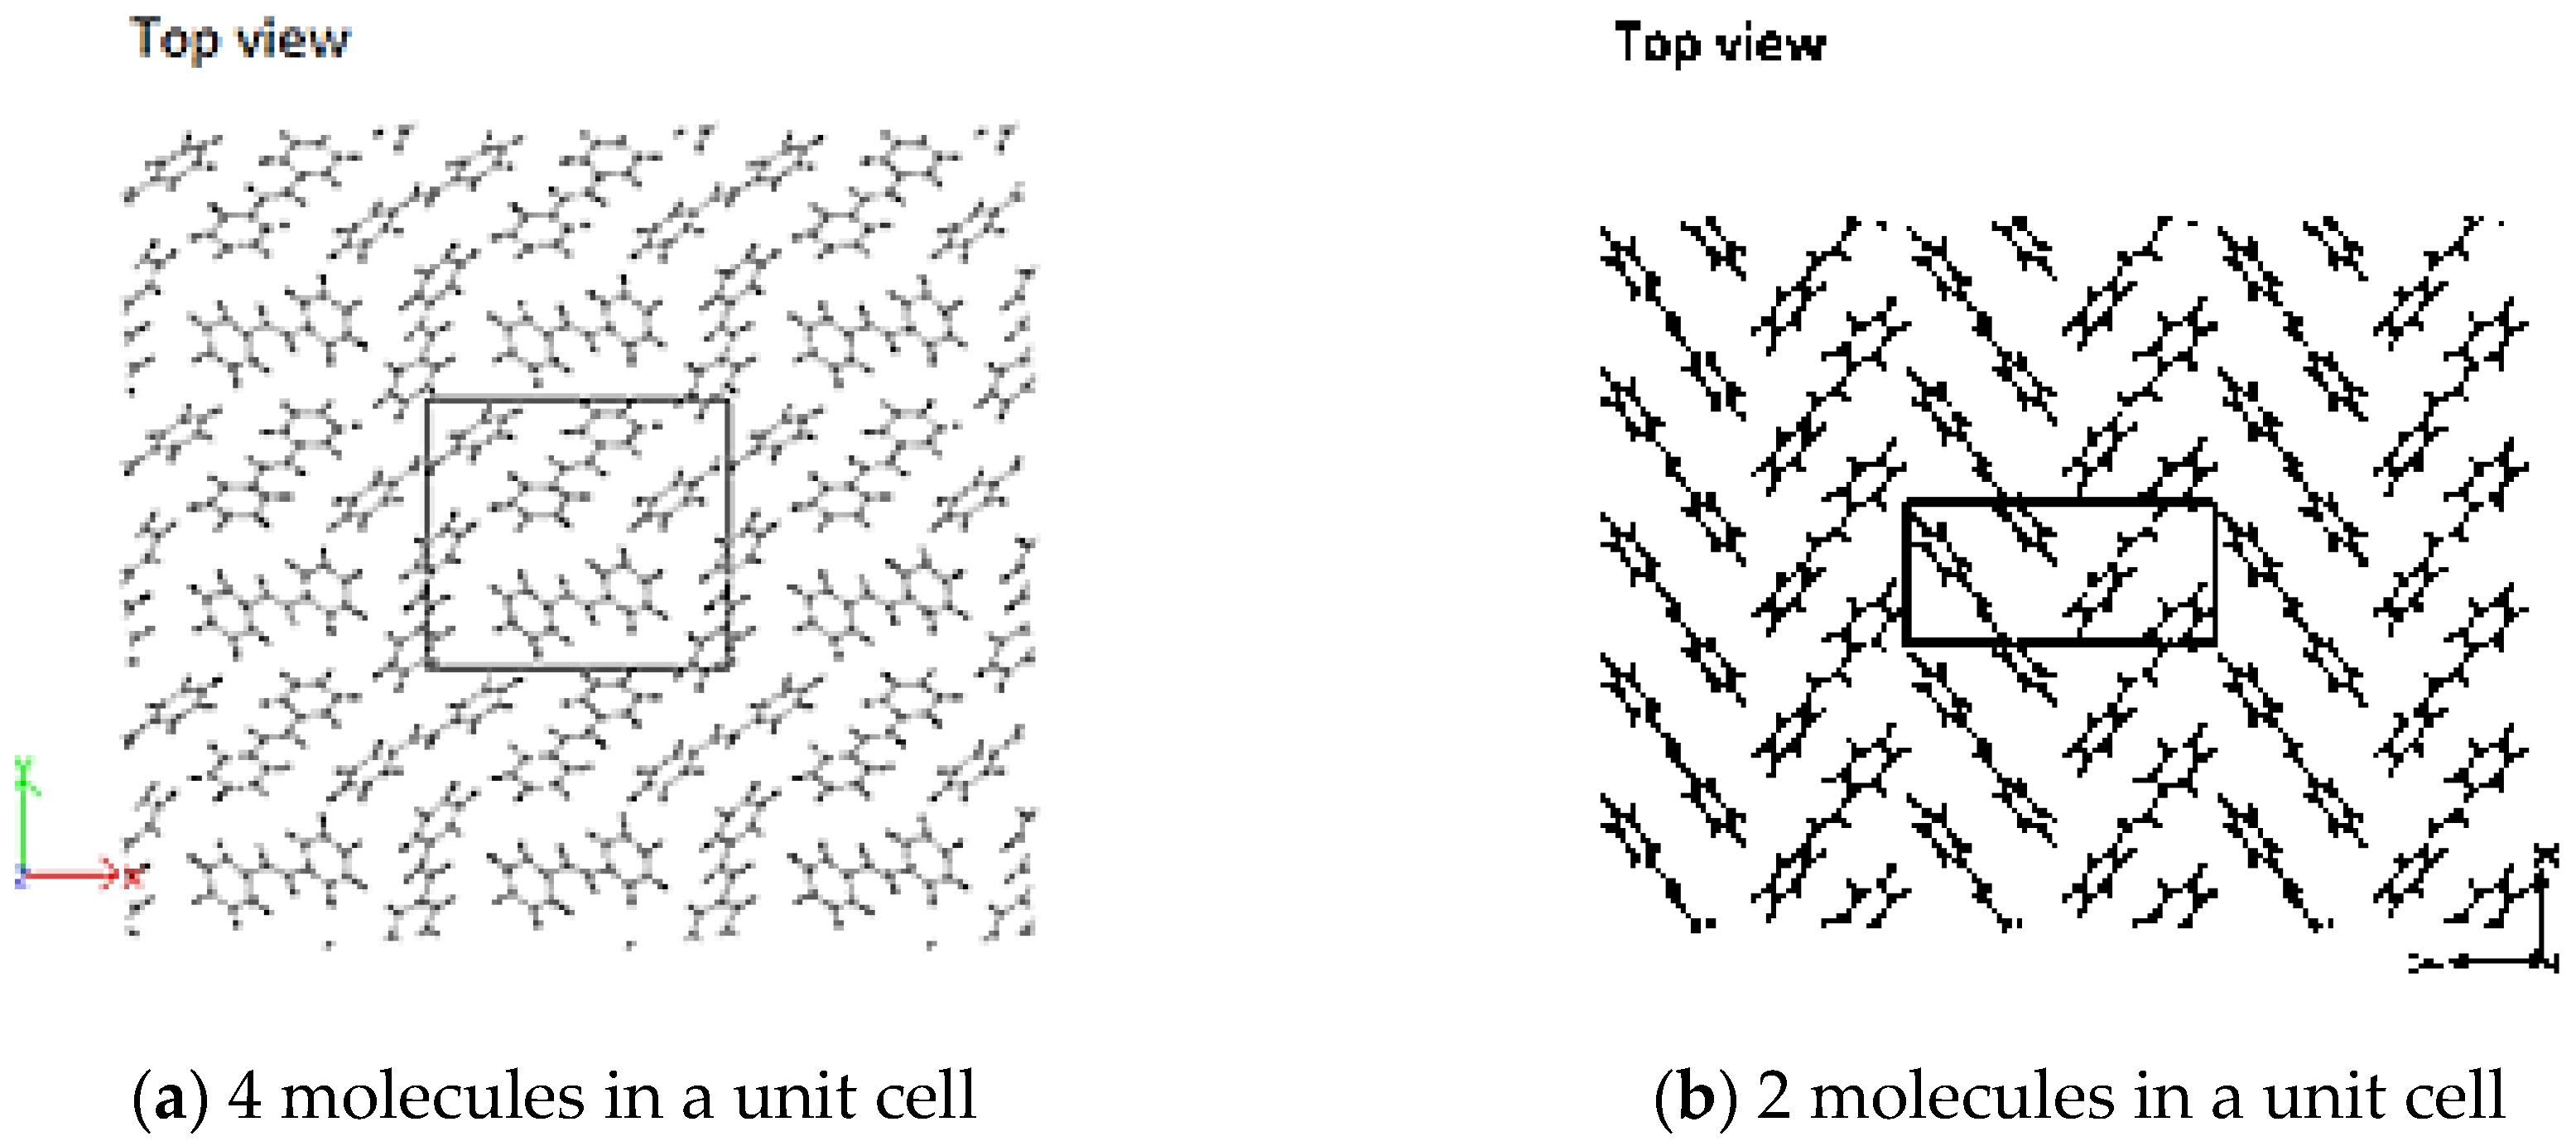
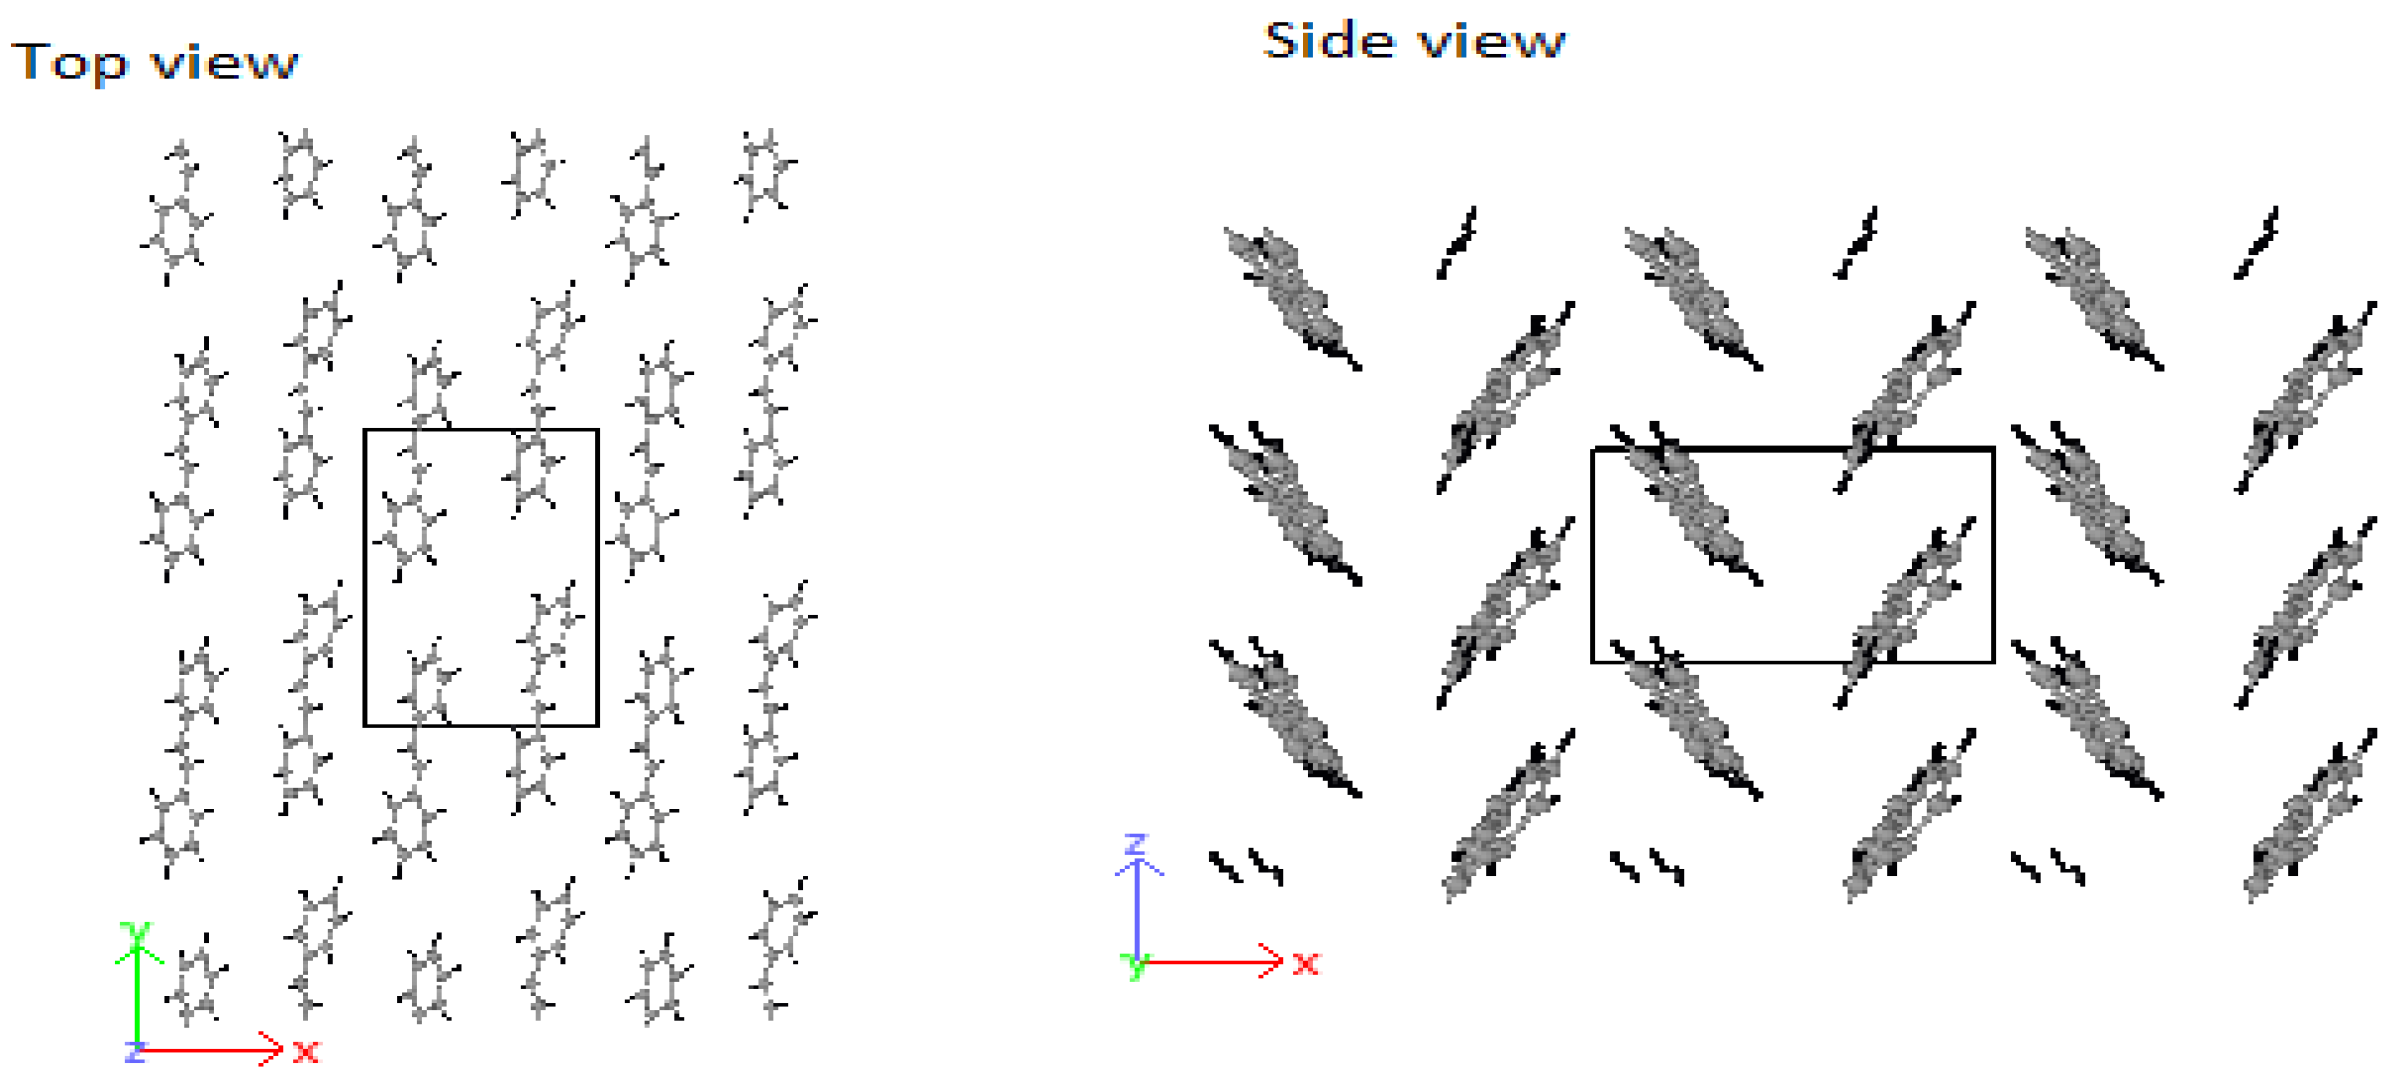
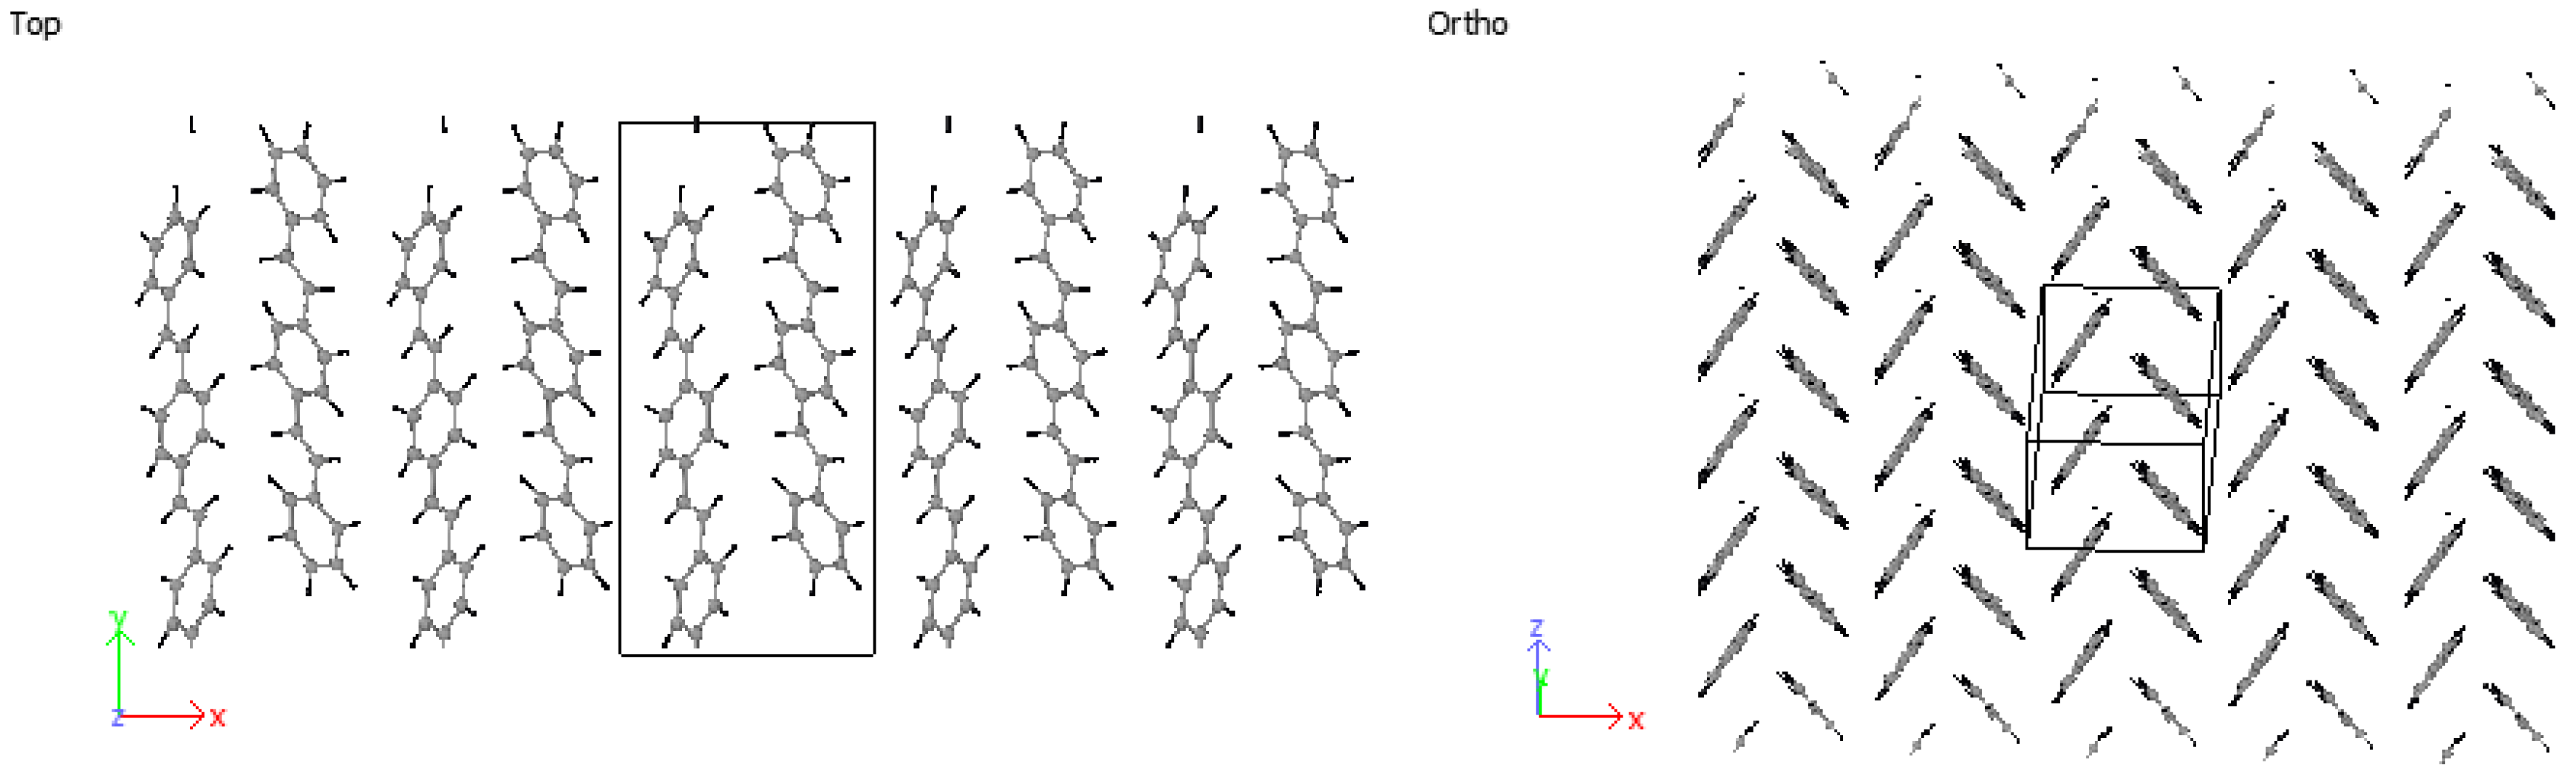
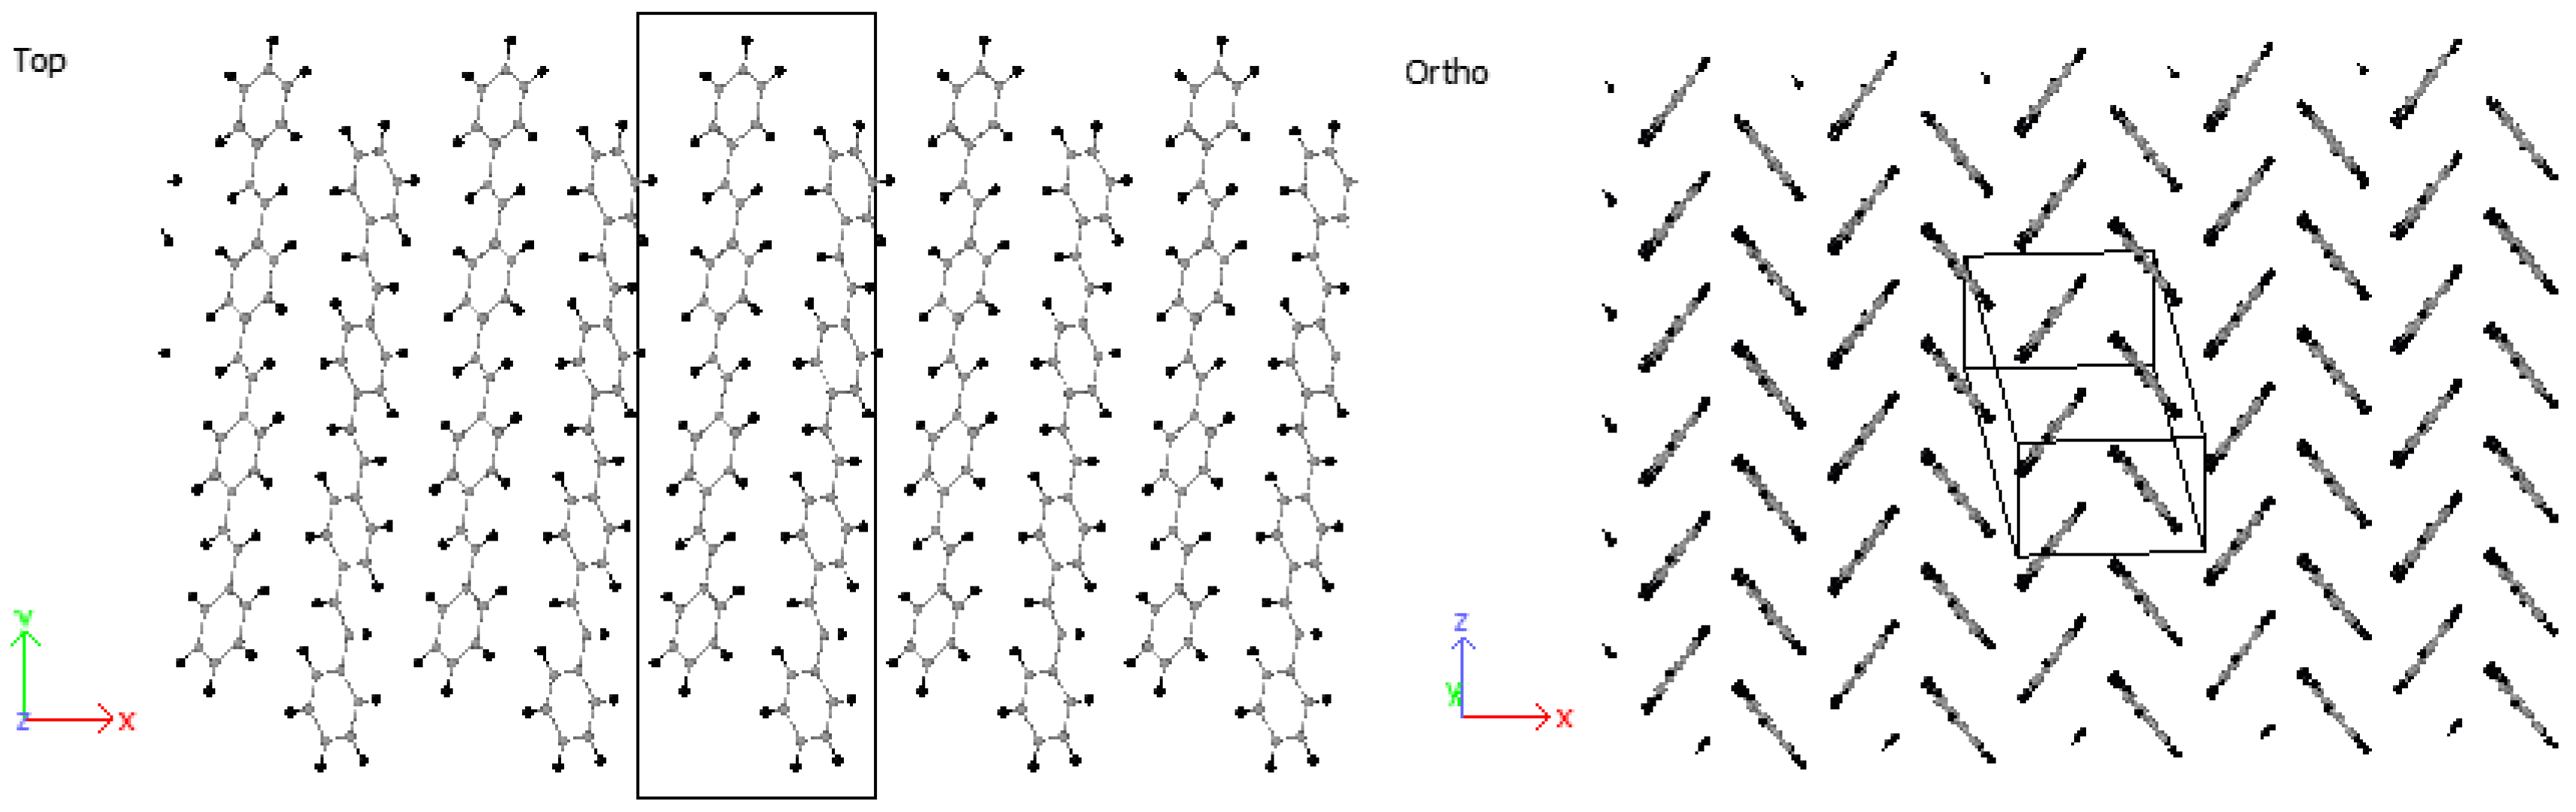
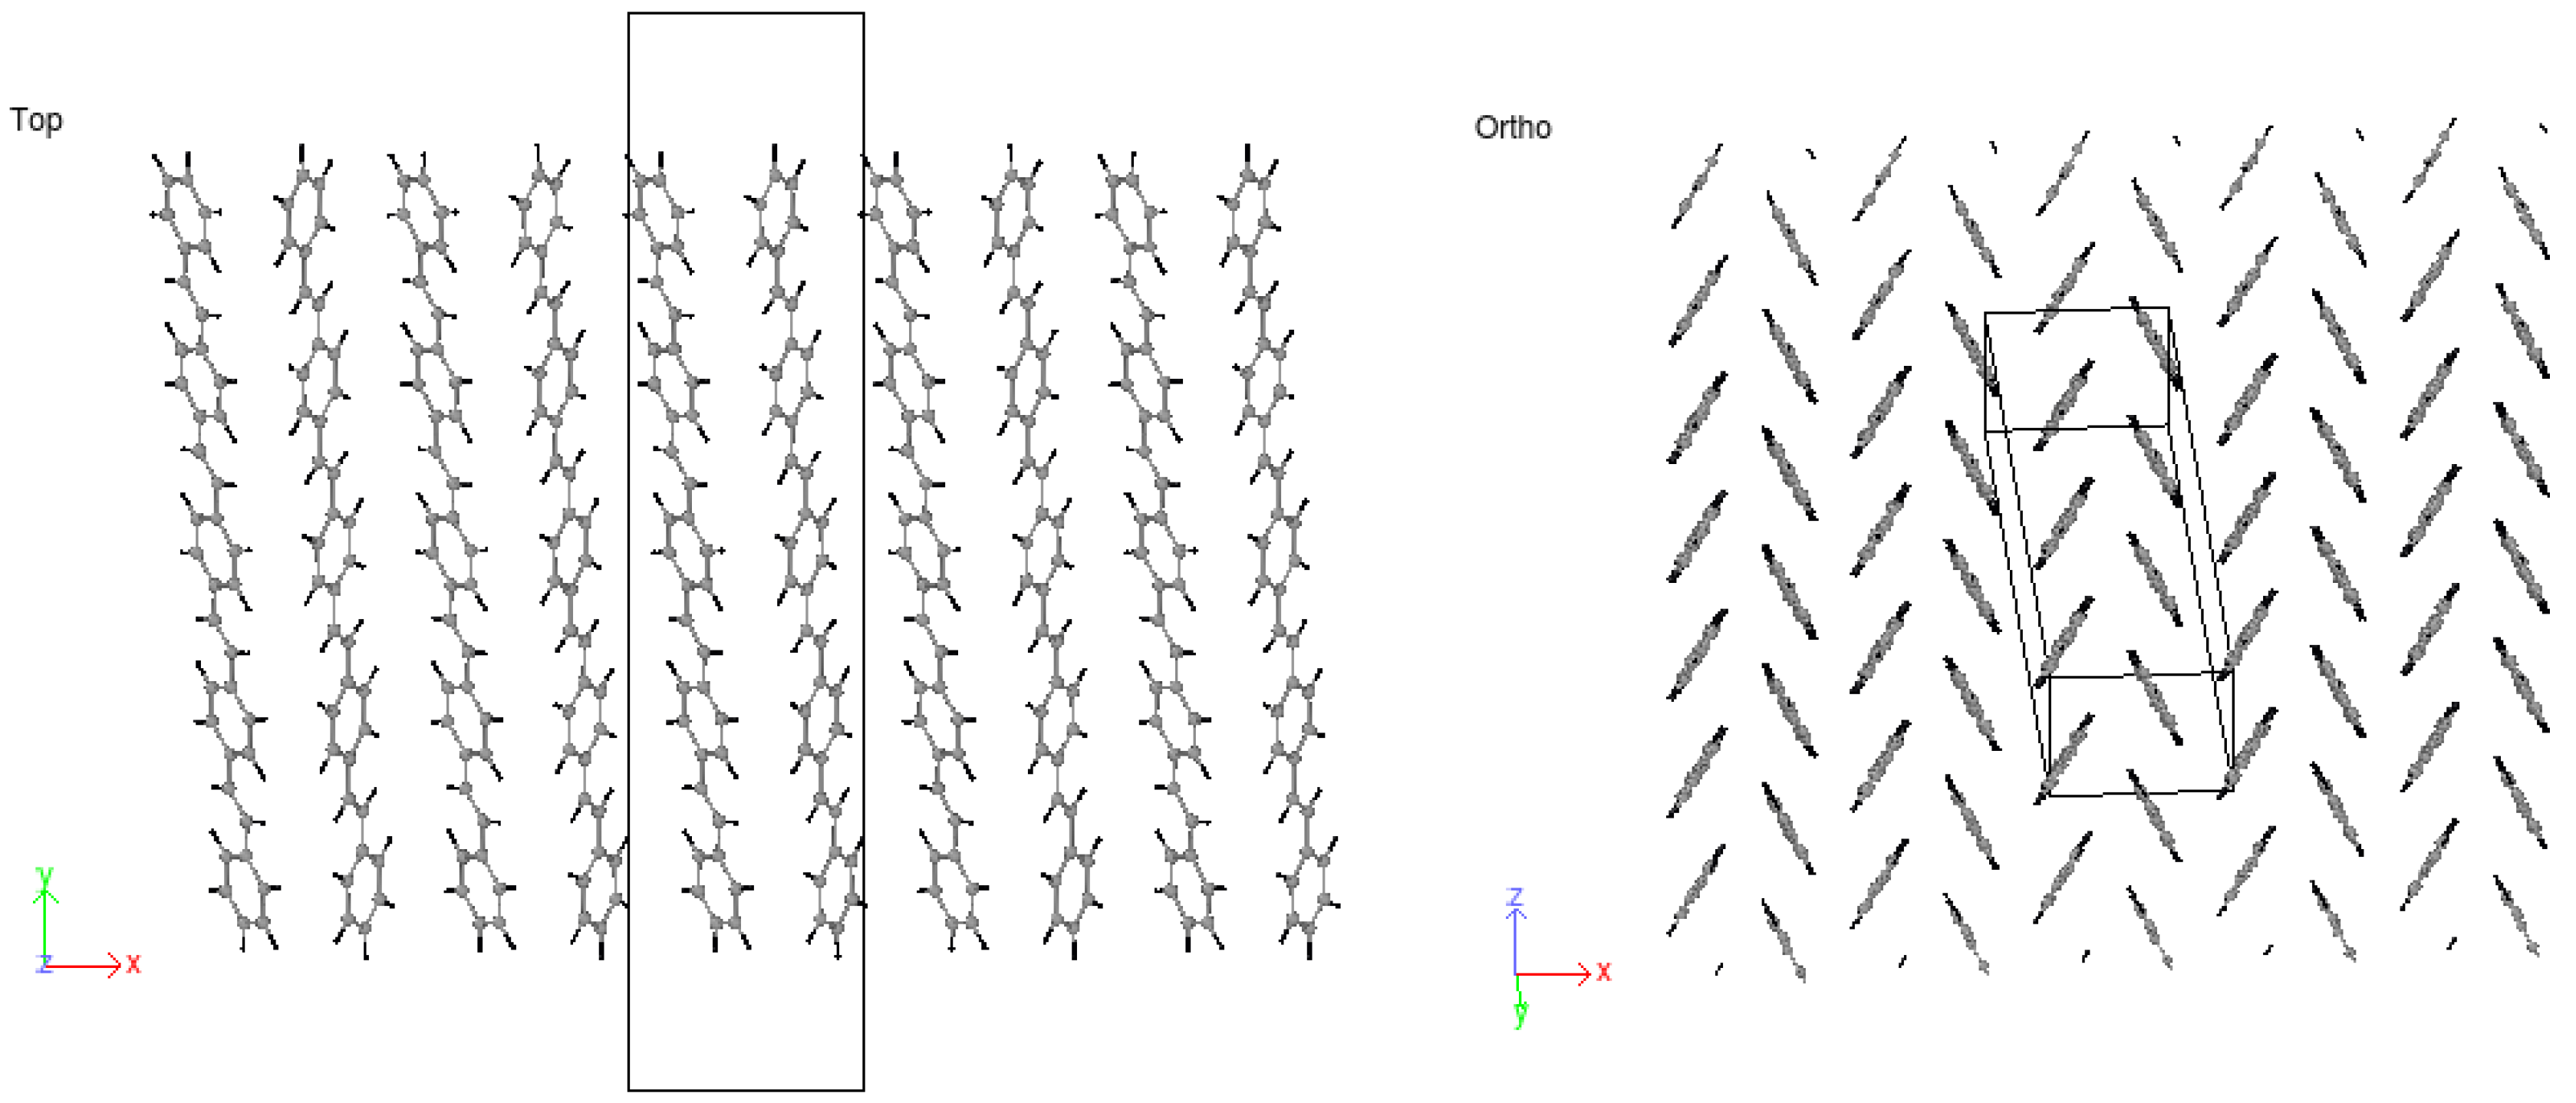
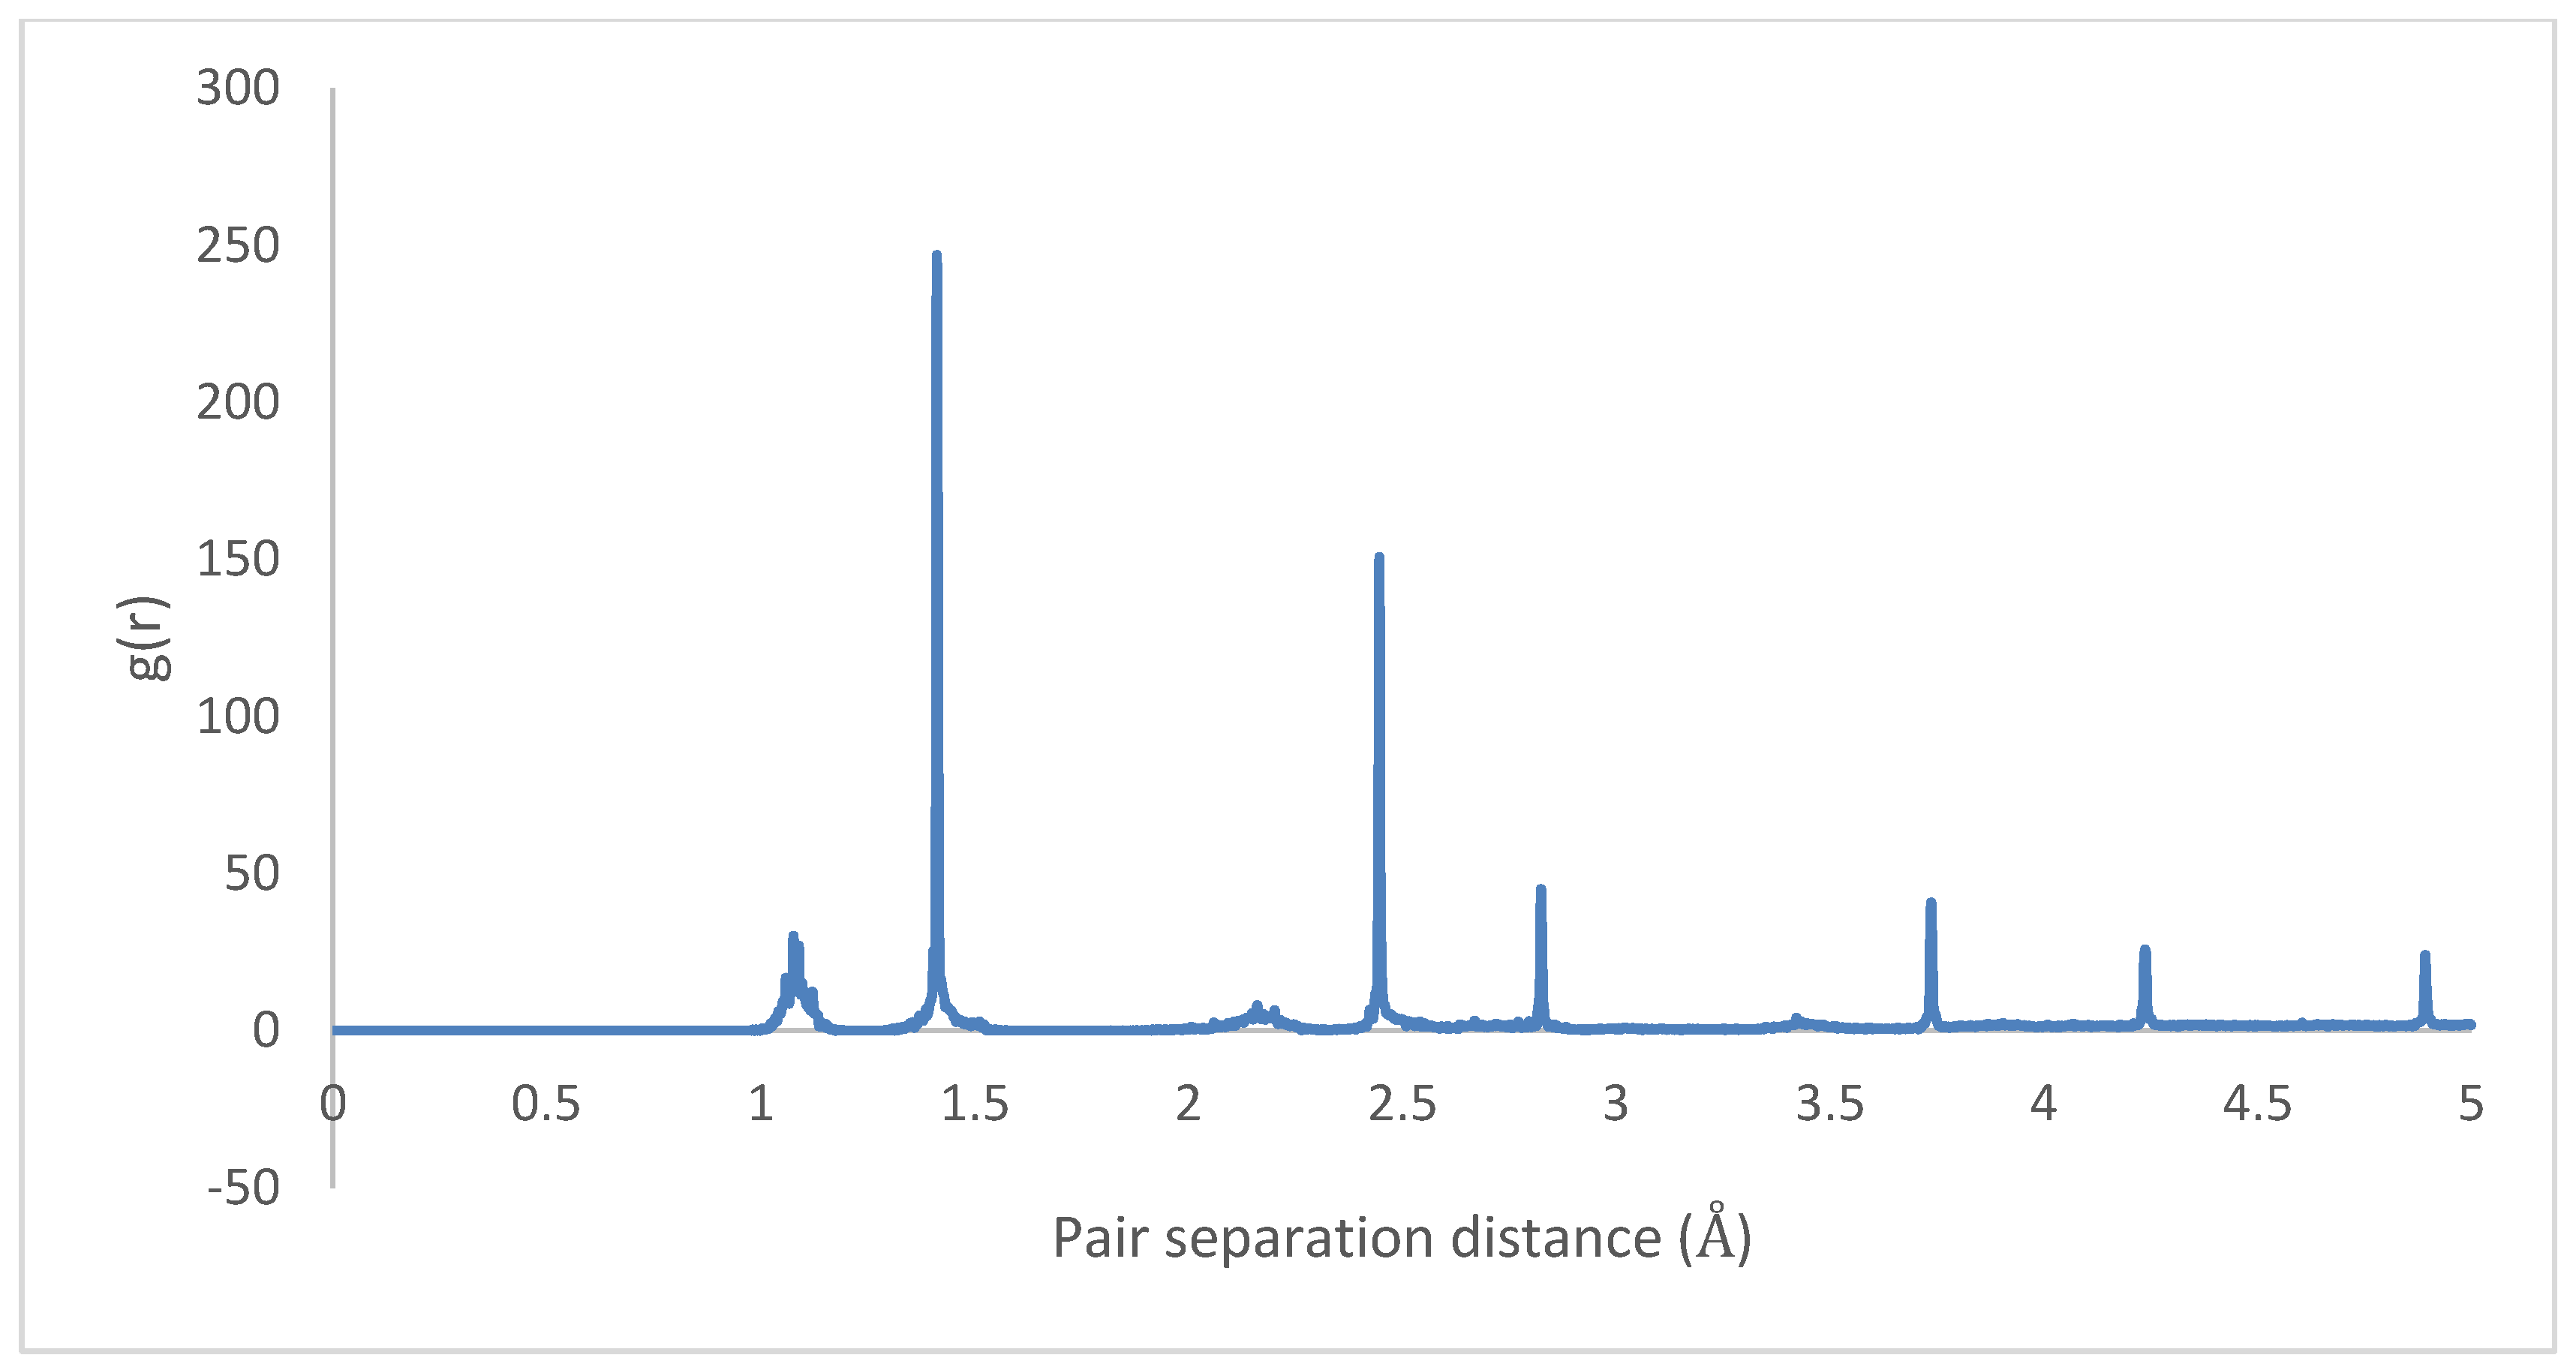
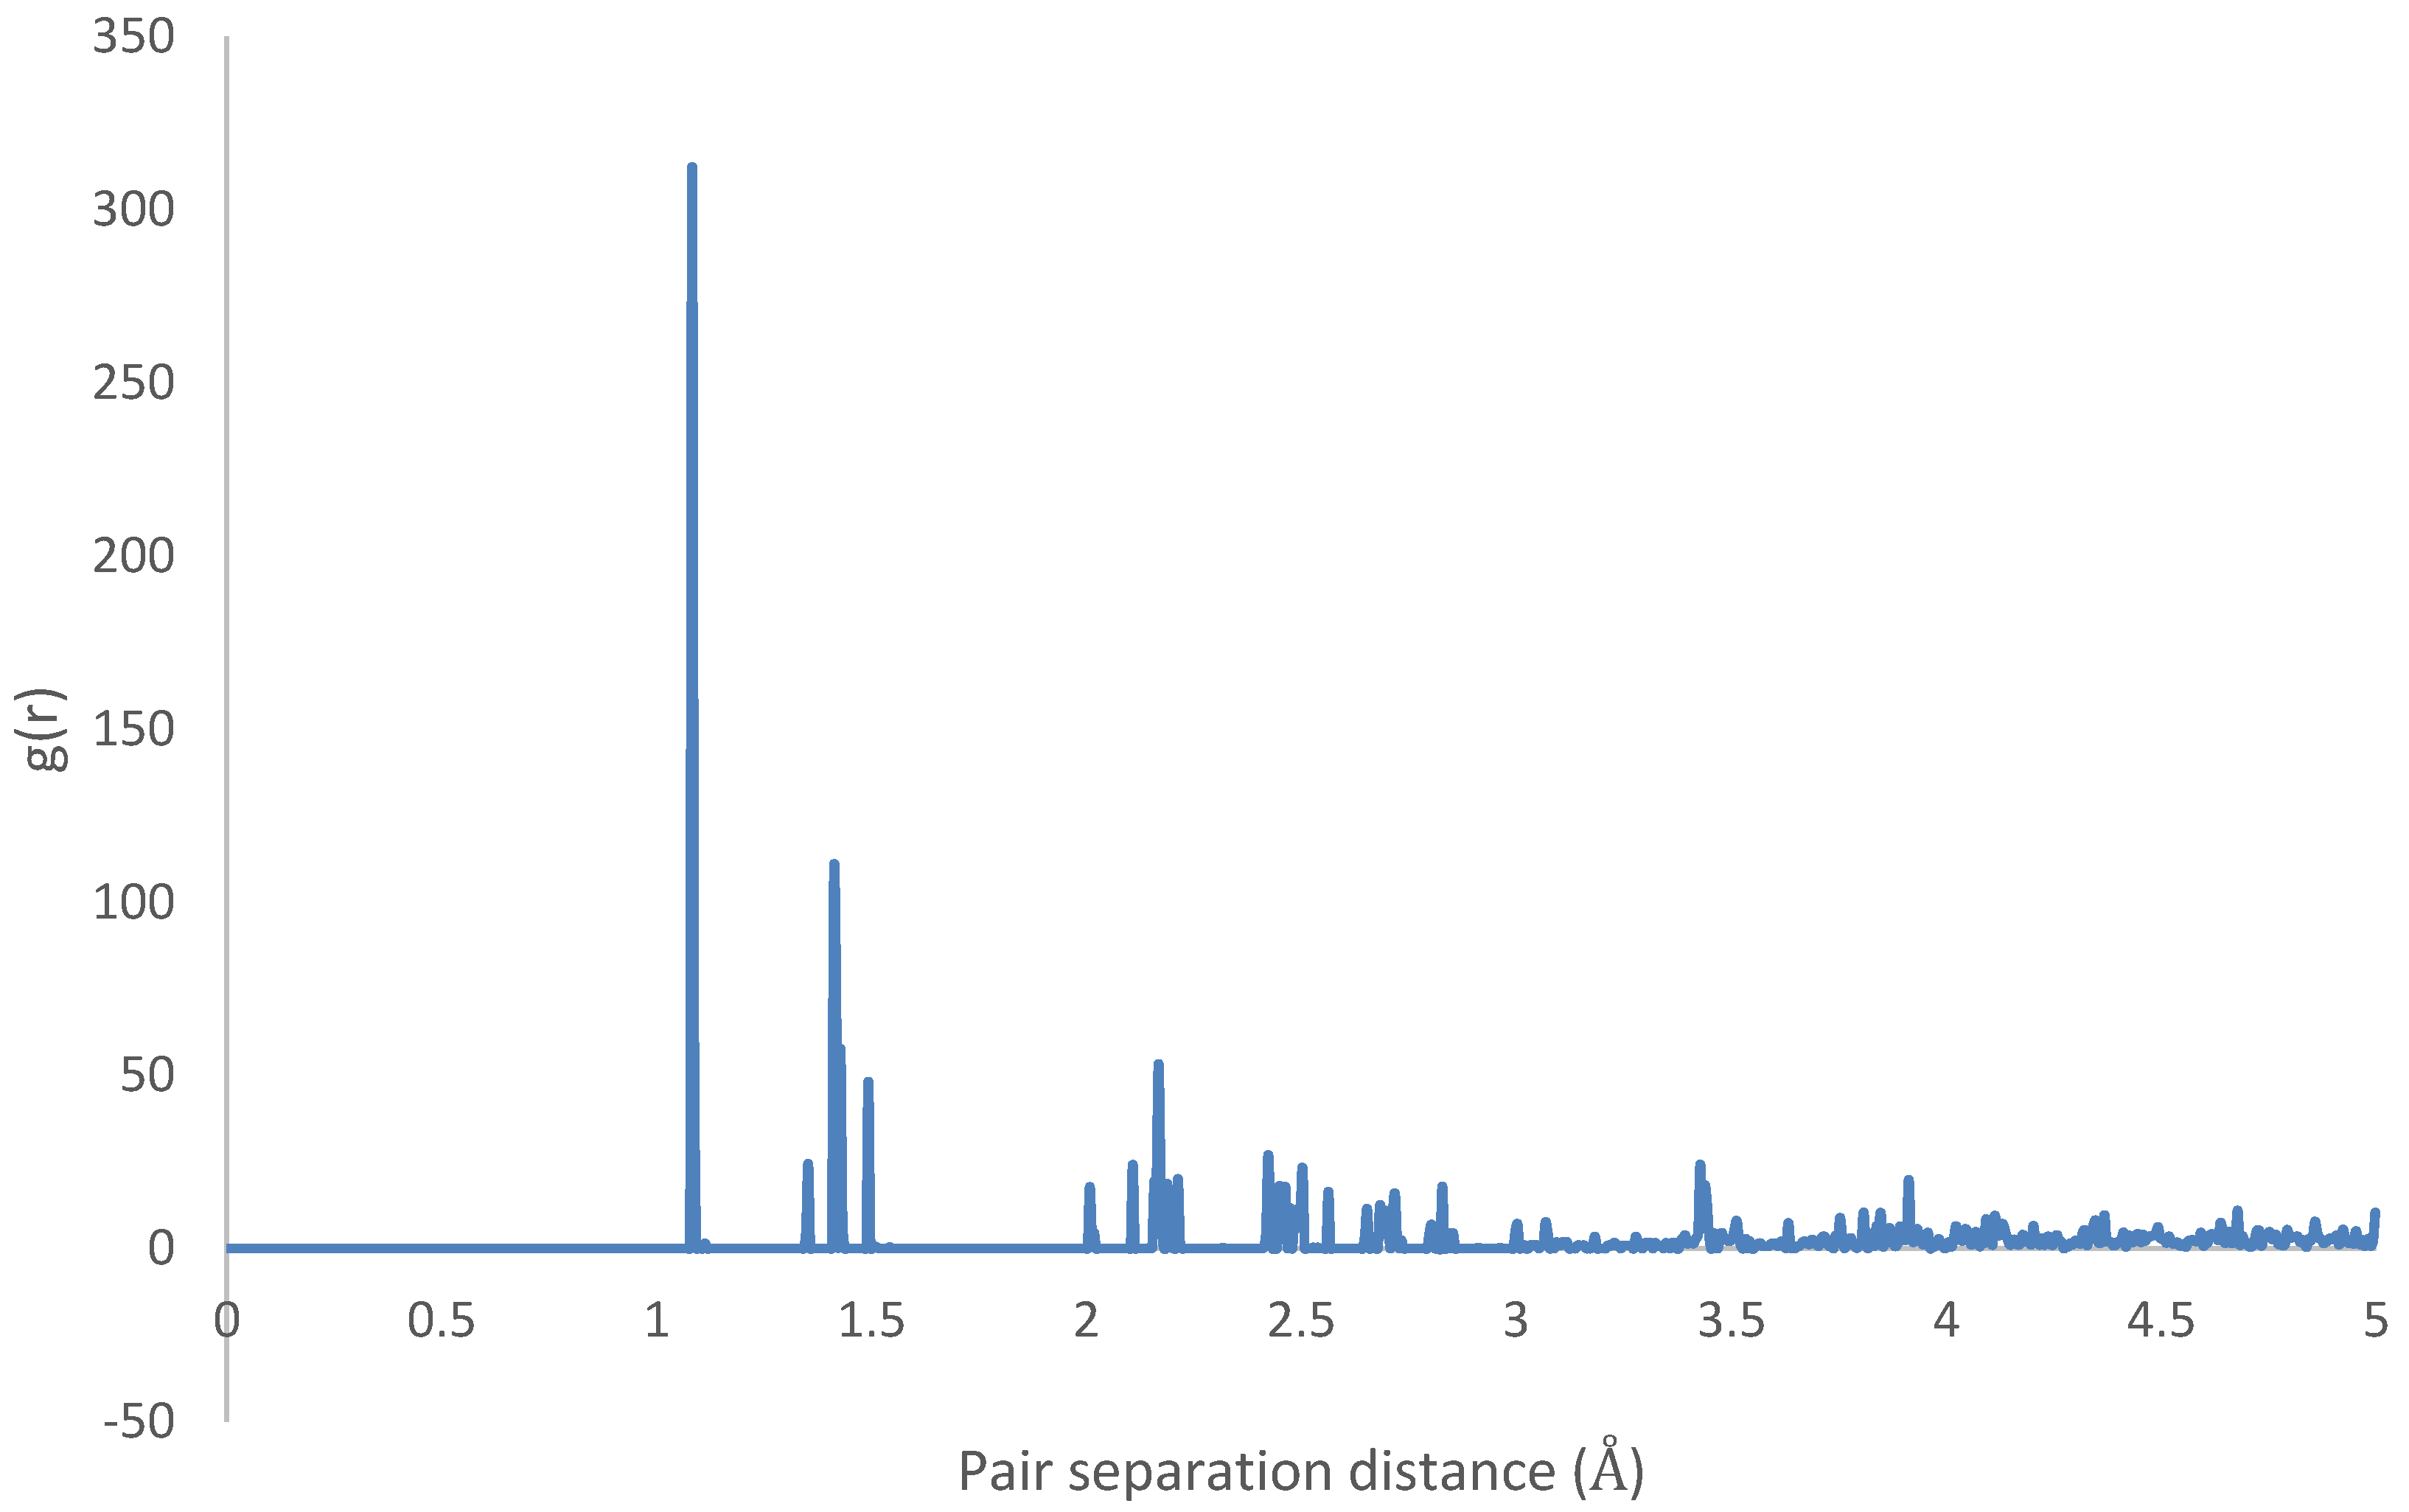
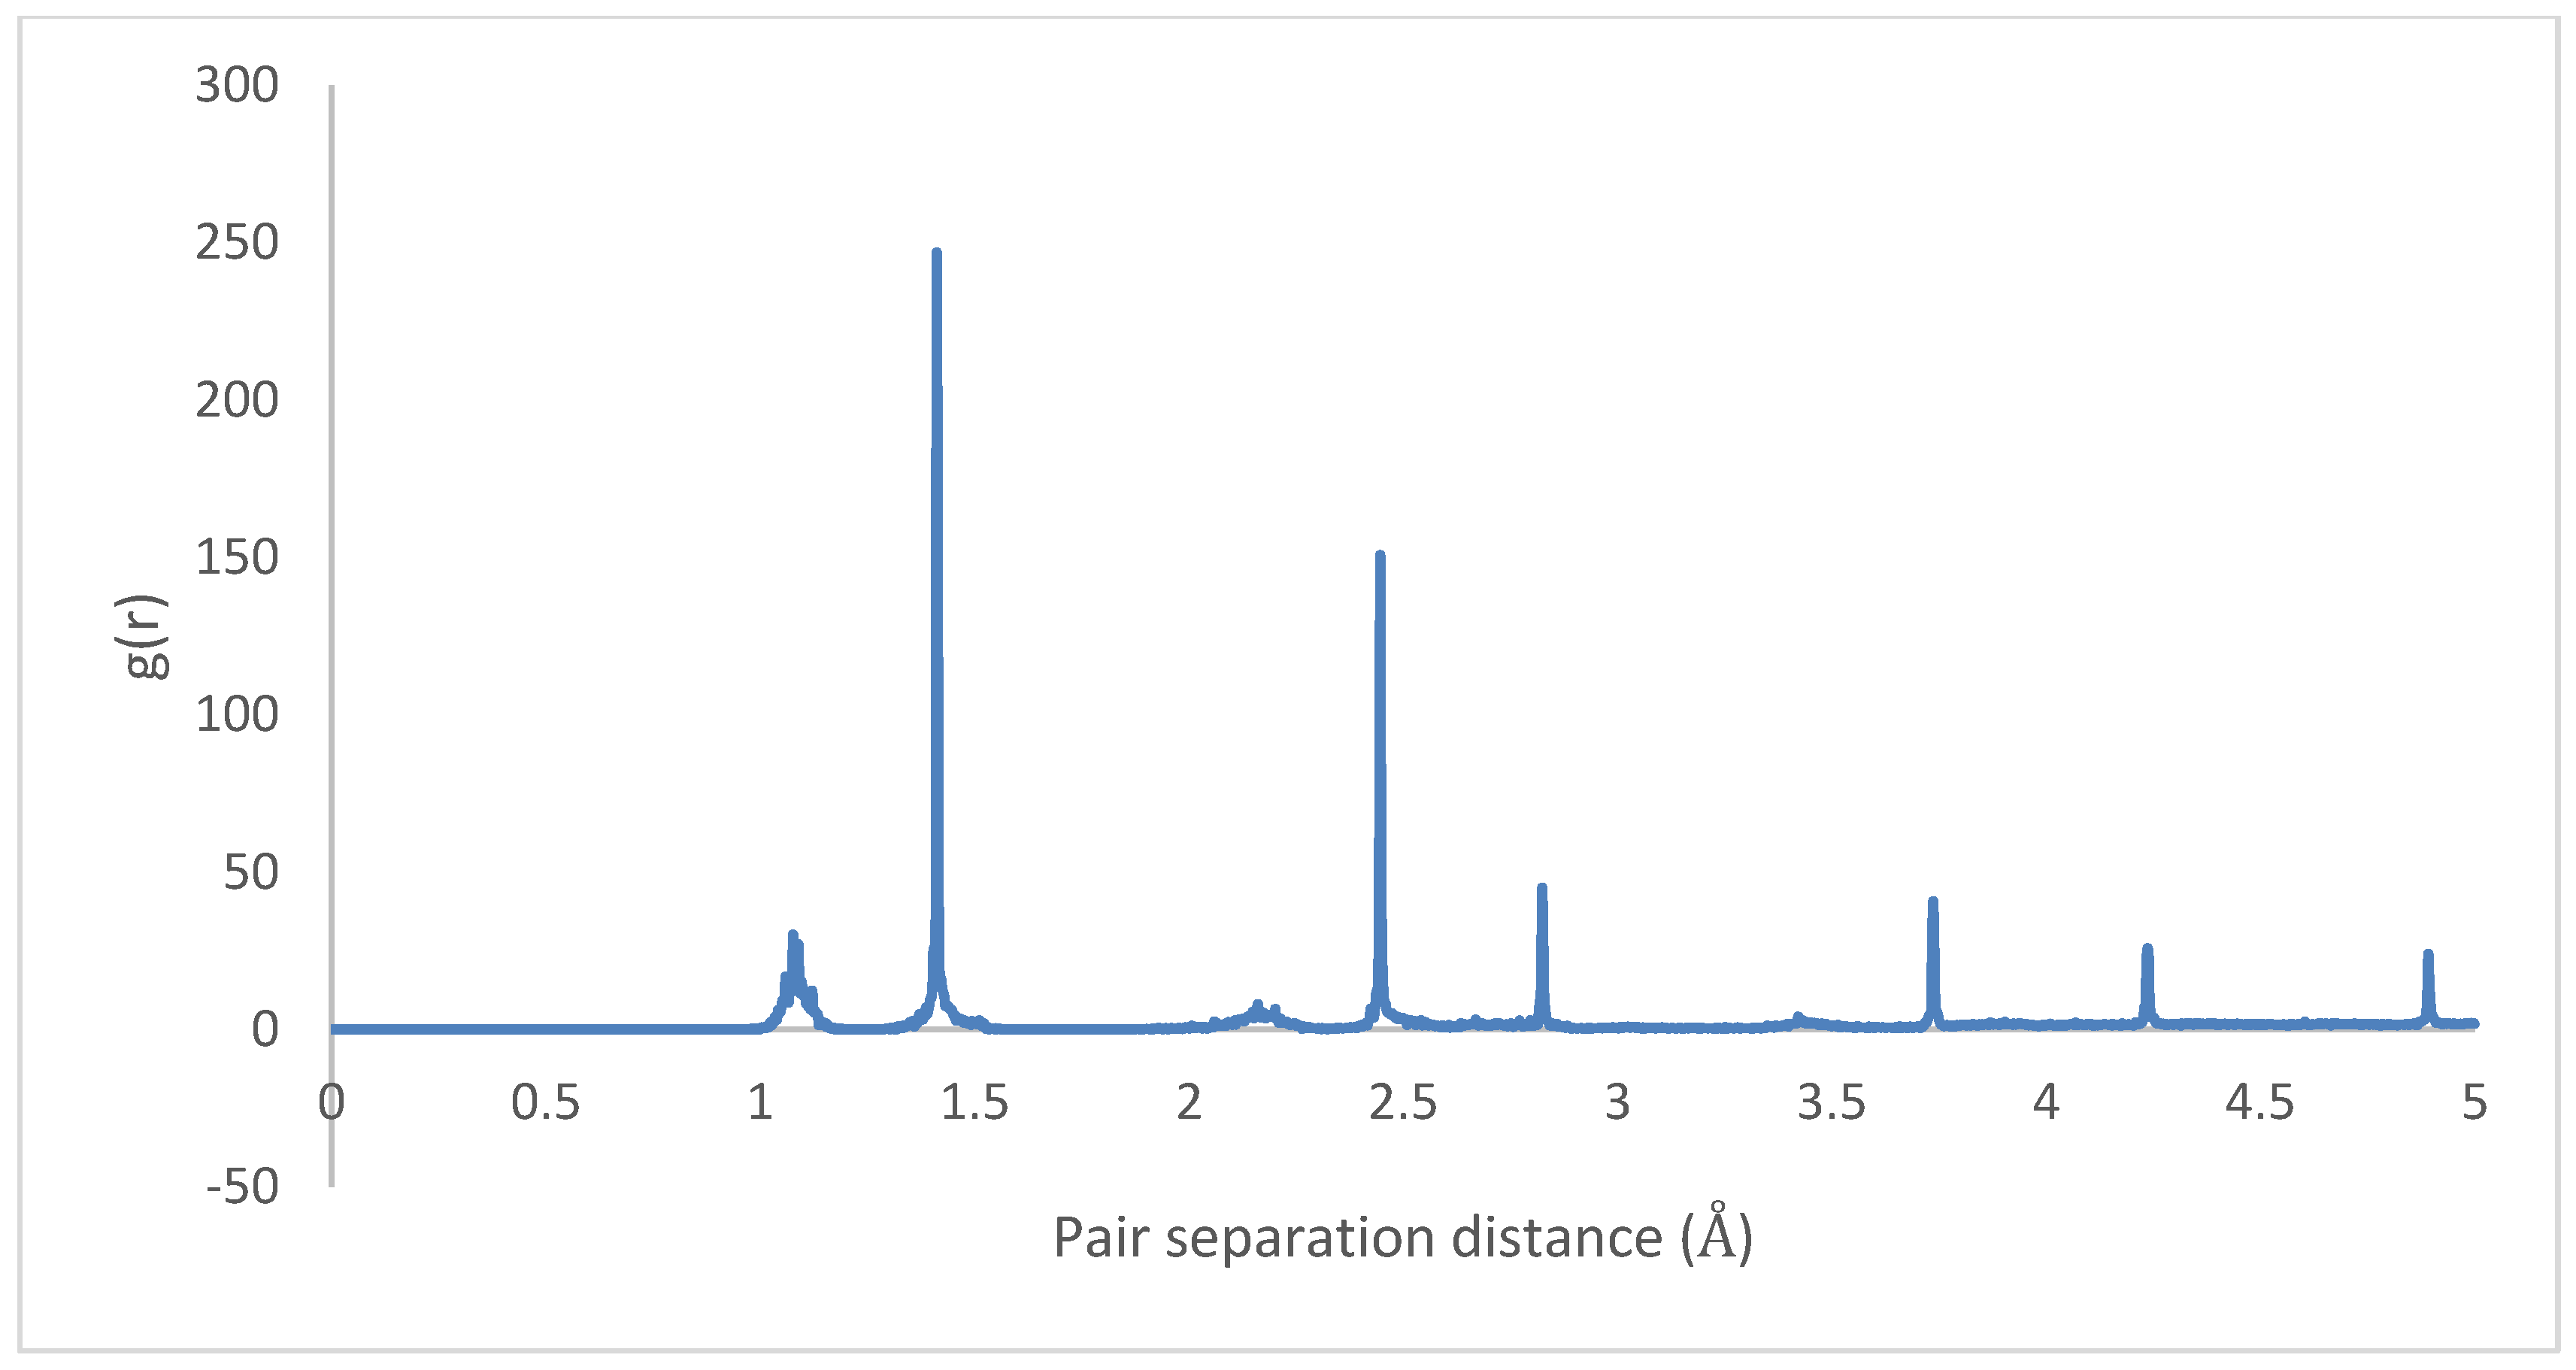
3.2. Crystallization
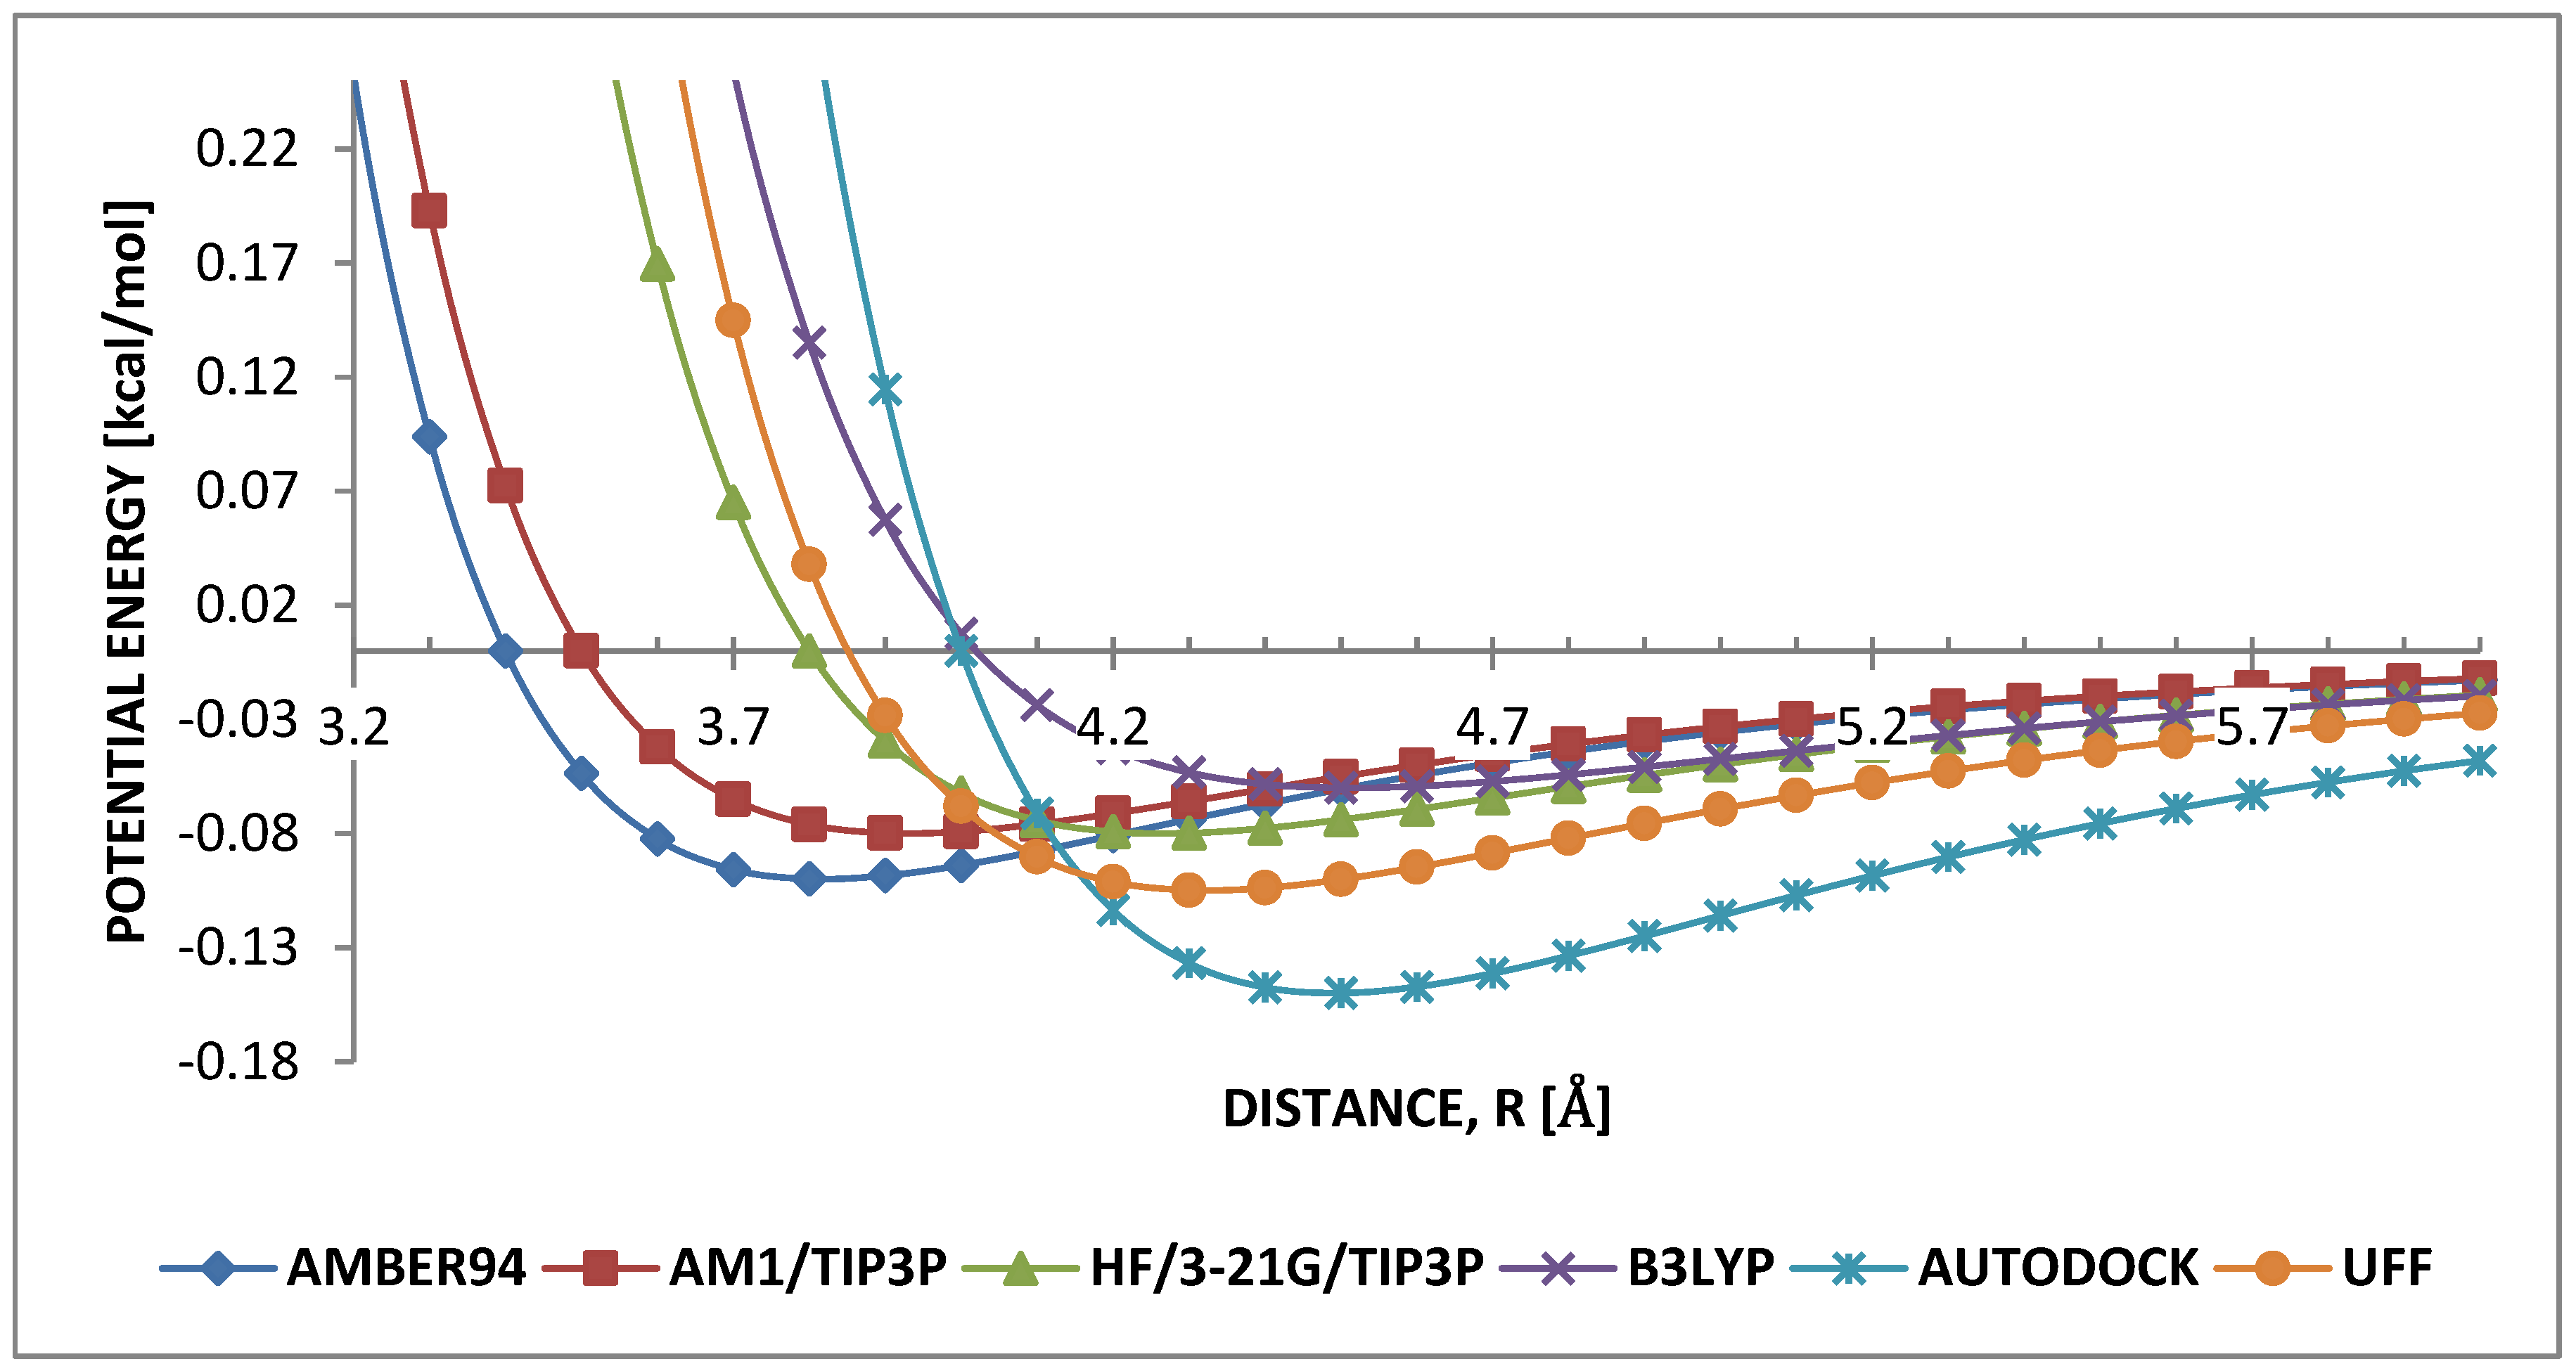
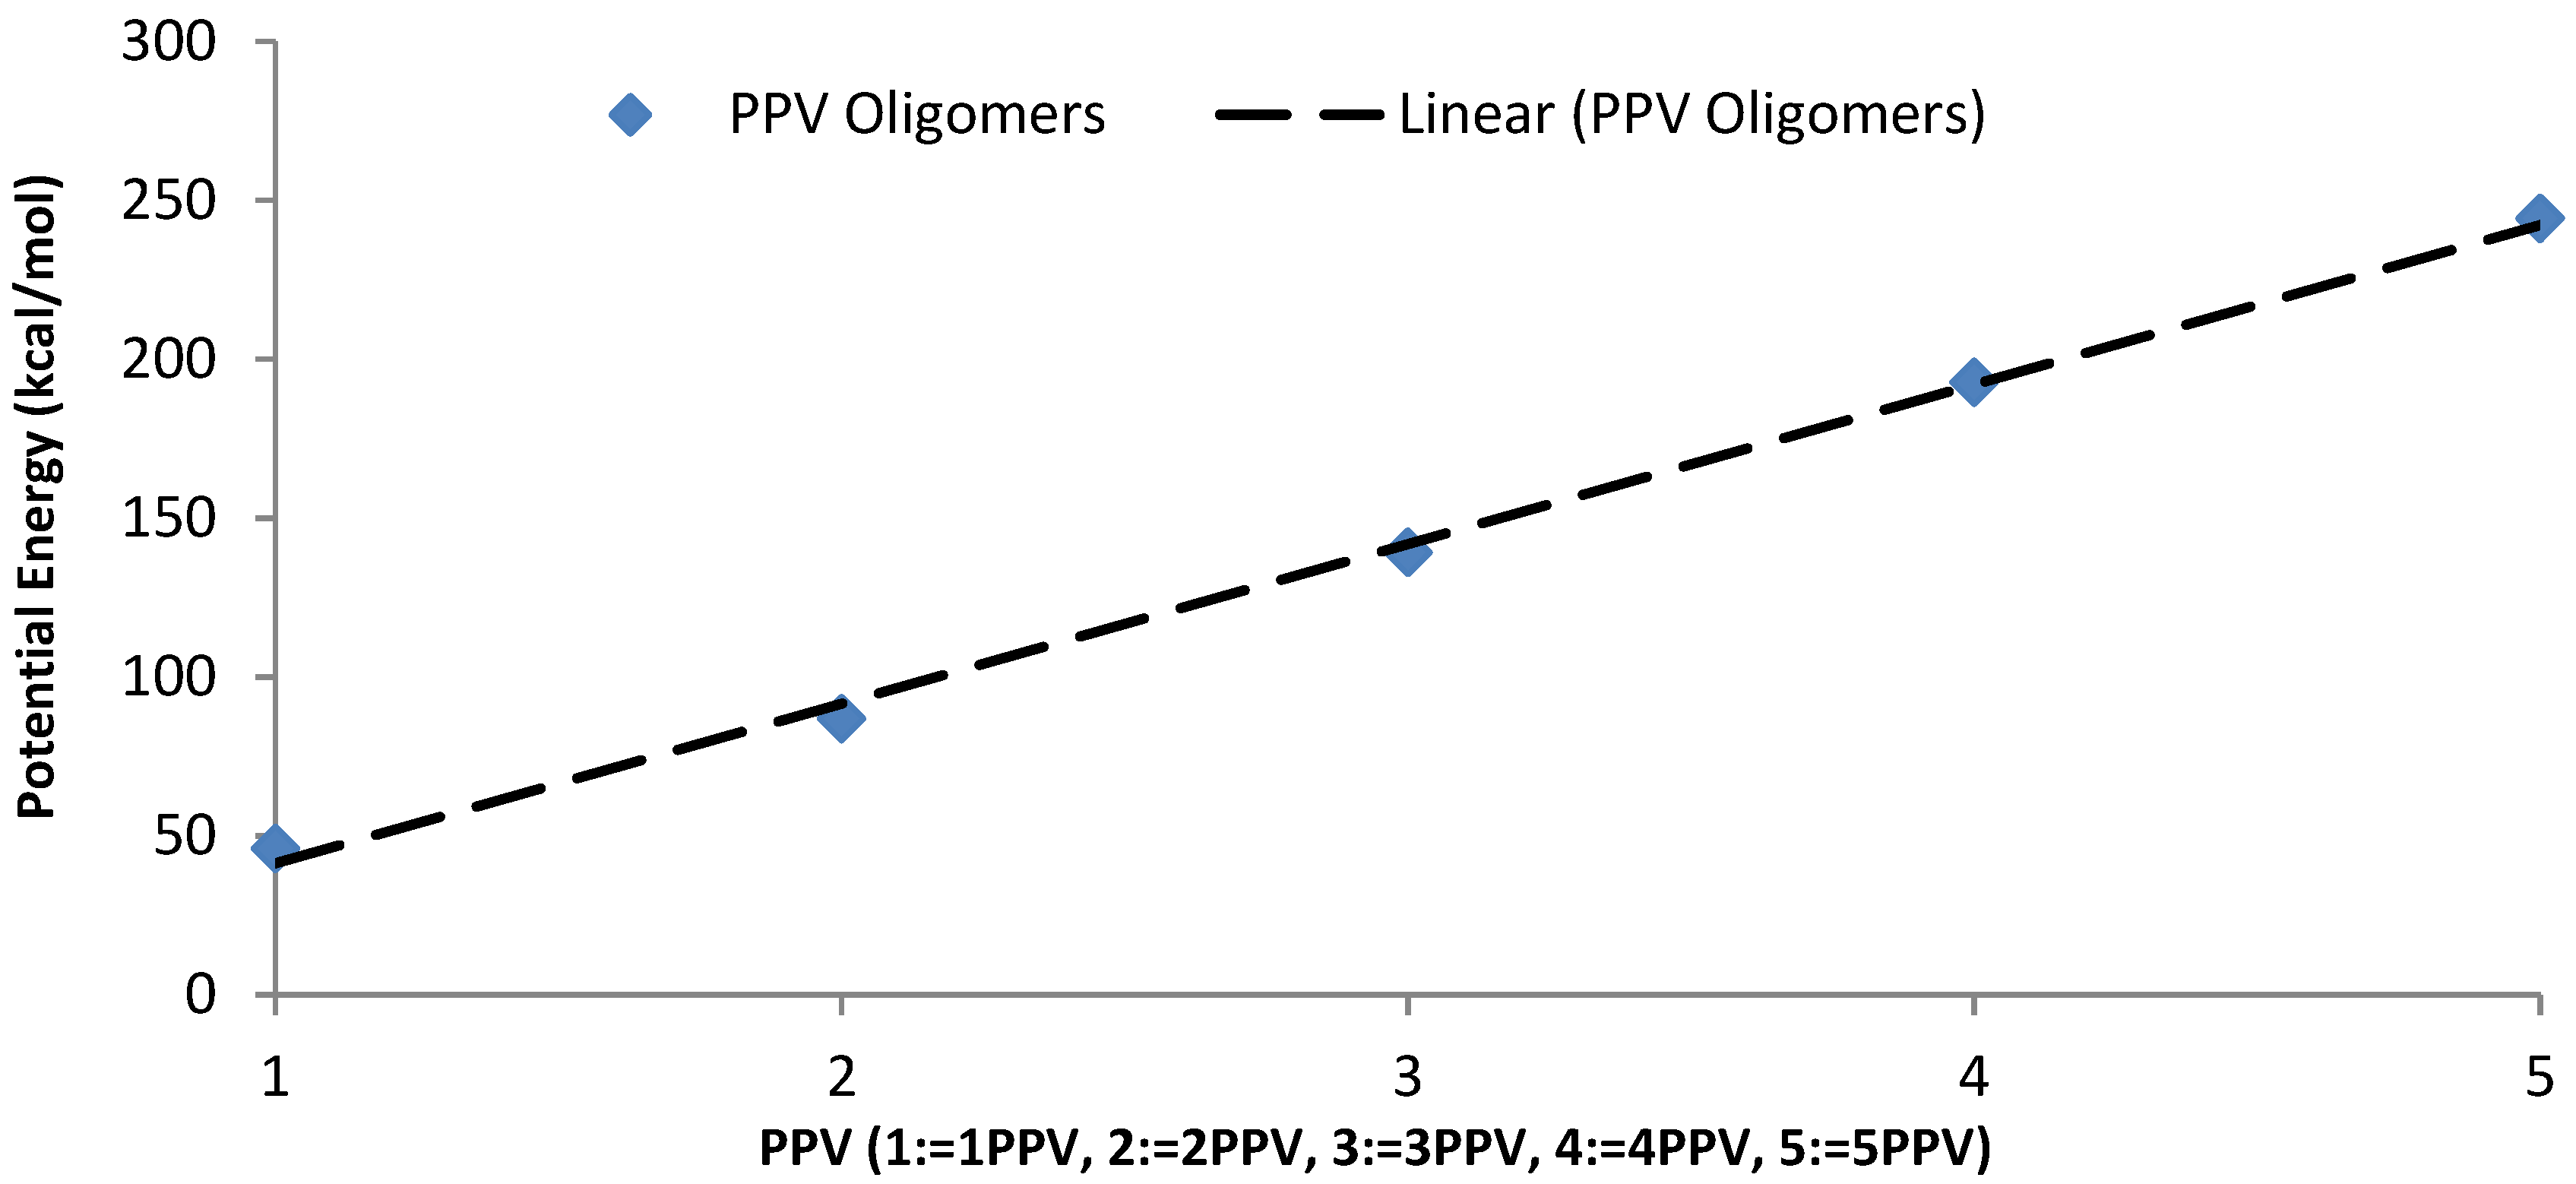
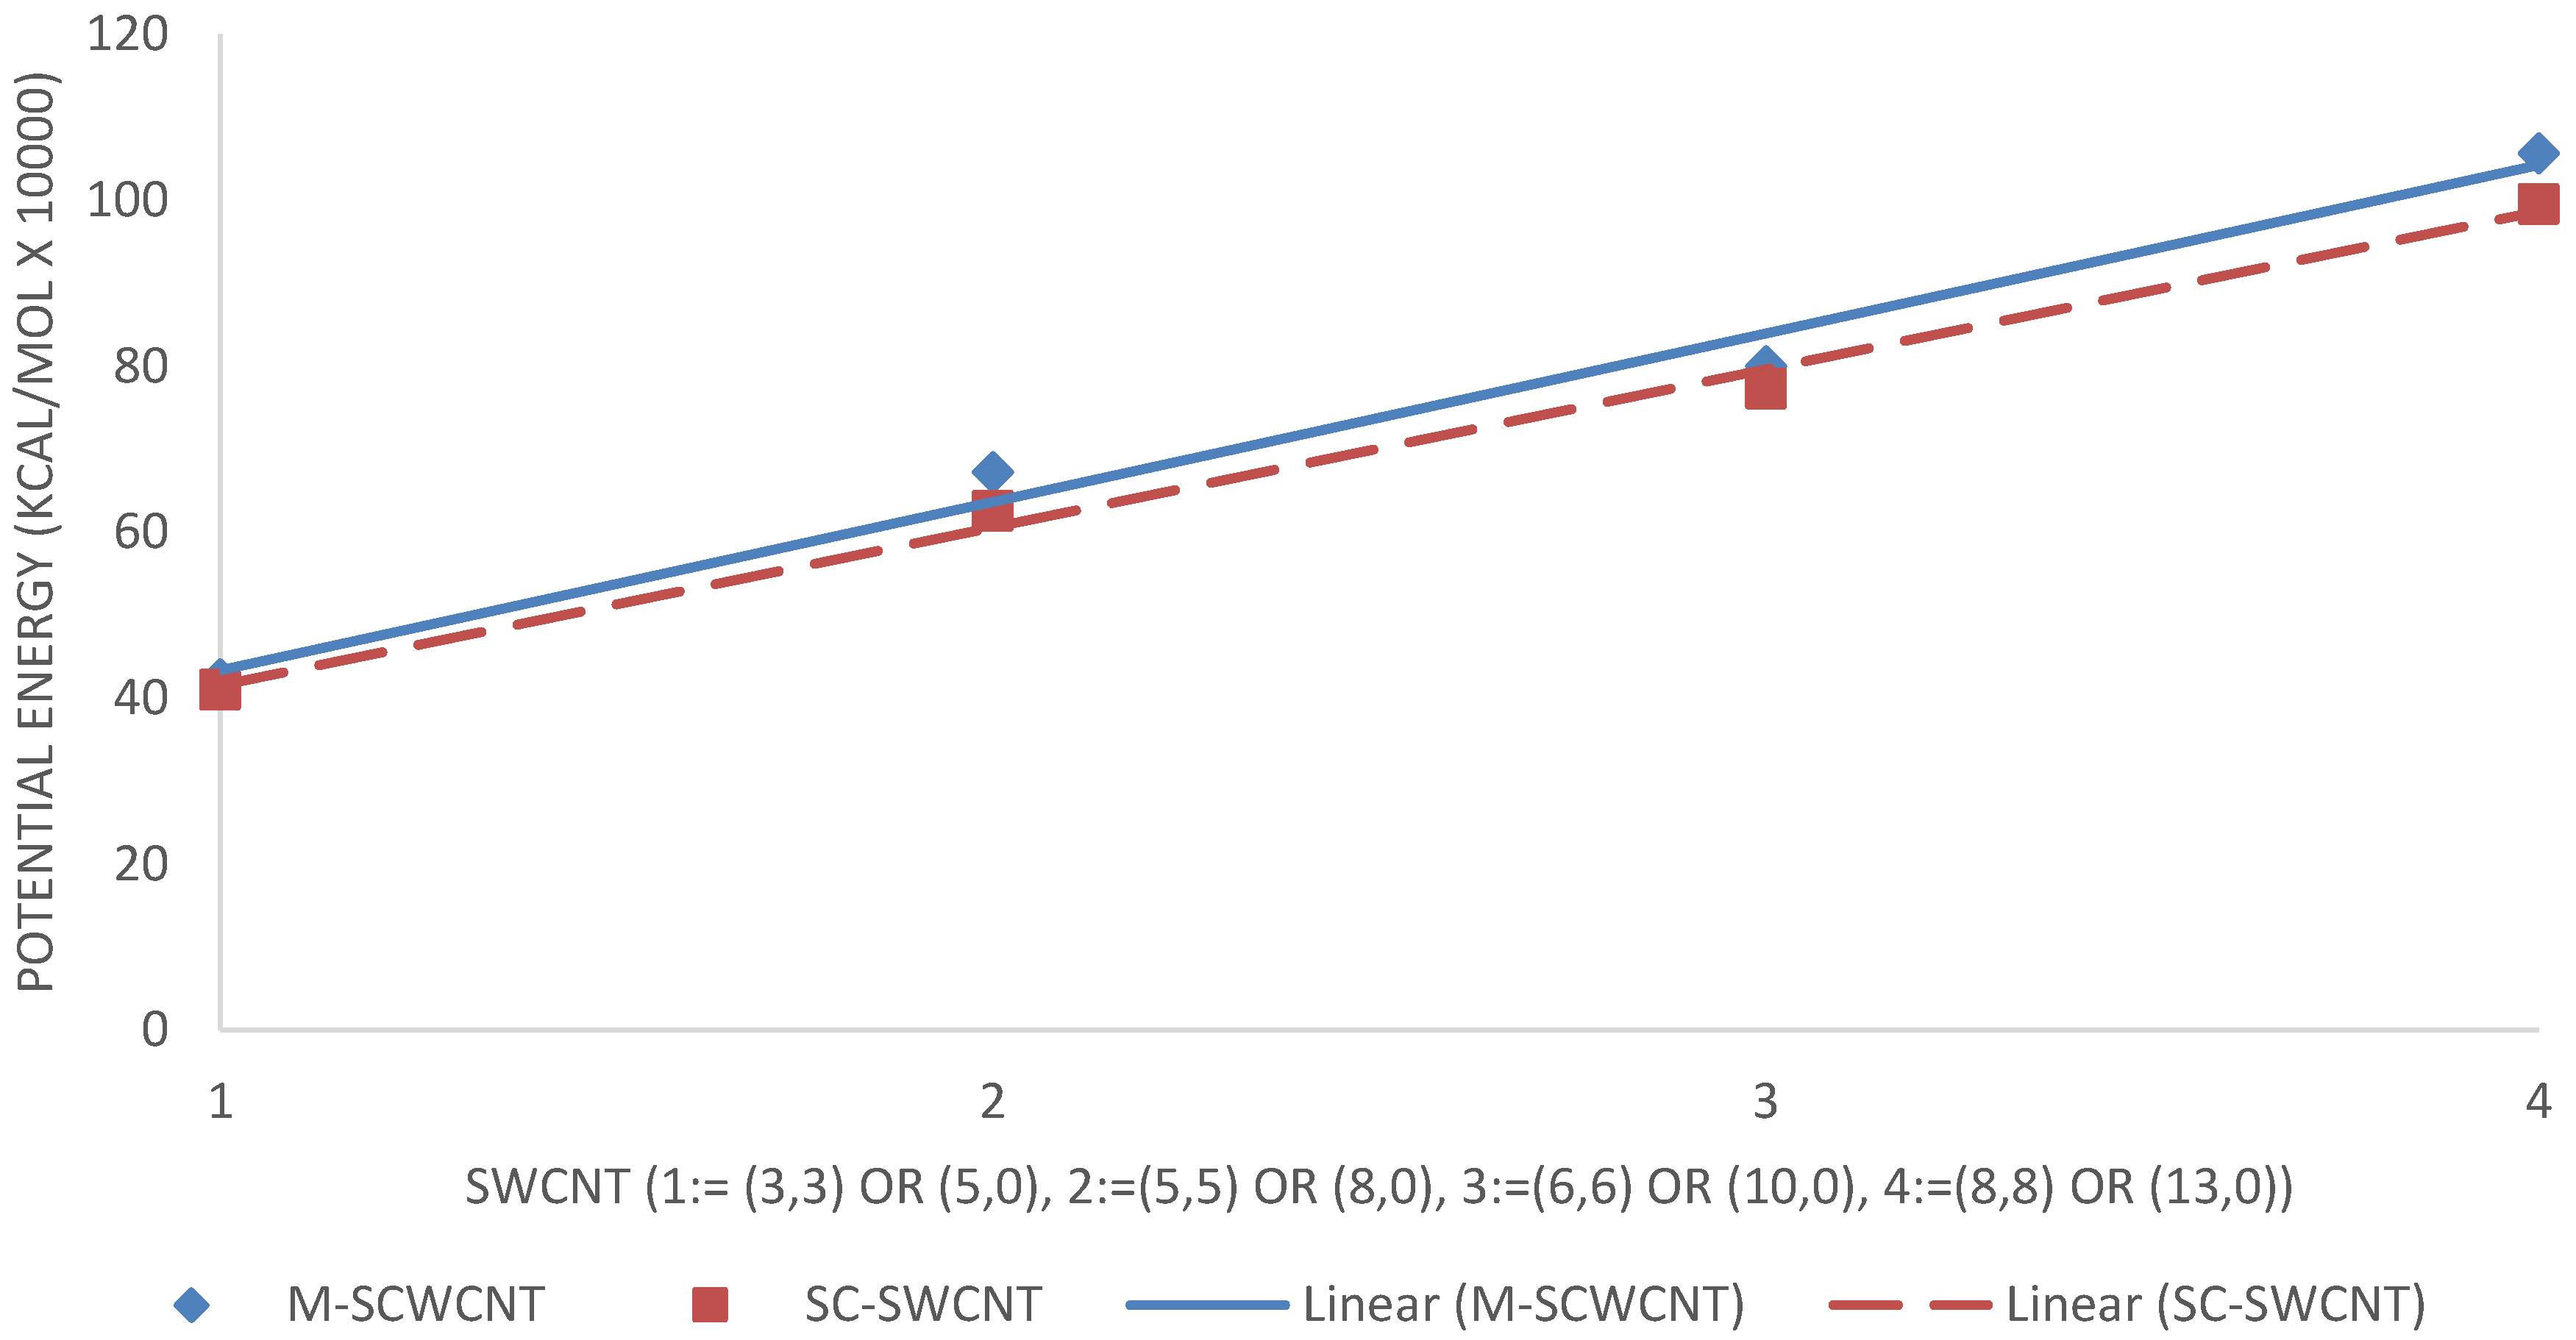
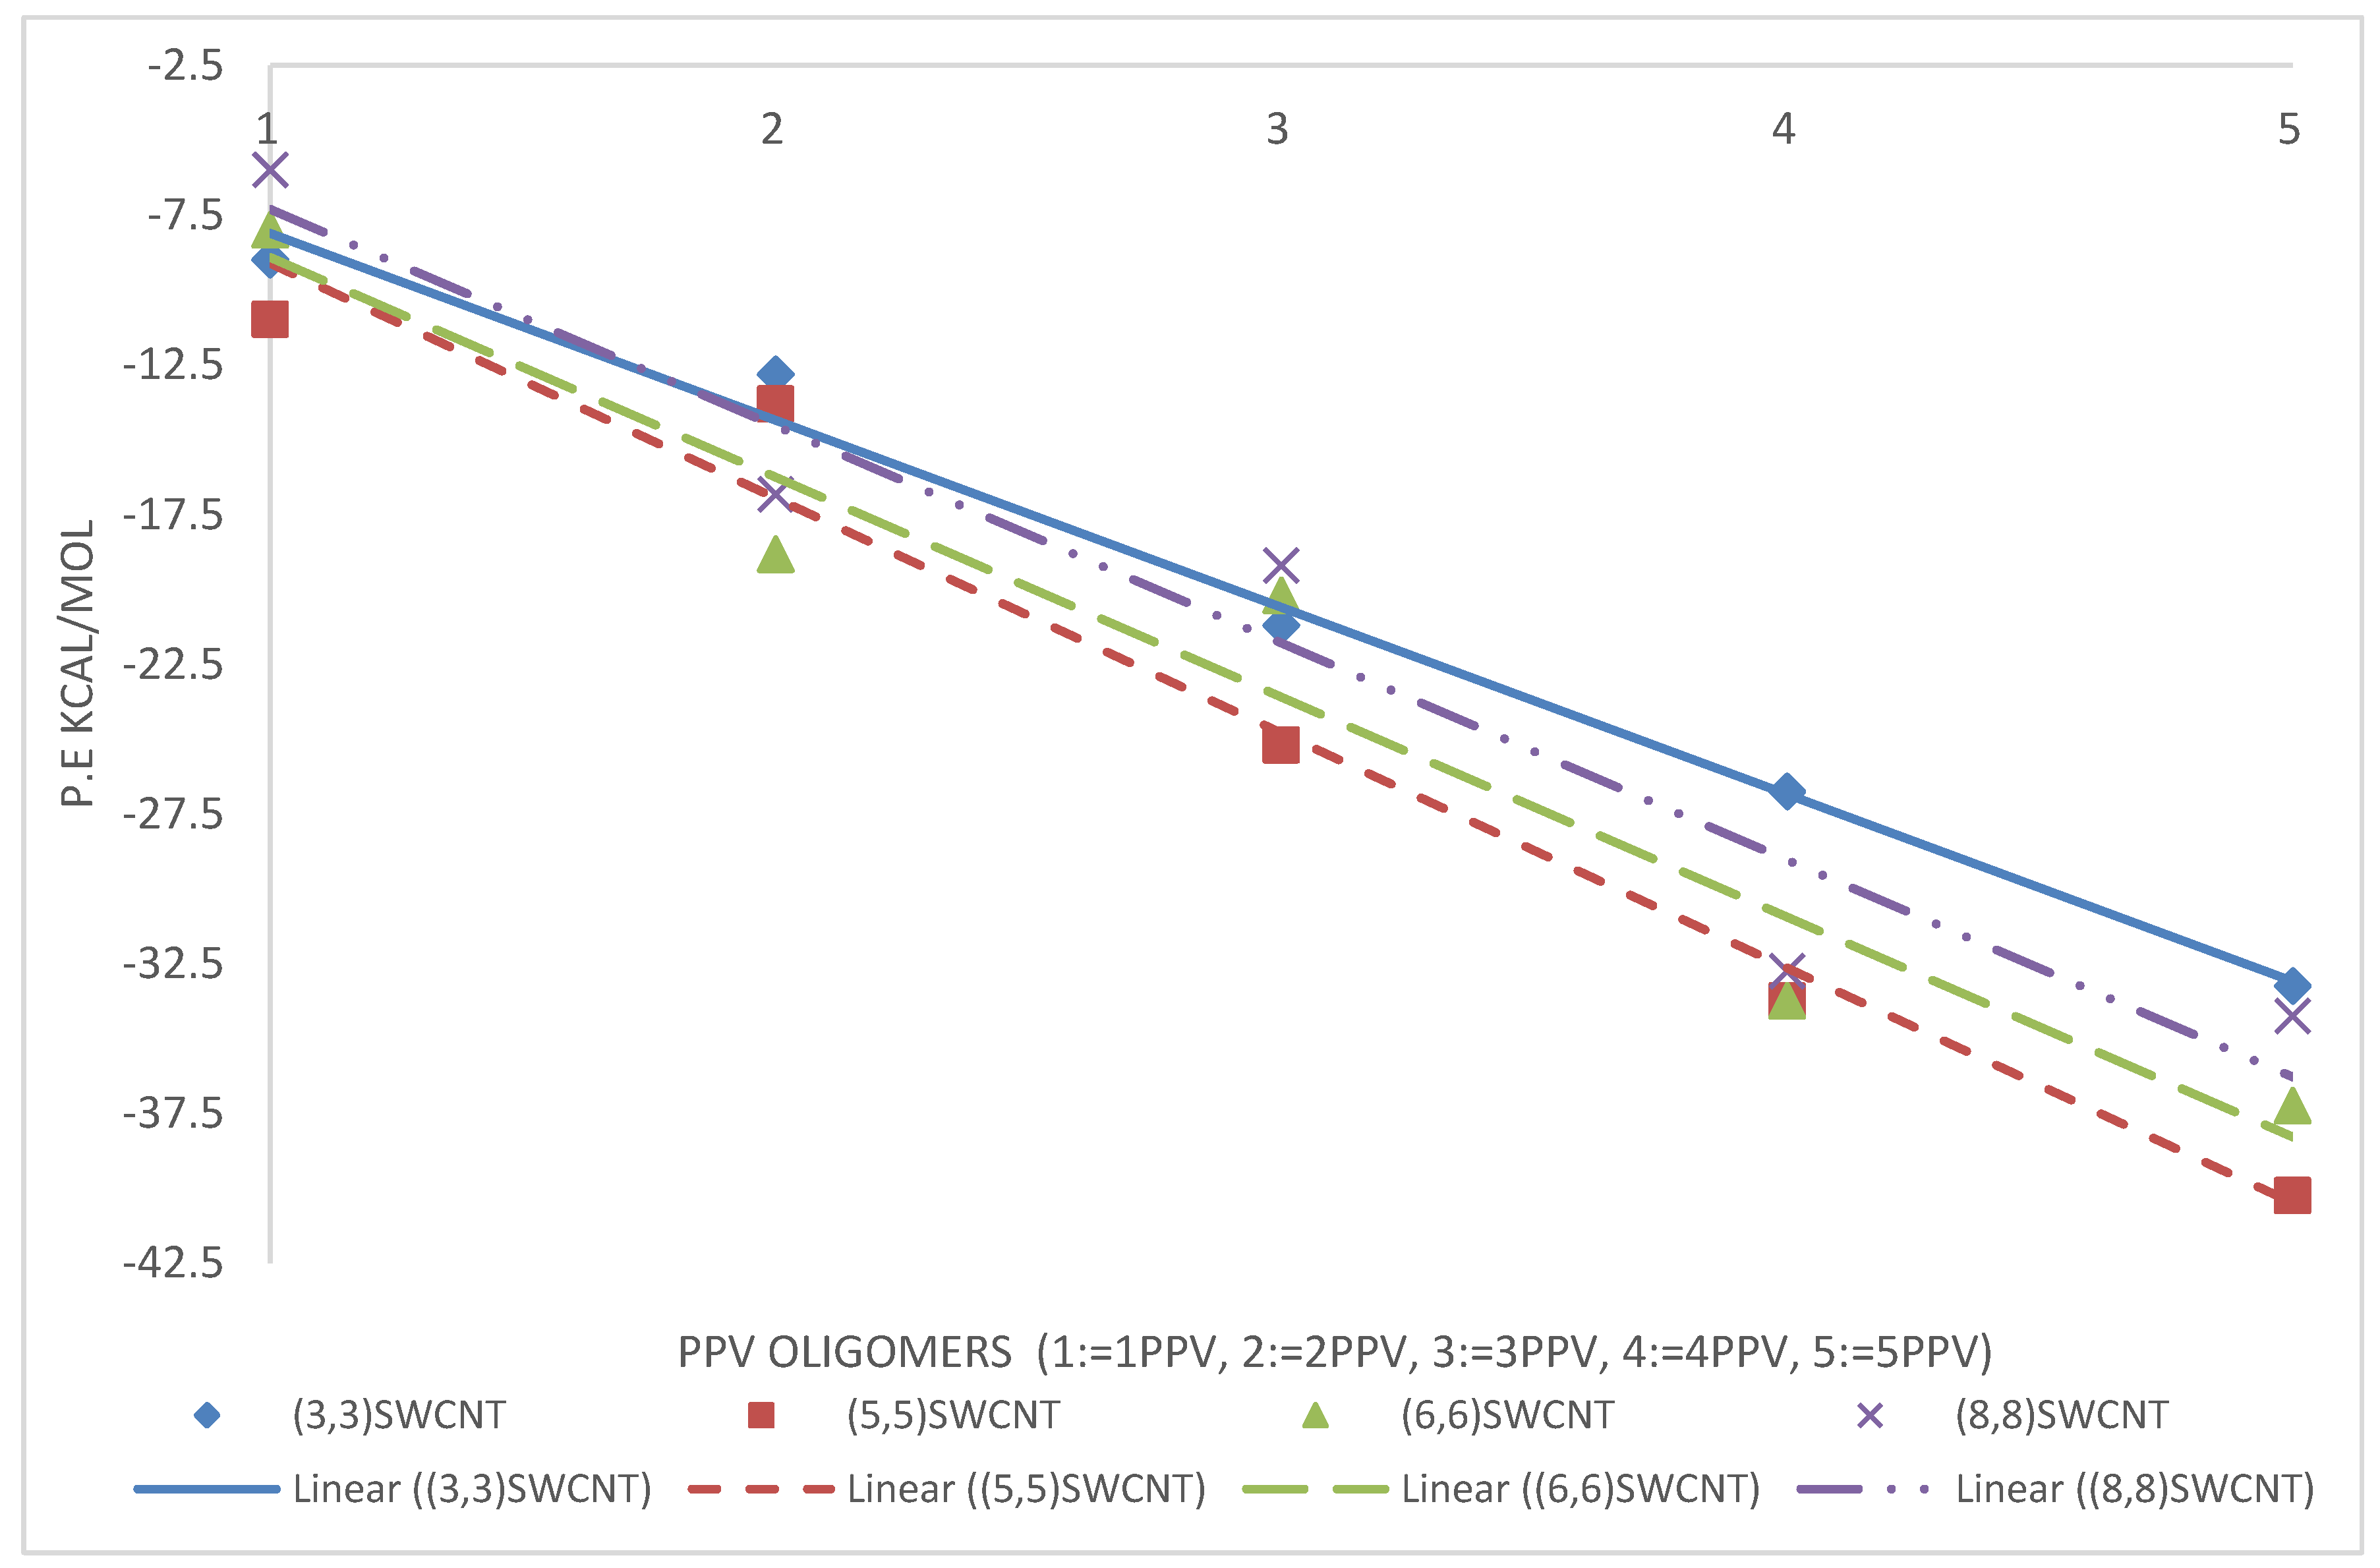
3.3. Intramolecular Interactions and Binding Energy
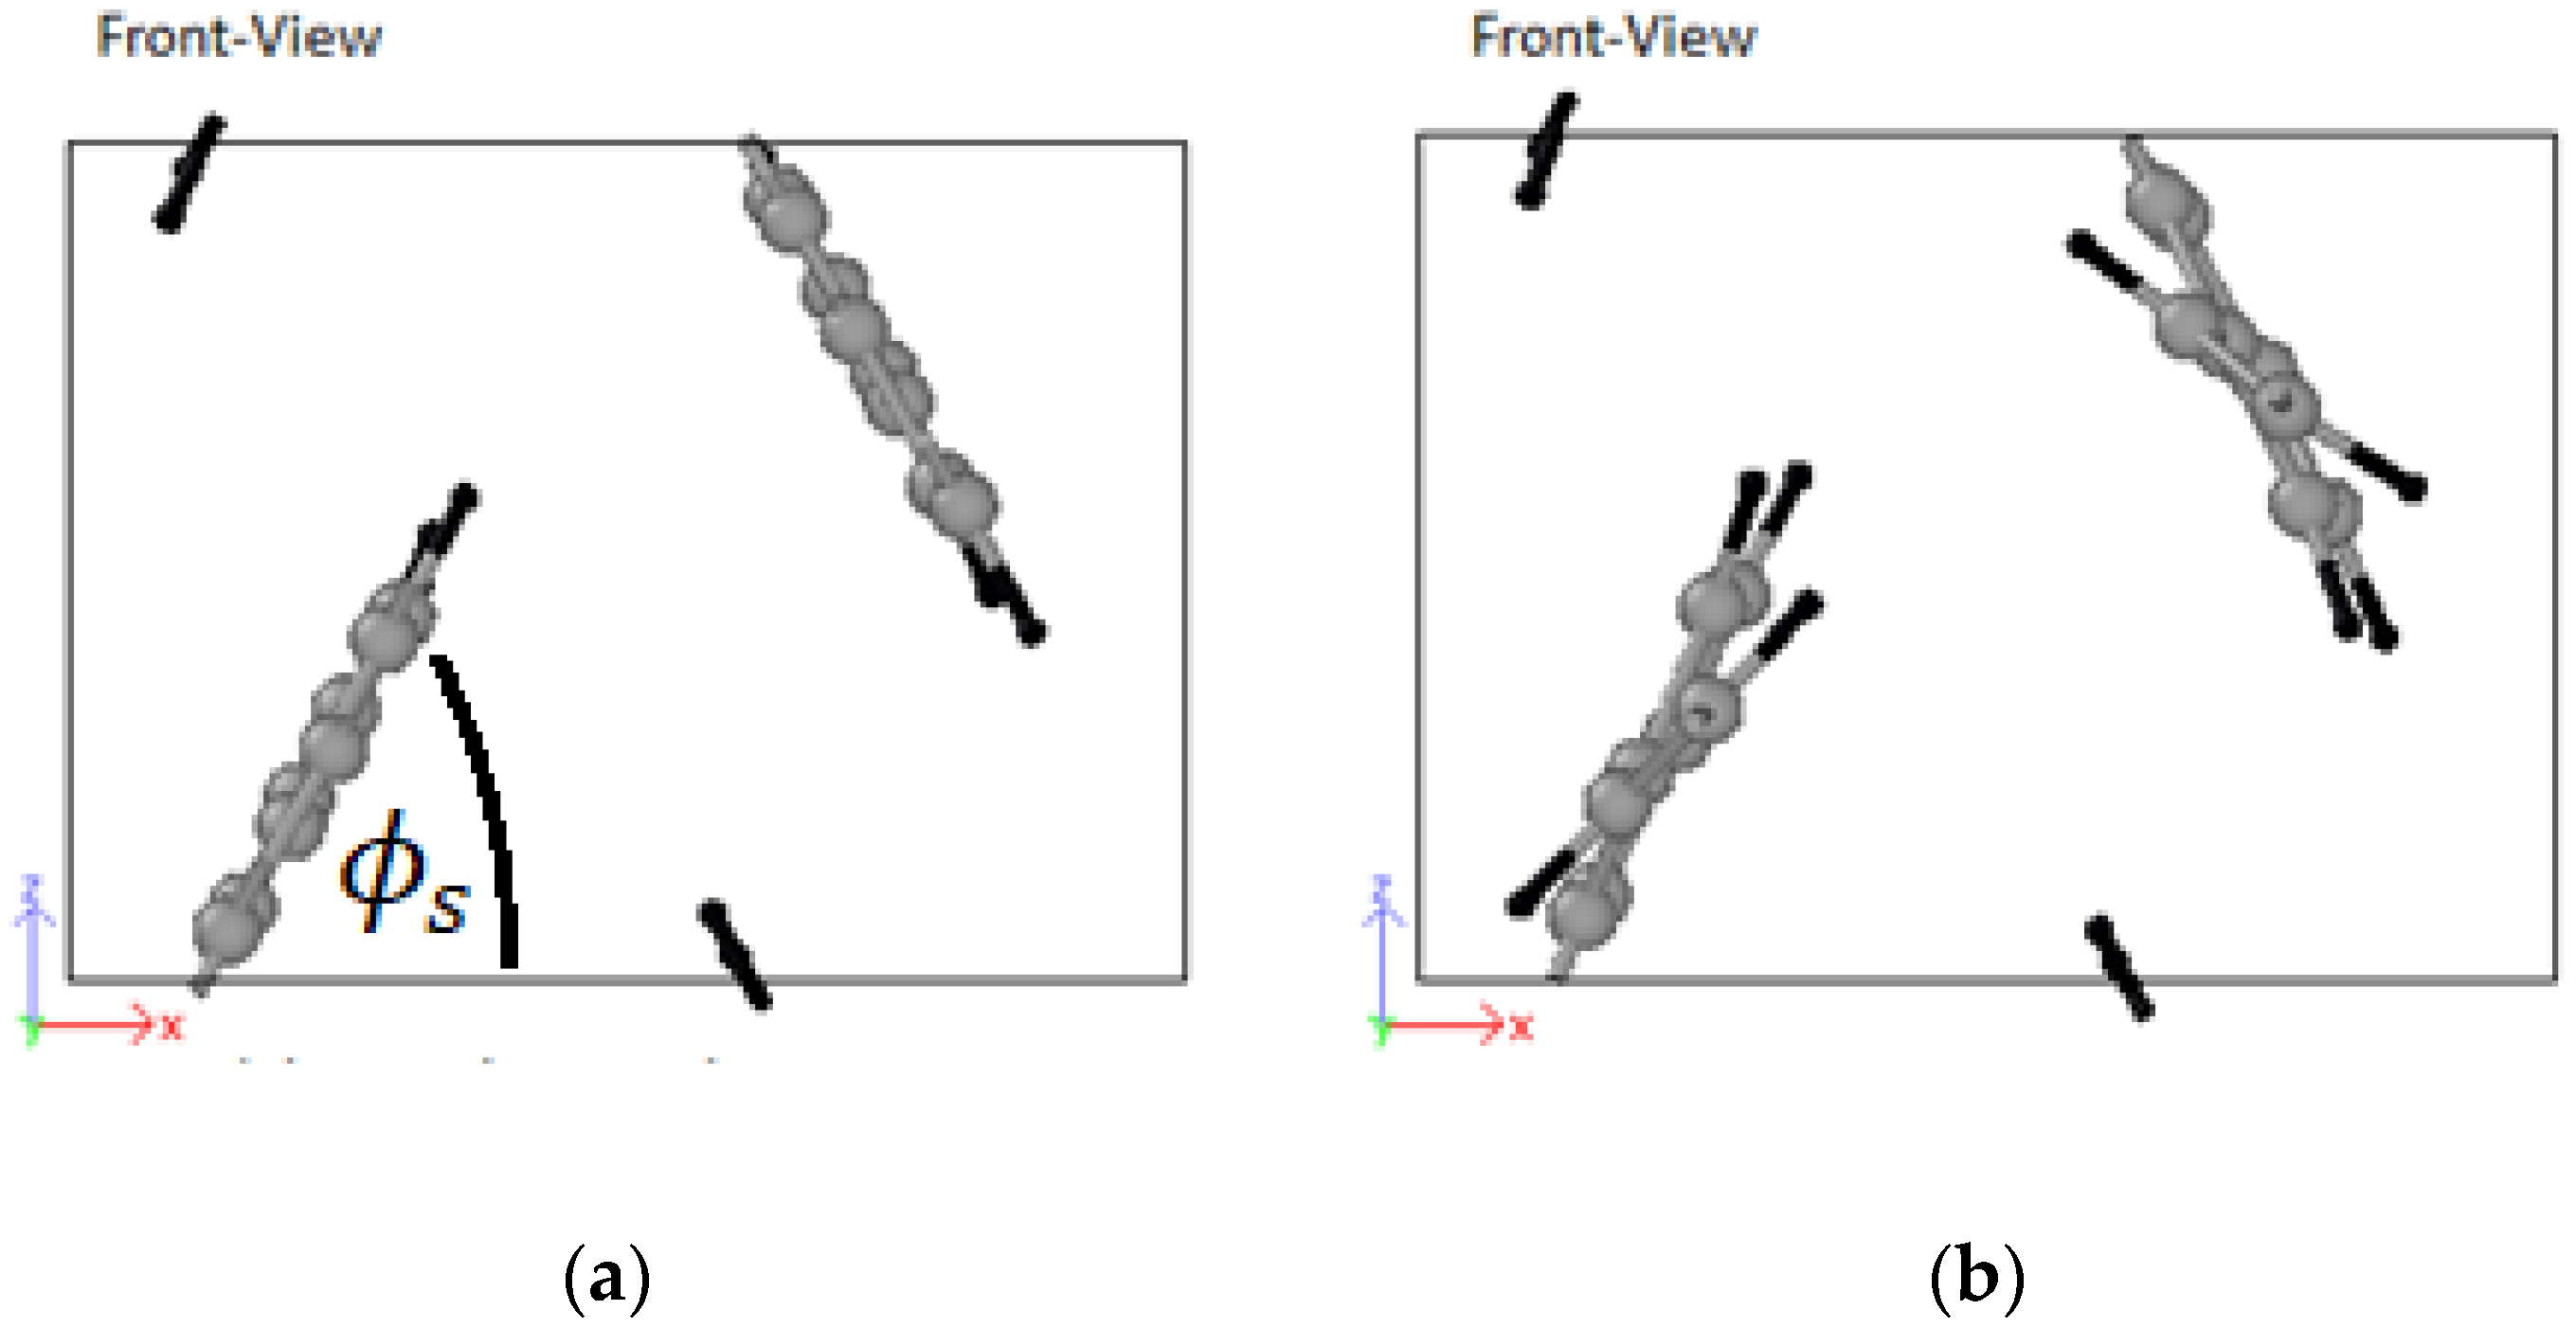
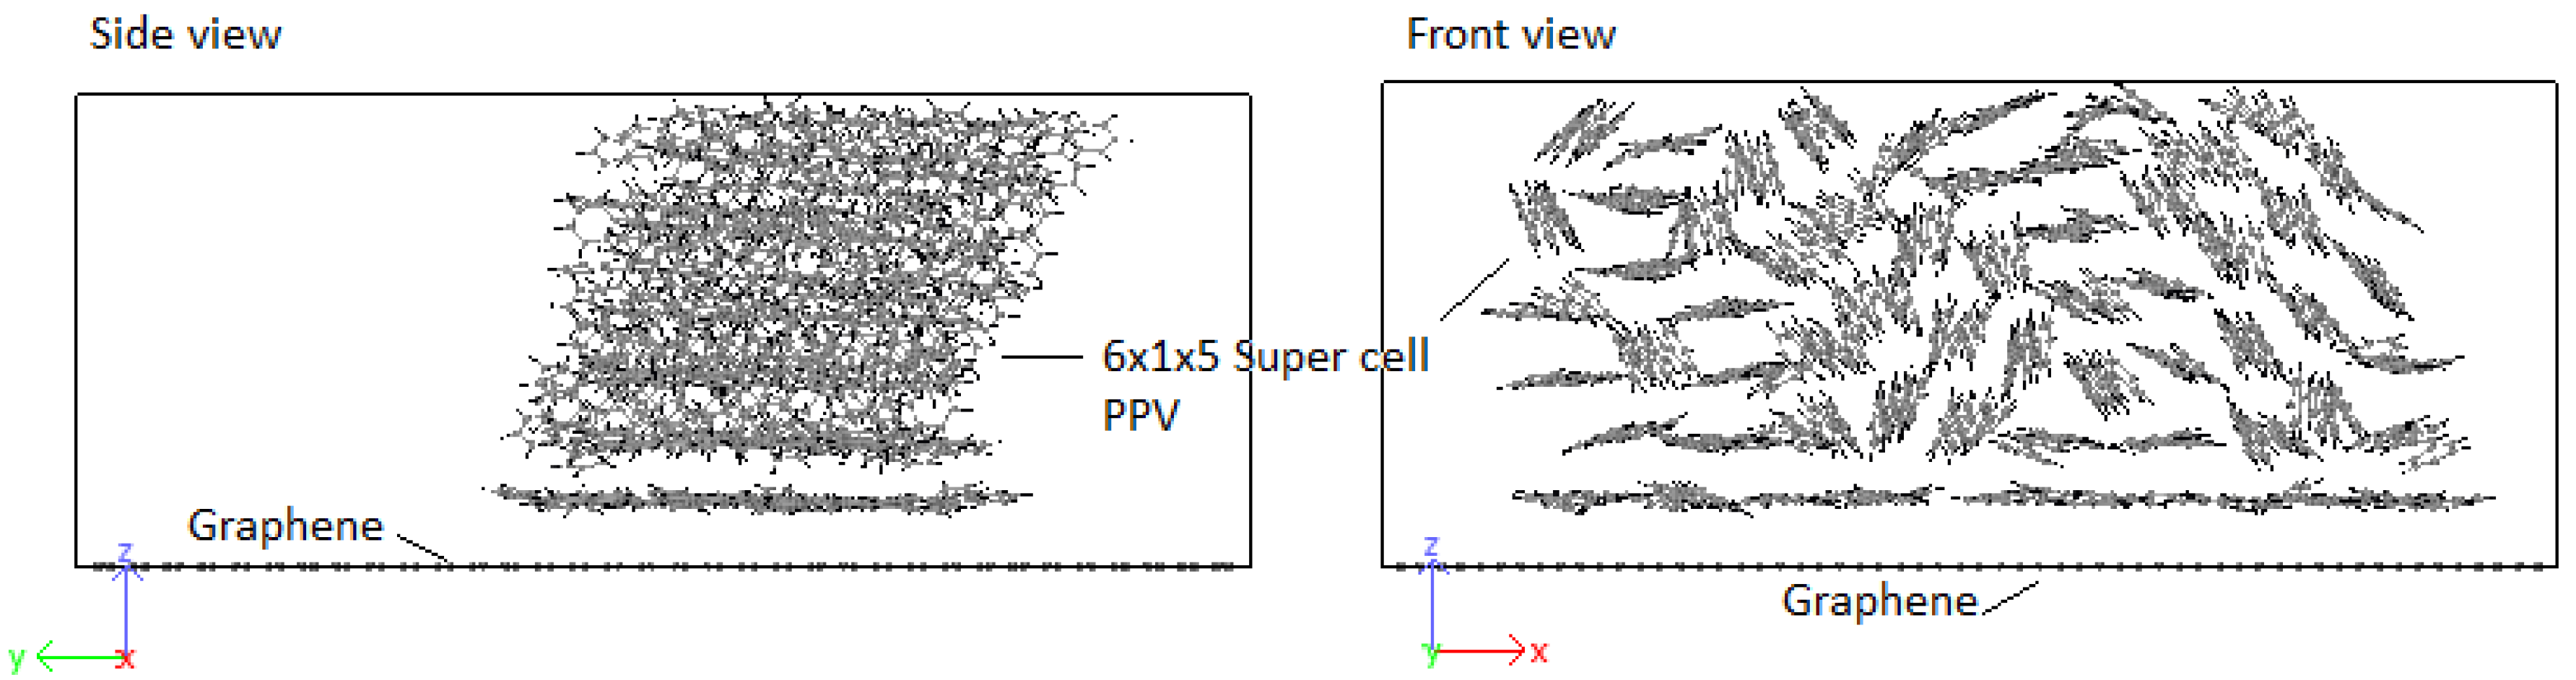
3.4. Structural Configurations
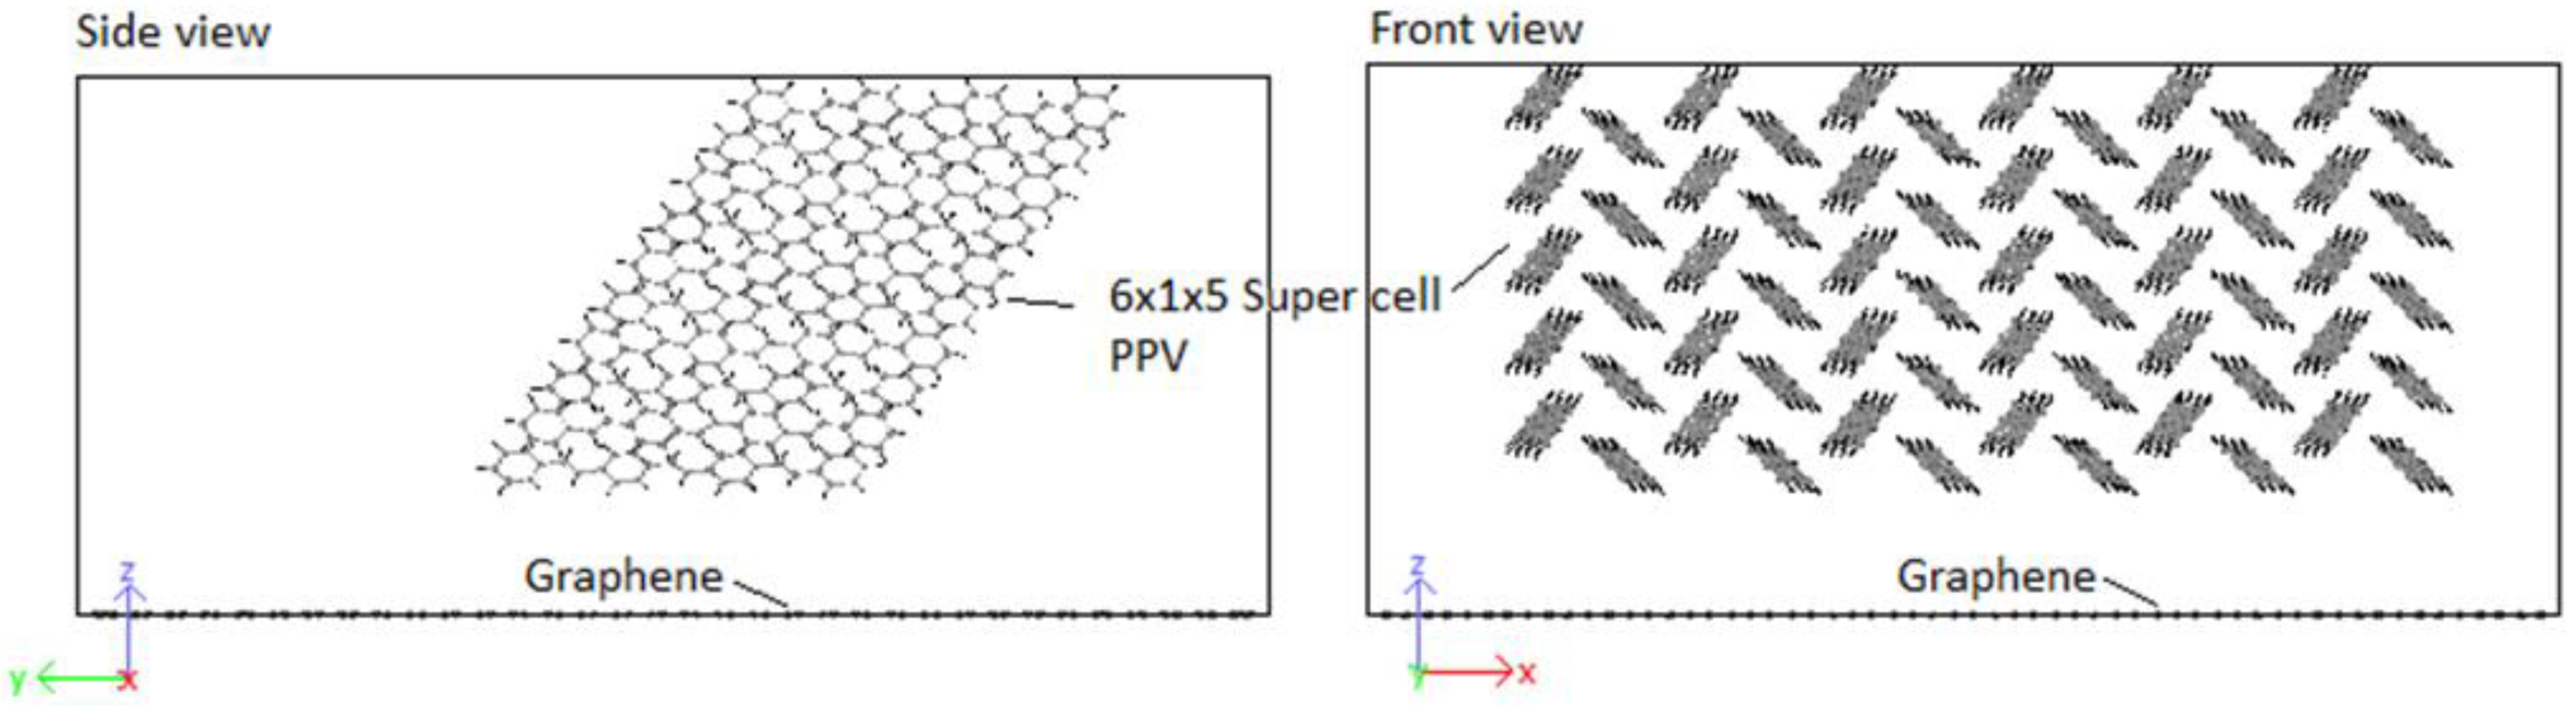
3.4.1. PPV/Graphene
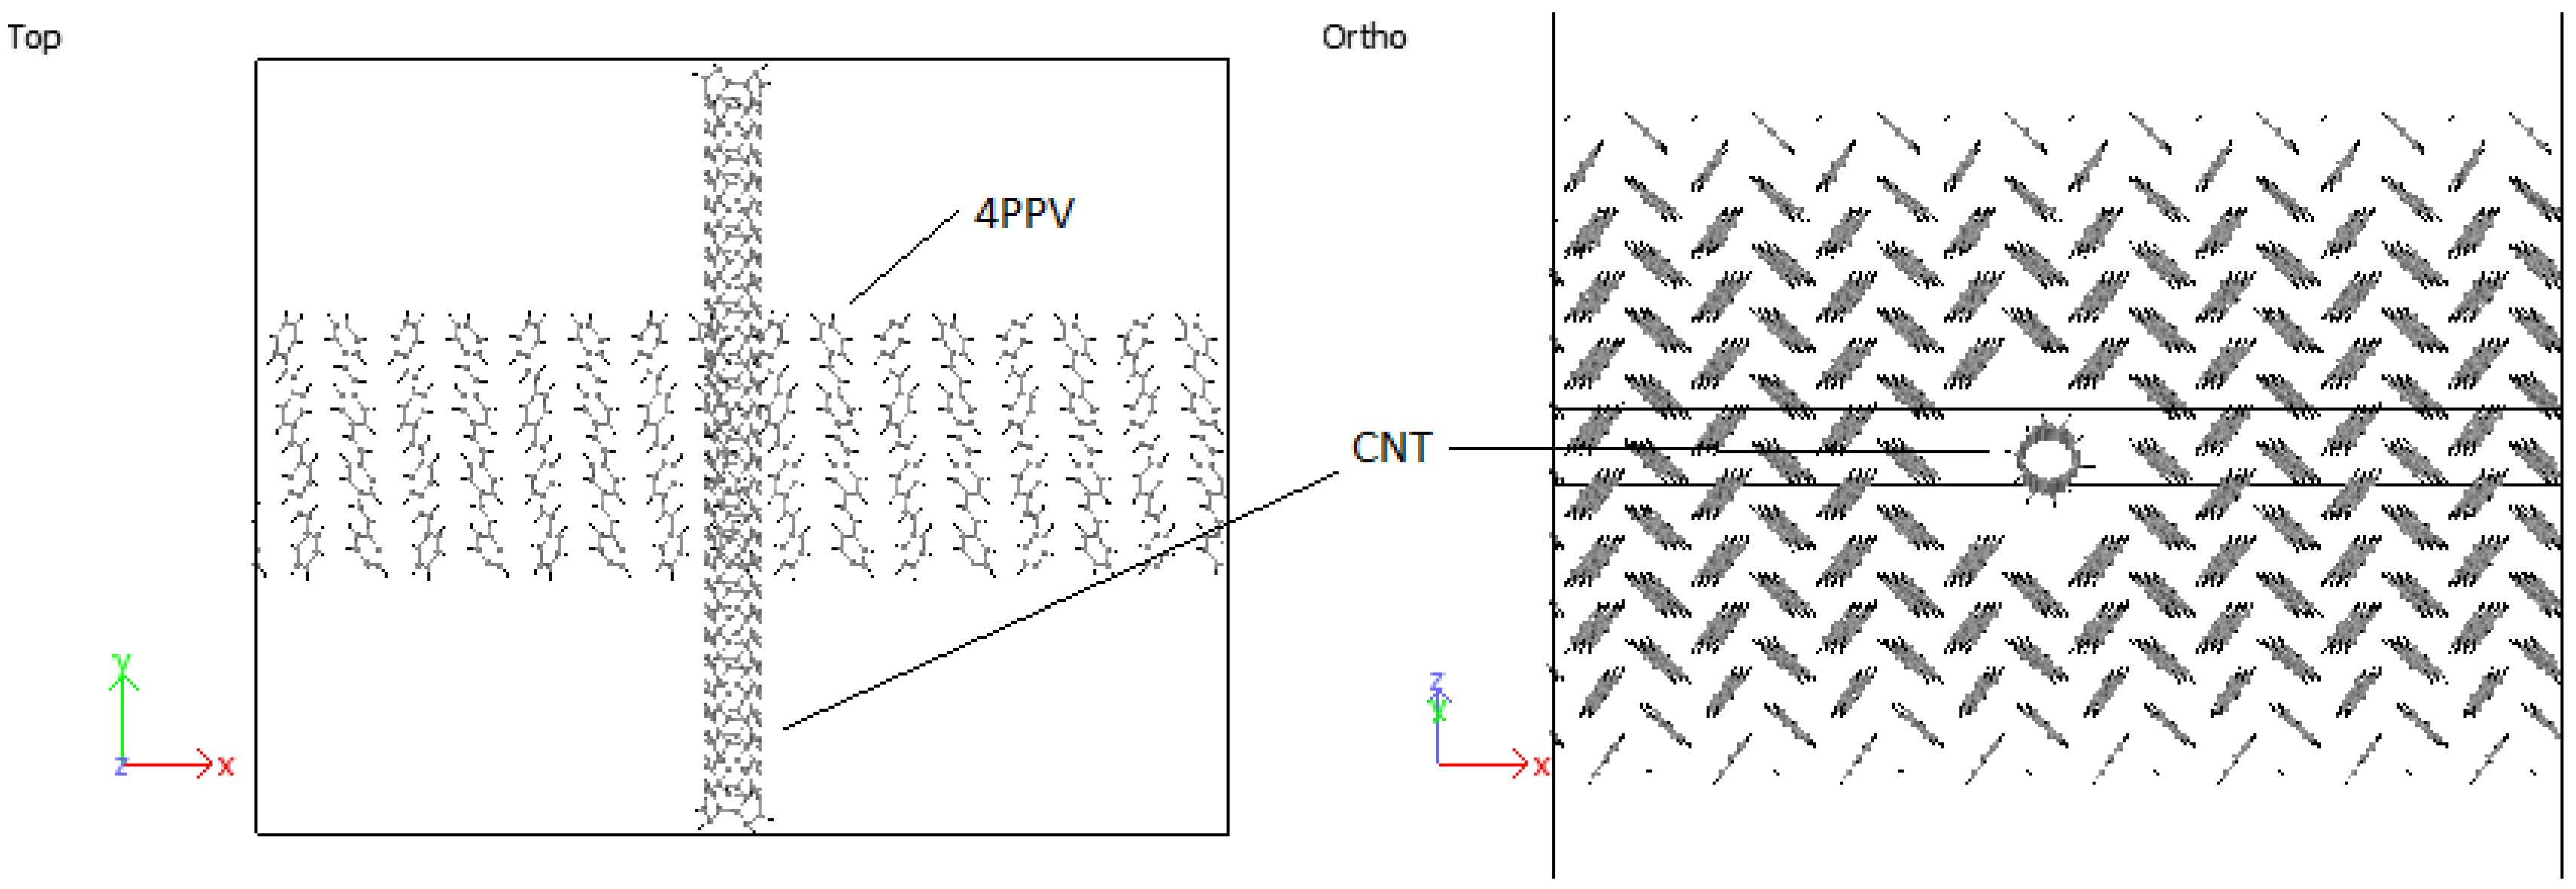
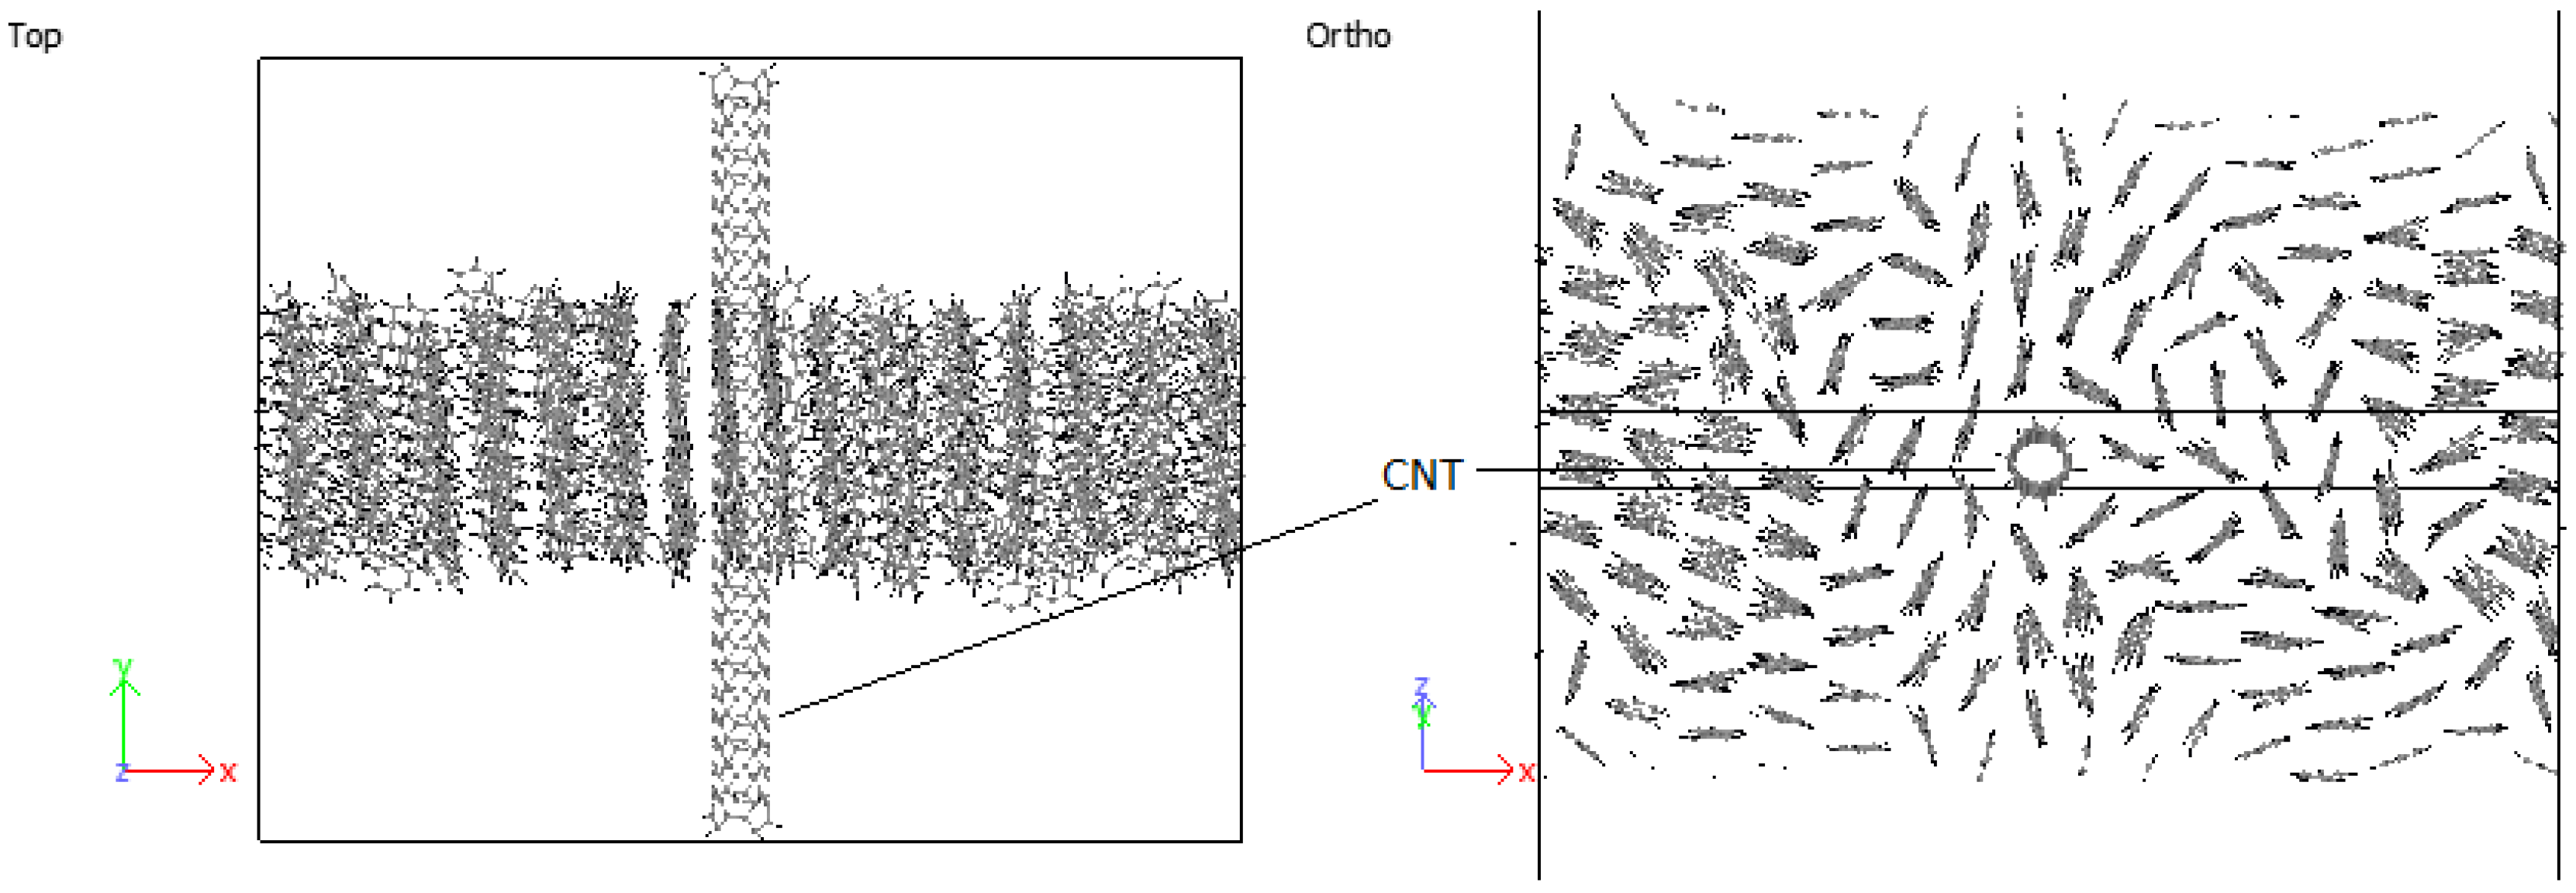
3.4.2. PPV/SWCNT
4. Discussion
4.1. Geometry Optimization
4.2. Crystallization
4.3. Intramolecular Interactions and Binding Energy
4.4. Structural Configurations
5. Conclusions
Author Contributions
Funding
Acknowledgments
Conflicts of Interest
References
- Pray, L. Organic Electronics for a Better Tomorrow: Innovation, Accessibility, Sustainability (A collaborative report from the Chemical Sciences and Society Summit). R. Soc. Chem. 2012, 9, 34. [Google Scholar]
- Ling, Y.; Kozakiewicz, P.; Blockhuys, F.; Biesemans, M.; Van Alsenoy, C.; Moons, H.; Goovaerts, E.; Willem, R.; Van Doorslaer, S. The solid-state organization of ‘self-doped’ PPV oligomers. Phys. Chem. Chem. Phys. 2011, 13, 18516–18522. [Google Scholar] [CrossRef]
- Segura, J.L.; Martín, N. Functionalized oligoarylenes as building blocks for new organic materials. J. Mater. Chem. 2000, 10, 2403–2435. [Google Scholar] [CrossRef]
- Nakanotani, H.; Saito, M.; Nakamura, H.; Adachi, C. Highly balanced ambipolar mobilities with intense electroluminescence in field-effect transistors based on organic single crystal oligo(p-phenylenevinylene) derivatives. Appl. Phys. Lett. 2009, 95, 33308. [Google Scholar] [CrossRef]
- Van Hutten, P.F.; Wildeman, J.; Meetsma, A.; Hadziioannou, G. Molecular Packing in Unsubstituted Semiconducting Phenylenevinylene Oligomer and Polymer. J. Am. Chem. Soc. 1999, 121, 5910–5918. [Google Scholar] [CrossRef]
- Group, F. Ultrafast Dynamics and Laser Action of Organic Semiconductors; CRC Press: Boca Raton, FL, USA, 2010. [Google Scholar]
- Jangid, N.K.; Chauhan, N.P.S.; Meghwal, K.; Punjabi, P.B. Conducting polymers and their applications. Res. J. Pharm. Biol. Chem. Sci. 2014, 5, 383–412. [Google Scholar]
- Cornil, J.; Beljonne, D.; Shuia, Z.; Hagler, T.W.; Campbell, I.; Bradley, D.D.C.; Müllen, K. Vibronic structure in the optical absorption spectra of phenylene vinylene oligomers: A joint experimental and theoretical study. Chem. Phys. Lett. 1995, 247, 425–432. [Google Scholar] [CrossRef]
- Zheng, G.; Clark, S.J.; Brand, S.; Abram, R.A. First-principles studies of the structural and electronic properties of poly-para-phenylene vinylene. J. Phys. Condens. Matter 2004, 16, 8609–8620. [Google Scholar] [CrossRef][Green Version]
- Nelson, J. Polymer: Fullerene bulk heterojunction solar cells. Mater. Today 2011, 14, 462–470. [Google Scholar] [CrossRef]
- He, Y.; Cheng, N.; Xu, X.; Fu, J.; Wang, J. A high efficiency pure organic room temperature phosphorescence polymer PPV derivative for OLED. Org. Electron. 2019, 64, 247–251. [Google Scholar] [CrossRef]
- Varghese, S.; Park, S.K.; Casado, S.; Fischer, R.C.; Resel, R.; Milián-Medina, B.; Wannemacher, R.; Park, S.Y.; Gierschner, J. Stimulated Emission Properties of Sterically Modified Distyrylbenzene-Based H-Aggregate Single Crystals. J. Phys. Chem. Lett. 2013, 4, 1597–1602. [Google Scholar] [CrossRef] [PubMed]
- Yang, Y.; Turnbull, G.A.; Samuel, I.D.W. Organic Lasers: The Development of Luminescent Concentrators for Pumping Organic Semiconductor Lasers (Adv. Mater. 31/2009). Adv. Mater. 2009, 21. [Google Scholar] [CrossRef]
- Peters, M.; Seneca, S.; Hellings, N.; Junkers, T.; Ethirajan, A. Size-dependent properties of functional PPV-based conjugated polymer nanoparticles for bioimaging. Colloids Surf. B Biointerfaces 2018, 169, 494–501. [Google Scholar] [CrossRef] [PubMed]
- Mullen, K.; Wegner, G. Electronic Materials: The Oligomer Approach; John Wiley & Sons: Hoboken, NJ, USA, 1998. [Google Scholar]
- Gierschner, J.; Lüer, L.; Milián-Medina, B.; Oelkrug, D.; Egelhaaf, H.-J. Highly Emissive H-Aggregates or Aggregation-Induced Emission Quenching? The Photophysics of All-Trans para-Distyrylbenzene. J. Phys. Chem. Lett. 2013, 4, 2686–2697. [Google Scholar] [CrossRef]
- Oelkrag, D.; Egelhaaf, H.-J.; Gierschner, J.; Tompert, A. Electronic deactivation in single chains, nano-aggregates and ultrathin films of conjugated oligomers. Synth. Met. 1996, 76, 249–253. [Google Scholar] [CrossRef]
- Oelkrug, D.; Gierschner, J.; Egelhaaf, H.J.; Lüer, L.; Tompert, A. Evolution of optical absorption from small oligomers to ideally conjugated PPV and MEH-PPV polymers. Synth. Met. 2001, 121, 1693–1694. [Google Scholar]
- Prasad, N.; Singh, I.; Kumari, A.; Madhwal, D.; Madan, S.; Dixit, S.K.; Bhatnagar, P.; Mathur, P. Improving the performance of MEH-PPV based light emitting diode by incorporation of graphene nanosheets. J. Lumin. 2015, 159, 166–170. [Google Scholar] [CrossRef]
- Liu, Z.; He, D.; Wang, Y.; Wu, H.; Wang, J. Effect of SPFGraphene dopant in MEH–PPV organic light-emitting devices. Synth. Met. 2010, 160, 1587–1589. [Google Scholar] [CrossRef]
- Kuo, J.-K.; Huang, P.-H.; Wu, W.-T.; Hsu, Y.-C. Molecular dynamics investigations on the interfacial energy and adhesive strength between C60-filled carbon nanotubes and metallic surface. Mater. Chem. Phys. 2014, 143, 873–880. [Google Scholar] [CrossRef]
- Sun, S.; Chen, S.; Weng, X.; Shan, F.; Hu, S. Effect of Carbon Nanotube Addition on the Interfacial Adhesion between Graphene and Epoxy: A Molecular Dynamics Simulation. Polymers 2019, 11, 121. [Google Scholar] [CrossRef]
- Stankovich, S.; Dikin, D.A.; Dommett, G.H.B.; Kohlhaas, K.M.; Zimney, E.J.; Stach, E.A.; Piner, R.D.; Nguyen, S.T.; Ruoff, R.S. Graphene-based composite materials. Nat. Cell Biol. 2006, 442, 282–286. [Google Scholar] [CrossRef]
- Guo, B.; Fang, L.; Zhang, B.; Gong, J.R. Graphene Doping: A Review. Insci. J. 2011, 1, 80–89. [Google Scholar] [CrossRef]
- Yaya, A. Interactions Faibles Dans Les Nanosystemes Carbones. Ph.D. Thesis, Université de Nantes, Nantes, France, 2011. [Google Scholar]
- Veenstra, S.; Van Hutten, P.; Post, A.; Wang, Y.; Hadziioannou, G.; Jonkman, H. Structural studies on thin films of an unsubstituted oligo(para-phenylenevinylene). Thin Solid Films 2002, 422, 104–111. [Google Scholar] [CrossRef]
- Ishii, B.H.; Sugiyama, K.; Ito, E.; Seki, K. Energy Level Alignment and Interfacial.pdf. Adv. Mater. 1999, 11, 605–625. [Google Scholar] [CrossRef]
- Hill, I.G.; Mäkinen, A.J.; Kafafi, Z.H. Initial stages of metal/organic semiconductor interface formation. J. Appl. Phys. 2000, 88, 889–895. [Google Scholar] [CrossRef]
- Viau, L.; Maury, O.; Le Bozec, H. New 4,4′-oligophenylenevinylene functionalized-[2,2′]-bipyridyl chromophores: Synthesis, optical and thermal properties. Tetrahedron Lett. 2004, 45, 125–128. [Google Scholar] [CrossRef]
- Zheng, G.; Clark, S.J.; Tulip, P.R.; Brand, S.; Abram, R.A. Ab initio dynamics study of poly-para-phenylene vinylene. J. Chem. Phys. 2005, 123, 24904. [Google Scholar] [CrossRef] [PubMed]
- Cardozo, T.M.; Aquino, A.J.A.; Barbatti, M.; Borges, I.; Lischka, H. Absorption and Fluorescence Spectra of Poly(p-phenylenevinylene) (PPV) Oligomers: An ab Initio Simulation. J. Phys. Chem. A 2014, 119, 1787–1795. [Google Scholar] [CrossRef]
- Plimpton, S. Fast Parallel Algorithms for Short-Range Molecular Dynamics. J. Comput. Phys. 1995, 117, 1–19. [Google Scholar] [CrossRef]
- Cornell, W.D.; Cieplak, P.; Bayly, C.I.; Gould, I.R.; Merz, K.M.; Ferguson, D.M.; Spellmeyer, D.C.; Fox, T.; Caldwell, J.W.; Kollman, P.A. A second generation force field for the simulation of proteins, nucleic acids, and organic molecules. J. Am. Chem. Soc. 1995, 117, 5179–5197. [Google Scholar] [CrossRef]
- MacKerell, A.D.; Bashford, D.; Bellott, M.; Dunbrack, R.L.; Evanseck, J.D.; Field, M.J.; Fischer, S.; Gao, J.; Guo, H.; Ha, S.; et al. All-Atom Empirical Potential for Molecular Modeling and Dynamics Studies of Proteins. J. Phys. Chem. B 1998, 102, 3586–3616. [Google Scholar] [CrossRef] [PubMed]
- Gime, X.; Bofill, J.M.; Gonza, J. Algorithm to Evaluate Rate Constants for Polyatomic Chemical Reactions. II. Applications. J. Comput. Chem. 2007, 28, 2111–2121. [Google Scholar]
- Steinbach, P.J.; Brooks, B.R. New spherical-cutoff methods for long-range forces in macromolecular simulation. J. Comput. Chem. 1994, 15, 667–683. [Google Scholar] [CrossRef]
- Martyna, G.J.; Tobias, D.J.; Klein, M.L. Constant pressure molecular dynamics algorithms. J. Chem. Phys. 1994, 101, 4177–4189. [Google Scholar] [CrossRef]
- Parrinello, M.; Rahman, A. Polymorphic transitions in single crystals: A new molecular dynamics method. J. Appl. Phys. 1981, 52, 7182–7190. [Google Scholar] [CrossRef]
- E Tuckerman, M.; Alejandre, J.; López-Rendón, R.; Jochim, A.L.; Martyna, G.J. A Liouville-operator derived measure-preserving integrator for molecular dynamics simulations in the isothermal–isobaric ensemble. J. Phys. A Math. Gen. 2006, 39, 5629–5651. [Google Scholar] [CrossRef]
- Shinoda, W.; Shiga, M.; Mikami, M. Rapid estimation of elastic constants by molecular dynamics simulation under constant stress. Phys. Rev. B 2004, 69, 16–18. [Google Scholar] [CrossRef]
- Dullweber, A.; Leimkuhler, B.; McLachlan, R. Symplectic splitting methods for rigid body molecular dynamics. J. Chem. Phys. 1997, 107, 5840–5851. [Google Scholar] [CrossRef]
- Thompson, M.A.; Zerner, M.C.; Fajer, J. A theoretical examination of the electronic structure and excited states of the bacteriochlorophyll b dimer from Rhodopseudomonas viridis. J. Phys. Chem. 1991, 95, 5693–5700. [Google Scholar] [CrossRef]
- Glendening, E.D.; Feller, D.; Thompson, M.A. An Ab Initio Investigation of the Structure and Alkali Metal Cation Selectivity of 18-Crown-6. J. Am. Chem. Soc. 1994, 116, 10657–10669. [Google Scholar] [CrossRef]
- Thompson, M.A.; Schenter, G.K. Excited States of the Bacteriochlorophyll b Dimer of Rhodopseudomonas viridis: A QM/MM Study of the Photosynthetic Reaction Center That Includes MM Polarization. J. Phys. Chem. 1995, 99, 6374–6386. [Google Scholar] [CrossRef]
- Thompson, M.A. QM/MMpol: A Consistent Model for Solute/Solvent Polarization. Application to the Aqueous Solvation and Spectroscopy of Formaldehyde, Acetaldehyde, and Acetone. J. Phys. Chem. 1996, 100, 14492–14507. [Google Scholar] [CrossRef]
- Rappe, A.K.; Colwell, K.S.; Casewit, C.J. Application of a universal force field to metal complexes. Inorg. Chem. 1993, 32, 3438–3450. [Google Scholar] [CrossRef]
- Rappe, A.K.; Casewit, C.J.; Colwell, K.S.; Goddard, W.A.; Skiff, W.M. UFF, a full periodic table force field for molecular mechanics and molecular dynamics simulations. J. Am. Chem. Soc. 1992, 114, 10024–10035. [Google Scholar] [CrossRef]
- Rappe, A.K.; Goddard, W.A. Charge equilibration for molecular dynamics simulations. J. Phys. Chem. 1991, 95, 3358–3363. [Google Scholar] [CrossRef]
- Casewit, C.J.; Colwell, K.S.; Rappe, A.K. Application of a universal force field to organic molecules. J. Am. Chem. Soc. 1992, 114, 10035–10046. [Google Scholar] [CrossRef]
- Casewit, C.J.; Colwell, K.S.; Rappe, A.K. Application of a universal force field to main group compounds. J. Am. Chem. Soc. 1992, 114, 10046–10053. [Google Scholar] [CrossRef]
- Ajori, S.; Ansari, R.; Haghighi, S. A molecular dynamics study on the buckling behavior of cross-linked functionalized carbon nanotubes under physical adsorption of polymer chains. Appl. Surf. Sci. 2018, 427, 704–714. [Google Scholar] [CrossRef]
- Ansari, R.; Rouhi, S.; Ajori, S. On the Interfacial Properties of Polymers/Functionalized Single-Walled Carbon Nanotubes. Braz. J. Phys. 2016, 46, 361–369. [Google Scholar] [CrossRef]
- Zaminpayma, E.; Mirabbaszadeh, K. Interaction between single-walled carbon nanotubes and polymers: A molecular dynamics simulation study with reactive force field. Comput. Mater. Sci. 2012, 58, 7–11. [Google Scholar] [CrossRef]
- Capaz, R.B.; Caldas, M.J. Ab initio calculations of structural and dynamical properties of poly(p-phenylene) and poly(p-phenylene vinylene). Phys. Rev. B 2003, 67, 205205. [Google Scholar] [CrossRef]
- Finder, C.J.; Newton, M.G.; Allinger, N.L. An improved structure of trans-stilbene. Acta Crystallogr. Sect. B Struct. Crystallogr. Cryst. Chem. 1974, 30, 411–415. [Google Scholar] [CrossRef]
- Weiner, P.K.; Kollman, P.A. AMBER: Assisted model building with energy refinement. A general program for modeling molecules and their interactions. J. Comput. Chem. 1981, 2, 287–303. [Google Scholar] [CrossRef]
- Gao, J. In Modeling the Hydrogen Bond. Am. Chem. Soc. 1994. [Google Scholar] [CrossRef]
- Gao, J. Parameters for a Combined Ab Initio Quantum Mechanical and Molecular Basis Set. J. Comput. Chem. 1996, 17, 386–395. [Google Scholar]
- Freindorf, M.; Shao, Y.; Furlani, T.R.; Kong, J. Lennard-Jones parameters for the combined QM/MM method using the B3LYP/6-31+G*/AMBER potential. J. Comput. Chem. 2005, 26, 1270–1278. [Google Scholar] [CrossRef]
- Morris, G.M.; Goodsell, D.S.; Huey, R.; Hart, W.E.; Halliday, S.; Belew, R.; Olson, A.J. User’s Guide Autodock 3.0.5. Methodol. J. Comput. Chem. 2009, 30, 2785–2791. [Google Scholar] [CrossRef] [PubMed]
- Spano, F.C. The fundamental photophysics of conjugated oligomer herringbone aggregates. J. Chem. Phys. 2003, 118, 981–994. [Google Scholar] [CrossRef]
- Yang, M.; Koutsos, V.; Zaiser, M. Interactions between Polymers and Carbon Nanotubes: A Molecular Dynamics Study. J. Phys. Chem. B 2005, 109, 10009–10014. [Google Scholar] [CrossRef]
- Yaya, A.; Impellizzeri, A.; Massuyeau, F.; Duvail, J.; Briddon, P.; Ewels, C. Mapping the stacking interaction of triphenyl vinylene oligomers with graphene and carbon nanotubes. Carbon 2019, 141, 274–282. [Google Scholar] [CrossRef]
- Martens, J.; Halliday, D.; Marseglia, E.; Bradley, D.D.C.; Friend, R.; Burn, P.L.; Holmes, A. Structural order in poly(p-phenylene vinylene). Synth. Met. 1993, 55, 434–439. [Google Scholar] [CrossRef]
- Moon, Y.B.; Rughooputh, S.D.D.V.; Heeger, A.J.; Patil, A.O.; Wudl, F. X-ray scattering study of the coversion of poly(p-phenylene vinylene) precursor to the conjugated polymer. Synth. Met. 1989, 29, E79–E84. [Google Scholar] [CrossRef]
- Chen, D.; Winokur, M.; Masse, M.; E Karasz, F. A structural study of poly(p-phenylene vinylene). Polymer 1992, 33, 3116–3122. [Google Scholar] [CrossRef]
- Gagnon, D.R. Chemical, structural and electrical characterization of poly(p-phenylene vinylene). Ph.D. Thesis, University of Massachusetts, Amherst, MA, USA, 1986. [Google Scholar]
- Granier, T.; Thomas, E.L.; Gagnon, D.R.; Karasz, F.E.; Lenz, R.W. Structure investigation of poly(p-phenylene vinylene). J. Polym. Sci. Part B Polym. Phys. 1986, 24, 2793–2804. [Google Scholar] [CrossRef]


| Approximate Diameter () | Metallic SWCNTs | Semiconductor SWCNTs | ||||||
|---|---|---|---|---|---|---|---|---|
| n | m | Actual Diameter () | Length () | n | m | Actual Diameter () | Length () | |
| 4 | 3 | 3 | 4.01 | 5 | 0 | 3.98 | ||
| 6 | 5 | 5 | 6.75 | 8 | 0 | 6.27 | ||
| 8 | 6 | 6 | 8.14 | 10 | 0 | 7.83 | ||
| 10 | 8 | 8 | 10.85 | 13 | 0 | 10.11 | ||
| Parameters | UFF Stilbene (This Work) | UFF 3PPV (This Work) | Isolated Chain [9] | Isolated Chain [54] | Experiment [55] | Styrene [9] |
|---|---|---|---|---|---|---|
| Bond Lengths (Angstroms) | ||||||
| C2–C4 | 1.398 | 1.398 | 1.375 | 1.383 | 1.387 | 1.381 |
| C1–C2 | 1.398 | 1.398 | 1.401 | 1.411 | 1.397 | 1.384 |
| C1–C3 | 1.398 | 1.398 | 1.403 | 1.414 | 1.394 | 1.395 |
| C6–C7 | 1.464 | 1.467 | 1.451 | 1.443 | 1.469 | 1.449 |
| C7–C8 | 1.323 | 1.323 | 1.349 | 1.361 | 1.318 | 1.329 |
| C2–H | 1.085 | 1.085 | 1.096 | 1.103 | 0.93 | 1.095 |
| C3–H | 1.085 | 1.085 | 1.096 | 1.104 | 1.02 | 1.096 |
| C7–H | 1.085 | 1.085 | 1.101 | 1.108 | 1.00 | 1.098 |
| Bond Angles (Degrees) | ||||||
| C2–C1–C3 | 120.0 | 120.0 | 116.7 | 117.3 | 117.8 | 119.6 |
| C1–C2–C4 | 120.0 | 120.0 | 120.9 | 121.1 | 121.4 | 119.7 |
| C1–C3–C5 | 120.0 | 120.0 | 122.4 | 121.6 | 120.6 | 120.7 |
| C6–C7–C8 | 119.7 | 119.6 | 127 | 126.3 | 126.7 | 128 |
| C1–C2–H | 119.9 | 119.9 | 119.9 | 119.4 | 117.2 | 120.2 |
| C1–C3–H | 119.9 | 119.9 | 117.9 | 118.7 | 119 | 119.6 |
| C6–C7–H | 120.8 | 120.8 | 114.6 | 115 | 116.1 | 113.5 |
| (a) THEORETICAL | ||||||||
|---|---|---|---|---|---|---|---|---|
| B3LYP/6-31+G*/AMBER [59] | AUTODOCK [60] | HF/3-21G/TIP3P [58] | AM1/TIP3P [57] | |||||
| Sigma | Epsilon | Sigma | Epsilon | Sigma | Epsilon | Sigma | Epsilon | |
| C…C | 4.02 | 0.06 | 4.00 | 0.150 | 3.80 | 0.08 | 3.50 | 0.08 |
| H…H | 2.22 | 0.03 | 2.00 | 0.020 | 2.60 | 0.01 | 2.00 | 0.01 |
| C…H | 3.12 | 0.04243 | 3 | 0.05477 | 3.2 | 0.02828 | 2.75 | 0.02828 |
| (b) EXPERIMENTAL | ||||||||
| AMBER-94 [56] | UFF [47] | |||||||
| Sigma | Epsilon | Sigma | Epsilon | |||||
| C…C | 3.40 | 0.10 | 3.851 | 0.105 | ||||
| H…H | 2.53 | 0.02 | 2.886 | 0.044 | ||||
| C…H | 2.965 | 0.04472 | 3.3685 | 0.06797 | ||||
| PPV | |||
|---|---|---|---|
| Monomer | |||
| 2PPV [55] | |||
| 3PPV [61] | |||
| 4PPV | |||
| 5PPV [26] |
| This Work | This Work | Yaya et al. [63] |
|---|---|---|
| 3PPV-(13,0) | ~−22.5 kcal/mol | −22.3687 kcal/mol (−0.97 eV) |
| 3PPV-(11,0) | ---- | −21.6769 kcal/mol (−0.94 eV) |
| 3PPV-(10,0) | ~−22 kcal/mol | ---- |
| 3PPV-(9,0) | ---- | −21.4463 kcal/mol (−0.93 eV) |
| 3PPV-(8,0) | ~−18 kcal/mol | ---- |
| 3PPV-(7,0) | ---- | −20.0627 kcal/mol (−0.87 eV) |
| 3PPV-(5,0) | ~−19 kcal/mol | ---- |
| This Work | This Work | Yaya et al. [63] |
|---|---|---|
| 3PPV-(10,10) | ---- | −23.2911 kcal/mol (−1.01 eV) |
| 3PPV-(8,8) | ~−22 kcal/mol | −22.3687 kcal/mol (−0.97 eV) |
| 3PPV-(6,6) | ~−23 kcal/mol | −21.4463 kcal/mol (−0.93 eV) |
| 3PPV-(5,5) | ~−25 kcal/mol | ---- |
| 3PPV-(4,4) | ---- | −20.5239 kcal/mol (−0.89 eV) |
| 3PPV-(3,3) | ~−21 kcal/mol | ---- |
Sample Availability: Data on PPV, SWCNTs and Graphene used for the computational calculations are available from the authors. | |
Publisher’s Note: MDPI stays neutral with regard to jurisdictional claims in published maps and institutional affiliations. |
© 2020 by the authors. Licensee MDPI, Basel, Switzerland. This article is an open access article distributed under the terms and conditions of the Creative Commons Attribution (CC BY) license (http://creativecommons.org/licenses/by/4.0/).
Share and Cite
Dagadu, N.A.; Ajori, S.; Bensah, Y.D.; Kan-Dapaah, K.; Armah, S.K.; Onwona-Agyeman, B.; Yaya, A. Stacking Interactions of Poly Para-Phenylene Vinylene Oligomers with Graphene and Single-Walled Carbon Nanotubes: A Molecular Dynamics Approach. Molecules 2020, 25, 4812. https://doi.org/10.3390/molecules25204812
Dagadu NA, Ajori S, Bensah YD, Kan-Dapaah K, Armah SK, Onwona-Agyeman B, Yaya A. Stacking Interactions of Poly Para-Phenylene Vinylene Oligomers with Graphene and Single-Walled Carbon Nanotubes: A Molecular Dynamics Approach. Molecules. 2020; 25(20):4812. https://doi.org/10.3390/molecules25204812
Chicago/Turabian StyleDagadu, Nii Amah, Shahram Ajori, Yaw Delali Bensah, Kwabena Kan-Dapaah, Stephen Kofi Armah, Boateng Onwona-Agyeman, and Abu Yaya. 2020. "Stacking Interactions of Poly Para-Phenylene Vinylene Oligomers with Graphene and Single-Walled Carbon Nanotubes: A Molecular Dynamics Approach" Molecules 25, no. 20: 4812. https://doi.org/10.3390/molecules25204812
APA StyleDagadu, N. A., Ajori, S., Bensah, Y. D., Kan-Dapaah, K., Armah, S. K., Onwona-Agyeman, B., & Yaya, A. (2020). Stacking Interactions of Poly Para-Phenylene Vinylene Oligomers with Graphene and Single-Walled Carbon Nanotubes: A Molecular Dynamics Approach. Molecules, 25(20), 4812. https://doi.org/10.3390/molecules25204812