Constructing Controllable Logic Circuits Based on DNAzyme Activity


Abstract
1. Introduction
2. Results and Discussion
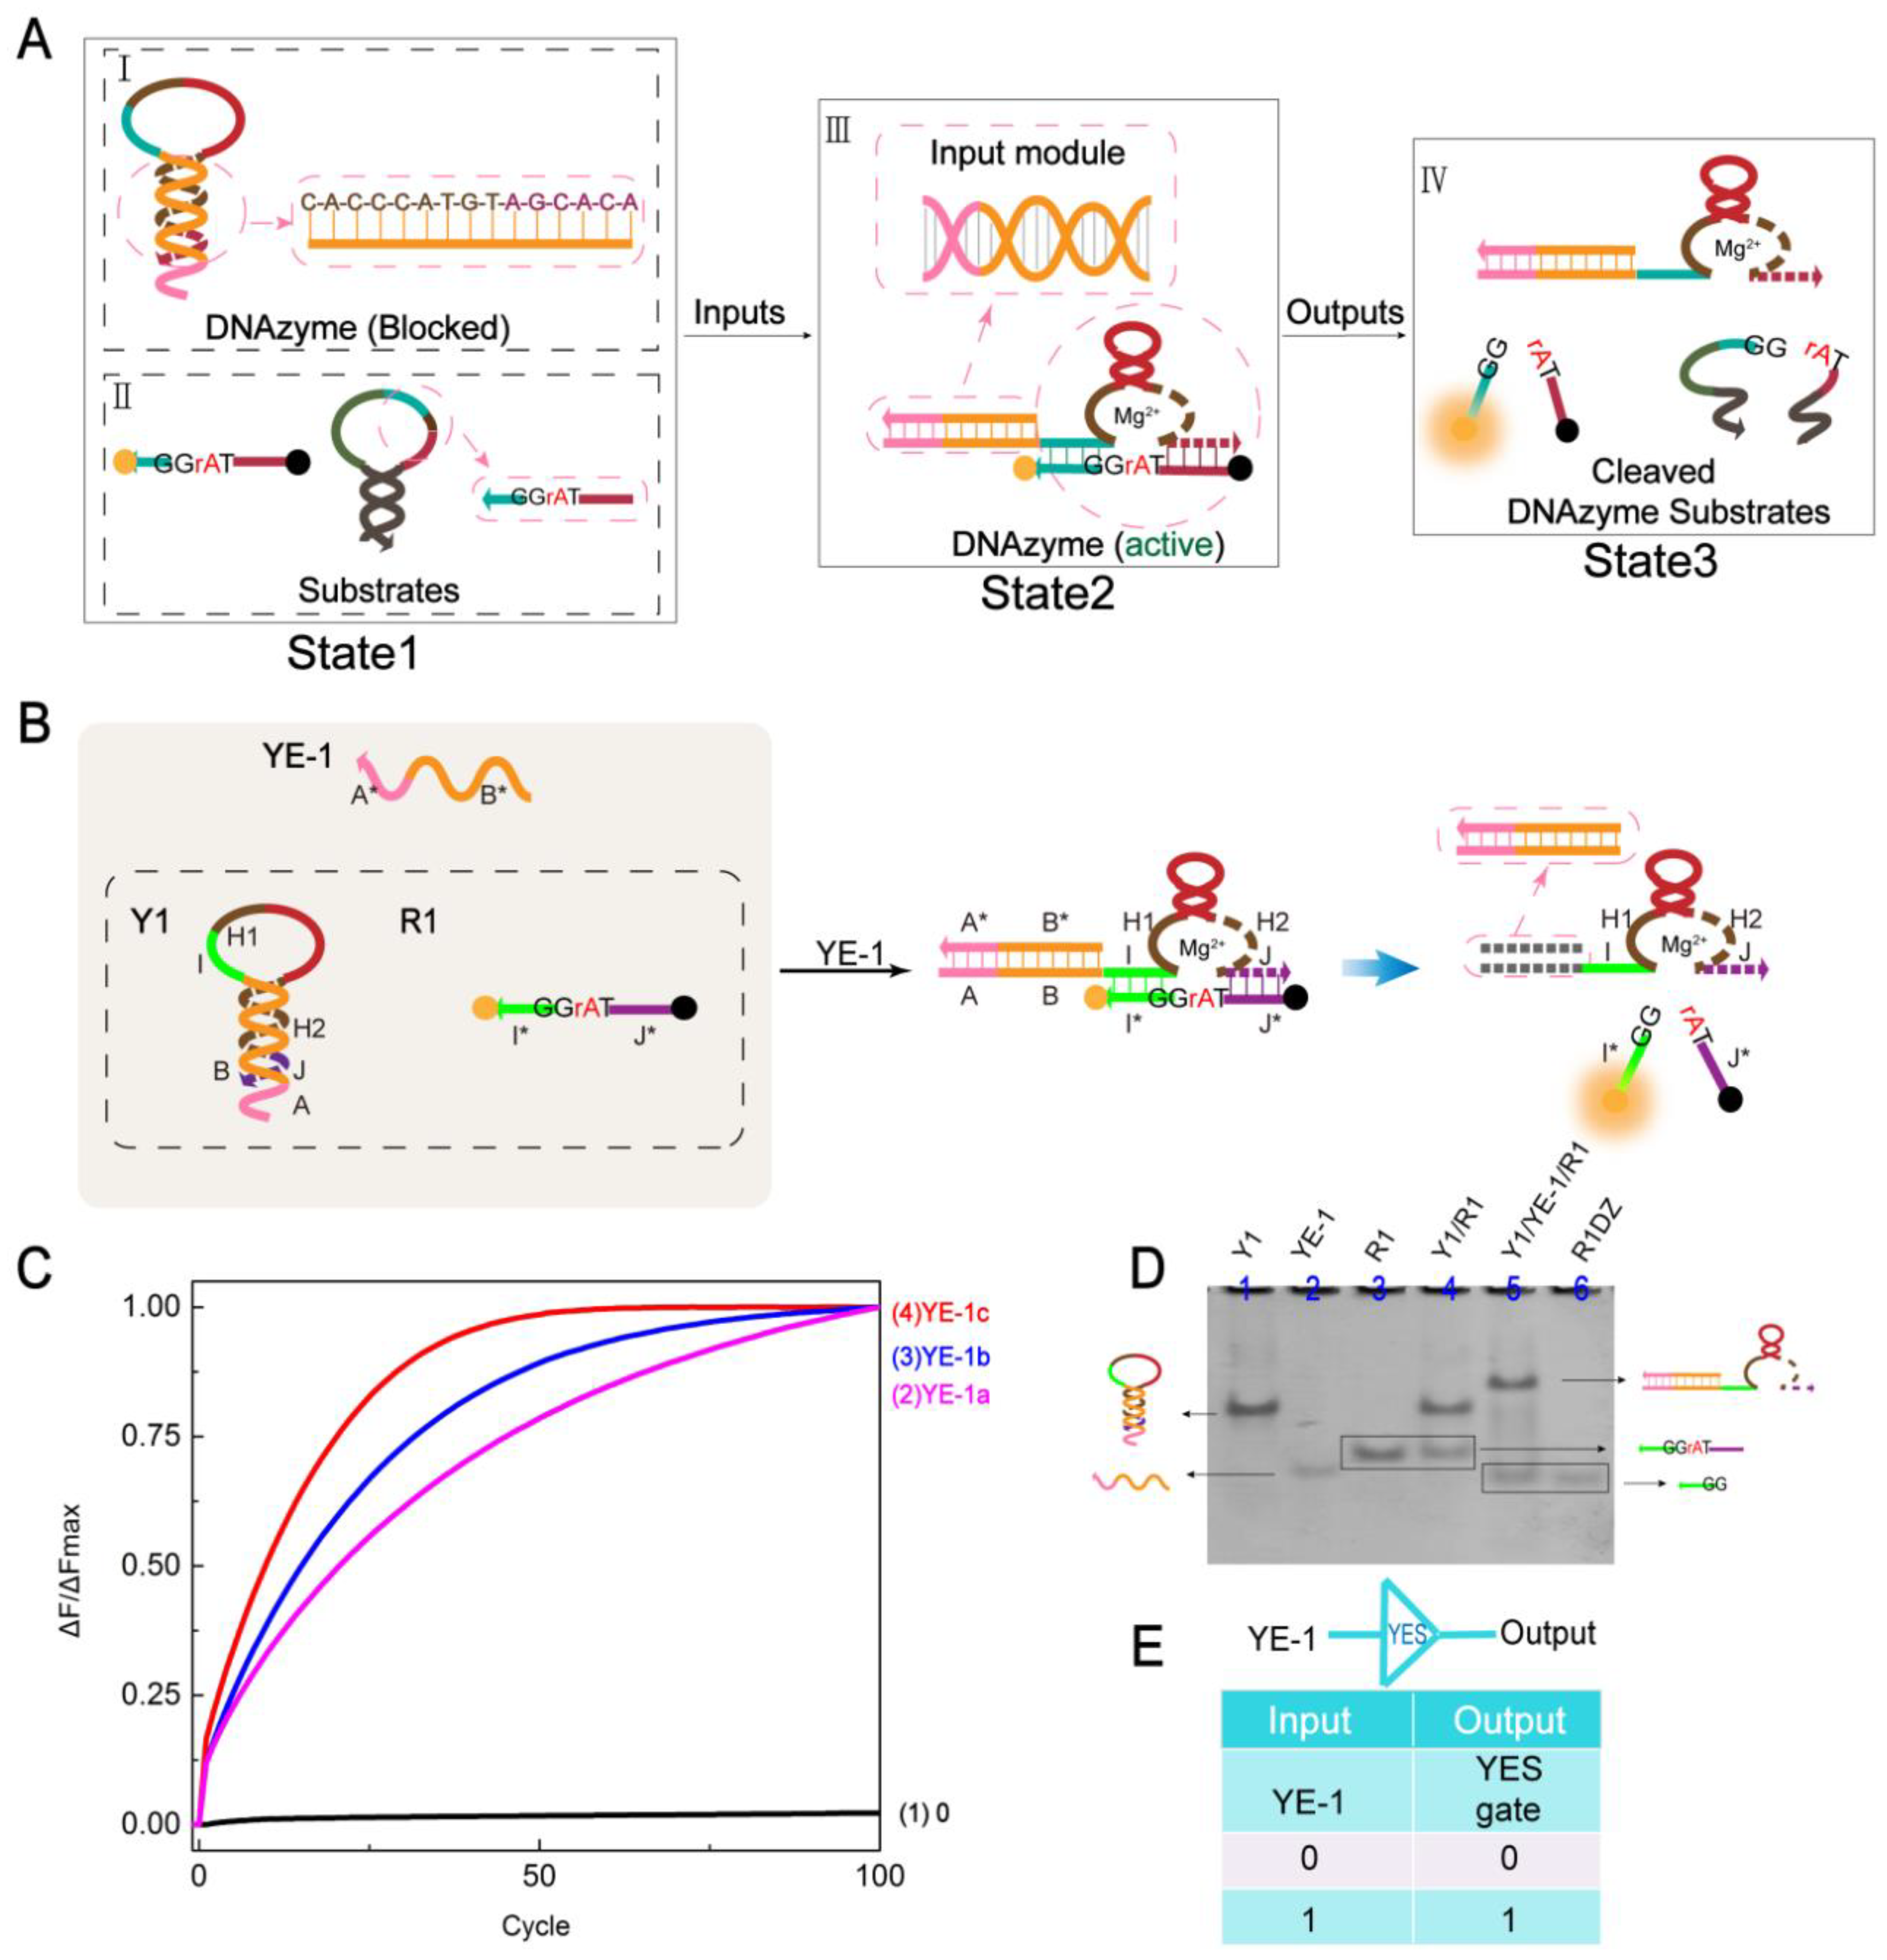
2.1. YES Gate
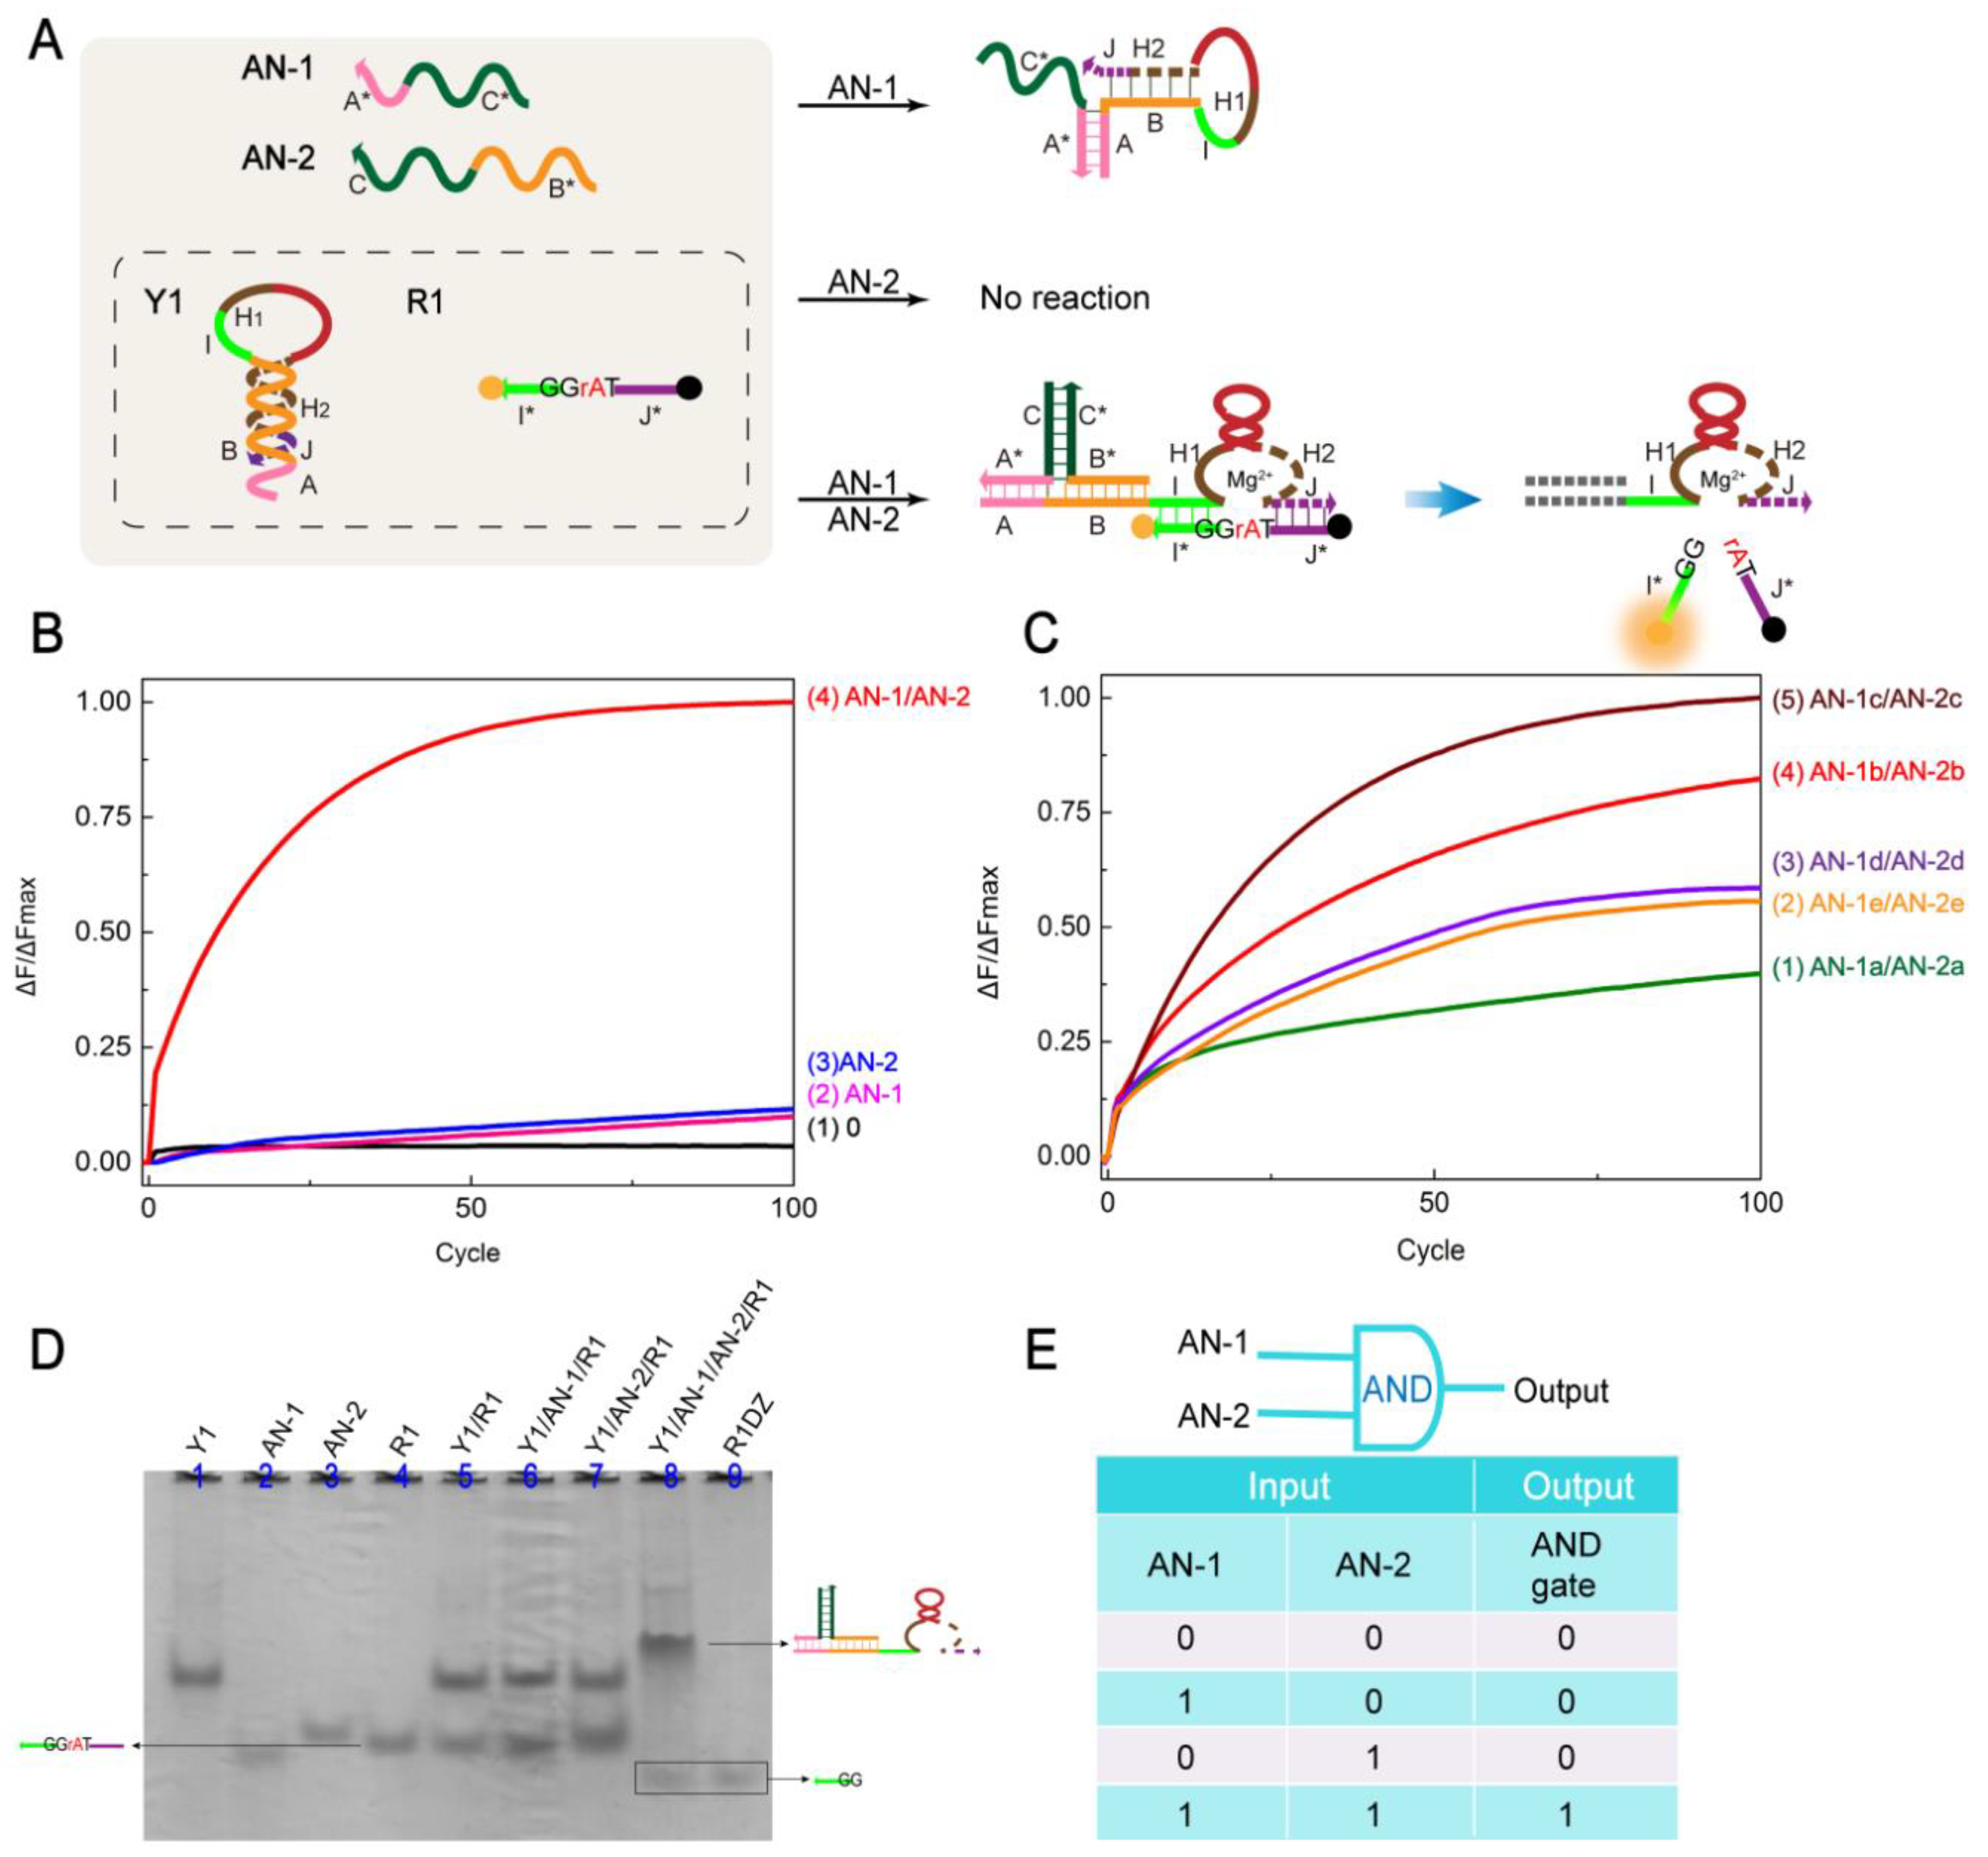
2.2. AND Gate
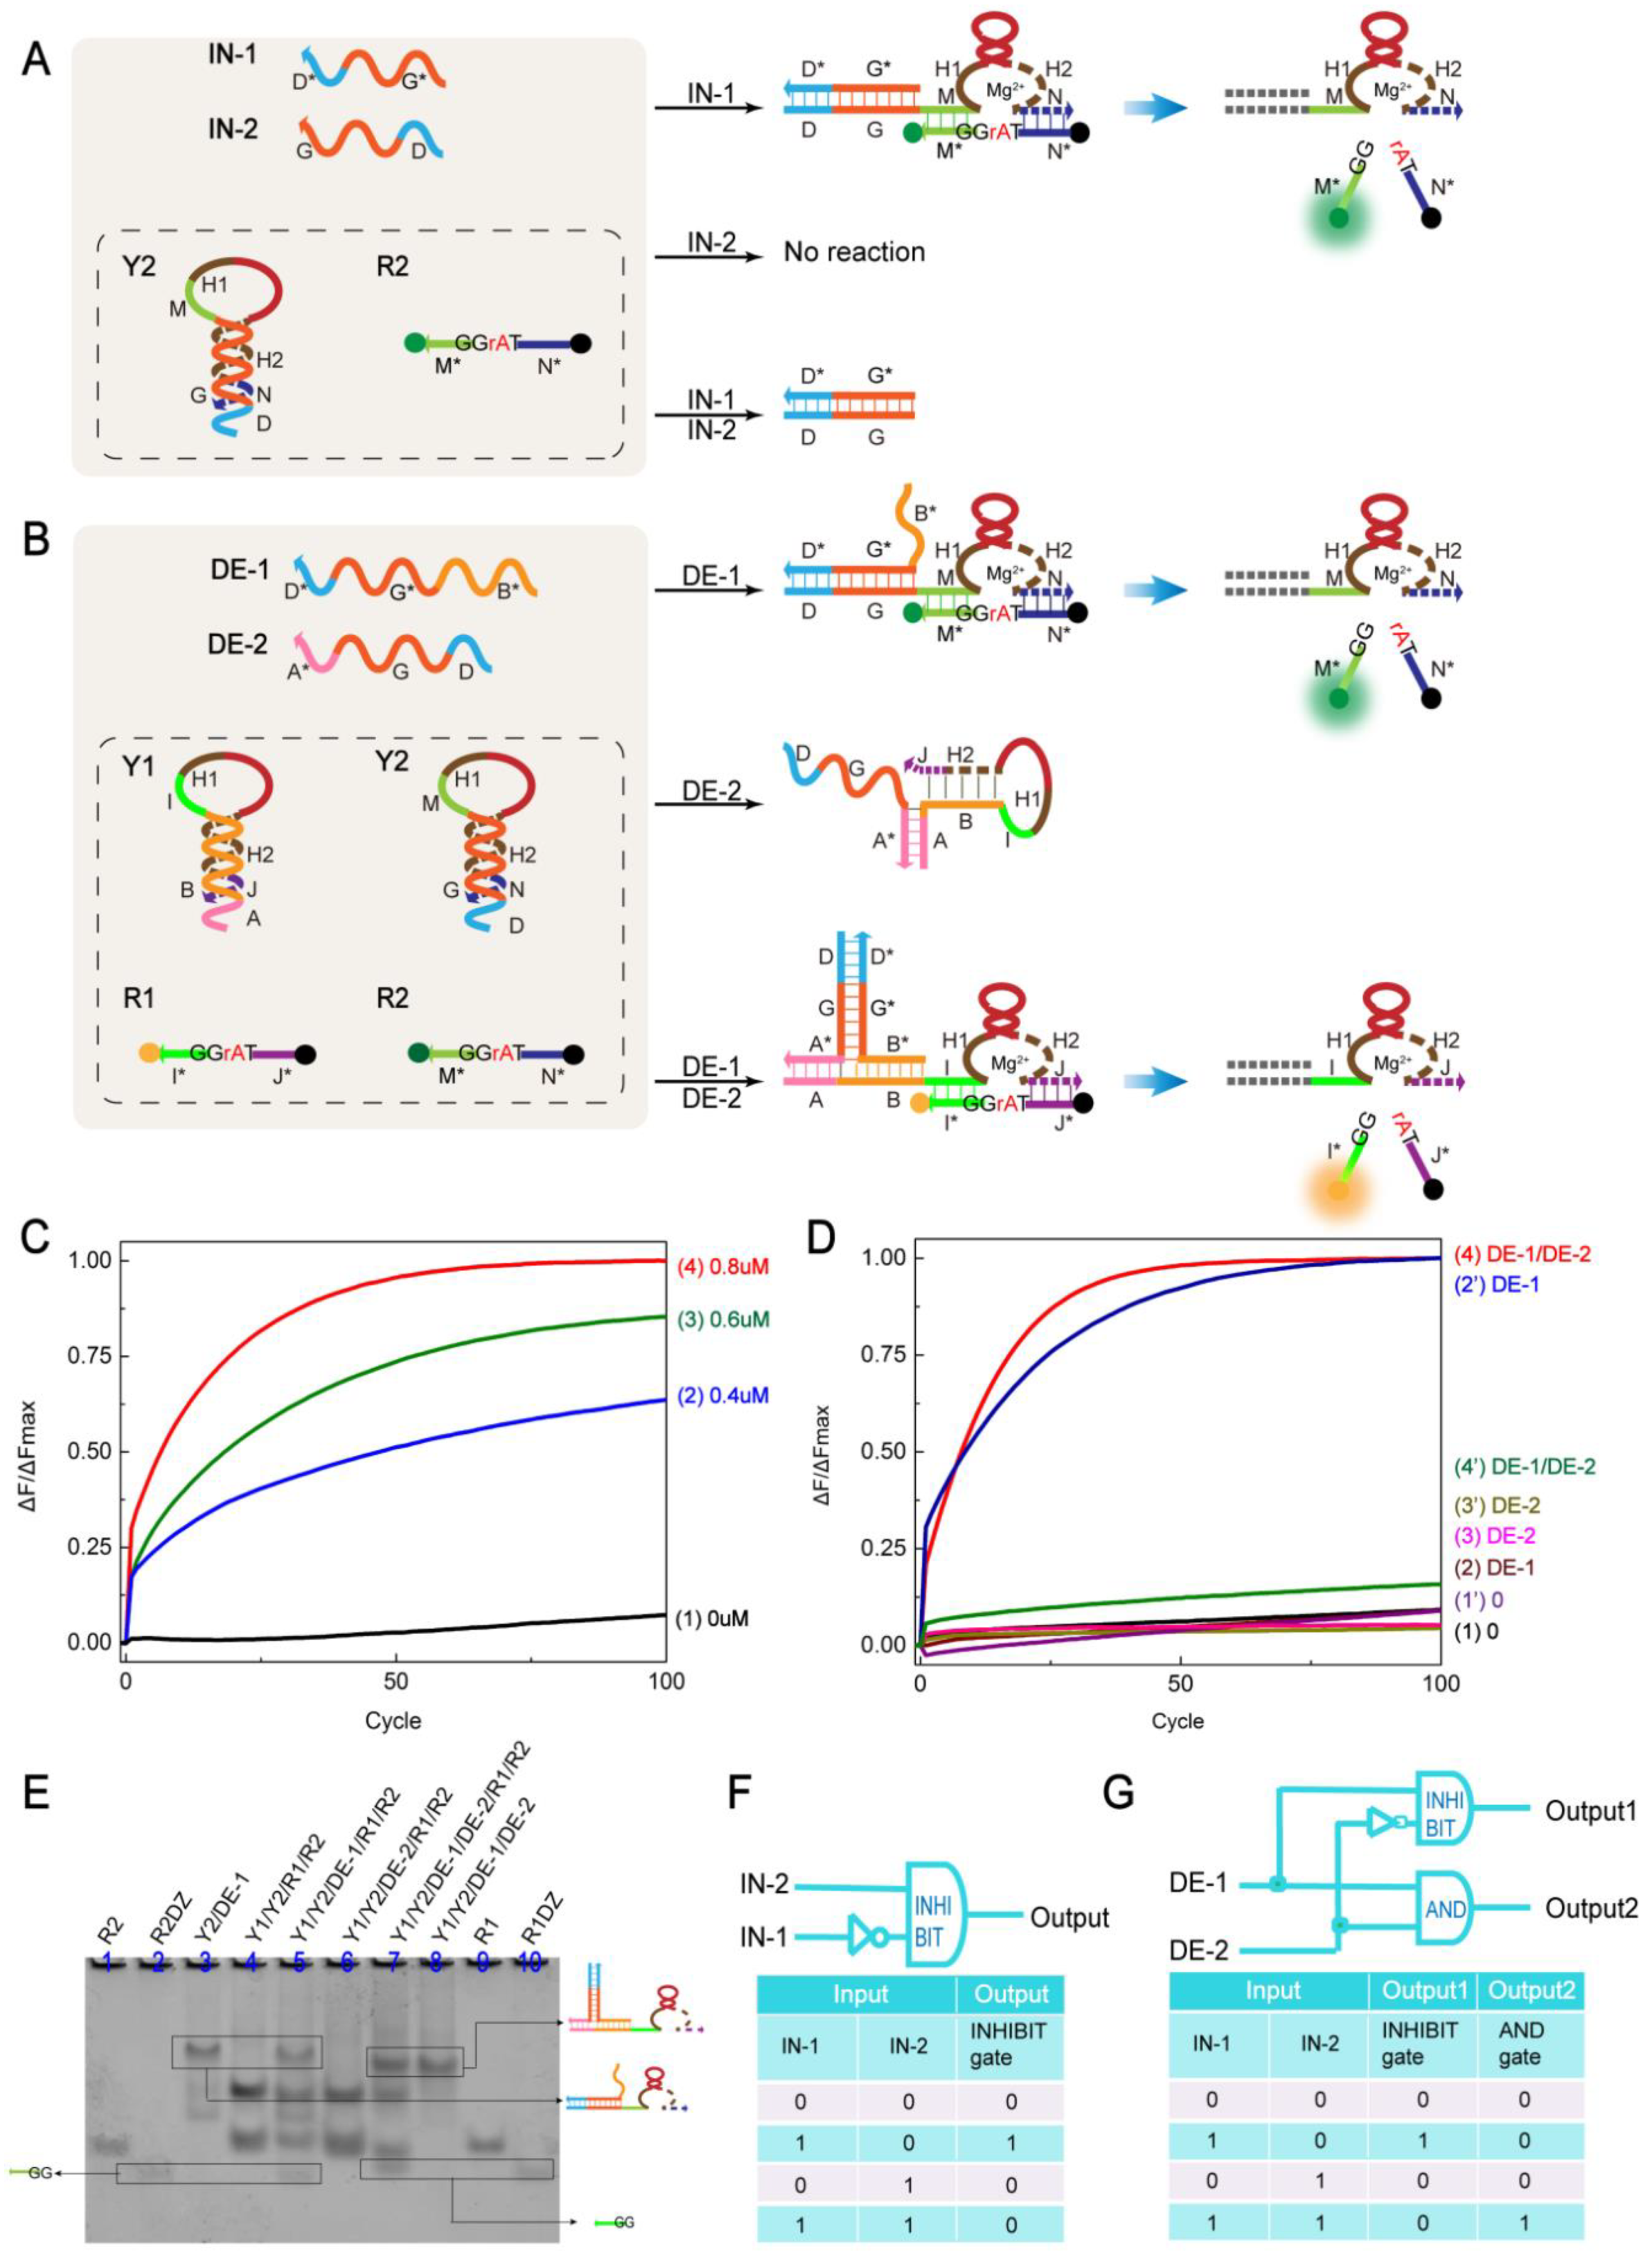
2.3. INHIBIT Gate and Demultiplexer
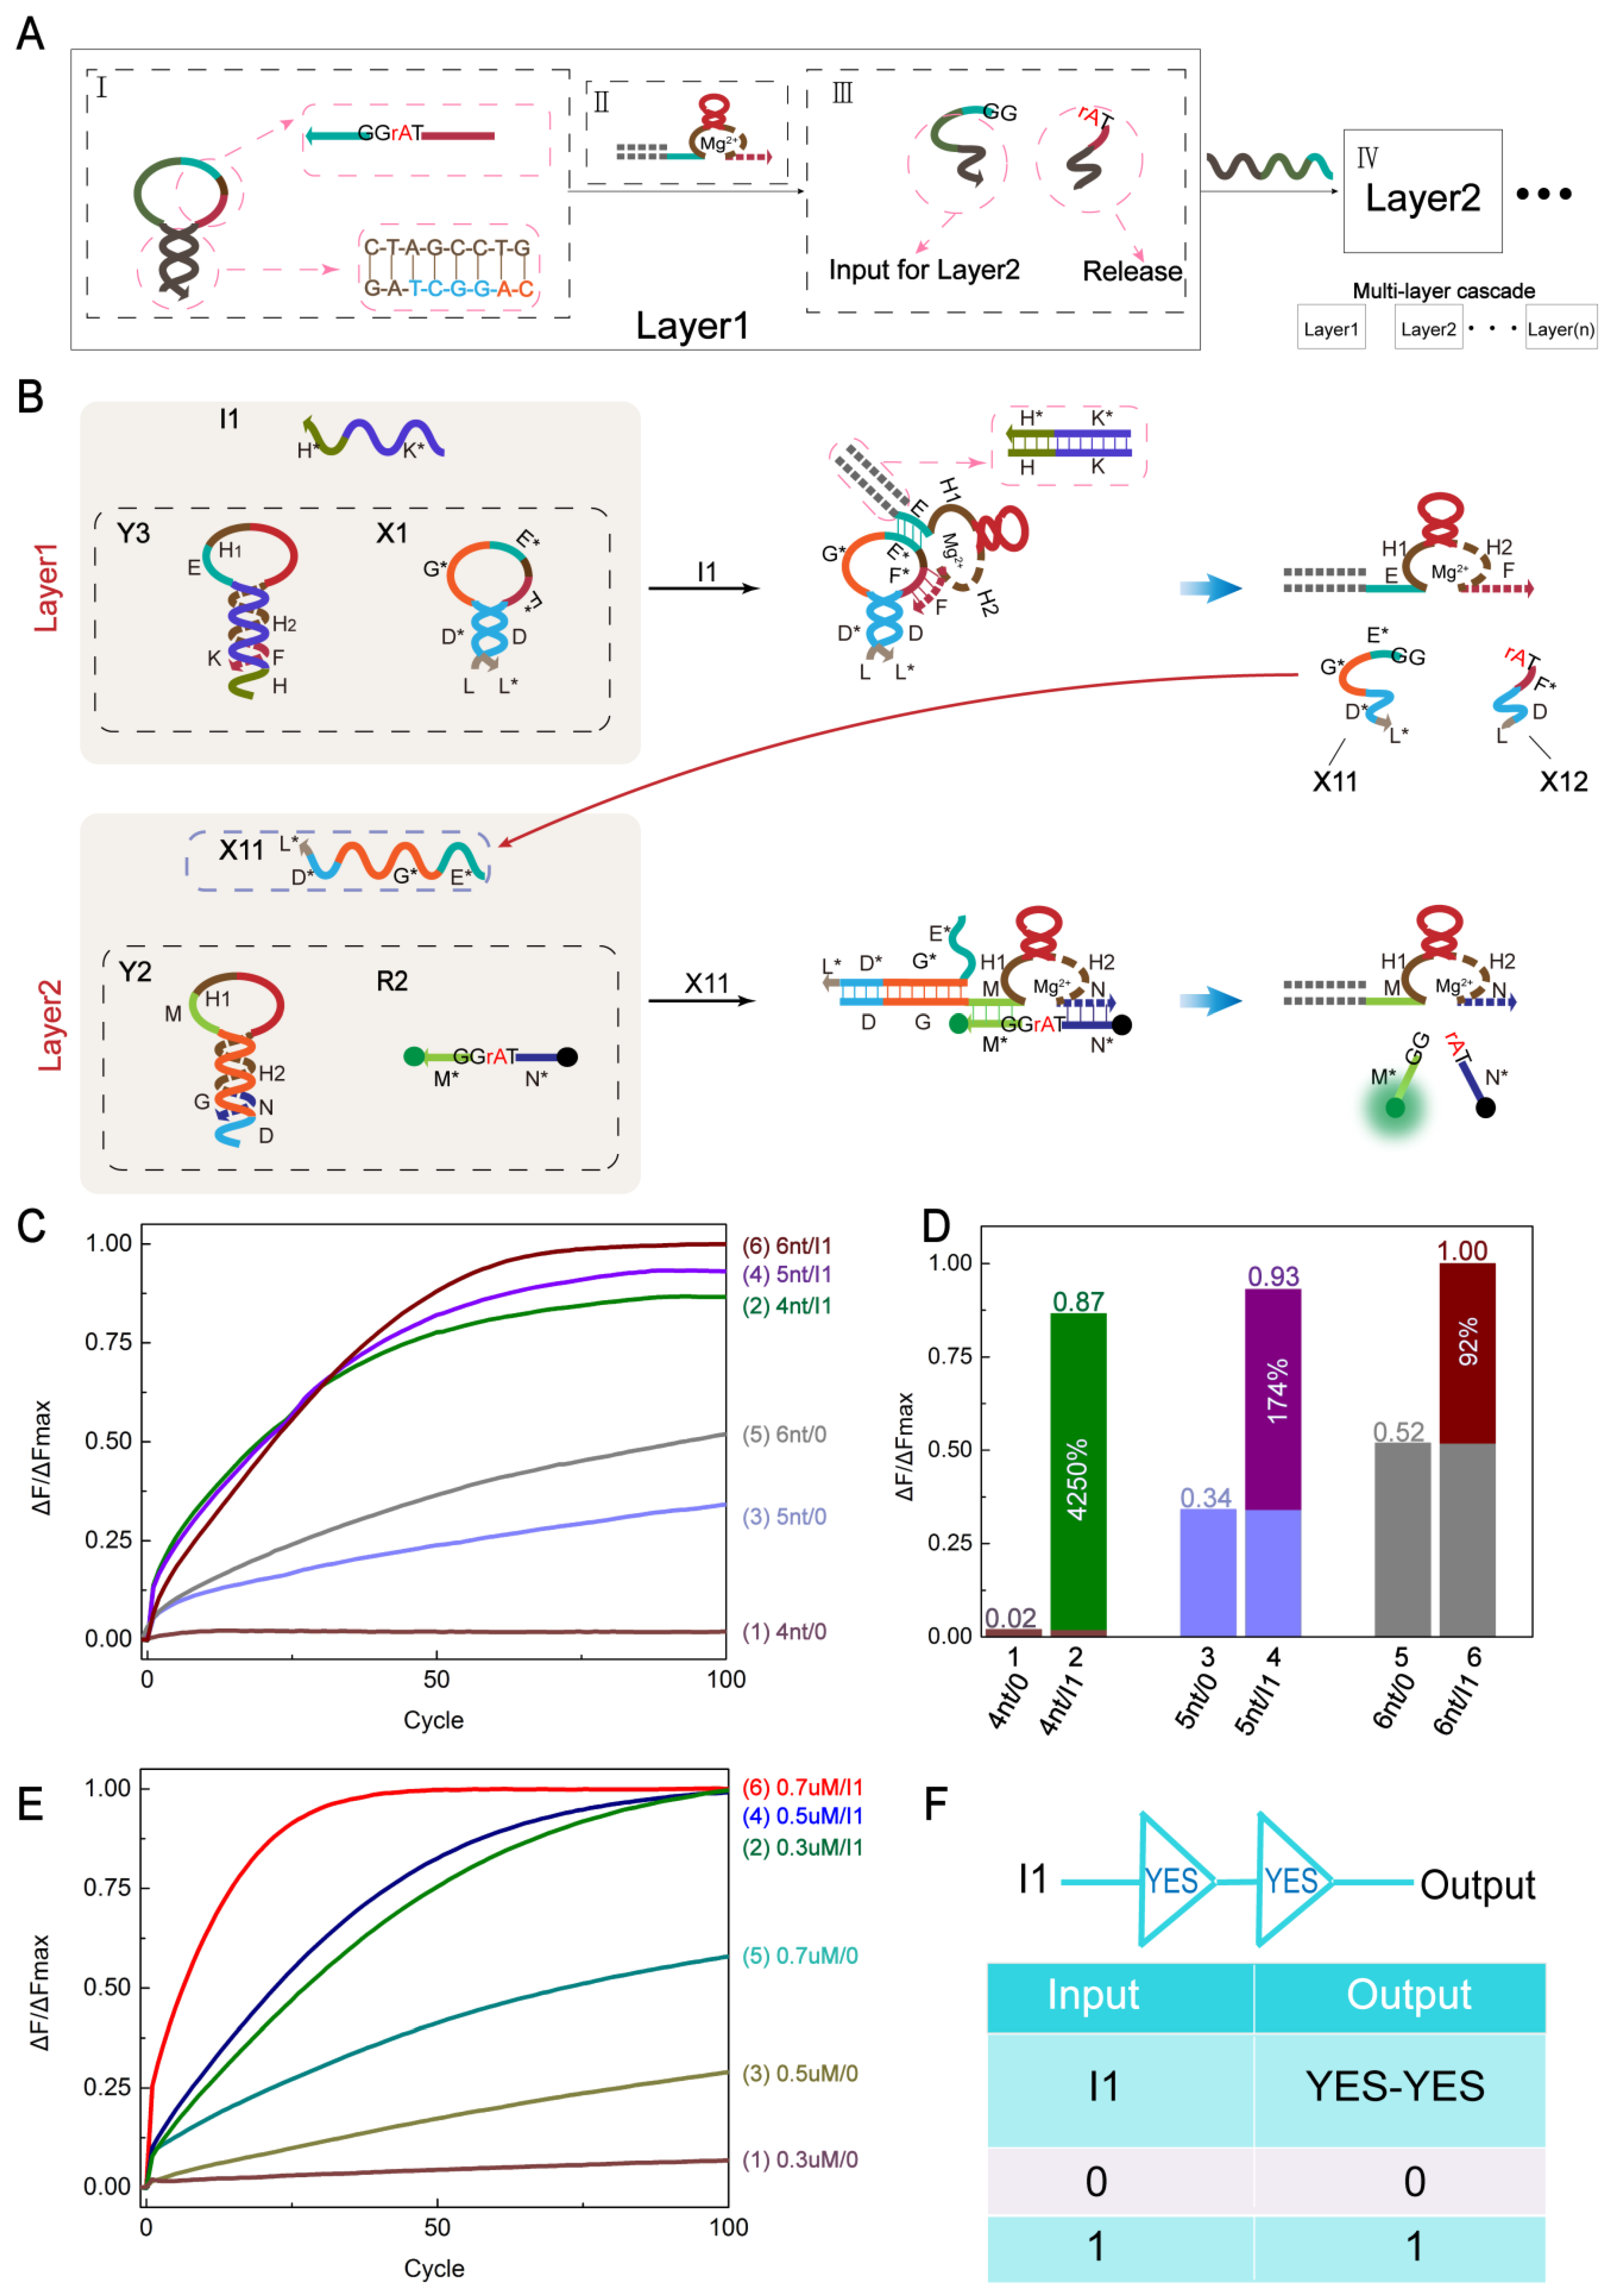
2.4. YES-YES Cascading Logic Circuit
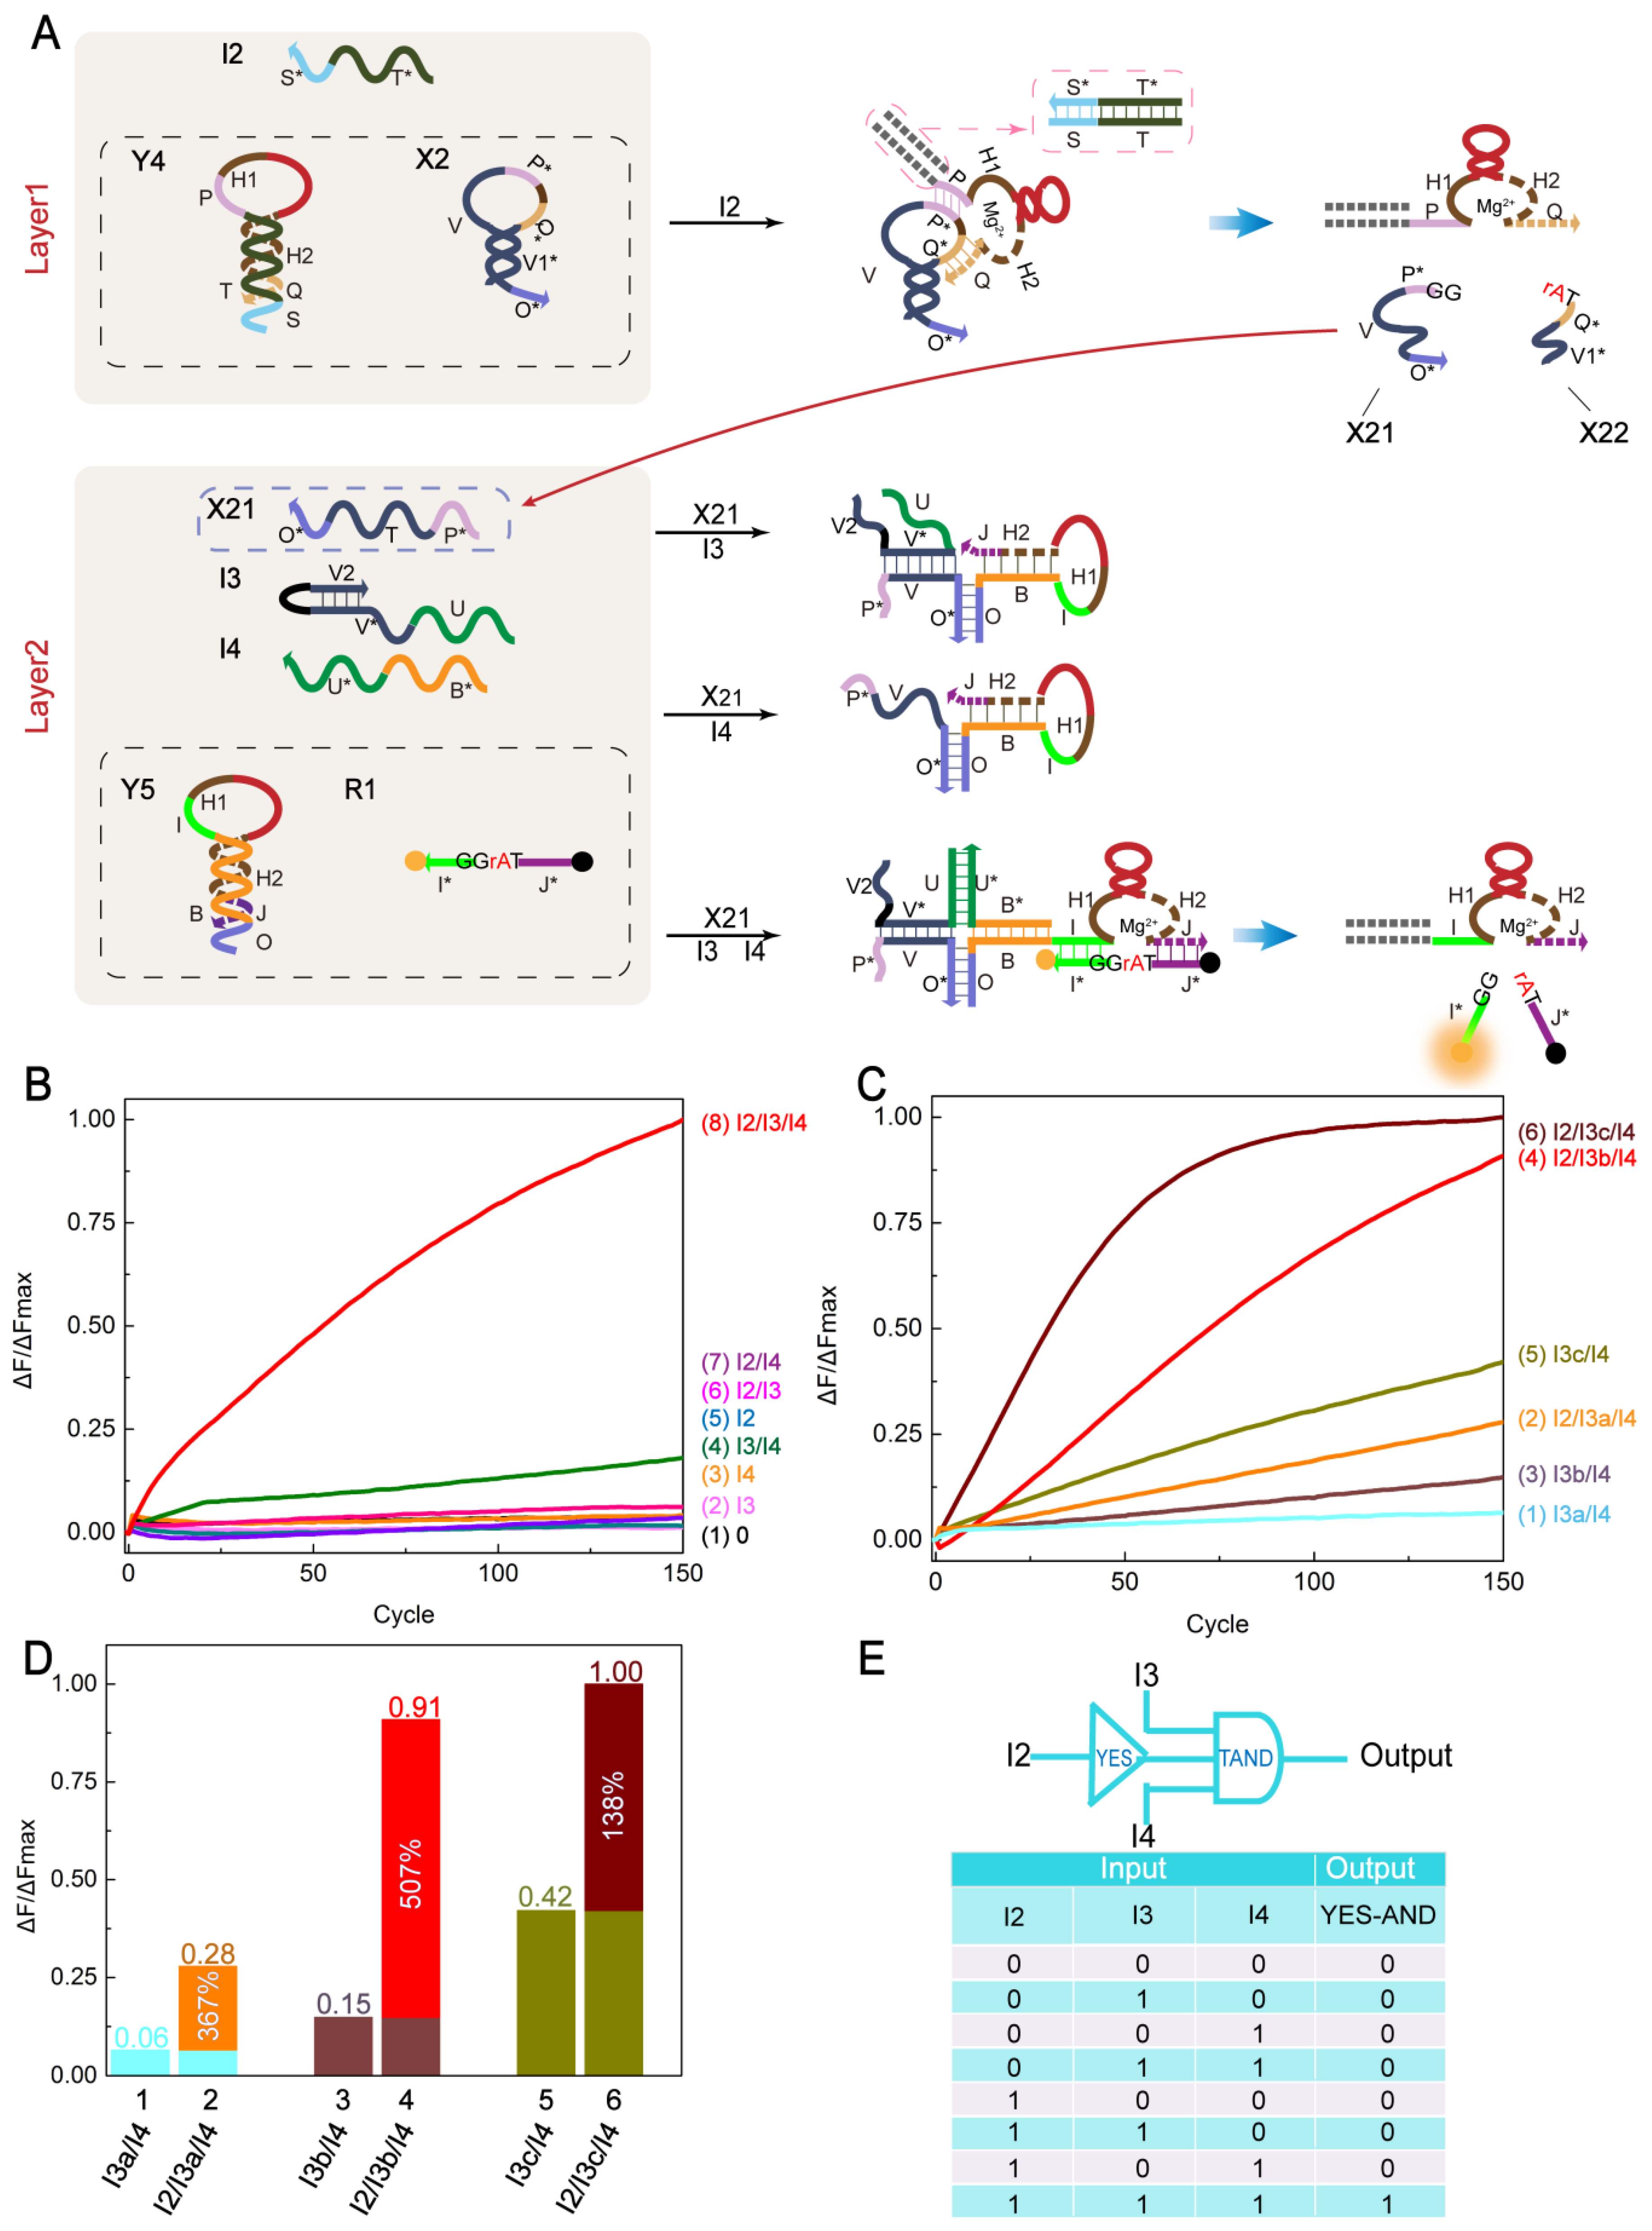
2.5. YES-TAND Cascading Logic Circuit
3. Materials and Methods
3.1. DNA Sequences and Design
3.2. Preparation of Buffer Conditions
3.3. Native Polyacrylamide Gel Electrophoresis
3.4. Fluorescence Normalization
4. Conclusions
Supplementary Materials
Author Contributions
Funding
Conflicts of Interest
References
- Ang, Y.S.; Tong, R.; Yung, L.-Y.L. Engineering a robust DNA split proximity circuit with minimized circuit leakage. Nucleic Acids Res. 2016, 44, e121. [Google Scholar] [CrossRef] [PubMed]
- Song, T.; Zheng, P.; Wong, M.D.; Wang, X. Design of logic gates using spiking neural P systems with homogeneous neurons and astrocytes-like control. Inf. Sci. 2016, 372, 380–391. [Google Scholar] [CrossRef]
- Du, Y.; Peng, P.; Li, T. DNA logic operations in living cells utilizing lysosome-recognizing framework nucleic acid nanodevices for subcellular imaging. ACS Nano 2019, 13, 5778–5784. [Google Scholar] [CrossRef] [PubMed]
- Kawano, R. Synthetic ion channels and DNA logic gates as components of molecular robots. ChemPhysChem 2018, 19, 359–366. [Google Scholar] [CrossRef] [PubMed]
- Bone, S.M.; Lima, N.E.; Todd, A.V. DNAzyme switches for molecular computation and signal amplification. Biosens. Bioelectron. 2015, 70, 330–337. [Google Scholar] [CrossRef] [PubMed]
- Rossetti, M.; Porchetta, A. Allosterically regulated DNA-based switches: From design to bioanalytical applications. Anal. Chim. Acta 2018, 1012, 30–41. [Google Scholar] [CrossRef]
- Liu, M.; Zhang, Q.; Chang, D.; Gu, J.; Brennan, J.D.; Li, Y. A DNAzyme feedback amplification strategy for biosensing. Angew. Chem. Int. Ed. 2017, 56, 6142–6146. [Google Scholar] [CrossRef]
- Yue, S.; Song, X.; Song, W.; Bi, S. An enzyme-free molecular catalytic device: Dynamically self-assembled DNA dendrimers for in situ imaging of microRNAs in live cells. Chem. Sci. 2019, 10, 1651–1658. [Google Scholar] [CrossRef]
- Li, F.; Lin, Y.; Lau, A.; Tang, Y.; Chen, J.; Le, X.C. Binding-induced molecular amplifier as a universal detection platform for biomolecules and biomolecular interaction. Anal. Chem. 2018, 90, 8651–8657. [Google Scholar] [CrossRef]
- Bhadra, S.; Ellington, A.D. Design and application of cotranscriptional non-enzymatic RNA circuits and signal transducers. Nucleic Acids Res. 2014, 42, e58. [Google Scholar] [CrossRef]
- Lilienthal, S.; Klein, M.; Orbach, R.; Willner, I.; Remacle, F.; Levine, R. Continuous variables logic via coupled automata using a DNAzyme cascade with feedback. Chem. Sci. 2017, 8, 2161–2168. [Google Scholar] [CrossRef] [PubMed]
- Joesaar, A.; Yang, S.; Bögels, B.; van der Linden, A.; Pieters, P.; Kumar, B.P.; Dalchau, N.; Phillips, A.; Mann, S.; de Greef, T.F. DNA-based communication in populations of synthetic protocells. Nat. Nanotechnol. 2019, 14, 369. [Google Scholar] [CrossRef]
- Lai, W.; Ren, L.; Tang, Q.; Qu, X.; Li, J.; Wang, L.; Li, L.; Fan, C.; Pei, H. Programming chemical reaction networks using intramolecular conformational motions of DNA. ACS Nano 2018, 12, 7093–7099. [Google Scholar] [CrossRef] [PubMed]
- Semenov, S.N.; Wong, A.S.; Van Der Made, R.M.; Postma, S.G.; Groen, J.; Van Roekel, H.W.; De Greef, T.F.; Huck, W.T. Rational design of functional and tunable oscillating enzymatic networks. Nat. Chem. 2015, 7, 160. [Google Scholar] [CrossRef] [PubMed]
- Wang, B.; Xie, Y.; Zhou, S.; Zheng, X.; Zhou, C. Correcting errors in image encryption based on DNA coding. Molecules 2018, 23, 1878. [Google Scholar] [CrossRef]
- Wang, B.; Zhang, Q.; Wei, X. Tabu variable neighborhood search for designing DNA barcodes. IEEE Trans. Nanobioscience 2019. [Google Scholar] [CrossRef]
- Dai, M.; Jungmann, R.; Yin, P. Optical imaging of individual biomolecules in densely packed clusters. Nat. Nanotechnol. 2016, 11, 798. [Google Scholar] [CrossRef]
- Poje, J.E.; Kastratovic, T.; Macdonald, A.R.; Guillermo, A.C.; Troetti, S.E.; Jabado, O.J.; Fanning, M.L.; Stefanovic, D.; Macdonald, J. Visual displays that directly interface and provide read-outs of molecular states via molecular graphics processing units. Angew. Chem. Int. Ed. 2014, 53, 9222–9225. [Google Scholar] [CrossRef]
- Song, T.; Pang, S.; Hao, S.; Rodríguez-Patón, A.; Zheng, P. A parallel image skeletonizing method using spiking neural P systems with weights. Neural Process. Lett. 2019, 50, 1485–1502. [Google Scholar] [CrossRef]
- Xia, N.; Feng, F.; Liu, C.; Li, R.; Xiang, W.; Shi, H.; Gao, L. The detection of mercury ion using DNA as sensors based on fluorescence resonance energy transfer. Talanta 2019, 192, 500–507. [Google Scholar] [CrossRef]
- Pohanka, M. Overview of piezoelectric biosensors, immunosensors and DNA sensors and their applications. Materials 2018, 11, 448. [Google Scholar] [CrossRef] [PubMed]
- Rasheed, P.A.; Sandhyarani, N. Electrochemical DNA sensors based on the use of gold nanoparticles: A review on recent developments. Microchim. Acta 2017, 184, 981–1000. [Google Scholar] [CrossRef]
- Diner, B.A.; Lum, K.K.; Cristea, I.M. The emerging role of nuclear viral DNA sensors. J. Biol. Chem. 2015, 290, 26412–26421. [Google Scholar] [CrossRef] [PubMed]
- Pardatscher, G.; Schwarz-Schilling, M.; Daube, S.S.; Bar-Ziv, R.H.; Simmel, F.C. Gene expression on DNA biochips patterned with strand-displacement lithography. Angew. Chem. Int. Ed. 2018, 57, 4783–4786. [Google Scholar] [CrossRef]
- Li, J.; Zheng, C.; Cansiz, S.; Wu, C.; Xu, J.; Cui, C.; Liu, Y.; Hou, W.; Wang, Y.; Zhang, L. Self-assembly of DNA nanohydrogels with controllable size and stimuli-responsive property for targeted gene regulation therapy. J. Am. Chem. Soc. 2015, 137, 1412–1415. [Google Scholar] [CrossRef]
- Vijayakumar, P.; Macdonald, J. A DNA logic gate automaton for detection of rabies and other lyssaviruses. ChemPhysChem 2017, 18, 1735–1741. [Google Scholar] [CrossRef]
- Liu, M.; Cheng, J.; Tee, S.R.; Sreelatha, S.; Loh, I.Y.; Wang, Z. Biomimetic autonomous enzymatic nanowalker of high fuel efficiency. ACS Nano 2016, 10, 5882–5890. [Google Scholar] [CrossRef]
- Thubagere, A.J.; Li, W.; Johnson, R.F.; Chen, Z.; Doroudi, S.; Lee, Y.L.; Izatt, G.; Wittman, S.; Srinivas, N.; Woods, D. A cargo-sorting DNA robot. Science 2017, 357, eaan6558. [Google Scholar] [CrossRef]
- Chen, R.P.; Blackstock, D.; Sun, Q.; Chen, W. Dynamic protein assembly by programmable DNA strand displacement. Nat. Chem. 2018, 10, 474. [Google Scholar] [CrossRef]
- Chinnappan, R.; Mohammed, R.; Yaqinuddin, A.; Abu-Salah, K.; Zourob, M. Highly sensitive multiplex detection of microRNA by competitive DNA strand displacement fluorescence assay. Talanta 2019, 200, 487–493. [Google Scholar] [CrossRef]
- Zhang, C.; Yang, J.; Jiang, S.; Liu, Y.; Yan, H. DNAzyme-based logic gate-mediated DNA self-assembly. Nano Lett. 2015, 16, 736–741. [Google Scholar] [CrossRef] [PubMed]
- Padilla, J.E.; Sha, R.; Kristiansen, M.; Chen, J.; Jonoska, N.; Seeman, N.C. A signal-passing DNA-strand-exchange mechanism for active self-assembly of DNA nanostructures. Angew. Chem. Int. Ed. 2015, 54, 5939–5942. [Google Scholar] [CrossRef] [PubMed]
- Pan, L.; Wang, Z.; Li, Y.; Xu, F.; Zhang, Q.; Zhang, C. Nicking enzyme-controlled toehold regulation for DNA logic circuits. Nanoscale 2017, 9, 18223–18228. [Google Scholar] [CrossRef] [PubMed]
- Balaceanu, A.; Pérez, A.; Dans, P.D.; Orozco, M. Allosterism and signal transfer in DNA. Nucleic Acids Res. 2018, 46, 7554–7565. [Google Scholar] [CrossRef]
- Zhao, Y.; Liu, Y.; Zheng, X.; Wang, B.; Lv, H.; Zhou, S.; Zhang, Q.; Wei, X. Half adder and half subtractor logic gates based on nicking enzymes. Mol. Syst. Des. Eng. 2019. [Google Scholar] [CrossRef]
- Hollenstein, M. DNA catalysis: The chemical repertoire of DNAzymes. Molecules 2015, 20, 20777–20804. [Google Scholar] [CrossRef]
- Peng, H.; Li, X.-F.; Zhang, H.; Le, X.C. A microRNA-initiated DNAzyme motor operating in living cells. Nat. Commun. 2017, 8, 14378. [Google Scholar] [CrossRef]
- Woolcock, K. Structure of a DNA enzyme. Nat. Struct. Mol. Biol. 2016, 23, 97. [Google Scholar] [CrossRef]
- Carter, J.; Fraser, M.J., Jr. DNAzyme-Nanoparticle Conjugates and Methods of Use Thereof. Google Patents No. 10/287,578, 14 May 2019. [Google Scholar]
- Zhang, C.; Shen, L.; Liang, C.; Dong, Y.; Yang, J.; Xu, J. DNA sequential logic gate using two-ring DNA. ACS Appl. Mater. Interfaces 2016, 8, 9370–9376. [Google Scholar] [CrossRef]
- Zhou, X.; Wu, L.; Pan, M.; Chen, Y.; Huang, H.; Zhang, X.; Wang, F. Construction of DNAzyme-based logic gates for amplified microRNA detection and cancer recognition. Analyst 2019. [Google Scholar] [CrossRef]
- Harding, B.I.; Pollak, N.M.; Stefanovic, D.; Macdonald, J. Repeated reuse of deoxyribozyme-based logic gates. Nano Lett. 2019. [Google Scholar] [CrossRef] [PubMed]
- Hun, X.; Meng, Y.; Wang, S.; Mei, Z.; Luo, X. Concatenated logic gates by amplified chemiluminescence of hemin/G-Quadruplex DNAzyme based on a nonlinear hybridization chain reaction. Sens. Actuators B Chem. 2017, 246, 734–739. [Google Scholar] [CrossRef]
- Li, W.; Zhang, F.; Yan, H.; Liu, Y. DNA based arithmetic function: A half adder based on DNA strand displacement. Nanoscale 2016, 8, 3775–3784. [Google Scholar] [CrossRef] [PubMed]
- Elbaz, J.; Lioubashevski, O.; Wang, F.; Remacle, F.; Levine, R.D.; Willner, I. DNA computing circuits using libraries of DNAzyme subunits. Nat. Nanotechnol. 2010, 5, 417. [Google Scholar] [CrossRef] [PubMed]
- Orbach, R.; Wang, F.; Lioubashevski, O.; Levine, R.; Remacle, F.; Willner, I. A full-adder based on reconfigurable DNA-hairpin inputs and DNAzyme computing modules. Chem. Sci. 2014, 5, 3381–3387. [Google Scholar] [CrossRef]
- Orbach, R.; Remacle, F.; Levine, R.; Willner, I. DNAzyme-based 2:1 and 4:1 multiplexers and 1:2 demultiplexer. Chem. Sci. 2014, 5, 1074–1081. [Google Scholar] [CrossRef]
- Petersen, P.; Tikhomirov, G.; Qian, L. Author correction: Information-based autonomous reconfiguration in systems of interacting DNA nanostructures. Nat. Commun. 2019, 10, 462. [Google Scholar] [CrossRef]
- Song, W.; Zhu, Z.; Mao, Y.; Zhang, S. A sensitive quartz crystal microbalance assay of adenosine triphosphate via DNAzyme-activated and aptamer-based target-triggering circular amplification. Biosens. Bioelectron. 2014, 53, 288–294. [Google Scholar] [CrossRef]
- Yang, J.; Wu, R.; Li, Y.; Wang, Z.; Pan, L.; Zhang, Q.; Lu, Z.; Zhang, C. Entropy-driven DNA logic circuits regulated by DNAzyme. Nucleic Acids Res. 2018, 46, 8532–8541. [Google Scholar] [CrossRef]
- Orbach, R.; Willner, B.; Willner, I. Catalytic nucleic acids (DNAzymes) as functional units for logic gates and computing circuits: From basic principles to practical applications. Chem. Commun. 2015, 51, 4144–4160. [Google Scholar] [CrossRef]
- Zhou, W.; Liu, J. Multi-metal-dependent nucleic acid enzymes. Metallomics 2018, 10, 30–48. [Google Scholar] [CrossRef] [PubMed]
- Freage, L.; Trifonov, A.; Tel-Vered, R.; Golub, E.; Wang, F.; McCaskill, J.S.; Willner, I. Addressing, amplifying and switching DNAzyme functions by electrochemically-triggered release of metal ions. Chem. Sci. 2015, 6, 3544–3549. [Google Scholar] [CrossRef] [PubMed]
- Zhou, W.; Zhang, Y.; Huang, P.-J.J.; Ding, J.; Liu, J. A DNAzyme requiring two different metal ions at two distinct sites. Nucleic Acids Res. 2015, 44, 354–363. [Google Scholar] [CrossRef] [PubMed]
- Shomali, Z.; Kompany-Zareh, M.; Omidikia, N. Fluorescence based investigation of temperature-dependent Pb2+-specific 8–17E DNAzyme catalytic sensor. J. Fluoresc. 2019, 29, 335–342. [Google Scholar] [CrossRef]
- Deng, R.; Yang, H.; Dong, Y.; Zhao, Z.; Xia, X.; Li, Y.; Li, J. Temperature-robust DNAzyme biosensors confirming ultralow background detection. ACS Sens. 2018, 3, 2660–2666. [Google Scholar] [CrossRef]
- Tang, D.; Xia, B.; Tang, Y.; Zhang, J.; Zhou, Q. Metal-ion-induced DNAzyme on magnetic beads for detection of lead (II) by using rolling circle amplification, glucose oxidase, and readout of pH changes. Microchim. Acta 2019, 186, 318. [Google Scholar] [CrossRef]
- Cepeda-Plaza, M.; McGhee, C.E.; Lu, Y. Evidence of a general acid–base catalysis mechanism in the 8–17 DNAzyme. Biochemistry 2018, 57, 1517–1522. [Google Scholar] [CrossRef]
- Zheng, X.; Yang, J.; Zhou, C.; Zhang, C.; Zhang, Q.; Wei, X. Allosteric DNAzyme-based DNA logic circuit: Operations and dynamic analysis. Nucleic Acids Res. 2018, 47, 1097–1109. [Google Scholar] [CrossRef]
- Ren, R.; Yang, J.; Yuan, R.; Xiang, Y. Label-free and amplified electrochemical detection of single nucleotide polymorphism in folded nucleic acid secondary structures. J. Electrochem. Soc. 2018, 165, B880–B884. [Google Scholar] [CrossRef]
Sample Availability: Samples of the compounds are available from the authors. |


© 2019 by the authors. Licensee MDPI, Basel, Switzerland. This article is an open access article distributed under the terms and conditions of the Creative Commons Attribution (CC BY) license (http://creativecommons.org/licenses/by/4.0/).
Share and Cite
Yang, F.; Liu, Y.; Wang, B.; Zhou, C.; Zhang, Q. Constructing Controllable Logic Circuits Based on DNAzyme Activity. Molecules 2019, 24, 4134. https://doi.org/10.3390/molecules24224134
Yang F, Liu Y, Wang B, Zhou C, Zhang Q. Constructing Controllable Logic Circuits Based on DNAzyme Activity. Molecules. 2019; 24(22):4134. https://doi.org/10.3390/molecules24224134
Chicago/Turabian StyleYang, Fengjie, Yuan Liu, Bin Wang, Changjun Zhou, and Qiang Zhang. 2019. "Constructing Controllable Logic Circuits Based on DNAzyme Activity" Molecules 24, no. 22: 4134. https://doi.org/10.3390/molecules24224134
APA StyleYang, F., Liu, Y., Wang, B., Zhou, C., & Zhang, Q. (2019). Constructing Controllable Logic Circuits Based on DNAzyme Activity. Molecules, 24(22), 4134. https://doi.org/10.3390/molecules24224134