
Qualitative and Quantitative Analysis of Lignan Constituents in Caulis Trachelospermi by HPLC-QTOF-MS and HPLC-UV

Abstract
:
1. Introduction
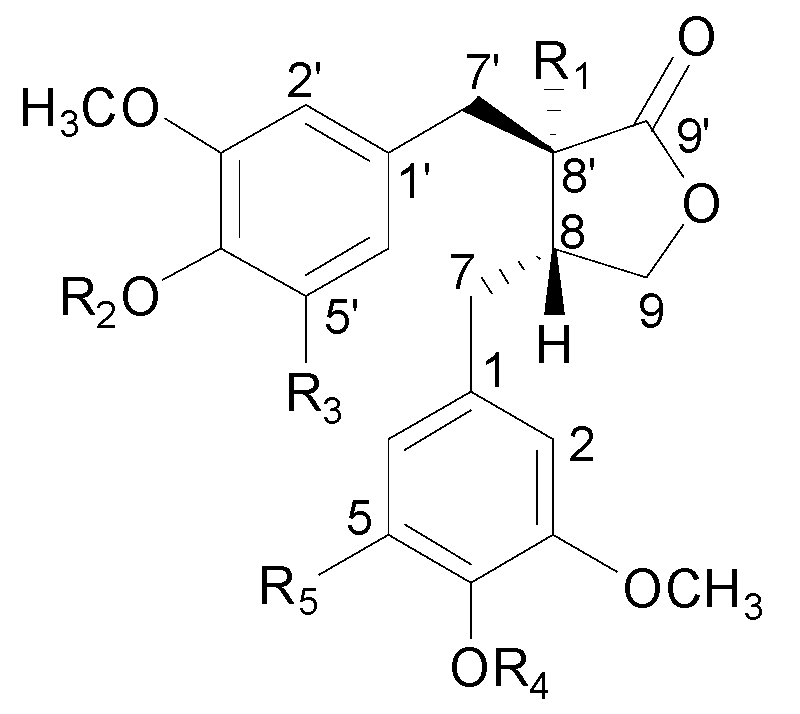
| No. | Compound Name | R1 | R2 | R3 | R4 | R5 |
|---|---|---|---|---|---|---|
| 1 | nortrachelogenin 5'-C-β-d-glucoside | OH | H | Glc | H | H |
| 2 | nortracheloside | OH | Glc | H | H | H |
| 3 | nortrachelogenin 8'-O-β-d-glucoside | O-Glc | H | H | H | H |
| 4 | matairesinol 4'-O-β-gentiobioside | H | Glc 6-1Glc | H | H | H |
| 5 | trachelogenin 4'-O-β-gentiobioside | OH | Glc 6-1Glc | H | CH3 | H |
| 6 | matairesinoside | H | Glc | H | H | H |
| 7 | tracheloside | OH | Glc | H | CH3 | H |
| 8 | arctigenin 4'-O-β-gentiobioside | H | Glc 6-1Glc | H | CH3 | H |
| 9 | nortrachelogenin | OH | H | H | H | H |
| 10 | arctiin | H | Glc | H | CH3 | H |
| 11 | matairesinol | H | H | H | H | H |
| 12 | trachelogenin | OH | H | H | CH3 | H |
| 13 | 5-methoxytrachelogenin | OH | H | H | CH3 | OCH3 |
| 14 | arctigenin | H | H | H | CH3 | H |
| 18 | nortrachelogenin 4,4'-di-O-β-d-glucoside | OH | Glc | H | Glc | H |
| 19 | matairesinol 4,4'-di-O-β-d-glucoside | H | Glc | H | Glc | H |
| 20 | nortrachelogenin 4'-O-β-gentiobioside | OH | Glc 6-1Glc | H | H | H |
| 21 | nortrachelogenin 4-O-β-d-glucoside | OH | H | H | Glc | H |
| 22 | 4-demethyltraxillaside | H | Glc | H | H | OCH3 |
| 24 | traxillageside | H | Glc | H | OCH3 | OCH3 |
2. Results and Discussion
2.1. Quantitative Analysis of Dibenzylbutyrolatone Lignans
2.1.1. Validation of the Developed Method

| Compound | Regression Equation b | R2 | Range (ng) | LOD (ng) | LOQ (ng) | Intra-day (RSD%, n = 6) | Inter-day (RSD%, n = 6) |
|---|---|---|---|---|---|---|---|
| 1 a | y = 0.9845x − 3.0467 | 1.0000 | 36.18–1266.30 | 4.27 | 8.54 | 0.33 | 1.70 |
| 2 | y = 1.2843x − 12.4895 | 1.0000 | 91.80–3213.00 | 9.00 | 18.01 | 0.44 | 0.15 |
| 3 | y = 1.0255x− 11.8232 | 0.9999 | 39.03–1366.05 | 8.37 | 18.30 | 0.42 | 0.41 |
| 4 | y = 0.8371x − 4.3034 | 1.0000 | 46.29–1620.15 | 4.99 | 14.97 | 0.33 | 0.26 |
| 5 | y = 1.1938x − 4.7773 | 1.0000 | 86.31–3020.85 | 1.39 | 6.95 | 0.17 | 0.47 |
| 6 | y = 0.9789x − 15.6369 | 1.0000 | 91.60–3206.00 | 6.25 | 27.49 | 0.44 | 0.85 |
| 7 | y = 1.8986x + 12.2728 | 1.0000 | 280.56–9819.60 | 2.94 | 12.73 | 0.28 | 0.42 |
| 8 | y = 1.0888x − 3.4518 | 1.0000 | 107.38–3758.30 | 7.93 | 31.74 | 0.24 | 0.46 |
| 9 | y = 1.7141x − 29.0498 | 1.0000 | 61.05–2136.75 | 8.06 | 24.93 | 0.22 | 0.41 |
| 10 | y = 1.2220x − 1.4093 | 1.0000 | 86.40–3024.00 | 7.72 | 24.95 | 0.31 | 0.85 |
| 11 | y = 1.0257x − 24.0442 | 0.9997 | 49.50–1732.50 | 1.24 | 3.71 | 0.19 | 0.48 |
| 12 | y = 2.1915x − 41.1740 | 1.0000 | 125.20–4382.00 | 3.13 | 10.42 | 0.22 | 0.43 |
| 13 | y = 1.5909x − 0.0134 | 1.0000 | 12.35–432.25 | 4.06 | 13.95 | 0.17 | 2.87 |
| 14 | y = 1.7761x − 4.4637 | 0.9999 | 22.76–796.43 | 3.35 | 11.18 | 0.75 | 2.22 |
| Compound | RSD (%, n = 6) | Recovery (%, n = 6) | |||||
|---|---|---|---|---|---|---|---|
| Repeatability | Stability | Original (μg) | Spiked (μg) | Observed (μg) | Mean | RSD (%) | |
| 1 | 0.71 | 1.51 | 163.01 | 164.02 | 329.03 | 101.22 | 1.02 |
| 2 | 0.46 | 0.31 | 343.80 | 362.30 | 706.23 | 100.04 | 0.24 |
| 3 | 2.94 | 0.85 | 127.43 | 143.63 | 273.94 | 102.01 | 1.87 |
| 4 | 0.89 | 2.08 | 170.29 | 175.29 | 344.42 | 99.33 | 0.45 |
| 5 | 0.41 | 1.23 | 375.40 | 335.38 | 718.15 | 102.20 | 0.75 |
| 6 | 2.07 | 2.78 | 483.13 | 474.85 | 946.76 | 97.64 | 1.09 |
| 7 | 0.52 | 0.28 | 1325.26 | 1242.48 | 2542.17 | 97.94 | 0.34 |
| 8 | 0.70 | 1.19 | 224.28 | 257.71 | 478.29 | 98.56 | 0.38 |
| 9 | 0.90 | 1.03 | 198.16 | 234.43 | 429.08 | 98.51 | 0.17 |
| 10 | 0.76 | 2.21 | 421.27 | 421.63 | 858.20 | 103.63 | 0.39 |
| 11 | 1.47 | 0.80 | 292.02 | 277.20 | 575.80 | 102.37 | 0.30 |
| 12 | 1.12 | 0.26 | 439.82 | 420.67 | 859.56 | 99.78 | 0.27 |
| 13 | 2.70 | 1.14 | 15.88 | 20.75 | 36.93 | 101.43 | 0.71 |
| 14 | 1.98 | 1.00 | 89.00 | 87.38 | 174.48 | 96.68 | 0.48 |
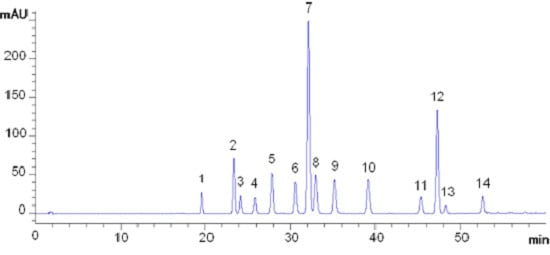
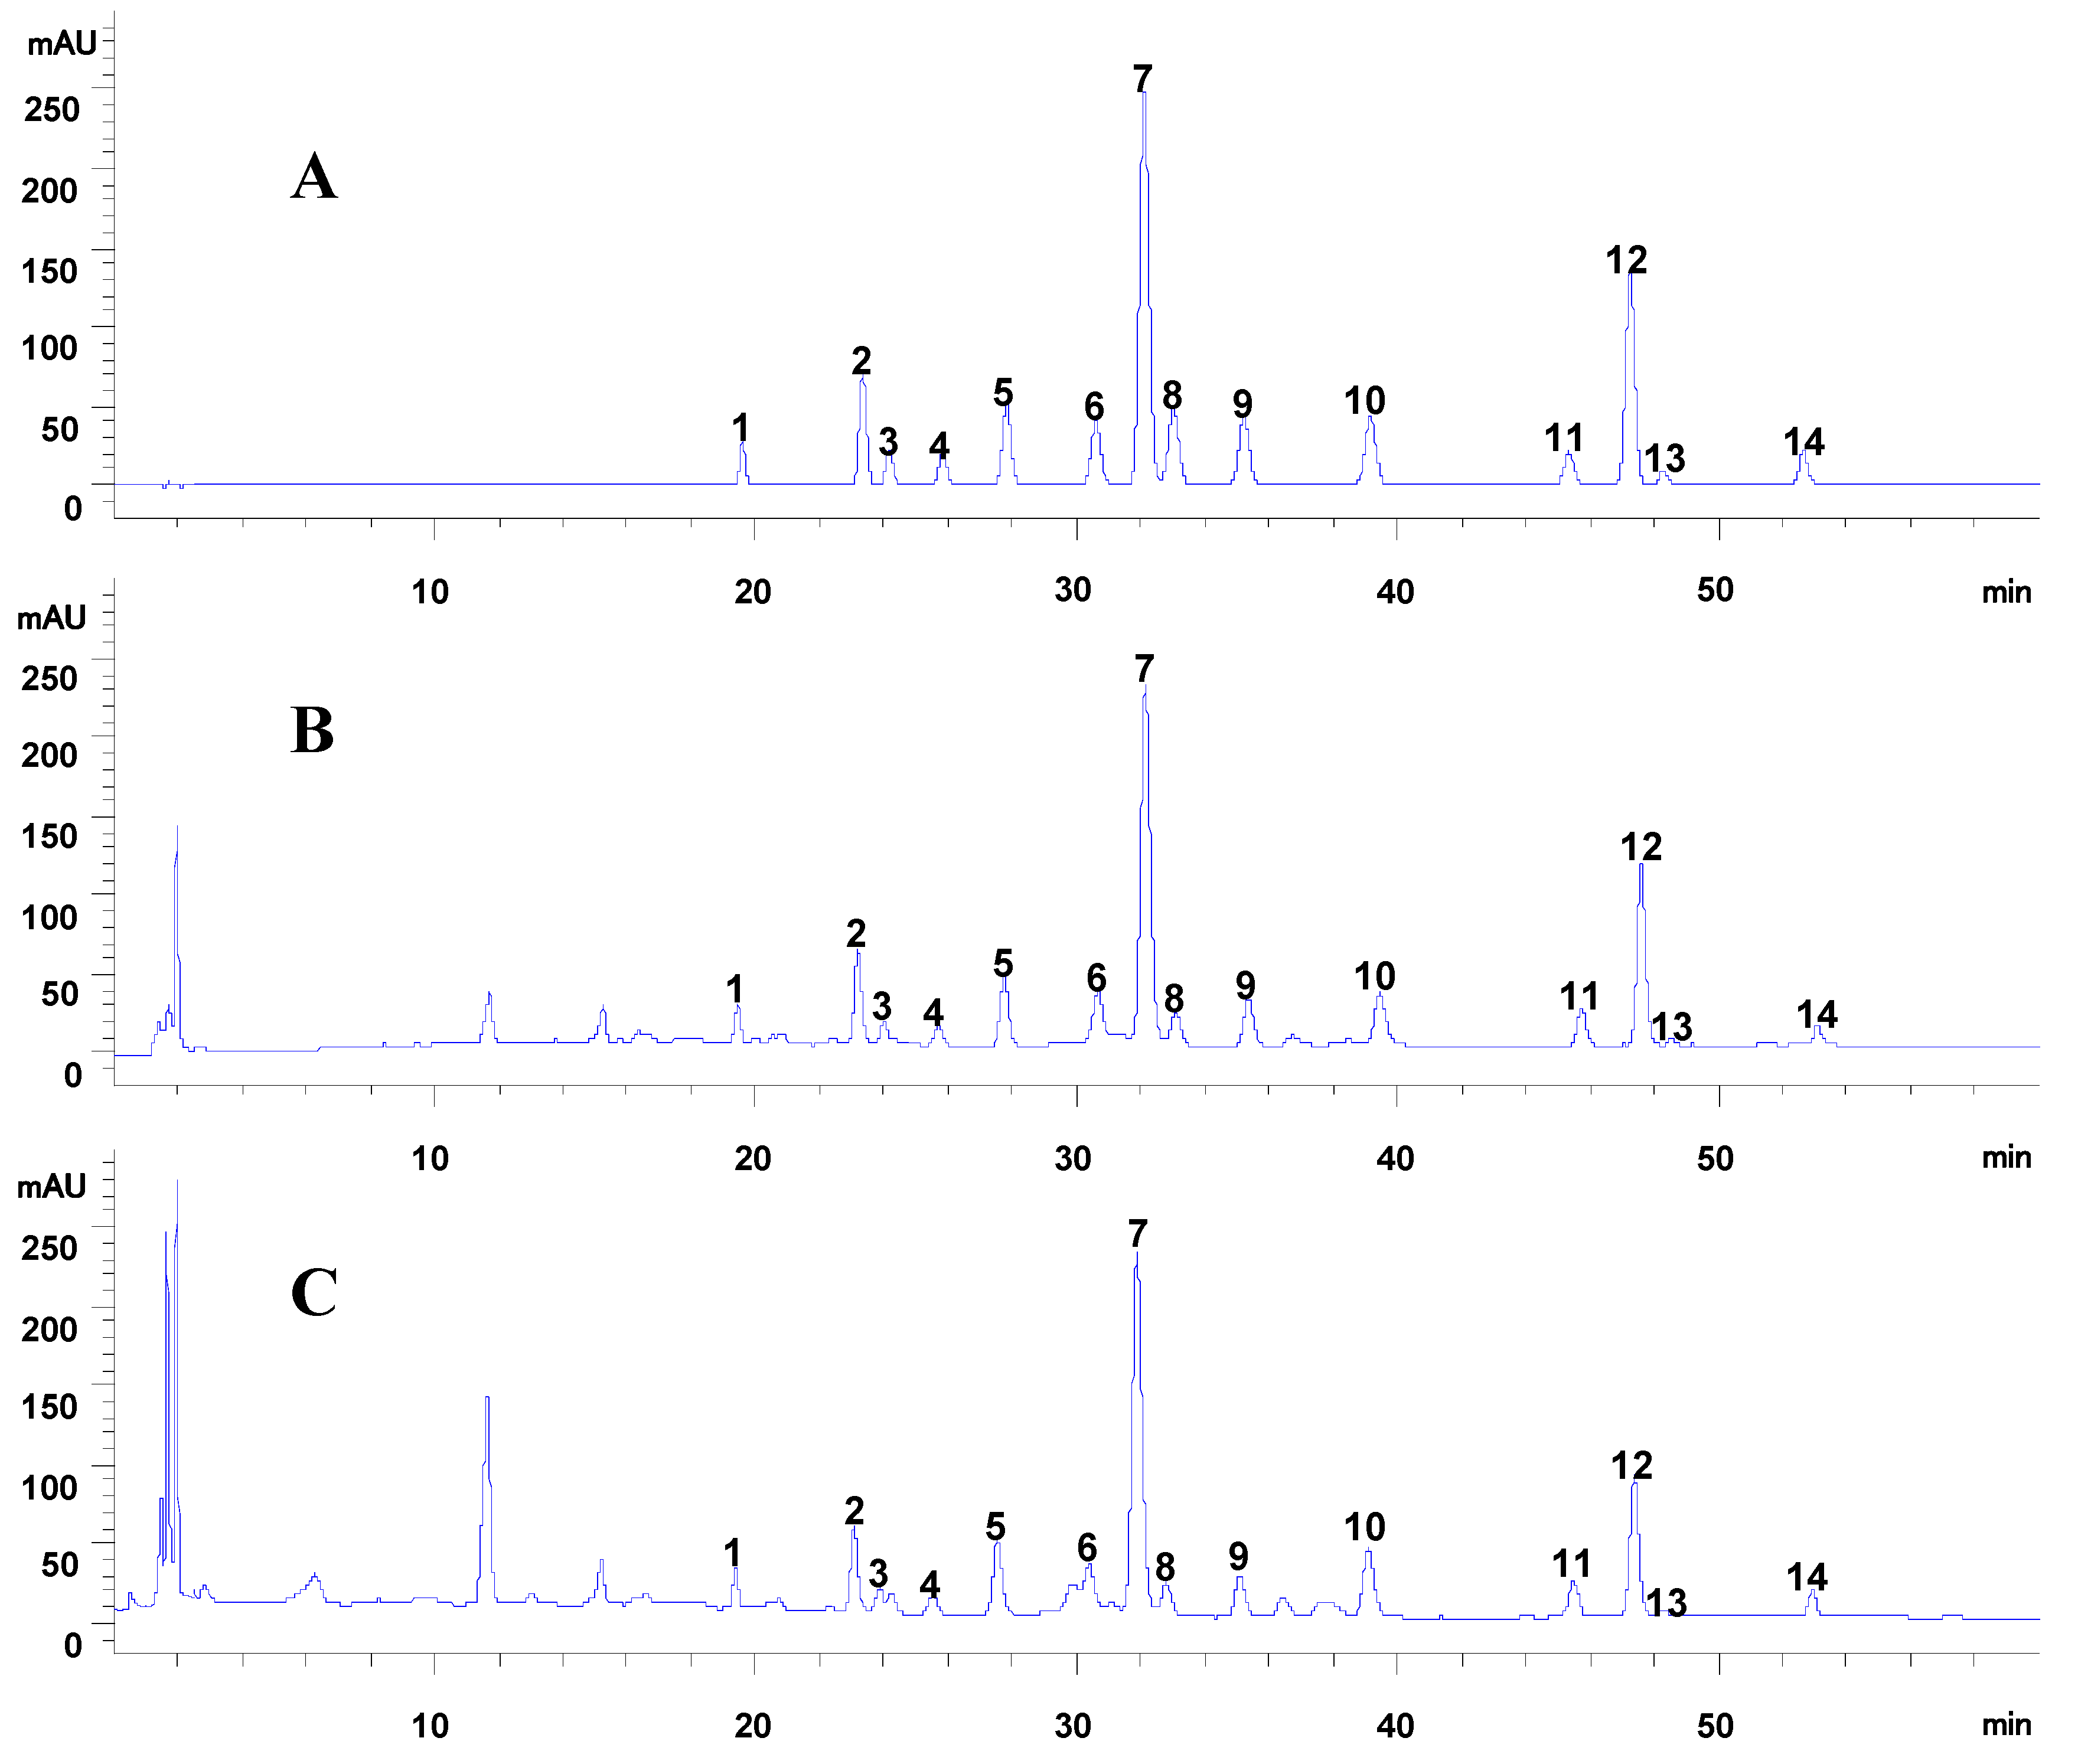
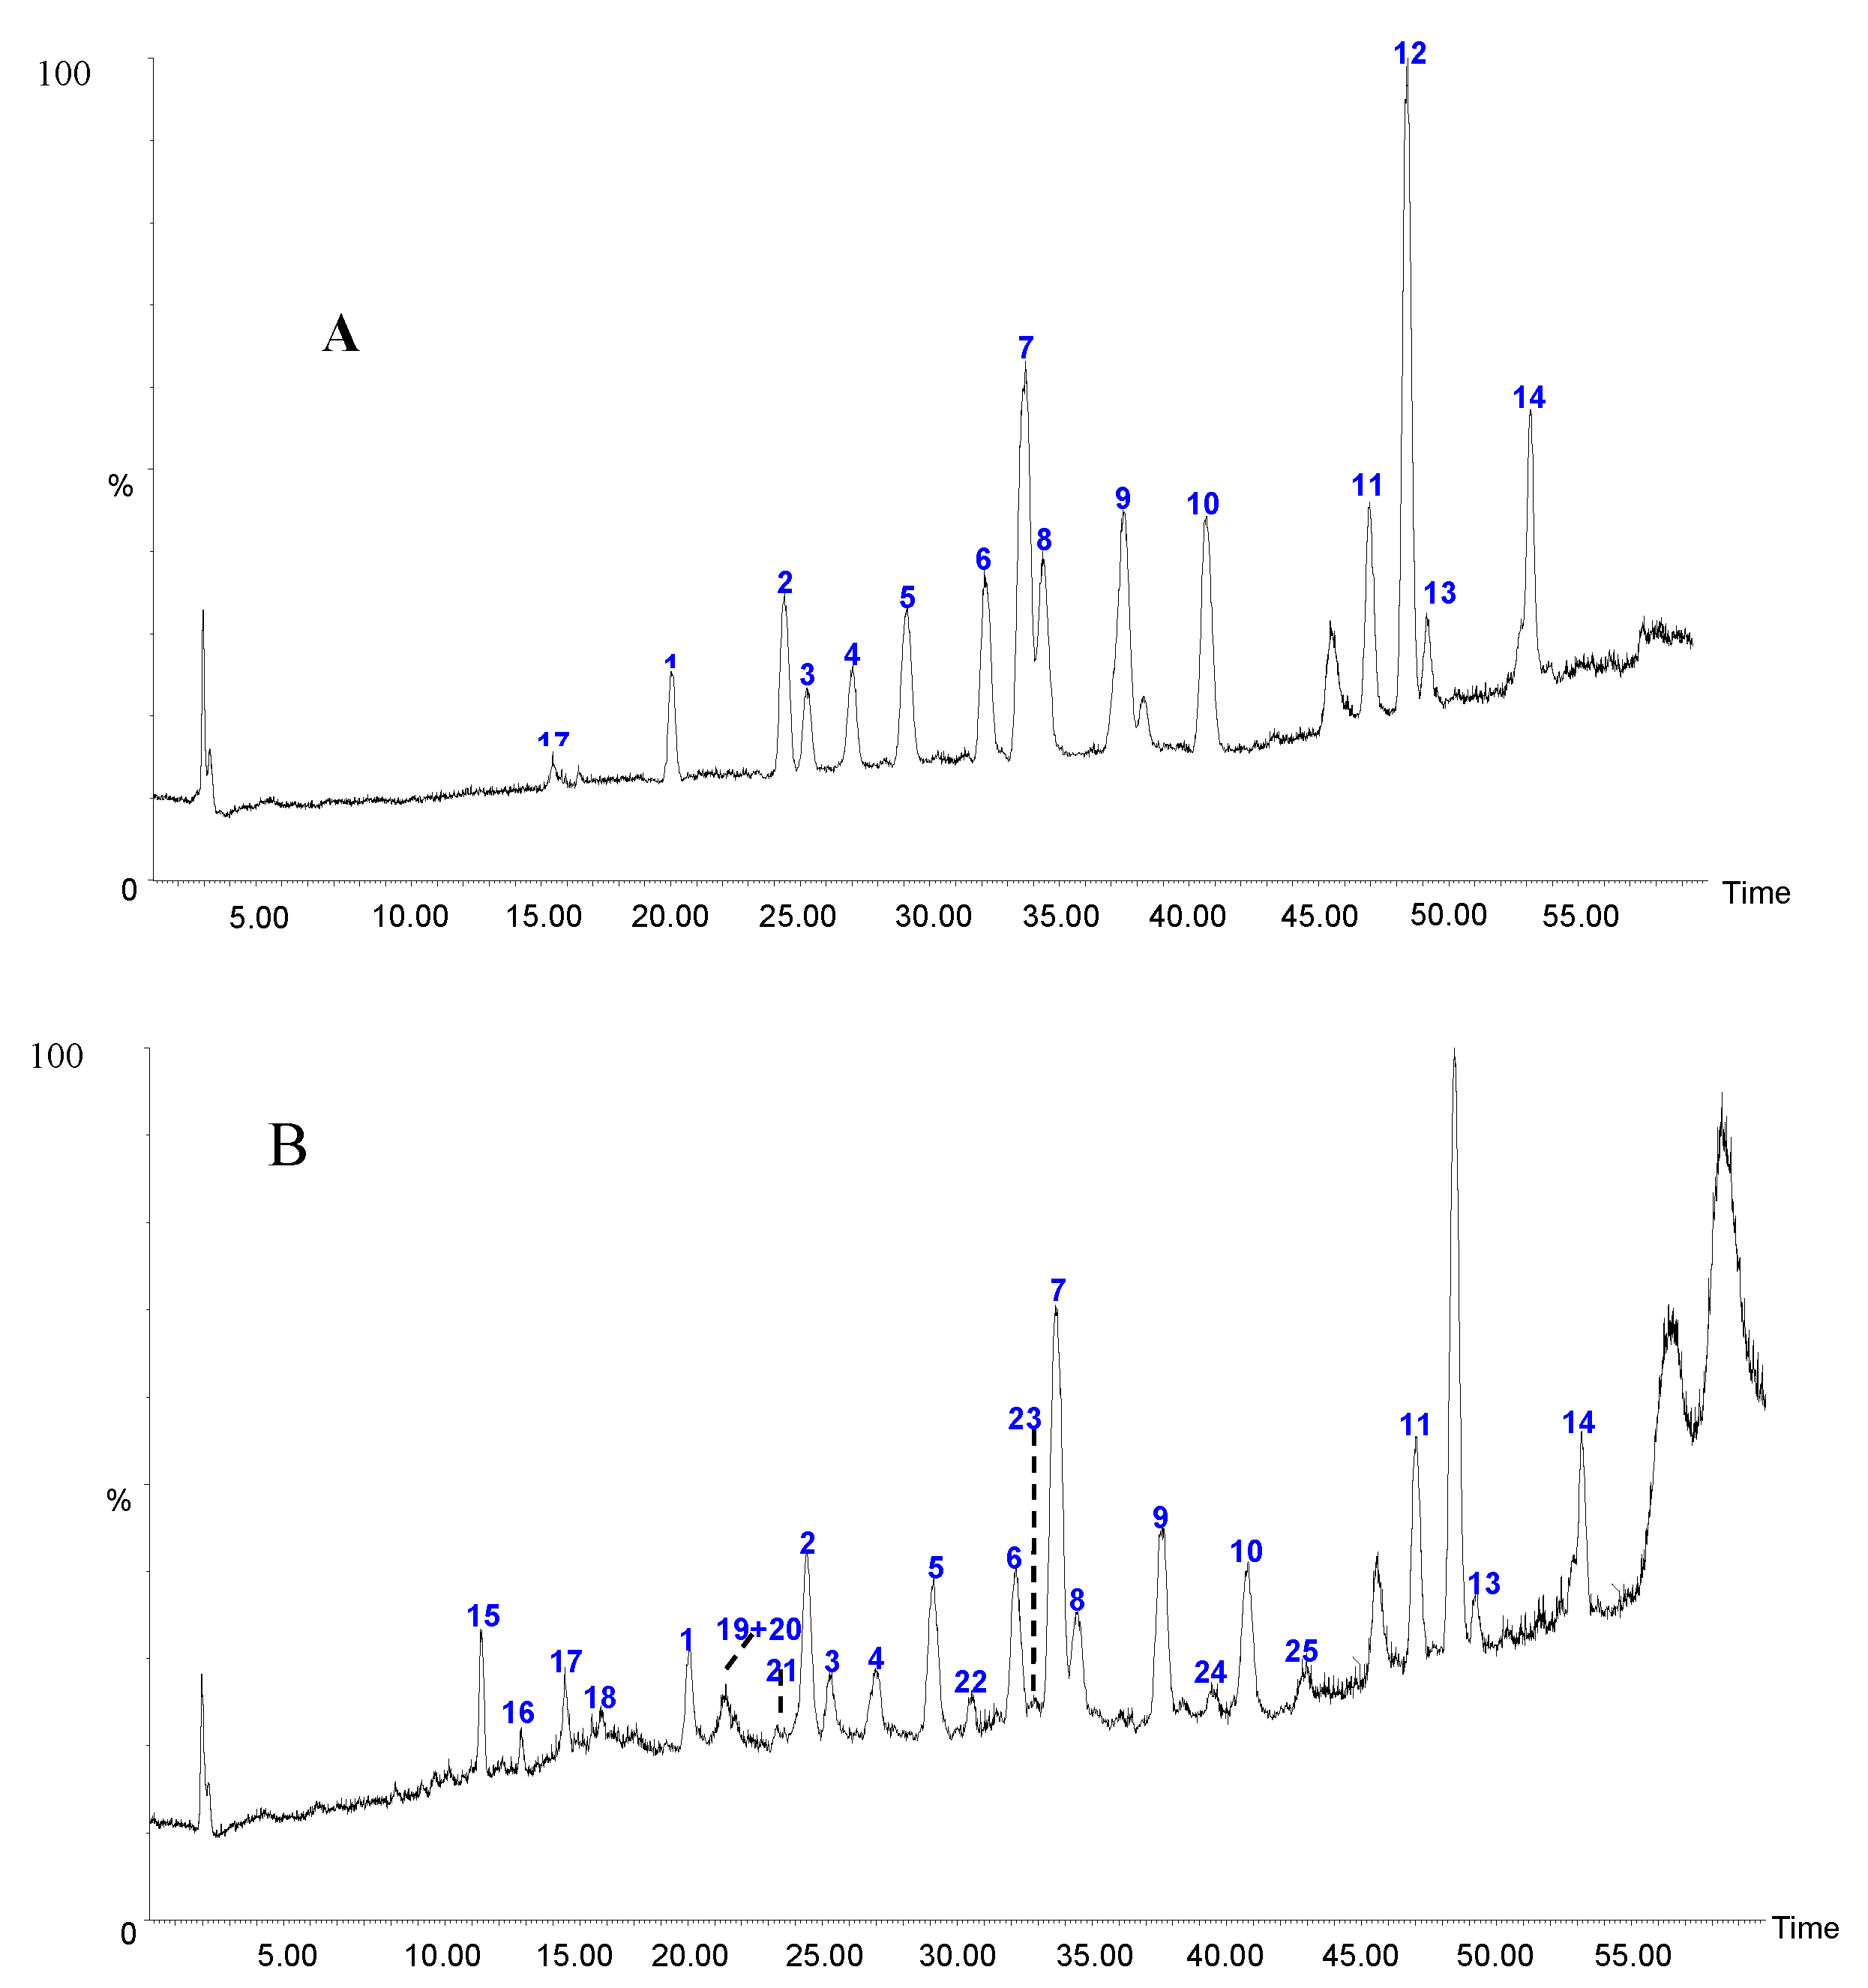
2.1.2. Sample Analysis

| Sample | 1 | 2 | 3 | 4 | 5 | 6 | 7 | 8 | 9 | 10 | 11 | 12 | 13 | 14 | Sum |
|---|---|---|---|---|---|---|---|---|---|---|---|---|---|---|---|
| Y2-1 | 0.785 | 1.706 | 0.667 | 0.758 | 1.949 | 2.121 | 6.602 | 1.130 | 0.932 | 2.184 | 1.388 | 2.041 | 0.092 | 0.405 | 22.761 |
| Y2–2 | 1.355 | 4.712 | 1.397 | 1.639 | 2.643 | 5.294 | 11.301 | 2.136 | 0.966 | 2.678 | 1.440 | 1.833 | 0.116 | 0.423 | 37.934 |
| Y2–3 | 1.068 | 3.394 | 2.013 | 1.757 | 1.533 | 5.627 | 7.218 | 1.808 | 0.313 | 3.166 | 0.584 | 0.917 | 0.048 | 0.348 | 29.795 |
| Y2–4 | 0.706 | 1.032 | 0.735 | 0.306 | 0.333 | 1.172 | 2.777 | 0.314 | 1.043 | 1.155 | 1.171 | 2.222 | 0.147 | 0.303 | 13.415 |
| Y2–5 | 0.989 | 2.491 | 1.113 | 0.540 | 1.327 | 2.408 | 8.054 | 1.040 | 1.517 | 2.579 | 1.498 | 3.505 | 0.159 | 0.484 | 27.703 |
| Y2–6 | 1.000 | 3.984 | 0.622 | 0.563 | 1.378 | 2.113 | 8.742 | 0.814 | 1.932 | 0.570 | 1.409 | 3.422 | 0.303 | 0.259 | 27.112 |
| Y2–7 | 1.402 | 3.601 | 1.427 | 1.585 | 2.748 | 4.234 | 10.339 | 1.769 | 1.116 | 2.047 | 1.554 | 2.255 | 0.161 | 0.413 | 34.650 |
| Y2–8 | 1.080 | 4.098 | 1.108 | 1.742 | 2.698 | 5.124 | 10.344 | 2.377 | 0.955 | 2.256 | 1.383 | 2.003 | 0.131 | 0.453 | 35.751 |
| Y2–9 | 0.676 | 1.029 | 0.862 | 0.616 | 1.314 | 1.829 | 4.505 | 0.805 | 1.381 | 1.839 | 2.251 | 4.168 | 0.210 | 0.664 | 22.148 |
| Y2–10 | 0.927 | 4.273 | 1.931 | 2.174 | 1.625 | 6.832 | 8.613 | 2.021 | 0.471 | 3.789 | 0.865 | 1.314 | 0.056 | 0.573 | 35.464 |
| Y2–11 | 0.805 | 3.544 | 1.234 | 1.105 | 1.414 | 3.796 | 7.718 | 1.280 | 1.262 | 1.878 | 0.847 | 1.534 | 0.099 | 0.442 | 26.958 |
| Y2–12 | 0.397 | 0.984 | 0.779 | 0.608 | 0.606 | 1.364 | 3.054 | 0.677 | 1.267 | 0.701 | 2.360 | 3.906 | 0.247 | 1.644 | 18.594 |
| Y2–13 | 0.827 | 2.164 | 1.239 | 1.070 | 1.498 | 2.774 | 7.275 | 1.045 | 2.546 | 1.484 | 3.102 | 5.335 | 0.348 | 0.900 | 31.607 |
| Y2–14 | 0.616 | 0.998 | 0.895 | 0.660 | 1.398 | 1.744 | 4.775 | 0.943 | 1.341 | 1.736 | 2.279 | 4.352 | 0.206 | 0.810 | 22.752 |
| Average | 0.902 | 2.715 | 1.145 | 1.080 | 1.605 | 3.317 | 7.237 | 1.297 | 1.217 | 2.004 | 1.581 | 2.772 | 0.166 | 0.580 | 28.531 |
| RSD (%) | 30.54 | 50.94 | 38.17 | 54.69 | 44.48 | 54.86 | 36.79 | 47.74 | 45.80 | 44.37 | 43.69 | 47.92 | 53.41 | 61.54 | 26.20 |
2.2. Qualitative Analysis of Caulis Trachelospermi
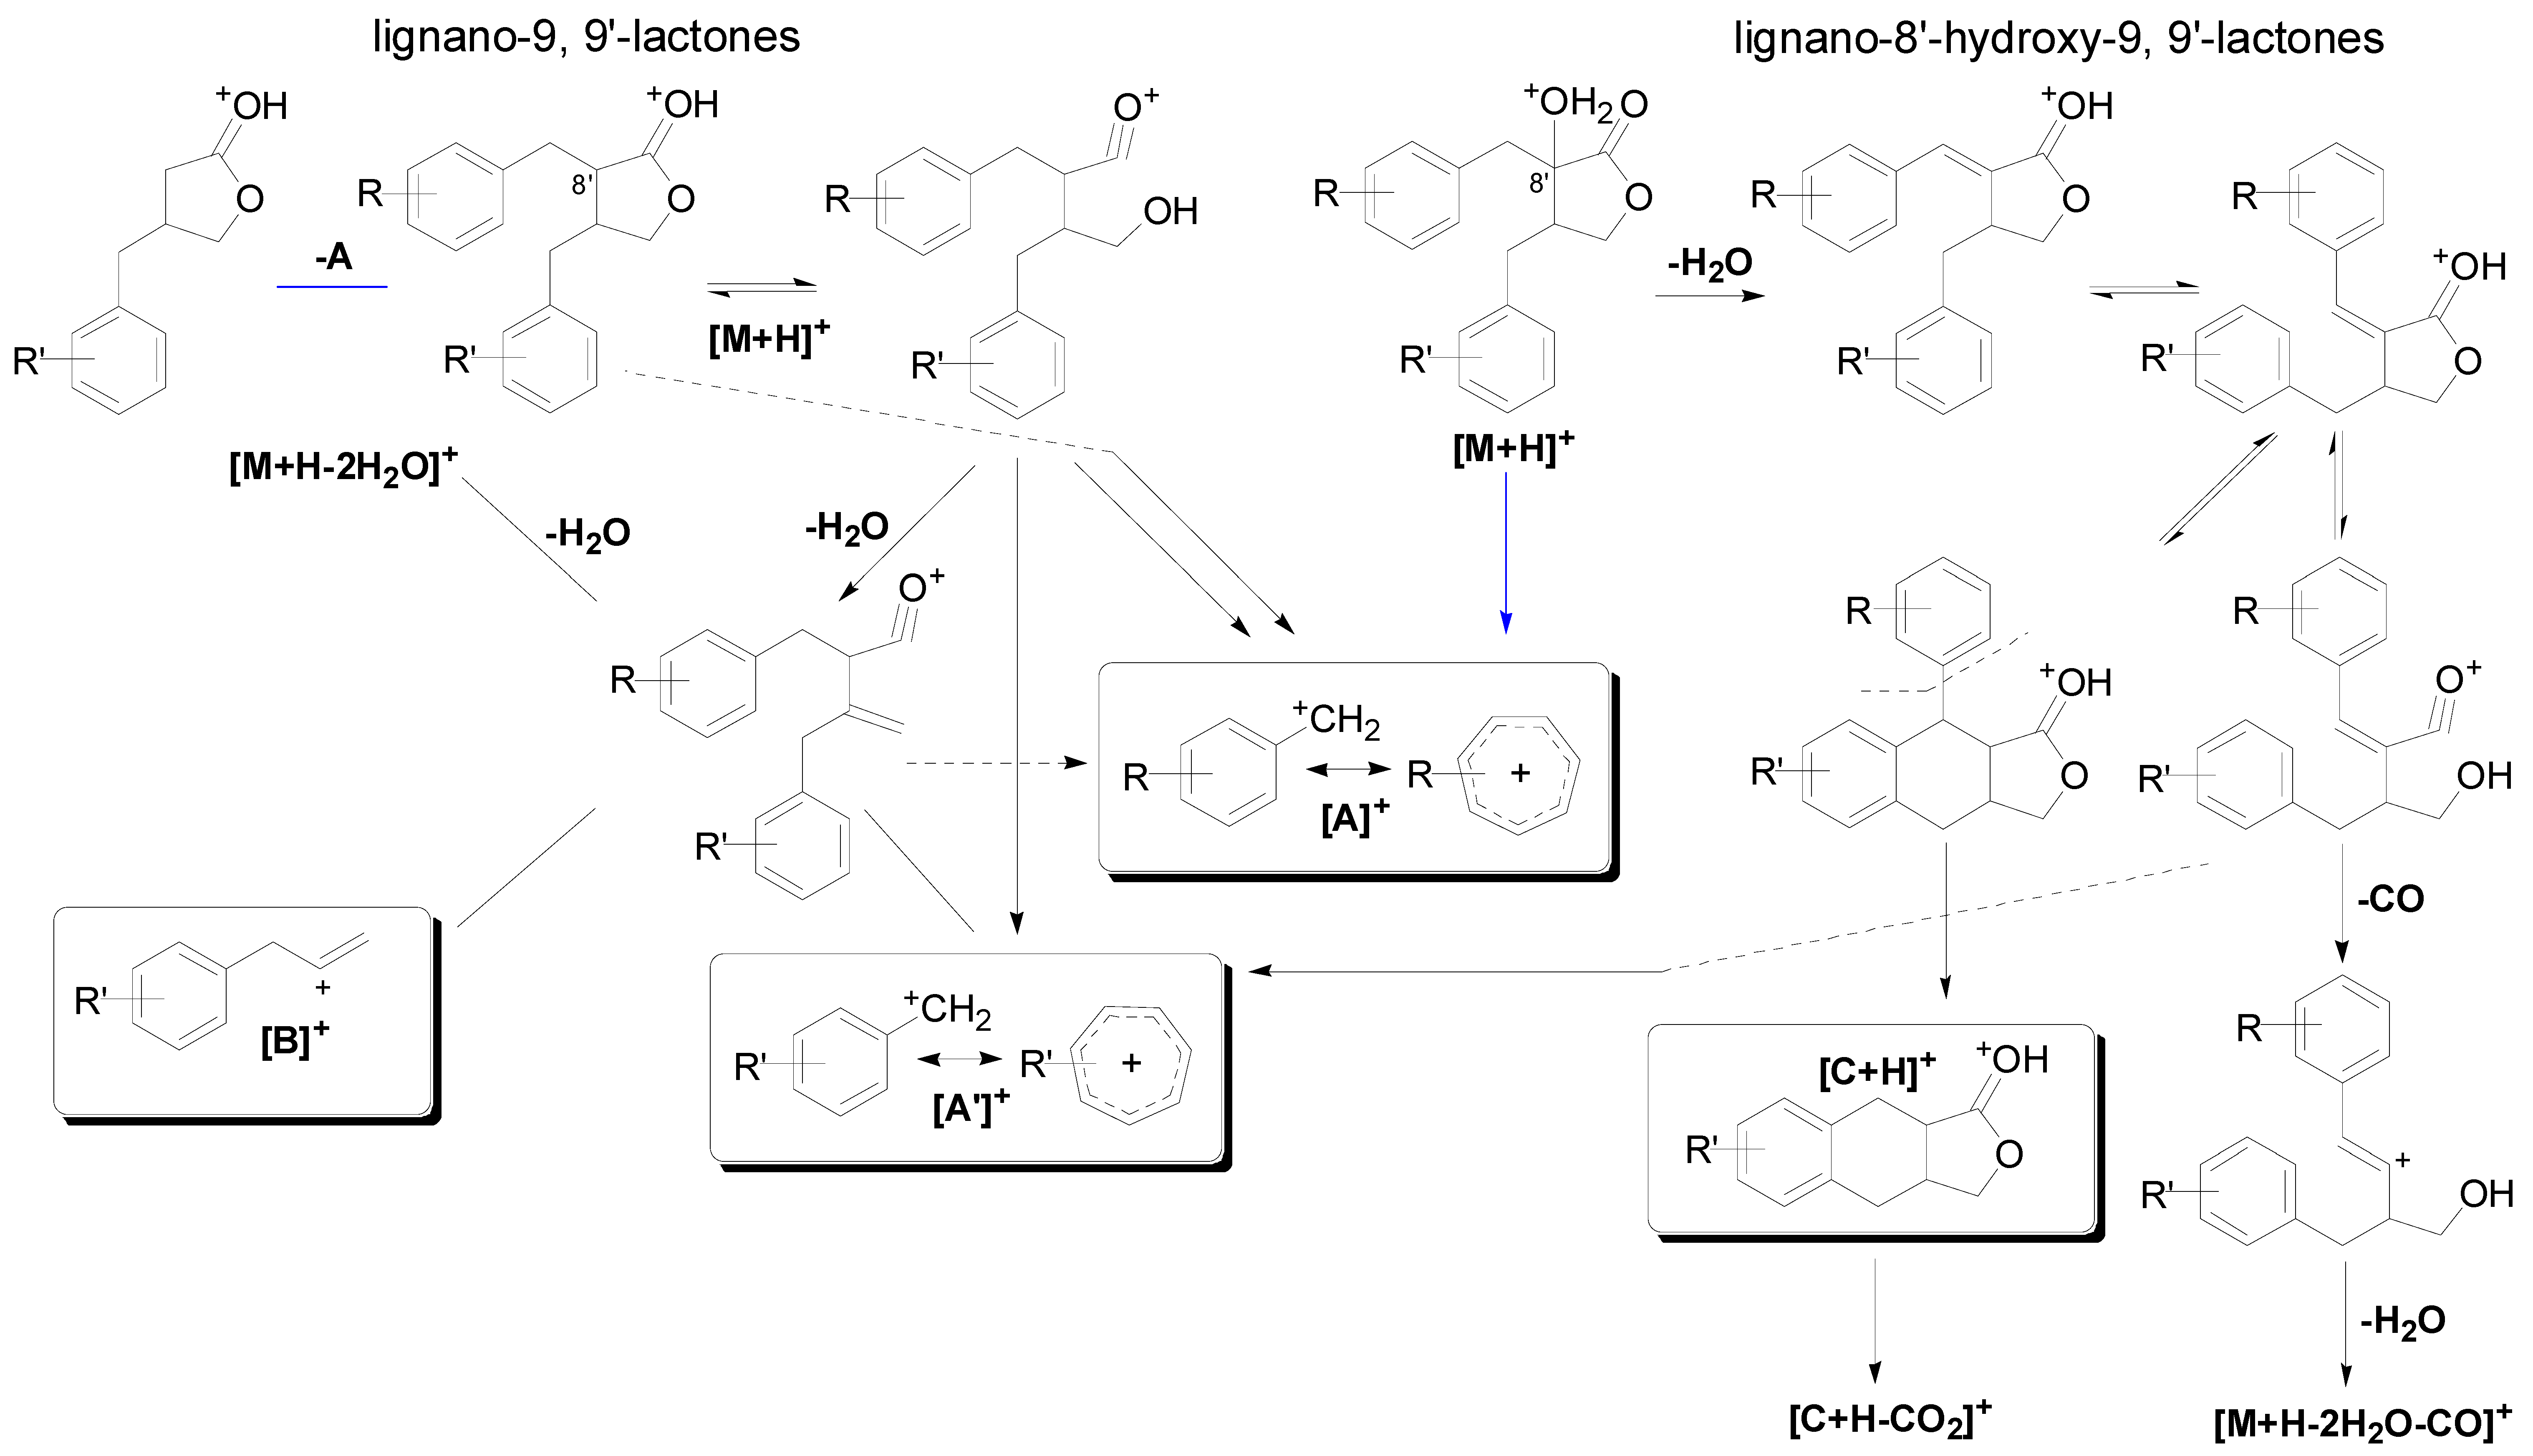
2.2.1. Fragmentation Characteristics of Dibenzylbutyrolatone Lignans
| Peak No. | [A]+ (Measured) | [A]+ (Calculated) | Error (ppm) | [A']+ (Measured) | [A']+ (Calculated) | Error (ppm) | [B]+ (Measured) | [B]+ (Calculated) | Error (ppm) | [M+H−A]+ (Measured) | [M+H−A]+ (Calculated) | Error (ppm) |
|---|---|---|---|---|---|---|---|---|---|---|---|---|
| 4 | 137.0603 | 137.0603 | 0 | 137.0603 | 137.0603 | 0 | ||||||
| 6 | 137.0599 | 137.0603 | −2.92 | 137.0599 | 137.0603 | −2.92 | 163.0755 | 163.0754 | 0.61 | 223.0973 | 223.0965 | 3.55 |
| 8 | 137.0601 | 137.0603 | −1.46 | 237.1117 | 237.1121 | −1.69 | ||||||
| 10 | 137.0604 | 137.0603 | 0.73 | 151.0759 | 151.0754 | 3.31 | 177.0923 | 177.0910 | 7.34 | 237.1127 | 237.1121 | 2.53 |
| 11 | 137.0607 | 137.0603 | 2.92 | 137.0607 | 137.0603 | 2.92 | 163.0762 | 163.0762 | 4.91 | 223.0968 | 223.0965 | 1.35 |
| 14 | 137.0599 | 137.0603 | −2.92 | 151.0753 | 151.0754 | −0.66 |
| Peak No. | [A]+ (Measured) | [A]+ (Calculated) | Error (ppm) | [A']+ (Measured) | [A']+ (Calculated) | Error (ppm) | [C+H]+ (Measured) | [C+H]+ (Calculated) | Error (ppm) |
|---|---|---|---|---|---|---|---|---|---|
| 1 | 137.0607 | 137.0603 | 2.92 | ||||||
| 2 | 137.0610 | 137.0603 | 5.12 | 137.0610 | 137.0603 | 5.12 | 233.0816 | 233.0808 | 3.43 |
| 3 | 137.0602 | 137.0603 | −0.73 | 137.0602 | 137.0603 | −0.73 | 233.0812 | 233.0808 | 1.72 |
| 5 | 137.0619 | 137.0603 | 11.67 | 151.0775 | 151.0754 | 13.90 | 247.0982 | 247.0965 | 6.88 |
| 7 | 137.0605 | 137.0603 | 1.46 | 151.0763 | 151.0754 | 5.96 | 247.0973 | 247.0965 | 3.24 |
| 9 | 137.0614 | 137.0603 | 8.03 | 137.0614 | 137.0603 | 8.03 | 233.0820 | 233.0808 | 5.15 |
| 12 | 137.0613 | 137.0603 | 7.30 | 151.0770 | 151.0754 | 10.59 | 247.0977 | 247.0965 | 4.86 |
| 13 | 137.0613 | 137.0603 | 7.30 | 181.0861 | 181.0859 | 1.10 |
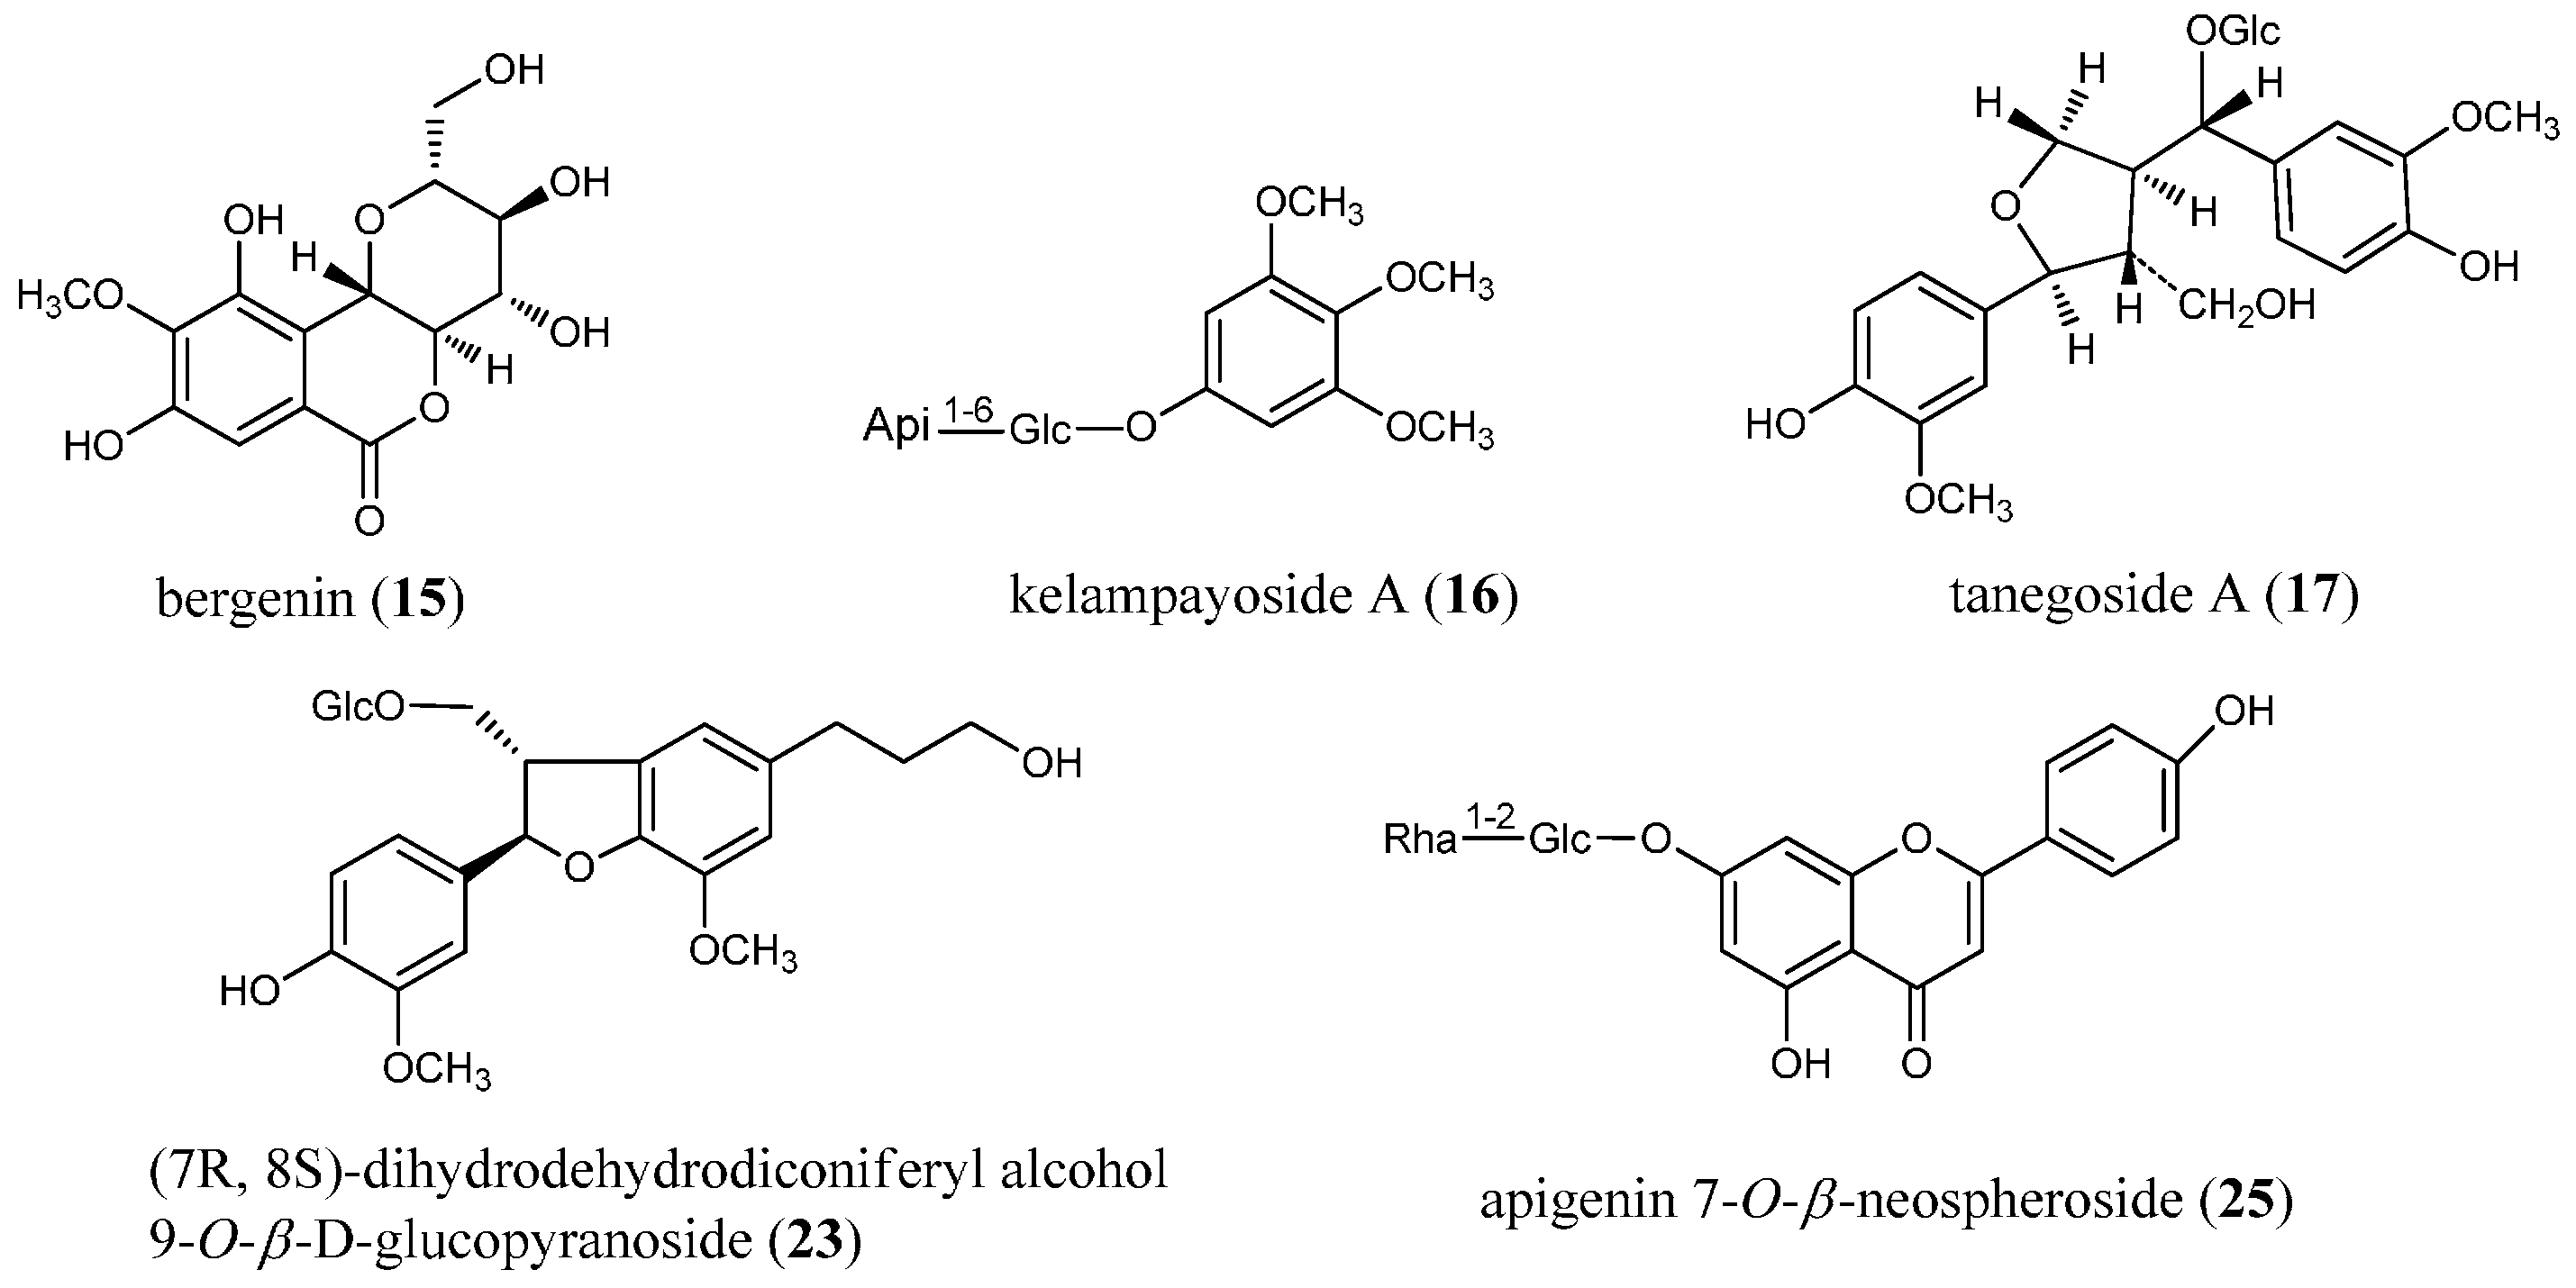
2.2.2. Identification of Constituents in the Sample Extracted from Caulis Trachelospermi

| Peak No. | tR (min) | Precursorion (m/z) | Error (ppm) | Formula | Fragments (m/z) | Elem. comp. | Pathways | Identity |
|---|---|---|---|---|---|---|---|---|
| 15 | 12.349 | 329.0865 [M+H]+ | −2.43 | C14H16O9 | 293.0663 275.0549 263.0555 247.0610 233.0442 | C14H13O7+ C14H11O6+ C13H11O6+ C13H11O5+ C12H9O5+ | [M+H−2H2O]+ [M+H−3H2O]+ [M+H−2H2O−HCOH]+ [M+H−3H2O−CO]+ [M+H−2H2O−CH3COOH]+ | bergenin |
| 16 | 13.795 | 501.1551 [M+Na]+ | −5.79 | C20H30O13 | 411.1230 369.1147 | C17H24O10Na+ C15H22O9Na+ | [M+Na−3HCOH]+ [M+Na−Api]+ | kelampayoside A |
| 17 | 15.450 | 561.1963 [M+Na]+ | 2.63 | C26H34O12 | 381.1310 | C20H22O6Na+ | [M+Na−Glc−H2O]+ | tanegoside A |
| 18 | 16.775 | 721.2315 [M+Na]+ | −0.69 | C32H42O17 | 559.1771 397.1249 159.0419 | C26H32O12Na+ C20H22O7Na+ C8H8O2Na+ | [M+Na−Glc]+ [M+Na−2Glc]+ [A−H+Na]+/[A'−H+Na]+ | nortrachelogenin 4,4'-di- O-β-d-glucoside |
| 19 | 21.416 | 705.2371 [M+Na]+ | 0 | C32H42O16 | 543.1870 381.1335 159.0435 | C26H32O11Na+ C20H22O6Na+ C8H8O2Na+ | [M+Na−Glc]+ [M+Na−2Glc]+ [A−H+Na]+/[A'−H+Na]+ | matairesinol 4,4'-di- O-β-d-glucoside |
| 20 | 21.416 | 721.2309 [M+Na]+ | −1.53 | C32H42O17 | 559.1743 397.1295 159.0421 | C26H32O12Na+ C20H22O7Na+ C8H8O2Na+ | [M+Na−Glc]+ [M+Na−2Glc]+ [A−H+Na]+/[A'−H+Na]+ | nortrachelogenin 4'- O-β-gentiobioside |
| 21 | 22.976 | 559.1792 [M+Na]+ | 0.18 | C26H32O12 | 397.1328 159.0415 | C20H22O7Na+ C8H8O2Na+ | [M+Na−Glc]+ [A−H+Na]+/[A'−H+Na]+ | nortrachelogenin 4- O-β-d-glucoside |
| 22 | 30.531 | 573.1968 [M+Na]+ | 3.49 | C27H34O12 | 411.1426 | C21H24O7Na+ | [M+Na−Glc]+ | 4-demethyltraxillaside |
| 23 | 32.928 | 545.1992 [M+Na]+ | −1.28 | C26H34O11 | 383.1596 159.0366 | C20H24O6Na+ C8H8O2Na+ | [M+Na−Glc]+ [A−H+Na]+ | dihydrodehydrodiconiferyl alcohol-9- O-β-d-glucoside |
| 24 | 39.434 | 587.2125 [M+Na]+ | 3.58 | C28H36O12 | 425.1583 159.0412 | C22H26O7Na+ C8H8O2Na+ | [M+Na−Glc] + [A−H+Na]+ | traxillageside |
| 25 | 42.339 | 579.1719 [M+H]+ | 0.86 | C27H30O14 | 433.1125 271.0605 | C21H21O10+ C15H11O5+ | [M+H−Rha]+ [M+H−Rha−Glc]+ | apigenin 7- O-β-neospheroside |
3. Experimental Section
3.1. Chemicals, Reagents and Materials
| Sample no. | Batch no. | Source |
|---|---|---|
| Y2–1 | 080130 | Zhejiang (QJ a) |
| Y2–2 | 0511011 | Zhejiang (CG) |
| Y2–3 | 060530 | Anhui (SF) |
| Y2–4 | 061329 | Anhui (SL) |
| Y2–5 | 05090101 | Shandong (PSL) |
| Y2–6 | 05081205 | Zhejiang (QJ) |
| Y2–7 | 20030928 | Yunnan (BTS) |
| Y2–8 | 20060415 | Yunnan (BTS) |
| Y2–9 | 5050028 | Guangxi (TRT) |
| Y2–10 | 1040804 | Henan (TRT) |
| Y2–11 | 060626 | Jiangsu (LRT) |
| Y2–12 | 070301 | Zhejiang (XD) |
| Y2–13 | F060290 | Sichuan (DRT) |
| Y2–14 | 20070102 | Jiangsu (QX) |
3.2. Standard Solutions Preparation
3.3. Preparation of Caulis Trachelospermi for HPLC-UV Analysis
3.4. Preparation of the Sample of Caulis Trachelospermi for HPLC-QTOF-MS Analysis
3.5. HPLC-UV Conditions for Quantitative Analysis
3.6. HPLC-QTOF-MS Conditions for Qualitative Analysis
3.7. Validation of the Quantitative Method
3.7.1. Calibration Curve, Limits of Detection and Quantification
3.7.2. Precision and Accuracy
3.7.3. Repeatability and Stability
4. Conclusions
Supplementary Materials
Acknowledgments
Author Contributions
Conflicts of Interest
References
- Committee of pharmacopoeia of the People’s Republic of China, Pharmacopoeia of the People’s Republic of China (First Part); China Medical Science Technology Press: Beijing, China, 2010; p. 252.
- Nishibe, S.; Han, Y.M. Chemical constituents from Trachelosperomum jasminoides and its anticancer activity. World Phytomed. 2002, 17, 57–58. [Google Scholar]
- Lee, M.H.; Lee, J.M.; Jun, S.H.; Ha, C.G.; Lee, S.-H.; Kim, N.M.; Lee, J.H.; Ko, N.Y.; Mun, S.H.; Park, S.H.; et al. In vitro and in vivo anti-inflammatory action of the ethanol extract of Trachelospermi Caulis. J. Pharm. Pharmacol. 2007, 59, 123–130. [Google Scholar] [CrossRef] [PubMed]
- Tan, X.Q.; Chen, H.S.; Liu, R.H.; Tan, C.H.; Xu, C.L.; Xuan, W.D.; Zhang, W.D. Lignans from Trachelospermum jasminoides. Planta Med. 2005, 71, 93–95. [Google Scholar] [CrossRef] [PubMed]
- Tan, X.Q.; Chen, H.S.; Zhou, M.; Zhang, Y. Triterpenoids from canes with leaves of Trachelospermum jasminoides. Chin. Tradit. Herb. Drugs 2006, 37, 171–174. [Google Scholar]
- Tan, X.Q.; Guo, L.J.; Chen, H.S.; Wu, L.S.; Kong, F.F. Study on the flavonoids constituents of Trachelospermum jasminoides. J. Chin. Med. Mater. 2010, 33, 58–60. [Google Scholar]
- Jing, L.; Yu, N.J.; Li, Y.S.; Fu, L.; Zhao, Y.M. Novel lignans from the stems and leaves of Trachelospermum jasminoides. Chin. Chem. Lett. 2011, 22, 1075–1077. [Google Scholar] [CrossRef]
- Zhu, C.C.; Jing, L.; Yu, N.J.; Yang, X.D.; Zhao, Y.M. A new lignan and active compounds inhibiting NF-κB signaling pathway from Caulis Trachelospermi. Acta Pharm. Sin. B 2013, 3, 109–112. [Google Scholar] [CrossRef]
- Liu, X.T.; Wang, Z.X.; Yang, Y.; Wang, L.; Sun, R.F.; Zhao, Y.M.; Yu, N.J. Active components with inhibitory activities on IFN-γ/STAT1 and IL-6/STAT3 signaling pathways from Caulis Trachelospermi. Molecules 2014, 19, 11560–11571. [Google Scholar] [CrossRef] [PubMed]
- Li, X.X.; Wan, L.L.; Zhu, J.H.; Li, Y.; Zhang, J.P.; Guo, C. Determination of flavonoid aglycones in Trachelospermum jasminoides (Lindl.) Lem by HPLC. China Pharm. 2008, 19, 436–437. [Google Scholar]
- Tan, X.Q.; Guo, L.J.; Kong, F.F. Determination of trachelogenin in Trachelospermum jasminoides (Lindl.) Lem. by HPLC. Anhui Med. Pharm. J. 2011, 15, 308–309. [Google Scholar]
- Guo, L.; Tan, X.; Lu, P.; Wu, L.; Kong, F. Determination of salicylic acid in Trachelospermum jasminoides (Lindl.) Lem. by HPLC. China Pharm. 2009, 12, 1779–1781. [Google Scholar]
- Kong, M.; Zhang, J.; Yao, N.; Li, Y.; Jiang, C.H.; Gao, M.; Fang, Z.J.; Liang, J.Y. Simultaneous determination of five compounds in Trachelospermum jasminodes by HPLC. Chin. J. Exp. Tradit. Med. Formulae 2013, 19, 93–96. [Google Scholar]
- Zhu, S.; Tan, X.; Chen, H.; Lei, Y. Determination the content of tracheloside in Trachelospermum jasminoides (Lindl.) Lem. by RP-HPLC. China Pharm. 2005, 8, 1008–1009. [Google Scholar]
- Fujimoto, T.; Nose, M.; Takeda, T.; Ogihara, Y.; Nishibe, S. Quantitative analysis of lignan components in Chinese crude drugs “Zihualuoshi” and “Luoshiteng”. Jpn. J. Pharmacogn. 1993, 47, 218–221. [Google Scholar]
- Li, Q.; Wang, Z.M.; Fu, X.T. Study on quality standards of trachelospermum jasminoides. Northwest Pharm. J. 2010, 25, 431–432. [Google Scholar]
- Liu, M.P.; Yu, N.J.; Zhao, J.; Xu, B.; Zhao, Y.M. Quantitative Analysis of Total Lignans in the Lignan Extract from Trachelospermum jasminoides by Ultraviolet Spectrophotomey. Med. Pharm. J. Chin. PLA 2010, 26, 162–164. [Google Scholar]
- Zhou, Q.; Fu, H.Y.; Bai, J.W.; Li, L. Determination of the Total Flavonoids in Chinese Starjasmine Stem by Spectrophotometry. Lishizhen Med. Mater. Med. Res. 2007, 18, 351–352. [Google Scholar]
- Liu, Y.Q.; Yu, N.J.; Yang, X.D.; Zhao, Y.M. Study on HPLC fingerprint of Trachelospermum jasminoides. China J. Chin. Mater. Med. 2009, 34, 727–730. [Google Scholar]
- Ferrer, I.; García-Reyes, J.F.; Mezcua, M.; Thurman, E.M.; Fernández-Alba, A.R. Multi-residue pesticide analysis in fruits and vegetables by liquid chromatography-time-of-flight mass spectrometry. J. Chromatogr. A 2005, 1082, 81–90. [Google Scholar] [CrossRef] [PubMed]
- Xu, S.Y.; Ye, M.L.; Xu, D.K.; Li, X.; Pan, C.S.; Zou, H.F. Matrix with high salt tolerance for the analysis of peptide and protein samples by desorption/ionization time-of-flight mass spectrometry. Anal. Chem. 2006, 78, 2593–2599. [Google Scholar] [CrossRef] [PubMed]
- Zhang, J.L.; Li, P.; Li, H.J.; Jiang, Y.; Ren, M.T.; Liu, Y. Development and validation of a liquid chromatography/electrospray ionization time-of-flight mass spectrometry method for relative and absolute quantification of steroidal alkaloids in Fritillaria species. J. Chromatogr. A 2008, 1177, 126–137. [Google Scholar] [CrossRef] [PubMed]
- Wu, H.; Guo, J.; Chen, S.; Liu, X.; Zhou, Y.; Zhang, X.; Xu, X. Recent developments in qualitative and quantitative analysis of phytochemical constituents and their metabolites using liquid chromatography-mass spectrometry. J. Pharm. Biomed. Anal. 2013, 72, 267–291. [Google Scholar] [CrossRef] [PubMed]
- Schmidt, T.J.; Alfermann, A.W.; Fuss, E. High-performance liquid chromatography/mass spectrometric identification of dibenzylbutyrolactone type lignans: insights into electrospray ionization tandem mass spectrometric fragmentation of lign-7-eno-9,9'-lactones and application to the lignans of Linum usitatissimum L. (Common Flax). Rapid Commun. Mass Spectrom. 2008, 22, 3642–3650. [Google Scholar] [CrossRef] [PubMed]
- Schmidt, T.J.; Hemmati, S.; Fuss, E.; Alfermann, A.W. A combined HPLC-UV and HPLC-MS method for the identification of lignans and its application to the lignans of Linum usitatissimum L. and L. bienne mill. Phytochem. Anal. 2006, 17, 299–311. [Google Scholar] [CrossRef] [PubMed]
- Jing, L.; Yu, N.J.; Zhao, Y.M.; Li, Y.S. Trace chemical constituents contained in Trachelospermum jasminoides and structure identification. China J. Chin. Mater. Med. 2012, 37, 1581–1585. [Google Scholar]
- Yuan, Q.S.; Yu, N.J.; Zhao, Y.M.; Xu, B.; Yao, Z.W. Chemical constituents from Trachelospermum jasminoides. Chin. Tradit. Herb. Drugs 2010, 41, 179–181. [Google Scholar]
- Yu, N.J.; Zhao, Y.M.; Ren, F.X. Total Lignans Extract from Caulis Trachelospermi, Its Extraction Method, and the Medicinal Usage of the Extract and Its Active Constituents. CN 200510093357.X, 26 August 2005. [Google Scholar]
- Sample Availability: Not available.
© 2015 by the authors. Licensee MDPI, Basel, Switzerland. This article is an open access article distributed under the terms and conditions of the Creative Commons Attribution license ( http://creativecommons.org/licenses/by/4.0/).
Share and Cite
Liu, X.-T.; Wang, X.-G.; Xu, R.; Meng, F.-H.; Yu, N.-J.; Zhao, Y.-M. Qualitative and Quantitative Analysis of Lignan Constituents in Caulis Trachelospermi by HPLC-QTOF-MS and HPLC-UV. Molecules 2015, 20, 8107-8124. https://doi.org/10.3390/molecules20058107
Liu X-T, Wang X-G, Xu R, Meng F-H, Yu N-J, Zhao Y-M. Qualitative and Quantitative Analysis of Lignan Constituents in Caulis Trachelospermi by HPLC-QTOF-MS and HPLC-UV. Molecules. 2015; 20(5):8107-8124. https://doi.org/10.3390/molecules20058107
Chicago/Turabian StyleLiu, Xiao-Ting, Xu-Guang Wang, Rui Xu, Fan-Hua Meng, Neng-Jiang Yu, and Yi-Min Zhao. 2015. "Qualitative and Quantitative Analysis of Lignan Constituents in Caulis Trachelospermi by HPLC-QTOF-MS and HPLC-UV" Molecules 20, no. 5: 8107-8124. https://doi.org/10.3390/molecules20058107
APA StyleLiu, X.-T., Wang, X.-G., Xu, R., Meng, F.-H., Yu, N.-J., & Zhao, Y.-M. (2015). Qualitative and Quantitative Analysis of Lignan Constituents in Caulis Trachelospermi by HPLC-QTOF-MS and HPLC-UV. Molecules, 20(5), 8107-8124. https://doi.org/10.3390/molecules20058107