Abstract
Our ongoing investigations on the stem bark of Uncaria macrophylla afforded a new ursolic triterpene, 3β,6β,19α-trihydroxy-urs-12-en-28-oic acid-24-carboxylic acid methyl ester (1), named uncariursanic acid, and three known ursolic triterpenes including 3β,6β,19α-trihydroxy-23-oxo-urs-12-en-28-oic acid (2), 3β,6β,19α-trihydroxy-urs-12-en-28-oic acid (3) and ursolic acid (4). Their structures were elucidated by extensive spectral methods, including 1D and 2D NMR and HR-ESI-MS. The cytotoxicities of the four compounds were evaluated against two cancer cell lines (MCF-7 and HepG2) by the MTT method, and only compound 4 exhibited potent activity.
1. Introduction
Uncaria, an important source of medicinal natural products from the Rubiaceae family, is widely distributed in tropical regions, including Southern Asia, Africa and South America [1]. Many species of the Uncaria genus have been broadly used as drugs for curing wounds, ulcers, fevers, headaches, hypertension, and gastrointestinal illness [2,3]. Many studies concerning the chemical constituents of Uncaria species have been carried out, which have led to the isolation of a series of secondary metabolites including alkaloids, triterpenes and flavones [4,5,6,7]. In our ongoing research on the systematic isolation of phytochemical constituents, four triterpenes were isolated. Their structures have been identified by extensive spectral methods including 1D, 2D NMR and MS. This paper mainly deals with the isolation, structural elucidation of the new compound, as well as the cytotoxicities of the four triterpenes.
2. Results and Discussion
Compound 1 (Figure 1) was isolated as a white solid from the chloroform extracts of Uncaria macrophylla. The HR-ESI-MS spectrum revealed a quasi-molecular ion peak at 555.3281 [M+Na]+ (calculated 555.3298) corresponding to the molecular formula of C31H48O7Na. [α]25D +4.86°.
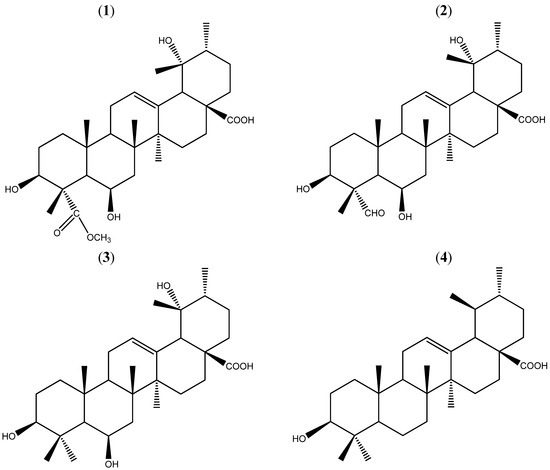
Figure 1.
Structures of 1–4. Compounds 1–4 were isolated from the chloroform extracts.
The 1H-NMR spectral data showed peaks at δ 1.07 (3H, s), 1.20 (3H, s), 1.32 (3H, s), 1.33 (3H, s), 1.48 (3H, s) and δ 0.93 (3H, d, J = 7.2 Hz) due to five methyl groups on quaternary carbons and one methyl group on a tertiary carbon. In the 13C APT spectrum, signals of the methyl groups at δ 18.65, 27.27, 25.03, 17.63, 12.88 and 16.77 were clearly observed. An signal olefinic proton at δ 5.32 in the 1H-NMR spectrum along with signals at δ 129.72 and 139.51 in the 13C-NMR spectrum suggested 1 was a characteristic ursolic pentacyclic triterpene posessing a Δ12,l3 moiety [8]. Further, signals at δ 180.49 and 182.52 in the 13C-NMR spectrum together with the IR absorption at 1711 cm−1 suggested the existence of two carboxyl groups in 1. The 1H-NMR signals at δ 3.90 and δ 3.84 and 13C-NMR peaks at δ 77.40, 72.06 and 73.82 suggested 1 to be a trihydroxy-substituted pentacyclic triterpene.
The signal at δ 3.69 (3H, s) in the 1H-NMR spectrum and the signal at δ 52.59 in the 13C-NMR spectra were due to a methoxyl group attached to a carbonyl group, which was confirmed by the correlation between H-31 (δ 3.69) and C-24 (δ 180.49) in the HMBC experiment. The Δ12, l3 structure was also confirmed by the HMBC correlations between H-12 (δ 5.32) and C-9 (δ 49.40), C-11 (δ 24.80), C-13 (δ 139.51), C-18 (δ 55.36). The HMBC cross-peaks between H-3 (δ 3.90) and C-1 (δ 42.00), between H3-25 and C-1 (δ 42.00), C-5 (δ 54.51), C-9 (δ 49.40), C-10 (δ 37.42), and the evidence from the chemical shift and the J value of the axial proton at C-3 (δ 3.90, dd, J = 12.0, 3.6 Hz, H-3) suggested the hydroxy at C-3 was in a β-configuration. HMBC correlations between H-6 (δ 3.84) and C-7 (δ 42.03), C-10 (δ 37.42) indicated a hydroxyl group was attached to the C-6 (Figure 2).
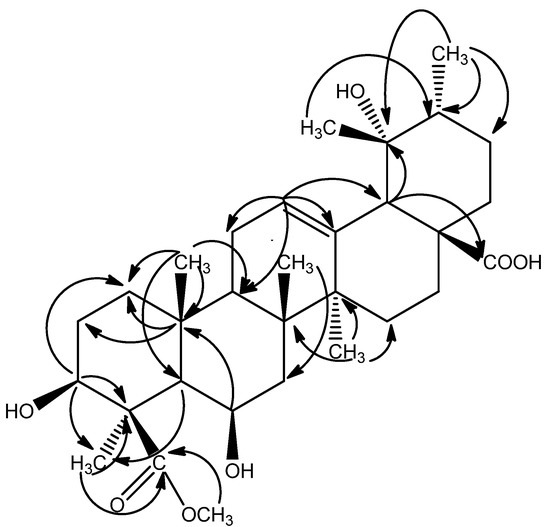
Figure 2.
Selected HMBC (2J and 3J) correlations of compound 1.
The relative configuration of the hydroxyl group at C-6 was deduced to be β by the cross-peaks of H-3 (δ 3.90) and H3-23 (δ1.48), H-6 (δ 3.84) and H3-23 (δ 1.48) in the NOESY experiment (Figure 3). The hydroxyl group at the 19 position induced a downfield shift of the resonance of the axial proton at C-16. This signal resonated at δ 2.55 and was observed as a ddd with J = 13.2, 13.2, 4.8 Hz, thus supporting the 19α-OH stereochemistry and being compatible only with a cis stereochemistry of the ring D/E junction; the proton at δ 2.55 was confirmed to be H-16 [5]. The appearance of characteristic signals at δ 2.52 (1H, s, H-18) in the 1H-NMR spectrum and at δ 73.82 ppm (C-19, quaternary carbon) in the 13C-NMR spectrum suggested that 1 was an ursolic acid derivative with a hydroxyl group attached to C-19, which was confirmed by the observed correlation between H-18 and C-14 (δ 43.28), C-16 (δ 26.82), C-19 (δ 73.82), C-28 (δ 182.52), between H3-29 (δ 1.20) and C-18 (δ 55.36), C-20 (δ 43.30), between H3-30 (δ 0.93) and C-19 (δ 73.82) in the HMBC experiment (Figure 2). Furthermore, the NOESY correlations between H-12 (δ 5.32) and H-29 (δ 1.20) confirmed that the 19-OH accepted α configuration (Figure 3).
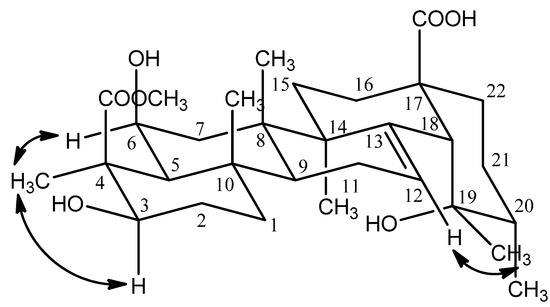
Figure 3.
Selected NOESY correlations of compound 1.
Consequently, the structure 1 was established and determined to be 3β,6β,19α-trihydroxy-urs-12-en-28-oic acid-24-carboxylic acid methyl ester (Figure 1), and compound 1 was named uncariursanic acid. The structures of the three known compounds 2–4 were identified by the 1H-NMR and 13C-NMR spectral data, which were consistent with the published data [9,10].
The four triterpenes were evaluated for their in vitro inhibitory abilities against two cancer cell lines (HepG2 and MCF-7). The results showed that only ursolic acid and cis-platin were effective in inhibiting the growth of HepG2 and MCF-7. The IC50 values of ursolic acid against the two cell lines were 12.1 µg/mL and 15.1 µg/mL and cis-platin were 7.5 µg/mL, 8.2 µg/mL, respectively. However, compounds 1–3 showed no inhibitive activities against the two cancer cell lines in the experiment (IC50 > 100 µg/mL).
3. Experimental
3.1. General
Infrared spectra were measured using a FTIR-8400S spectrometer. The HR-ESI-MS data were obtained on a Micross Mass Autospec-Ultima ETOF mass spectrophotometer (Waters Ltd., England). NMR spectra were measured on a Bruker AV-600 (600 MHz for 1H and 150 MHz for 13C) spectrometer (Bruker Biospin Inc., Germany) using CD3OD as solvent and tetramethylsilane (TMS) as internal standard. Ultraviolet spectra were recorded in MeOH on a Shimadzu UV-160A, UV-Visible Recording Spectrophotometer (Shimadzu Corporation, Japan). ODS gel (40–60 μm, Daiso Co., Ltd., Japan). Chromatography was performed on silica gel (200–300 mesh, Qingdao Haiyang Chemical Factory, Qingdao, China).
3.2. Plant Material
The medicinal material was collected from Guangxi Province in 2010, and identified by Dr. Jing Quan Yuan at the Institute of Medicinal Plant Development, Chinese Academy of Medical Sciences & Peking Union Medical College, where a voucher specimen with No.20101132 has been deposited.
3.3. Extraction and Isolation
The air-dried and powdered sample (5 kg) was extracted successively with 90% EtOH-H2O (50 kg, 70 °C, 2 h). The extract was filtered and concentrated under reduced pressure until only H2O remained. The remaining solution was sequentially partitioned with petroleum ether (boiling point 60–90 °C), CHCl3 and EtOAc, to obtain petroleum ether (32.3 g), chloroform (31.8 g), ethyl acetate (15.6 g) and water (8.5 g) extracts after concentration. The chloroform extract was chromatographed over a silica gel column using a stepwise gradient system of petroleum ether/acetone. Eluted fraction A (petroleum ether/acetone 70:30, 3.2 g) was then subjected to Sephadex LH 20 (Pharmacia) column chromatography using chloroform /methanol (40:60), the obtained fraction C (200 mg) was subjected to reverse phase chromatography (ODS) with MeOH-H2O (40:60) to give compound 1 (5 mg), compound 2 (16 mg), compound 3 (12 mg) and compound 4 (10 mg).
3.4. Spectral Data
3β,6β,19α-Trihydroxy-urs-12-en-28-oic acid-24-carboxylic acid methyl ester (1). White solid. IR νmax (cm−1): 3461, 2931, 1711. ESI-MS m/z: [M+Na] + 555. For 1H-NMR and 13C-NMR (CD3OD) spectra, see Table 1.

Table 1.
1H-NMR and 13C-NMR data for 1.
| Position | 1H(δ) | 13C(δ) | HMBC |
|---|---|---|---|
| 1 | 1.63 (m, 2H) | 42.00 | 37.42 (C-10) |
| 2 | 1.60 (m, 2H) | 27.74 | 37.42 (C-10) |
| 3 | 3.90 (dd, 1H, 3.6, 12 Hz) | 77.40 | 42.00 (C-1), 56.42 (C-4), 12.88 (C-23), 180.49 (C-24) |
| 4 | - | 56.42 | |
| 5 | 1.50 (m, 1H) | 54.15 | 12.88 (C-23) |
| 6 | 3.84 (m, 1H) | 72.06 | |
| 7 | 1.46 (m, 1H),1.69 (m, 1H) | 42.03 | |
| 8 | - | 40.93 | |
| 9 | 1.78 (m, 1H) | 49.40 | |
| 10 | - | 37.42 | |
| 11 | 2.05 (m, 2H) | 24.80 | |
| 12 | 5.32 (t, 1H, 3.6 Hz) | 129.72 | 49.40 (C-9), 24.80 (C-11), 139.51 (C-13), 55.36 (C-18) |
| 13 | - | 139.51 | |
| 14 | - | 43.28 | |
| 15 | 0.98 (m, 1H), 1.86 (ddd,1H, 13.2, 13.2, 4.8 Hz) | 29.78 | |
| 16 | 1.51 (m, 1H), 2.55 (ddd,1H, 13.2, 13.2, 4.8 Hz) | 26.82 | 29.78 (C-15), 49.26 (C-17) |
| 17 | - | 49.26 | |
| 18 | 2.52 (s, 1H) | 55.36 | 43.28 (C-14), 26.82 (C-16), 73.82 (C-19), 182.52 (C-28) |
| 19 | - | 73.82 | |
| 20 | 0.94 (1H) | 43.30 | |
| 21 | 1.73 (m, 2H) | 27.49 | |
| 22 | 1.73 (m, 2H) | 39.18 | |
| 23 | 1.48 (s, 3H) | 12.88 | 56.42 (C-4), 180.49 (C-24) |
| 24 | - | 180.49 | |
| 25 | 1.33 (s, 3H) | 17.63 | 42.00 (C-1), 54.15 (C-5), 49.40 (C-9), 37.42 (C-10) |
| 26 | 1.07 (s, 3H) | 18.65 | 42.03 (C-7), 40.93 (C-8), 49.40 (C-9), 43.28 (C-14) |
| 27 | 1.32 (s, 3H) | 25.03 | 40.93 (C-8), 43.28 (C-14), 29.78 (C-15) |
| 28 | - | 182.52 | |
| 29 | 1.20 (s, 3H) | 27.27 | 55.36 (C-18), 43.30 (C-20) |
| 30 | 0.93 (s, 3H) | 16.77 | 73.82 (C-19), 43.30 (C-20), 27.49 (C-21) |
| 31 | 3.69 (s, 3H) | 52.59 | 180.49 (C-24) |
3β,6β,19α-Trihydroxy-23-oxo-urs-12-en-28-oic acid (2). White solid. IR νmax (cm−1): 3419, 2930, 1709, 1689. ESI-MS m/z: [M+Na]+ 525. The 1H-NMR and 13C-NMR (CD3OD) spectral data were consistent with the published data [9].
3β,6β,19α-Trihydroxy-urs-12-en-28-oic acid (3). White solid. IR νmax (cm−1): 3437, 2931, 1688. ESI-MS m/z: [M+Na] +511. The 1H-NMR and 13C-NMR (CD3OD) spectral data were consistent with the published data [9].
Ursolic acid (4). White solid. IR νmax (cm−1): 3422, 2927, 1693. ESI-MS m/z: [M+Na]+ 479. The 1H-NMR and 13C-NMR (pyridine-d5) spectral data were consistent with the published data [10].
3.5. Bioassays
Antitumor activity was assayed on HepG2 liver tumor cells and MCF-7 breast tumor cells using cis-platin as positive control. Cells were plated in the appropriate media on 96-well plates in a 100 μL total volume at a density of 6 × 10⁴ cells/mL. The final concentrations of each compound were 0.625, 1.25, 2.5, 5.0, 10 μg/mL. The plates were incubated at 37 °C in 5% CO2 for 72 h. Cell viability was determined based on the mitochondrial conversion of MTT to formazan.
4. Conclusions
A new triterpene, 3β,6β,19α-trihydroxy-urs-12-en-28-oic acid-24-carboxylic acid methyl ester (1), along with three known triterpenes were isolated from the stem bark of U. macrophylla. The isolation of the new compound was a new addition to the molecular diversity of U. macrophylla. Ursolic acid (4) exhibited antitumor activity.
Acknowledgements
Financial supports from Chinese Traditional Medicine Researches of Special Projects (No. 200707007); the technological large platform for comprehensive research and development of new drugs in the Twelfth Five-Year “Significant New Drugs Created” Science and Technology Major Projects (No. 2012ZX09301-002-001-026), and the chemical composition of the digital library of traditional Chinese medicine for drug discovery in the Twelfth Five-Year “Significant New Drugs Created” (No. 2011ZX09307-002-01) are gratefully acknowledged.
- Sample Availability: Samples of the compounds 1-4 are available from the authors.
References and Notes
- Risdale, C.E. A revision of Mitragyna and Uncaria (Rubiaceae). Blumea 1978, 24, 43–100. [Google Scholar]
- Chang, P.; Koh, Y.K.; Geh, S.L.; Soepadmo, E.; Goh, S.H.; Wong, A.K. Cardiovascular effects in the rat of dihydrocorynantheine isolated from Uncaria callophylla. J. Ethnopharmacol. 1989, 25, 213–215. [Google Scholar] [CrossRef]
- Huo, Q.; Zhao, Q.; Li, Y.L. The Clinical Application Study on Uncariae Ramulus Cum Uncis. J. Shandong Trad. Chin. Med. 2010, 29, 426–428. [Google Scholar]
- Aimi, N.; Shito, T.; Fukushima, K.; Itai, Y.; Aoyama, C.; Kunisawa, K.; Sakai, S.; Haginiwa, J.; Yamasaki, K. Studiesonplants containingindolealkaloids. VIII. Indole alkaloid glycosides and other constituents of the leaves of Uncaria rhynchophylla Miq. Chem. Pharm. Bull. 1982, 30, 4046–4051. [Google Scholar] [CrossRef]
- Aimi, N.; Likhitwitayawuid, K.; Goto, J.; Ponglux, D.; Haginiwa, J.; Sakai, S. Triterpenoidal constituents of Uncaria orida Vidal. Tetrahedron 1989, 45, 4125–4134. [Google Scholar] [CrossRef]
- Wagner, H.; Kreutzkamp, B.; Jurcic, K. The alkaloids of Uncaria tomentosa and their phagocytosis-stimulating action. Planta Med. 1985, 419–423. [Google Scholar]
- Wirth, C.; Wagner, H. Pharmacologically active procyanidines from the bark of Uncaria tomentosa. Phytomedicine 1997, 4, 265–266. [Google Scholar] [CrossRef]
- Doddrell, D.M.; Khong, P.W.; Lewis, K.G. The stereochemical dependence of 13C chemical shifts in olean-12-enes and urs-12-enes as an aid to structural assignment. Tetrabedron Lett. 1974, 15, 2381–2386. [Google Scholar] [CrossRef]
- Aquino, R.; De Simone, F.; Vincieri, F.F.; Pizza, C. New polyhydroxylated triterpenes from Uncaria tomentosa. J. Nat. Prod. 1990, 53, 559–564. [Google Scholar] [CrossRef]
- Ju, J.H.; Zhou, L.; Lin, G.; Liu, D.; Wang, L.W.; Yang, J.S. Studies on constituents of triterpene acids from Eriobotrya japonica and their anti-inflammatory and antitussive effects (in Chinese). Chin. Pharmaceut. J. 2003, 38, 752–757. [Google Scholar]
© 2012 by the authors; licensee MDPI, Basel, Switzerland. This article is an open-access article distributed under the terms and conditions of the Creative Commons Attribution license (http://creativecommons.org/licenses/by/3.0/).