
On Using Artificial Intelligence and the Internet of Things for Crop Disease Detection: A Contemporary Survey


Abstract
: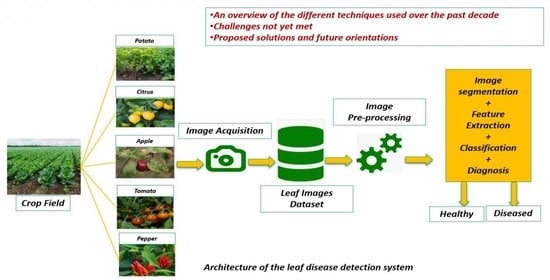
1. Introduction
2. Background
2.1. Taxonomy of Crop Diseases and Their Symptoms
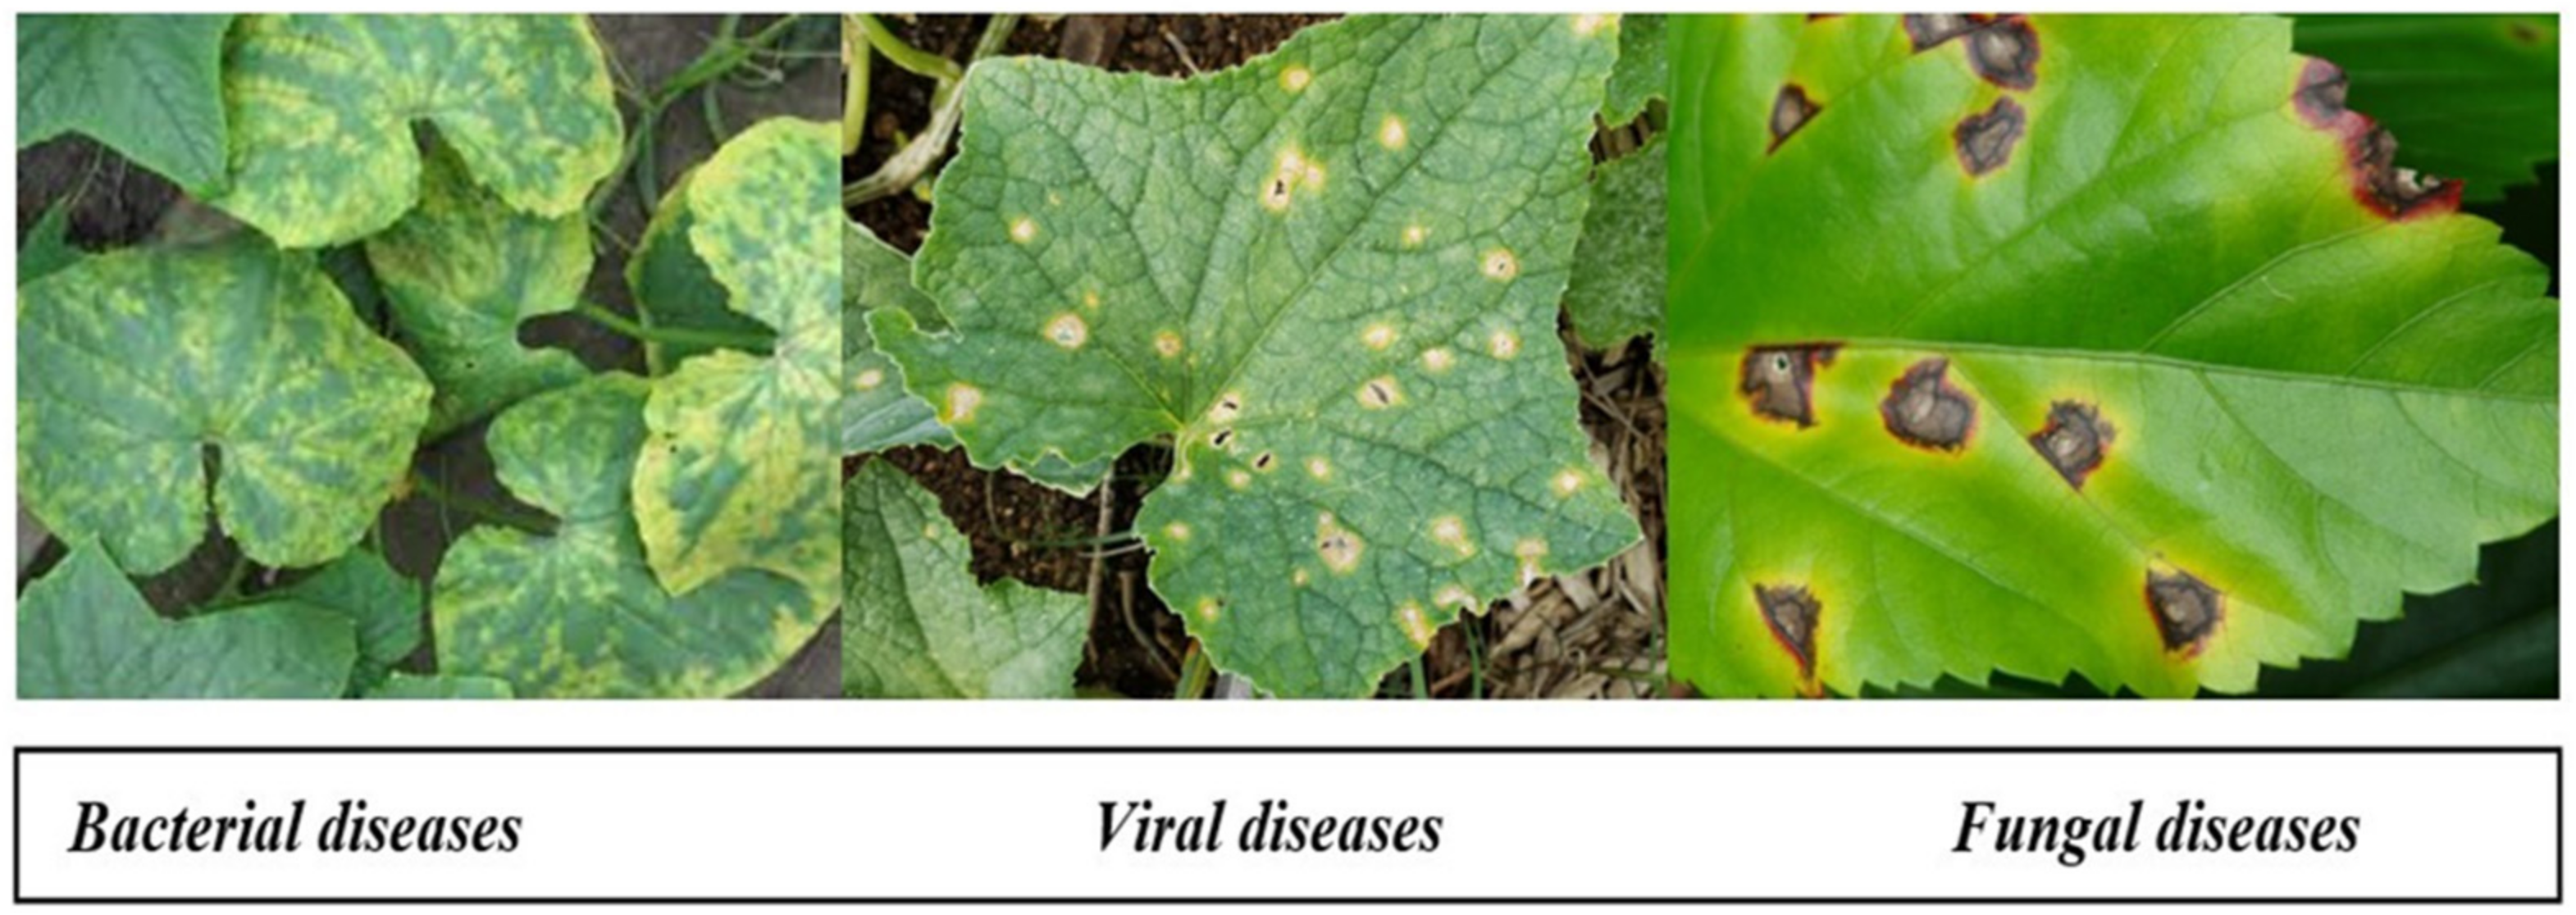
- Virus diseases [1]: Among all plant diseases, those caused by infection are difficult to identify and diagnose; moreover, these symptoms are mistaken for signs of nutritional deficiency or injury, as there is no preconceived indicator that can be constantly monitored. Whiteflies, leafhoppers, aphids, and cucumber crawling insects are regular carriers of virus diseases.
- Fungal diseases [1]: Foliar diseases are caused by a fungus, such as downy mildew, anthracnose, and powdery mildew. It initially appears on old lower leaves, which have gray-green spots or are soaked in water. As the parasite matures, these spots darken and cause fungus to grow on them.
- Bacterial diseases [1]: Pathogens cause serious diseases in vegetables. They do not directly enter the vegetation, but rather through injuries or apertures in the crop. Crop injuries result from various pathogens, insects, and agricultural implements during tasks such as picking and pruning.
2.2. Application of Machine Learning and Image Processing in Disease Identification
2.3. Application of Deep and Transfer Learning in Disease Recognition
2.4. Hyperspectral Imaging Applied to Disease Recognition
2.5. Application of IoT in the Field of Leaf Disease Recognition
3. Comparison of Various Crop Disease Detection Techniques
- ASM: The second angular momentum that stands for the total sum of squares in the GLCM.
- 2.
- Contrast: Denotes the sum of the difference in local intensity, where i ≠ j.
- 3.
- Entropy: The quantity of image information necessary for the compression.
- 4.
- Correlation: Refers to the linear dependence of the adjacent pixels’ gray levels.
- 5.
- Homogeneity feature: Represents the homogeneity of the voxel pairs of the gray level, and is equal to 1 for a diagonal GLCM.
- TP: represents the number of true positive image samples that are perfectly identified as infected.
- FP: is the number of false-positive image samples that are incorrectly classified as infected.
- TN: is the number of true-negative image samples that are correctly classified as healthy.
- FN: is the number of false-negative image samples that are incorrectly identified as uninfected.
- The Difference between machine learning and deep learning
4. Discussion
5. Unresolved Challenges in the Crop Disease Detection Field
5.1. Insufficient Data
5.2. Imbalanced Data
5.3. Vanishing Gradient Problem
5.4. Exploding Gradient Problem
5.5. Overfitting and Underfitting Problem
5.6. Image Acquisition: Conditions of Image Capture (Lighting, Spatial Location, Wind and Camera)
- Lighting Issue
- Camera
5.7. Image Preprocessing
5.8. Image Segmentation and Symptom Discrimination
- -
- A leaf may overlap with another leaf or other parts of the plant, and they may even be tilted or covered with dew or dust.
- -
- Images with complex backgrounds can render the segmentation of ROIs where symptoms appear challenging and intricate.
5.9. Feature Selection and Extraction
5.10. Disease Classification
- Differences in disease symptoms: According to the disease development stage, a specific disease can present very distinct characteristics in the symptoms’ shape, color, and size, causing serious identification problems. It should be noted that many different diseases can occur at the same time, making it extremely complex to distinguish between combinations of symptoms and individual symptoms. This problem was noted by Camargo et al. [116] when handling symptoms produced by black streak disease on banana leaves, and Moya et al. [112] when evaluating powdery mildew severity on squash leaves.
- Diseases can occur simultaneously with many disorders, such as nutritional deficiencies, pests, and diseases: Typically, most techniques consider that there is only a single disease per image when, in reality, several other diseases can be present at the same time, in addition to other kinds of disorders, such as nutritional deficiencies and pests. These simultaneous symptoms can be either separate or physically combined, making disease identification a significant challenge. In this regard, Bock et al. [106] observed the simultaneous presence of symptoms arising from different diseases and noted that this can lead to identification issues, and that more advances will be required to cope with this issue.
- The symptoms’ similarity between different disorder types: Symptoms resulting from various disorders, such as diseases, phytotoxicity, presence of parasites, and nutritional deficiencies, can be visually similar. As a result, it can be extremely difficult to determine a symptom’s source with certitude, particularly if only the visible spectrum is used in the identification process. This forces methods to rely on tiny differences to discriminate between the symptoms. Numerous researchers have stated that some disorders have close similarities, leading to major issues of discrimination. In this regard, Ahmad et al. [114] reported that symptoms resulting from Fusarium, Mosaic Potyvirus, Alternaria, and Phomopsis in soybean were very similar, and their classifier was unable to discern between them. This explains why the majority of studies conducted to date have chosen to tackle only diseases whose symptoms are quite dissimilar and, even then, their choices remain a significant challenge.
5.11. Other Challenges
6. Future Work and Possible Solutions to Ongoing Limitations
6.1. Data Augmentation Techniques
6.2. Tackling Overfitting Problem
6.3. Few-Shot Learning
6.4. Transfer Learning
7. Conclusions
Supplementary Materials
Author Contributions
Funding
Institutional Review Board Statement
Data Availability Statement
Acknowledgments
Conflicts of Interest
Abbreviations
| AI | Artificial Intelligence |
| ML | Machine Learning |
| DL | Deep Learning |
| TL | Transfer Learning |
| CV | Computer Vision |
| IoT | Internet of Things |
| IP | Image Processing |
| WSN | Wireless Sensor Network |
| NN | Neural Network |
| ANN | Artificial Neural Network |
| CNN | Convolutional Neural Network |
| DNN | Deep Neural Network |
| RNN | Recurrent Neural Network |
| PNN | Probabilistic Neural Network |
| BBPN | Back-Propagation Neural Network |
| GOA | Grasshopper Optimization Algorithm |
| DAML | Deep Adversarial Metric Learning |
| KNN | K-Nearest Neighbor |
| SVM | Support Vector Machine |
| M-SVM | Multiclass-Support Vector Machine |
| LS-SVM | Least Squares Supporting Vector Machine |
| RF | Random Forest |
| PDA | Penalized Discriminant Analysis |
| ELM | Extreme Learning machine |
| NB | Naïve Bayes |
| VGG | Visual Geometry Group |
| ResNet | Residual Neural Network |
| C-GAN | Conditional Generative Adversarial Network |
| GPU | Graphics Processing Unit |
| MEAN block | Mobile End Apple Net block |
| FSL | Few-Shot Learning |
| GOA | Grasshopper Optimization Algorithm |
| GA | Genetic Algorithms |
| PSO | Particle Swarm Optimization |
| PCA | Principal Component Analysis |
| LDA | Linear Discriminant Analysis |
| PLS—DA | Partial Least Squares Discrimination Analysis |
| SPA | Successive Projection Algorithm. |
| SAM | Spectral Angle Mapper |
| BBCH | Biologische Bundesanstalt, Bundessortenamt and CHemical industry |
| RBM | Restricted Boltzmann Machine |
| AE | Auto-Encoder |
| EW | Effective Wavelengths |
| GLCM | Gray Level Cooccurrence Matrix |
| CPDA | Color Processing Detection Algorithm. |
| GUI | Graphical User Interface |
| LBP | Local Binary Patterns |
| HOG | Histogram-Oriented Gradient |
| HSV | Hue Saturation Value |
| RoI | Region of Interest |
| HPCCDD | Homogeneous Pixel Counting technique for Cotton Disease Detection |
| CMD | Cassava Mosaic Disease |
| RMD | Red Mite Damage |
| GMD | Green Mite Damage |
| TMV | Tobacco Mosaic Virus |
| VNIR | Visible and Near-Infrared |
| SWIR | Short Wavelength Infrared |
| ENVI | Environment for Visualizing Images |
| KL | Kullback Leibler |
| ABT | Area-Based Techniques |
| SIFT | Scale Invariant Feature Transform |
| MFC | Marginalized Corrupted Features |
| LMNN | Large Margin Nearest Neighbor |
| PRISMA | Preferred reporting items for systematic reviews and meta-analyses |
References
- Lucas, G.B.; Campbell, C.L.; Lucas, L.T. Causes of plant diseases. In Introduction to Plant Diseases; Springer: Berlin/Heidelberg, Germany, 1992; pp. 9–14. [Google Scholar]
- Shirahatti, J.; Patil, R.; Akulwar, P. A survey paper on plant disease identification using machine learning approach. In Proceedings of the 2018 3rd International Conference on Communication and Electronics Systems (ICCES), Coimbatore, India, 15–16 October 2018; pp. 1171–1174. [Google Scholar]
- Liu, L.; Dong, Y.; Huang, W.; Du, X.; Ren, B.; Huang, L.; Zheng, Q.; Ma, H. A disease index for efficiently detecting wheat fusarium head blight using sentinel-2 multispectral imagery. IEEE Access 2020, 8, 52181–52191. [Google Scholar] [CrossRef]
- Prasad, R.; Ranjan, K.R.; Sinha, A. AMRAPALIKA: An expert system for the diagnosis of pests, diseases, and disorders in Indian mango. Knowl.-Based Syst. 2006, 19, 9–21. [Google Scholar] [CrossRef]
- Singh, V.; Misra, A.K. Detection of plant leaf diseases using image segmentation and soft computing techniques. Inf. Process. Agric. 2017, 4, 41–49. [Google Scholar] [CrossRef] [Green Version]
- Afifi, A.; Alhumam, A.; Abdelwahab, A. Convolutional neural network for automatic identification of plant diseases with limited data. Plants 2021, 10, 28. [Google Scholar] [CrossRef] [PubMed]
- Mugithe, P.K.; Mudunuri, R.V.; Rajasekar, B.; Karthikeyan, S. Image processing technique for automatic detection of plant diseases and alerting system in agricultural farms. In Proceedings of the 2020 International Conference on Communication and Signal Processing (ICCSP), Chennai, India, 28–30 July 2020; pp. 1603–1607. [Google Scholar]
- Parikshith, H.; Rajath, S.N.; Kumar, S.P. Leaf disease detection using image processing and artificial intelligence—A survey. In Proceedings of the International Conference On Computational Vision and Bio Inspired Computing, Coimbatore, India, 25–26 September 2019; pp. 304–311. [Google Scholar]
- Sethy, P.K.; Barpanda, N.K.; Rath, A.K.; Behera, S.K. Deep feature based rice leaf disease identification using support vector machine. Comput. Electron. Agric. 2020, 175, 105527. [Google Scholar] [CrossRef]
- Mitra, D. Emerging plant diseases: Research status and challenges. Emerg. Trends Plant Pathol. 2021, 1–17. [Google Scholar] [CrossRef]
- Ichiki, T.U.; Shiba, T.; Matsukura, K.; Ueno, T.; Hirae, M.; Sasaya, T. Detection and diagnosis of rice-infecting viruses. Front. Microbiol. 2013, 4, 289. [Google Scholar]
- Lacomme, C.; Holmes, R.; Evans, F. Molecular and serological methods for the diagnosis of viruses in potato tubers. In Plant Pathology; Springer: Berlin/Heidelberg, Germany, 2015; pp. 161–176. [Google Scholar]
- Balodi, R.; Bisht, S.; Ghatak, A.; Rao, K. Plant disease diagnosis: Technological advancements and challenges. Indian Phytopathol. 2017, 70, 275–281. [Google Scholar] [CrossRef]
- Bachika, N.A.; Hashima, N.; Wayayoka, A.; Mana, H.C.; Alia, M.M. Optical imaging techniques for rice diseases detection: A review. J. Agric. Food Eng. 2020, 2. Available online: https://www.myjafe.com/wp-content/uploads/2020/04/MYJAFE2020-0001.pdf (accessed on 15 December 2021).
- Galletti, P.A.; Carvalho, M.E.; Hirai, W.Y.; Brancaglioni, V.A.; Arthur, V.; da Silva, C.B. Integrating optical imaging tools for rapid and non-invasive characterization of seed quality: Tomato (Solanum lycopersicum L.) and carrot (Daucus carota L.) as study cases. Front. Plant Sci. 2020, 11, 577851. [Google Scholar] [CrossRef] [PubMed]
- Bauriegel, E.; Herppich, W.B. Hyperspectral and chlorophyll fluorescence imaging for early detection of plant diseases, with special reference to Fusarium spec. infections on wheat. Agriculture 2014, 4, 32–57. [Google Scholar] [CrossRef] [Green Version]
- Mishra, P.; Polder, G.; Vilfan, N. Close range spectral imaging for disease detection in plants using autonomous platforms: A review on recent studies. Curr. Robot. Rep. 2020, 1, 43–48. [Google Scholar] [CrossRef] [Green Version]
- Neupane, K.; Baysal-Gurel, F. Automatic identification and monitoring of plant diseases using unmanned aerial vehicles: A review. Remote Sens. 2021, 13, 3841. [Google Scholar] [CrossRef]
- Abbas, A.; Jain, S.; Gour, M.; Vankudothu, S. Tomato plant disease detection using transfer learning with C-GAN synthetic images. Comput. Electron. Agric. 2021, 187, 106279. [Google Scholar] [CrossRef]
- Hamdani, H.; Septiarini, A.; Sunyoto, A.; Suyanto, S.; Utaminingrum, F. Detection of oil palm leaf disease based on color histogram and supervised classifier. Optik 2021, 245, 167753. [Google Scholar] [CrossRef]
- Sun, H.; Xu, H.; Liu, B.; He, D.; He, J.; Zhang, H.; Geng, N. MEAN-SSD: A novel real-time detector for apple leaf diseases using improved light-weight convolutional neural networks. Comput. Electron. Agric. 2021, 189, 106379. [Google Scholar] [CrossRef]
- Pothen, M.E.; Pai, M.L. Detection of rice leaf diseases using image processing. In Proceedings of the 2020 Fourth International Conference on Computing Methodologies and Communication (ICCMC), Erode, India, 11–13 March 2020; pp. 424–430. [Google Scholar]
- Kelman, A.; Pelczar Michael, J.; Shurtleff Malcolm, C.; Pelczar Rita, M. Plant Disease. Available online: https://www.britannica.com/science/plant-disease (accessed on 15 December 2021).
- Cerda, R.; Avelino, J.; Gary, C.; Tixier, P.; Lechevallier, E.; Allinne, C. Primary and secondary yield losses caused by pests and diseases: Assessment and modeling in coffee. PLoS ONE 2017, 12, e0169133. [Google Scholar] [CrossRef] [PubMed] [Green Version]
- Kaur, M.; Bhatia, R. Leaf disease detection and classification: A comprehensive survey. In Proceedings of the International Conference on IoT Inclusive Life (ICIIL 2019), Chandigarh, India, 19–20 December 2019; pp. 291–304. [Google Scholar]
- Singh, V.; Misra, A. Detection of unhealthy region of plant leaves using image processing and genetic algorithm. In Proceedings of the 2015 International Conference on Advances in Computer Engineering and Applications, Ghaziabad, India, 19–20 March 2015; pp. 1028–1032. [Google Scholar]
- Karthika, J.; Santhose, M.; Sharan, T. Disease detection in cotton leaf spot using image processing. J. Phys. Conf. Ser. 2021, 1916, 012224. [Google Scholar] [CrossRef]
- Devaraj, A.; Rathan, K.; Jaahnavi, S.; Indira, K. Identification of plant disease using image processing technique. In Proceedings of the 2019 International Conference on Communication and Signal Processing (ICCSP), Chennai, India, 4–6 April 2019; pp. 0749–0753. [Google Scholar]
- Mojjada, R.K.; Kumar, K.K.; Yadav, A.; Prasad, B.S.V. Detection of plant leaf disease using digital image processing. Mater. Today Proc. 2020. [Google Scholar] [CrossRef]
- Iqbal, M.A.; Talukder, K.H. Detection of potato disease using image segmentation and machine learning. In Proceedings of the 2020 International Conference on Wireless Communications Signal Processing and Networking (WiSPNET), Chennai, India, 4–6 August 2020; pp. 43–47. [Google Scholar]
- Srivastava, A.R.; Venkatesan, M. Tea leaf disease prediction using texture-based image processing. In Emerging Research in Data Engineering Systems and Computer Communications; Springer: Berlin/Heidelberg, Germany, 2020; pp. 17–25. [Google Scholar]
- Whitmire, C.D.; Vance, J.M.; Rasheed, H.K.; Missaoui, A.; Rasheed, K.M.; Maier, F.W. Using machine learning and feature selection for alfalfa yield prediction. AI 2021, 2, 6. [Google Scholar] [CrossRef]
- Ferentinos, K.P. Deep learning models for plant disease detection and diagnosis. Comput. Electron. Agric. 2018, 145, 311–318. [Google Scholar] [CrossRef]
- Fuentes, A.; Yoon, S.; Kim, S.C.; Park, D.S. A robust deep-learning-based detector for real-time tomato plant diseases and pests recognition. Sensors 2017, 17, 2022. [Google Scholar] [CrossRef] [Green Version]
- Geetharamani, G.; Pandian, A. Identification of plant leaf diseases using a nine-layer deep convolutional neural network. Comput. Electr. Eng. 2019, 76, 323–338. [Google Scholar]
- Chen, J.; Chen, J.; Zhang, D.; Sun, Y.; Nanehkaran, Y.A. Using deep transfer learning for image-based plant disease identification. Comput. Electron. Agric. 2020, 173, 105393. [Google Scholar] [CrossRef]
- Singh, D.; Jain, N.; Jain, P.; Kayal, P.; Kumawat, S.; Batra, N. PlantDoc: A dataset for visual plant disease detection. In Proceedings of the 7th ACM IKDD CoDS and 25th COMAD, Hyderabad, India, 5–7 January 2020; pp. 249–253. [Google Scholar]
- Al-bayati, J.S.H.; Üstündağ, B.B. Evolutionary feature optimization for plant leaf disease detection by deep neural networks. Int. J. Comput. Intell. Syst. 2020, 13, 12–23. [Google Scholar] [CrossRef] [Green Version]
- Arsenovic, M.; Karanovic, M.; Sladojevic, S.; Anderla, A.; Stefanovic, D. Solving current limitations of deep learning based approaches for plant disease detection. Symmetry 2019, 11, 939. [Google Scholar] [CrossRef] [Green Version]
- Costa, J.; Silva, C.; Ribeiro, B. Hierarchical deep learning approach for plant disease detection. In Proceedings of the Iberian Conference on Pattern Recognition and Image Analysis, Madrid, Spain, 1–4 July 2019; pp. 383–393. [Google Scholar]
- Ramcharan, A.; Baranowski, K.; McCloskey, P.; Ahmed, B.; Legg, J.; Hughes, D.P. Deep learning for image-based cassava disease detection. Front. Plant Sci. 2017, 8, 1852. [Google Scholar] [CrossRef] [PubMed] [Green Version]
- Too, E.C.; Yujian, L.; Njuki, S.; Yingchun, L. A comparative study of fine-tuning deep learning models for plant disease identification. Comput. Electron. Agric. 2019, 161, 272–279. [Google Scholar] [CrossRef]
- Mohanty, S.P.; Hughes, D.P.; Salathé, M. Using deep learning for image-based plant disease detection. Front. Plant Sci. 2016, 7, 1419. [Google Scholar] [CrossRef] [PubMed] [Green Version]
- Zhu, H.; Cen, H.; Zhang, C.; He, Y. Early detection and classification of tobacco leaves inoculated with tobacco mosaic virus based on hyperspectral imaging technique. In Proceedings of the 2016 ASABE Annual International Meeting, Orlando, FL, USA, 17–20 July 2016; p. 1. [Google Scholar]
- Zhu, H.; Chu, B.; Zhang, C.; Liu, F.; Jiang, L.; He, Y. Hyperspectral imaging for presymptomatic detection of tobacco disease with successive projections algorithm and machine-learning classifiers. Sci. Rep. 2017, 7, 4125. [Google Scholar] [CrossRef] [PubMed] [Green Version]
- Cui, S.; Ling, P.; Zhu, H.; Keener, H.M. Plant pest detection using an artificial nose system: A review. Sensors 2018, 18, 378. [Google Scholar] [CrossRef] [PubMed] [Green Version]
- Ma, J.; Du, K.; Zheng, F.; Zhang, L.; Gong, Z.; Sun, Z. A recognition method for cucumber diseases using leaf symptom images based on deep convolutional neural network. Comput. Electron. Agric. 2018, 154, 18–24. [Google Scholar] [CrossRef]
- Tran, T.-T.; Choi, J.-W.; Le, T.-T.H.; Kim, J.-W. A comparative study of deep CNN in forecasting and classifying the macronutrient deficiencies on development of tomato plant. Appl. Sci. 2019, 9, 1601. [Google Scholar] [CrossRef] [Green Version]
- Tian, Y.; Yang, G.; Wang, Z.; Wang, H.; Li, E.; Liang, Z. Apple detection during different growth stages in orchards using the improved YOLO-V3 model. Comput. Electron. Agric. 2019, 157, 417–426. [Google Scholar] [CrossRef]
- De Luna, R.G.; Dadios, E.P.; Bandala, A.A. Automated image capturing system for deep learning-based tomato plant leaf disease detection and recognition. Proceedings of TENCON 2018-2018 IEEE Region 10 Conference, Jeju Island, Korea, 28−31 October 2018; pp. 1414–1419. [Google Scholar]
- Bioucas-Dias, J.M.; Plaza, A.; Camps-Valls, G.; Scheunders, P.; Nasrabadi, N.; Chanussot, J. Hyperspectral remote sensing data analysis and future challenges. IEEE Geosci. Remote Sens. Mag. 2013, 1, 6–36. [Google Scholar] [CrossRef] [Green Version]
- Mananze, S.; Pôças, I.; Cunha, M. Retrieval of maize leaf area index using hyperspectral and multispectral data. Remote Sens. 2018, 10, 1942. [Google Scholar] [CrossRef] [Green Version]
- Rumpf, T.; Mahlein, A.-K.; Steiner, U.; Oerke, E.-C.; Dehne, H.-W.; Plümer, L. Early detection and classification of plant diseases with support vector machines based on hyperspectral reflectance. Comput. Electron. Agric. 2010, 74, 91–99. [Google Scholar] [CrossRef]
- Ng, W.; Minasny, B.; Malone, B.P.; Sarathjith, M.; Das, B.S. Optimizing wavelength selection by using informative vectors for parsimonious infrared spectra modelling. Comput. Electron. Agric. 2019, 158, 201–210. [Google Scholar] [CrossRef]
- Wei, C.; Huang, J.; Wang, X.; Blackburn, G.A.; Zhang, Y.; Wang, S.; Mansaray, L.R. Hyperspectral characterization of freezing injury and its biochemical impacts in oilseed rape leaves. Remote Sens. Environ. 2017, 195, 56–66. [Google Scholar] [CrossRef] [Green Version]
- Xie, C.; Shao, Y.; Li, X.; He, Y. Detection of early blight and late blight diseases on tomato leaves using hyperspectral imaging. Sci. Rep. 2015, 5, 16564. [Google Scholar] [CrossRef]
- Chen, W.-L.; Lin, Y.-B.; Ng, F.-L.; Liu, C.-Y.; Lin, Y.-W. RiceTalk: Rice blast detection using internet of things and artificial intelligence technologies. IEEE Internet Things J. 2019, 7, 1001–1010. [Google Scholar] [CrossRef]
- Krishna, M.; Sulthana, S.F.; Sireesha, V.; Prasanna, Y.; Sucharitha, V. Plant disease detection and pesticide spraying using dip and IoT. J. Emerg. Technol. Innov. Res. 2019, 6, 54–58. [Google Scholar]
- Mishra, M.; Choudhury, P.; Pati, B. Modified ride-NN optimizer for the IoT based plant disease detection. J. Ambient Intell. Humaniz. Comput. 2021, 12, 691–703. [Google Scholar] [CrossRef]
- Truong, T.; Dinh, A.; Wahid, K. An IoT environmental data collection system for fungal detection in crop fields. In Proceedings of the 2017 IEEE 30th Canadian Conference on Electrical and Computer Engineering (CCECE), Windsor, ON, Canada, 30 April−3 May 2017; pp. 1–4. [Google Scholar]
- Devi, R.D.; Nandhini, S.A.; Hemalatha, R.; Radha, S. IoT enabled efficient detection and classification of plant diseases for agricultural applications. In Proceedings of the 2019 International Conference on Wireless Communications, Signal Processing and Networking (WiSPNET), Chennai, India, 21−23 March 2019; pp. 447–451. [Google Scholar]
- Kumar, S.; Prasad, K.; Srilekha, A.; Suman, T.; Rao, B.D.; Krishna, J.N.V. Leaf disease detection and classification based on machine learning. In Proceedings of the 2020 International Conference on Smart Technologies in Computing, Electrical and Electronics (ICSTCEE), Bengaluru, Karnataka, India, 10−11 July 2020; pp. 361–365. [Google Scholar]
- Mallick, D.K.; Ray, R.; Dash, S.R. Detection and classification of crop diseases from its leaves using image processing. In Smart Intelligent Computing and Applications; Springer: Berlin/Heidelberg, Germany, 2020; pp. 215–228. [Google Scholar]
- Gurrala, K.K.; Yemineni, L.; Rayana, K.S.R.; Vajja, L.K. A new segmentation method for plant disease diagnosis. In Proceedings of the 2019 2nd International Conference on Intelligent Communication and Computational Techniques (ICCT), Jaipur, India, 28−29 September 2019; pp. 137–141. [Google Scholar]
- Karthikeyan, N.; Anjana, M.; Anusha, S.; Divya, R.; Vinod, A. Leaf disease detection using image processing. Int. J. Innov. Sci. Eng. Technol. 2020, 7. [Google Scholar] [CrossRef]
- Kamilaris, A.; Prenafeta-Boldú, F.X. Deep learning in agriculture: A survey. Comput. Electron. Agric. 2018, 147, 70–90. [Google Scholar] [CrossRef] [Green Version]
- Usman, A.; Bukht, T.F.N.; Ahmad, R.; Ahmad, J. Plant disease detection using internet of thing (IoT). Plant Dis. 2020, 11, 505–509. [Google Scholar]
- Reddy, K.A.; Reddy, N.M.C.; Sujatha, S. Precision method for pest detection in plants using the clustering algorithm in image processing. In Proceedings of the 2020 International Conference on Communication and Signal Processing (ICCSP), Chennai, India, 28−30 July 2020; pp. 894–897. [Google Scholar]
- Khan, M.A. Detection and classification of plant diseases using image processing and multiclass support vector machine. Int. J. Comput. Trends Technol. 2020, 68, 5–11. [Google Scholar] [CrossRef]
- Sawant, C.; Shirgaonkar, M.; Khule, S.; Jadhav, P. Plant disease detection using image processing techniques. 2020. Available online: https://www.semanticscholar.org/paper/Plant-Disease-Detection-using-Image-Processing-Sawant-Shirgaonkar/d9a26b87f1879821fea0cd1944279cd51359d0c5 (accessed on 15 December 2021).
- Fulari, U.N.; Shastri, R.K.; Fulari, A.N. Leaf disease detection using machine learning. J. Seybold Rep. 2020, 1533, 9211. [Google Scholar]
- Ouhami, M.; Es-Saady, Y.; El Hajji, M.; Hafiane, A.; Canals, R.; El Yassa, M. Deep transfer learning models for tomato disease detection. In Proceedings of the International Conference on Image and Signal Processing, Marrakesh, Morocco, 4–6 June 2020; pp. 65–73. [Google Scholar]
- Deepa. A pre processing approach for accurate identification of plant diseases in leaves. In Proceedings of the 2018 International Conference on Electrical, Electronics, Communication, Computer, and Optimization Techniques (ICEECCOT), Mysuru, India, 14–15 December 2018; pp. 249–252. [Google Scholar]
- Win, T.T. AI and IoT Methods for Plant Disease Detection in Myanmar. Kobe Institute of Computing: Kobe, Tokyo, 2018. [Google Scholar]
- Sun, G.; Jia, X.; Geng, T. Plant diseases recognition based on image processing technology. J. Electr. Comput. Eng. 2018, 2018, 6070129. [Google Scholar] [CrossRef] [Green Version]
- Thorat, A.; Kumari, S.; Valakunde, N.D. An IoT based smart solution for leaf disease detection. In Proceedings of the 2017 International Conference on Big Data, IoT and Data Science (BID), Pune, India, 20–22 December 2017; pp. 193–198. [Google Scholar]
- Moghadam, P.; Ward, D.; Goan, E.; Jayawardena, S.; Sikka, P.; Hernandez, E. Plant disease detection using hyperspectral imaging. In Proceedings of the 2017 International Conference on Digital Image Computing: Techniques and Applications (DICTA), Sydney, Australia, 29 November–1 December 2017; pp. 1–8. [Google Scholar]
- Khirade, S.D.; Patil, A. Plant disease detection using image processing. In Proceedings of the 2015 International Conference on Computing Communication Control and Automation, Pune, India, 26−27 February 2015; pp. 768–771. [Google Scholar]
- Arivazhagan, S.; Shebiah, R.N.; Ananthi, S.; Varthini, S.V. Detection of unhealthy region of plant leaves and classification of plant leaf diseases using texture features. Agric. Eng. Int. CIGR J. 2013, 15, 211–217. [Google Scholar]
- Han, S.; Cointault, F. Détection précoce de maladies sur feuilles par traitement d’images. HAL Open Sci. Available online: https://hal.archives-ouvertes.fr/hal-00829402/document (accessed on 15 December 2021).
- Revathi, P.; Latha, M.H. Classification of Cotton Leaf Spot Diseases Using Image Processing Edge Detection Techniques; IEEE: Piscataway, NJ, USA, 2012; pp. 169–173. [Google Scholar] [CrossRef]
- Yerpude, A.; Dubey, S. Colour image segmentation using K-medoids clustering. Int. J. Comput. Technol. Appl. 2012, 3, 152–154. [Google Scholar]
- Chaudhary, P.; Chaudhari, A.K.; Cheeran, A.; Godara, S. Color transform based approach for disease spot detection on plant leaf. Int. J. Comput. Sci. Telecommun. 2012, 3, 65–70. [Google Scholar]
- Al-Hiary, H.; Bani-Ahmad, S.; Reyalat, M.; Braik, M.; Alrahamneh, Z. Fast and accurate detection and classification of plant diseases. Int. J. Comput. Appl. 2011, 17, 31–38. [Google Scholar] [CrossRef]
- Bauriegel, E.; Giebel, A.; Geyer, M.; Schmidt, U.; Herppich, W. Early detection of Fusarium infection in wheat using hyper-spectral imaging. Comput. Electron. Agric. 2011, 75, 304–312. [Google Scholar] [CrossRef]
- Janiesch, C.; Zschech, P.; Heinrich, K. Machine learning and deep learning. Electron. Mark. 2021, 1–11. [Google Scholar] [CrossRef]
- Panigrahi, K.P.; Das, H.; Sahoo, A.K.; Moharana, S.C. Maize leaf disease detection and classification using machine learning algorithms. In Progress in Computing, Analytics and Networking; Springer: Singapore, 2020; pp. 659–669. [Google Scholar]
- Zhao, J.; Xu, C.; Xu, J.; Huang, L.; Zhang, D.; Liang, D. Forecasting the wheat powdery mildew (Blumeria graminis f. Sp. tritici) using a remote sensing-based decision-tree classification at a provincial scale. Australas. Plant Pathol. 2018, 47, 53–61. [Google Scholar] [CrossRef]
- Zhang, J.; Pu, R.; Yuan, L.; Huang, W.; Nie, C.; Yang, G. Integrating remotely sensed and meteorological observations to forecast wheat powdery mildew at a regional scale. IEEE J. Sel. Top. Appl. Earth Obs. Remote Sens. 2014, 7, 4328–4339. [Google Scholar] [CrossRef]
- Fenu, G.; Malloci, F.M. Artificial intelligence technique in crop disease forecasting: A case study on potato late blight prediction. In Proceedings of the International Conference on Intelligent Decision Technologies, Split, Croatia, 17–19 June 2020; pp. 79–89. [Google Scholar]
- Fenu, G.; Malloci, F.M. An application of machine learning technique in forecasting crop disease. In Proceedings of the 2019 3rd International Conference on Big Data Research, Paris, France, 20–22 November 2019; pp. 76–82. [Google Scholar]
- Hsieh, J.-Y.; Huang, W.; Yang, H.-T.; Lin, C.-C.; Fan, Y.-C.; Chen, H. Building the Rice Blast Disease Prediction Model Based on Machine Learning and Neural Networks; EasyChair: Manchester, UK, 2019. [Google Scholar]
- Kim, Y.; Roh, J.-H.; Kim, H.Y. Early forecasting of rice blast disease using long short-term memory recurrent neural networks. Sustainability 2018, 10, 34. [Google Scholar] [CrossRef] [Green Version]
- Duarte-Carvajalino, J.M.; Alzate, D.F.; Ramirez, A.A.; Santa-Sepulveda, J.D.; Fajardo-Rojas, A.E.; Soto-Suárez, M. Evaluating late blight severity in potato crops using unmanned aerial vehicles and machine learning algorithms. Remote Sens. 2018, 10, 1513. [Google Scholar] [CrossRef] [Green Version]
- Mahlein, A.-K.; Kuska, M.T.; Behmann, J.; Polder, G.; Walter, A. Hyperspectral sensors and imaging technologies in phytopathology: State of the art. Annu. Rev. Phytopathol. 2018, 56, 535–558. [Google Scholar] [CrossRef]
- Kadir, A.; Nugroho, L.E.; Susanto, A.; Santosa, P.I. Performance improvement of leaf identification system using principal component analysis. Int. J. Adv. Sci. Technol. 2012, 44, 113–124. [Google Scholar]
- Turkoglu, M.; Hanbay, D. Recognition of plant leaves: An approach with hybrid features produced by dividing leaf images into two and four parts. Appl. Math. Comput. 2019, 352, 1–14. [Google Scholar] [CrossRef]
- Ngugi, L.C.; Abelwahab, M.; Abo-Zahhad, M. Recent advances in image processing techniques for automated leaf pest and disease recognition–A review. Inf. Process. Agric. 2021, 8, 27–51. [Google Scholar] [CrossRef]
- Ahmed, K.; Shahidi, T.R.; Alam, S.M.I.; Momen, S. Rice leaf disease detection using machine learning techniques. In Proceedings of the 2019 International Conference on Sustainable Technologies for Industry 4.0 (STI), Dhaka, Bangladesh, 24–25 December 2019; pp. 1–5. [Google Scholar]
- Barbedo, J.G. Factors influencing the use of deep learning for plant disease recognition. Biosyst. Eng. 2018, 172, 84–91. [Google Scholar] [CrossRef]
- Sambasivam, G.; Opiyo, G.D. A predictive machine learning application in agriculture: Cassava disease detection and classification with imbalanced dataset using convolutional neural networks. Egypt. Inform. J. 2021, 22, 27–34. [Google Scholar] [CrossRef]
- Hochreiter, S. Untersuchungen zu dynamischen neuronalen Netzen. Master Thesis, Technische Universität München, München, Germany, 1991. [Google Scholar]
- Or, B. The Exploding and Vanishing Gradients Problem in Time Series. Available online: https://towardsdatascience.com/the-exploding-and-vanishing-gradients-problem-in-time-series-6b87d558d22 (accessed on 15 December 2021).
- Hasan, R.I.; Yusuf, S.M.; Alzubaidi, L. Review of the state of the art of deep learning for plant diseases: A broad analysis and discussion. Plants 2020, 9, 1302. [Google Scholar] [CrossRef]
- Ahmad, M.; Abdullah, M.; Moon, H.; Han, D. Plant disease detection in imbalanced datasets using efficient convolutional neural networks with stepwise transfer learning. IEEE Access 2021, 9, 140565–140580. [Google Scholar] [CrossRef]
- Bock, C.; Cook, A.; Parker, P.; Gottwald, T. Automated image analysis of the severity of foliar citrus canker symptoms. Plant Dis. 2009, 93, 660–665. [Google Scholar] [CrossRef] [PubMed]
- Pydipati, R.; Burks, T.; Lee, W. Identification of citrus disease using color texture features and discriminant analysis. Comput. Electron. Agric. 2006, 52, 49–59. [Google Scholar] [CrossRef]
- Guo, W.; Rage, U.K.; Ninomiya, S. Illumination invariant segmentation of vegetation for time series wheat images based on decision tree model. Comput. Electron. Agric. 2013, 96, 58–66. [Google Scholar] [CrossRef]
- Pourreza, A.; Lee, W.S.; Raveh, E.; Ehsani, R.; Etxeberria, E. Citrus Huanglongbing detection using narrow-band imaging and polarized illumination. Trans. ASABE 2014, 57, 259–272. [Google Scholar]
- Zhou, R.; Kaneko, S.I.; Tanaka, F.; Kayamori, M.; Shimizu, M. Image-based field monitoring of Cercospora leaf spot in sugar beet by robust template matching and pattern recognition. Comput. Electron. Agric. 2015, 116, 65–79. [Google Scholar] [CrossRef]
- Olmstead, J.W.; Lang, G.A.; Grove, G.G. Assessment of severity of powdery mildew infection of sweet cherry leaves by digital image analysis. HortScience 2001, 36, 107–111. [Google Scholar] [CrossRef] [Green Version]
- Moya, E.; Barrales, L.; Apablaza, G. Assessment of the disease severity of squash powdery mildew through visual analysis, digital image analysis and validation of these methodologies. Crop. Prot. 2005, 24, 785–789. [Google Scholar] [CrossRef]
- Oberti, R.; Marchi, M.; Tirelli, P.; Calcante, A.; Iriti, M.; Borghese, A.N. Automatic detection of powdery mildew on grapevine leaves by image analysis: Optimal view-angle range to increase the sensitivity. Comput. Electron. Agric. 2014, 104, 1–8. [Google Scholar] [CrossRef]
- Ahmad, I.S.; Reid, J.F.; Paulsen, M.R.; Sinclair, J.B. Color classifier for symptomatic soybean seeds using image processing. Plant Dis. 1999, 83, 320–327. [Google Scholar] [CrossRef] [PubMed]
- Wiwart, M.; Fordoński, G.; Żuk-Gołaszewska, K.; Suchowilska, E. Early diagnostics of macronutrient deficiencies in three legume species by color image analysis. Comput. Electron. Agric. 2009, 65, 125–132. [Google Scholar] [CrossRef]
- Camargo, A.; Smith, J. An image-processing based algorithm to automatically identify plant disease visual symptoms. Biosyst. Eng. 2009, 102, 9–21. [Google Scholar] [CrossRef]
- Liu, J.; Wang, X. Plant diseases and pests detection based on deep learning: A review. Plant Methods 2021, 17, 1–18. [Google Scholar] [CrossRef]
- Hughes, D.; Salathé, M. An open access repository of images on plant health to enable the development of mobile disease diagnostics. arXiv 2015, arXiv:1511.08060. [Google Scholar]
- Cucci, C.; Casini, A. Hyperspectral imaging for artworks investigation. In Data Handling in Science and Technology; Elsevier: Amsterdam, The Netherlands, 2020; Volume 32, pp. 583–604. [Google Scholar]
- Alzubaidi, L.; Zhang, J.; Humaidi, A.J.; Al-Dujaili, A.; Duan, Y.; Al-Shamma, O.; Santamaría, J.; Fadhel, M.A.; Al-Amidie, M.; Farhan, L. Review of deep learning: Concepts, CNN architectures, challenges, applications, future directions. J. Big Data 2021, 8, 1–74. [Google Scholar]
- Shorten, C.; Khoshgoftaar, T.M. A survey on image data augmentation for deep learning. J. Big Data 2019, 6, 1–48. [Google Scholar] [CrossRef]
- Laurent, C.; Pereyra, G.; Brakel, P.; Zhang, Y.; Bengio, Y. Batch normalized recurrent neural networks. In Proceedings of the 2016 IEEE International Conference on Acoustics, Speech and Signal Processing (ICASSP), Shanghai, China, 20–25 March 2016; pp. 2657–2661. [Google Scholar]
- Zhang, G.; Wang, C.; Xu, B.; Grosse, R. Three mechanisms of weight decay regularization. arXiv 2018, arXiv:1810.12281. [Google Scholar]
- Srivastava, N.; Hinton, G.; Krizhevsky, A.; Sutskever, I.; Salakhutdinov, R. Dropout: A simple way to prevent neural networks from overfitting. J. Mach. Learn. Res. 2014, 15, 1929–1958. [Google Scholar]
- Maaten, L.; Chen, M.; Tyree, S.; Weinberger, K. Learning with marginalized corrupted features. In Proceedings of the International Conference on Machine Learning, Atlanta, GA, USA, 16–21 June 2013; pp. 410–418. [Google Scholar]
- Pereyra, G.; Tucker, G.; Chorowski, J.; Kaiser, Ł.; Hinton, G. Regularizing neural networks by penalizing confident output distributions. arXiv 2017, arXiv:1701.06548. [Google Scholar]
- Kadam, S.; Vaidya, V. Review and analysis of zero, one and few shot learning approaches. In Proceedings of the International Conference on Intelligent Systems Design and Applications, Vellore, India, 6–8 December 2018; pp. 100–112. [Google Scholar]
- Zhuang, F.; Qi, Z.; Duan, K.; Xi, D.; Zhu, Y.; Zhu, H.; Xiong, H.; He, Q. A comprehensive survey on transfer learning. Proc. IEEE 2020, 109, 43–76. [Google Scholar] [CrossRef]
- Chatterjee, S.K.; Malik, O.; Gupta, S. Chemical sensing employing plant electrical signal response-classification of stimuli using curve fitting coefficients as features. Biosensors 2018, 8, 83. [Google Scholar] [CrossRef] [Green Version]


| Plant Leaf | Diseases | Symptoms | Pathogen Category |
|---|---|---|---|
| Rice |
|
|
|
| Cotton |
|
|
|
| Citrus |
|
|
|
| Tomato |
|
|
|
| Maize |
|
|
|
| Wheat |
|
|
|
| Watermelon |
|
|
|
| Year | Authors | Model | Dataset | Accuracy | |||
|---|---|---|---|---|---|---|---|
| Crop Name | Nb of Classes | Nb of Images | Name of Dataset | ||||
| 2020 | Singh et al. [37] | MobileNet, R-CNN | 13 types | 27 | 2598 | PlantVillage | 70.53% |
| 2020 | Al-bayati et al. [38] | DNN, SURF, GOA | Apple | 6 | 2539 | PlantVillage | 98.28% |
| 2019 | Arsenovic et al. [39] | CNN-Multichannel | 12 species of crops | 42 | 79,265 | PlantVillage | 93.67% |
| 2019 | Costa et al. [40] | InceptionV3 and CNN using a Hierarchical Approach | Apple, Tomato, peach | 16 | 24,000 | PlantVillage | 97.74% |
| 2019 | Geetharamani et al. [35] | 9-layer deep CNN | 14 species of crops | 39 | 61,486 | Leaf disease dataset | 96.46% |
| 2018 | De Luna et al. [50] | CNN, Faster R-CNN | Tomato | 4 | 4923 | Own | 91.67% |
| 2018 | Ferentinos et al. [33] | Overfeat, VGG16, AlexNet | 25 species of crops | 58 | 87,848 | Open Dataset | 99.53% |
| Researchers | Detection Techniques and Algorithms | Parameter Evaluation |
|---|---|---|
| M. Mishra et al. [39] 2021 | An IoT-based automated plant disease monitoring and detection system, using the median filter and a modified optimizer called the SCA-based RideNN Cycling Neural Network | The RideNN model based on SCA achieved accuracy of 91.56% |
| Devi et al. [37] 2019 | IoT system using GLCM, RFC, and k-means clustering | The overall accuracy of disease detection and classification based on RFC-GLCM was almost 99.99% |
| Krishna et al. [38] 2019 | IoT system using SVM and k-means clustering | An immediate SMS alert to the farmer |
| Chen et al. [36] 2019 | RiceTalk platform using an AI model and IoT devices | Net prediction accuracy was 89.4% |
| Win et al. [41] 2018 | IoT-based remote rice monitoring IoT system using deep learning and transfer learning | Real-time monitoring of environmental parameters |
| Truong et al. [40] 2017 | IoT system using SVM | Real time analysis |
| Title | Methodology | Advantages | Disadvantages |
|---|---|---|---|
| Tomato plant disease detection using transfer learning with C-GAN synthetic images (Abbas et al., 2021) [19] | This research paper provides a DL-based method for detecting tomato disease that uses the C-GAN to generate the synthetic images of tomato leaves for data augmentation purposes. Then, a pre-trained DenseNet121 model is fine-tuned on synthetic and real images to classify tomato leaves images into ten disease categories. |
|
|
| MEAN-SSD: A novel real-time detector for apple leaf diseases using improved light-weight convolutional neural networks (Sun et al., 2021) [21] |
|
|
|
| Detection of oil palm leaf disease based on color histogram and supervised classifier (Hamdani et al., 2021)[20] |
|
|
|
| Detection of Rice Leaf Diseases Using Image Processing (Pothen et al., 2020) [22] | The proposed system identifies three diseases (bacterial leaf blight, leaf smut, and brown spot) that affect rice plant leaves using IP and ML techniques. This system, in turn, helps farmers save their crops at an early stage. As a first step in the process sequence, the images are collected and further pre-processed to ensure that the image features are upgraded and undesired distortions are eliminated, followed by segmenting the images through the Otsu thresholding algorithm. Using the segmented area, a range of features are extracted using the LBP and HOG. Then, these obtained features are classified using the SVM and reached 94.6%. |
|
|
| Image Processing Technologies for Automatic Detection of Plant Disease and Alerting System in Agricultural Farms (Mugithe et al., 2020) [7] | The authors developed a system able to detect leaf diseases and alert the farmer in case of the need to promptly act to circumvent the spread of the disease in the field. They employed IP techniques that entail six steps. Firstly, the leaf images were taken in real time via a webcam connected to RaspberryPi. Secondly, the images were pre-processed, segmented, and clustered using the k-means clustering algorithm, then features (e.g., perimeter and light intensity) were retrieved from the images. Lastly, these extracted features were evaluated to classify the leaf diseases. Once the disease is detected, the buzzer rings and an alert is generated so that the farmer can intervene promptly. Note that this system works in two ways, namely in the GUI and in real time. |
|
|
| Plant Disease Detection Using Internet of Thing (IoT) (Usman et al., 2020) [67] | This paper presents the innovation of the IoT in agricultural infection and insect pest control. Data on insects and diseases are collected using a WSN, so an IoT-based control framework was proposed to obtain horticultural data from a farm with levels of trees and three frameworks. First, a computation framework was deployed to deem whether the plant is healthy or affected and second, an automated framework determined the disease closeness in the plants, and a mechanized framework was then set up to recognize the diseases through humidity, temperature, and shade sensors. Thus, through its sensors, the plants’ progress is registered and then dissected using Arduino programming. Then, this collected information is transmitted to the cloud by WIFI to be processed and analyzed. Eventually, this information is compared to the whole data to determine if the studied plant is healthy or affected. |
|
|
| Detection of Plant Leaf Disease using Digital Image Processing (Mojjada et al., 2020) [29] | This article focuses on the early identification of plant leaf diseases by image analysis. Thus, automated disease detection reduces the work for monitoring agricultural sites. The identification of diseases is carried out through various IP techniques and ML; in particular, a genetic optimization algorithm was used after image segmentation by k-means to obtain optimized results and they also exploited SVM for disease classification. |
|
|
| Precision Method for Pest Detection in Plants using the Clustering Algorithm in Image Processing (Reddy et al., 2020) [68] | This work presents an accurate method for detecting pests in plants using the k-means clustering algorithm. Disease recognition involves steps such as image acquisition, image preprocessing, segmentation, and classification. First, the RGB leaf images were converted to HSV for partitioning, and then the median filter and boundary detection algorithm were both applied during the pre-processing step to suppress the clamor. Finally, the k-means clustering was employed to cluster the images. |
|
|
| Detection and Classification of Plant Diseases Using Image Processing and Multiclass Support Vector Machine (Khan et al., 2020) [69] | The authors described a framework for plant disease using ML and IP techniques. First, the suggested algorithm is applied to a 148-image dataset which contains 5 types of leaves diseases, namely, Alternaria, fire blight, Anthracnose, and Cercospora leaf spot, and the plant images were split up into two sets. A training set is composed of 73 images and a testing set is composed of 75 images. Then, image segmentation is performed to isolate the pathogenic parts of the leaf. Then, 13 texture features were extracted from the image, of which, nine features (standard deviation, variance, mean, entropy, smoothness, skewness, RMS root mean square, inverse difference, and kurtosis) are calculated using the assigned segment in RGB color space. The other four features (homogeneity, contrast, energy, and correlation) are determined from a grayscale image. Finally, the healthy and diseased leaves are classified based on the feature vector extracted using SVM. |
|
|
| Evolutionary feature optimization for plant leaf disease detection by deep neural networks (Al-bayati et al., 2020) [38] | The researchers used a DNN for apple leaf disease identification, namely black rot, apple scab, and cedar rust, by applying the GOA and Robust Accelerated Feature SURF, where GOA was employed for feature optimization and SURF was applied for feature extraction. Prior to the implementation of DNN, many steps were performed, such as the image improvement in the pre-processing process and the ROI segmentation. Then, the features were extracted using the SURF descriptor, followed by the optimization by the GOA algorithm, and, finally, the disease classification was carried out by the use of DNN. |
|
|
| Leaf Disease Detection using Image Processing (Karthikeyan et al., 2020) [65] | This research used IP techniques along with the SVM classifier to detect plant diseases. The identification of plant diseases requires the steps of transforming an RGB image to grayscale, then enhancing the image using the adaptive color histogram AHE, extracting 13 textural features using the GLCM and, finally, using SVM to classify the different types of diseases. Note that more than 500 images were taken for training and testing with intensity values ranging from 0 to 255. |
|
|
| Plant disease detection using image processing techniques(Sawant et al., 2020) [70] | An IM and DL techniques-based approach was proposed for plant disease identification. First, pictures of healthy and unhealthy leaves are acquired and then stored in the database for preprocessing. Additionally, the images are pre-processed using different techniques such as histogram equalizer, Contrast Limited AHE, and image resizing. Then, once the RGB image is converted to CLAHE, it is resized to 70 × 70 for better resolution. Moreover, the leaf features are extracted and released to the CNN using the SoftMax function for plant disease classification. Note that the first layer has 1000 neurons. |
|
|
| Convolutional neural network for automatic identification of plant diseases with limited data (Afifi et al., 2020) [6] | Several approaches were developed in this study to identify plant diseases with little data. A DAML and triplet network approach was set up using three architectures of CNN (ResNet50, 34, and 18). Using a large dataset, the approaches were trained and then fitted from 5 to 50 images per disease for detecting new diseases. |
|
|
| Leaf disease detection using machine learning (Fulari et al., 2020) [71] | An efficient method for the identification of a healthy or infected leaf was presented using IP and ML techniques. The data were taken from the Kaggle website which contains more than 12,949 images. The method implies different steps such as image preprocessing, segmentation of the image, feature extraction (shape, color, and texture) with the use of GLCM, and classification with the use of SVM. |
|
|
| Deep transfer learning models for tomato disease detection (Ouhami et al., 2020) [72] | The authors conducted a study to identify the most suitable DL model for identifying tomato diseases based on RGB leaf images, which were split into 6 different kinds of infections and parasitic attacks. Thus, two architectures of DL models, namely DensNet121 with 161 layers and VGG16, were used to perform the study. |
|
|
| A new segmentation method for plant disease diagnosis (Gurrala et al., 2019) [64] | IP and AI methods were used for the recognition of diseases such as scab, anthracnose, blight, and spots on plants. First, the RGB image was converted to grayscale, and the image was then segmented using the k-means and the modified CPDA algorithm. Thus, from the result obtained, a comparison was made between these two segmentation algorithms. The statistical parameters of the segmented image were calculated using the GLCM method; that is, the characteristics (entropy, mean, variance, type, RMS, contrast, correlation, energy, homogeneity, regularity, kurtosis, asymmetry, IDM moment of difference). Finally, the SVM classifier was trained with a dataset of about 100 images of leaves affected by the disease. |
|
|
| IoT Enabled efficient Detection and Classification of Plant Diseases for Agricultural Applications (Devi et al., 2019) [61] | The authors proposed a simple and efficient IoT-based solution for the detection of bunch top and Sigatoka diseases in banana tree located on hills. First, 80 hill banana plant images are captured and then resized to 256 × 256 in the image preprocessing phase. Then, the preprocessed image is converted to a gray image. Thus, the histogram equalization technique is used to equalize the histogram of the resized gray image so that the intensities of the image are better distributed for better segmentation, which is performed by k-means clustering. From the segmented image, the GLCM features are extracted and uploaded to the cloud for further analysis. From these extracted characteristics, the hill banana diseases are classified using the RFC technique. Finally, the data is collected and analyzed by agricultural experts. In addition, this system allows remote monitoring of environmental parameters such as soil humidity and temperature to prevent diseases caused by climate change and pathogens as much as possible. |
|
|
| A Preprocessing Approach for Accurate Identification of Plant Diseases in Leaves (Deepa et al., 2018) [73] | In this paper, the proposed method takes RGB images as the input and applies the preprocessing methods, such as image sharpness and median filters, to eliminate the noise from images, and for deblurring and edge detection. Then, these images were segmented using k-means clustering. It should be mentioned that they used the peak signal-to-noise ratio in order to measure the quality of the images. |
|
|
| AI and IoT methods for plant disease detection in Myanmar (Win et al., 2018) [74] | The researchers developed two prototypes. The first is a mobile application that classifies diseases on rice plants. With this simple application, the farmer can easily identify the diseases or pests on rice plants, without using agronomists. The second is a system for monitoring temperature, atmospheric pressure, water level, and the sunlight level of rice fields. Using this system, the intensive work is reduced by remotely monitoring this environmental data from anywhere an Internet connection is available. For the development of the mobile app, they collected 6 kinds of rice pictures, of bacterial leaf blight, brown spot, rice blast, mice attack, insects, and healthy rice. In addition, they used the Arduino nano to turn off/on the solenoid valve, which was directly connected to the Raspberry Pi every 30 min, to ensure efficient power and a long system runtime. Diseases were classified using TL and DL models. |
|
|
| Plant diseases recognition based on image processing technology (Sun et al., 2018) [75] | A multiple linear regression-based plant disease identification system is presented, along with a histogram-based segmentation method for accurate and automatic threshold calculation. The proposed system is based on IP techniques including four steps: preprocessing, image segmentation, feature extraction, and regression model. First, the spatial domain image denoising is used to filter the noise. Then, an improved histogram-based segmentation method is developed to distinguish lesions from normal foliage, which automatically determines the threshold and optimizes the segmentation process. Next, the regional growth method is used for multi-point selection to extract certain disease-affected areas. Then, lesion feature extraction is performed in terms of shape, texture, and color. Finally, a multiple linear regression model is implemented to determine the type of disease, and then the least-squares estimation algorithm is used to calculate the coefficients and confidence intervals to set up the disease recognition system. |
|
|
| An IoT based smart solution for leaf disease detection (Thorat et al., 2017) [76] | This paper presents a solution based on a smart farming technique using WSN, a Raspberry PI module, and a camera to establish wireless communication. In addition, CV techniques were used, such as masking, segmentation, and feature extraction to identify leaf diseases.It should be noted that they used the Apache server to retrieve and send data. |
|
|
| Plant disease detection using hyperspectral imaging (Moghadam et al., 2017) [77] | The authors used hyperspectral imaging (SWIR and VNIR), ML techniques, and IP for detecting tomato wilt virus in capsicum plants. First, images were acquired from a hyperspectral imaging system consisting of two Headwall push-broom hyperspectral cameras, namely the SWIR hyperspectral camera that provides a spatial resolution of 384 pixels and a spectral range of 900 to 2500 with 168 spectral bands, and the VNIR hyperspectral camera, which provides a spatial resolution of 384 pixels. Then, these images were pre-processed using different pre-processing techniques such as the space-adaptive filtering approach for detection and grid removal. In addition, these images were segmented using an unsupervised k-means clustering algorithm. Further, discriminative feature extraction was performed using the full spectrum, VNIR, SWIR, and vegetation indices. Finally, these features were employed to train classifiers for discriminating leaves obtained from inoculated and healthy plants.They also used other techniques in the process of disease identification as follows:They used the KL divergence or relative entropy to estimate the distances between two distributions of the control group and of the inoculated group.Note that the high-pass filter used is a third-order Butterworth FIR filter, which is applied to flatten the power spectral density of the image in order to detect a known signal corrupted by additive white noise. |
|
|
| Deep Learning for Image-Based Cassava Disease Detection (Ramcharan et al., 2017) [41] | A new model for the identification of plant diseases is proposed based on TL to train a CNN using a dataset of 2756 images in order to identify two types of damage caused by pests and three diseases. This model was deployed on a mobile application. |
|
|
| Early detection and classification of tobacco leaves inoculated with tobacco mosaic virus based on hyperspectral imaging technique (Zhu et al., 2016) [44] | The authors proposed a procedure for the early detection of tobacco disease infected with the mosaic virus by different ML algorithms based on hyperspectral imaging techniques. Images of healthy leaves inoculated with TMV for a period of 7 days, i.e., after inoculation, were acquired by a hyperspectral imaging system every day with the VNIR wavelength region 380–1023 nm. In addition, the spectral reflectance of the predefined ROI was extracted from the hyperspectral images using the ENVI software. The different ML algorithms, namely, RF, SVM, BaBPNN, LS-SVM, PLS—DA, ELM, and LDA were used to quantitatively classify the stages of tobacco disease using EW that were selected using the SPA. |
|
|
| Plant disease detection using image processing (Khirade et al., 2015) [78] | This article discussed IP-based methods for the detection of plant diseases, in particular segmentation and feature extraction algorithms. Concerning the segmentation techniques, they exploited the k-mean clustering, boundary and spot detection algorithm, and the Otsu threshold algorithm. Regarding the feature extraction techniques, they studied various methods, such as the color co-occurrence method, and regarding the disease classification phase, they used various algorithms such as ANN, BBPN, and SVM to accurately classify various leaf diseases. |
|
|
| Detection of unhealthy region of plant leaves and classification of plant leaf diseases using texture features (Arivazhaga et al., 2013) [79] | A software solution is proposed for the detection of unhealthy regions and the automatic classification of diseases using the extracted texture characteristics. Thus, the scheme of the process consists of four steps. First, the acquired RGB leaf images were converted to HSV format. Then, the green pixels were masked and removed, followed by a segmentation process. Further, the texture characteristics were computed using the Color-Co-Occurrence Matrix and, finally, the classification was first performed using the minimum distance criterion, which yielded a gain of 86.7%. Results were then improved by the SVM classifier. |
|
|
| Early detection of diseases on leaves by image processing (Han et al., 2013)[80] | The authors worked on images of vine leaves affected by mildew at different stages that were acquired by photographic sensors. They were able to detect diseases that are visible and barely visible to the naked eye using techniques based on the image representation in color space, and hybrids including information on both color and texture. Thus, for visual plant diseases, they were oriented towards changing the color space, in particular, to facilitate detection. To ensure better visualization, they were interested in the bands of each image (the V band of the YUV color space). Regarding diseases barely visible to the eyes, as a solution, they used the image analysis method that combines color and texture information. Otherwise, the most relevant challenge was the disease detection at an early stage. As an optimal solution, they worked on thermal imaging, which is very effective in detecting water stress. Finally, they calculated the Mahalanobis distance for image segmentation. |
|
|
| Classification of cotton leaf spot disease using image processing edge detection techniques (Revathi et al., 2012) [81] | This article describes how to identify the part affected by leaf diseases using IP techniques. First, to segment the image, the authors used the Canny and Sobel edge detection technique and finally, they proposed an HPCCDD to analyze the images and classify the different diseases. |
|
|
| Color image segmentation using K-Medoids Clustering(Yerpude et al., 2012) [82] | A color image segmentation method was proposed using k-medoids clustering; the idea is to find groups of objects by finding the medoids for each group. The main objective of this paper is the critical analysis of different disease segmentation techniques. |
|
|
| Color transform-based approach for disease spot detection on plant leaf (Chaudhary et al., 2012) [83] | A comparison was made between the effect of YCbCr, HSV, and CIELAB color spaces in the disease spot detection process since disease spots are different in color but not in intensity level. First, the different images of wheat, soybeans, rice, corn, cotton, mustard, apple, magnolia, and cherry leaf were taken. Then, these RGB images were converted to YCbCr color space using the color transformation formula and further to CIELAB and HSV color space. Then, for smoothing and enhancing the image, a median filter was applied. Finally, the segmentation of the image was carried out using the Otsu method on the components of the color space: Cr for filtered YCbCr, component H for the filtered HSV space, and component A for the LAB filtered color space. |
|
|
| Fast and accurate detection and classification of plant diseases (Al-Hiary et al., 2011) [84] | The acquisition of the leaf RGB images is undertaken to perform color space transformation. Once the segmentation of these images is performed using k-means clustering, the value of the green pixels is masked using the threshold obtained through Otsu’s method. In addition, the affected clusters were converted to the hue saturation value. For texture analysis, the SGDM matrix is used for the formation of each image. Finally, the disease recognition process is performed by the ANN classifier. |
|
|
| Early detection of Fusarium infection in wheat using hyper-spectral imaging (Bauriegel et al., 2011) [85] | In this paper, Fusarium head disease was detected by spectral analysis in wheat, barley, oat, and rye plants. The PCA distinguishes affected from healthy tissue in the wavelength ranges 927–931 nm, 682–733 nm, 560–675 nm, and 500–533 nm. The SAM method is used to classify the degrees of infection. Finally, the best time to identify ear blight is the stage between 71–85 on the BBCH scale. They analyzed 292 spectra and 80 spectra for diseased and healthy tissue, respectively, in time series experiments. Smoothing was performed for these spectra with the “proc expand” function. Then, the first derivative was calculated and 104 individual spectra were subjected to PCA to assess the relevant wavelengths for discriminating between healthy and blight-infected tissue. |
|
|
| Classifier | Advantages | Drawbacks |
|---|---|---|
| Artificial Neural Network ANN | Faster and more accurate than KNN and MMC | Strict because the data can only belong to 1 class |
| Random Forest | Can classify a large data set with excellent accuracy | Constraints on storage and processing time |
| Multiclass-Support Vector Machine | Helps to classify the data in several classes | Not suitable when the data is noisy |
| Least-Square SVM | Fast and not complicated | Pruning techniques must be applied to be sparse |
| K-Nearest Neighbours KNN | No time spent on training | More time spent on testing and it is expensive to test each instance as well sensitive to noise and yields |
| Extreme learning machine ELM | Faster training and better generalization | Overfitting (occurs when a complex model has several parameters) |
| Naïve Bayes | Less training data is required. It works better than its counterparts when the assumption of an independent variable is true | Conditional independence may reduce accuracy |
| Penalized Discriminant Analysis PDA | Beneficial when the problem has a large number of noisy features | High calculation cost |
| Bag of Words | Uncomplicated, robust, efficient | It supposes that all words are independent of each other |
| CNN/Deep learning | It removes the need for a feature extraction step and classification time is shortened | A large amount of data is required for training and it is expensive to compute. They require better hardware such as Graphical Processing Unit (GPU). |
| Transfer Learning | This helps to apply CNN to problems with a small amount of training data | The pretrained model may not have classes with the desired labels all the time |
| Architecture | Recall | F1-score | Precision | Accuracy | Specificity |
|---|---|---|---|---|---|
| AlexNet | 0.9843 | 0.9856 | 0.9871 | 0.9897 | 0.9997 |
| InceptionV3 | 0.9906 | 0.9916 | 0.9926 | 0.9948 | 0.9999 |
| GoogleNet | 0.9874 | 0.9881 | 0.9891 | 0.9899 | 0.9997 |
| SqueezeNet | 0.9791 | 0.9787 | 0.9785 | 0.9837 | 0.9996 |
| DenseNet201 | 0.9965 | 0.9961 | 0.9958 | 0.9973 | 0.9999 |
| VGG16 | 0.9932 | 0.9930 | 0.9928 | 0.9951 | 0.9999 |
| ResNet101 | 0.9936 | 0.9929 | 0.9924 | 0.9851 | 0.9999 |
| ShuffleNet | 0.9901 | 0.9897 | 0.9895 | 0.9929 | 0.9998 |
| MobileNetv2 | 0.987 | 0.9862 | 0.9895 | 0.9905 | 0.9997 |
| InceptionResNetv2 | 0.9887 | 0.9893 | 0.9901 | 0.9930 | 0.9998 |
Publisher’s Note: MDPI stays neutral with regard to jurisdictional claims in published maps and institutional affiliations. |
© 2021 by the authors. Licensee MDPI, Basel, Switzerland. This article is an open access article distributed under the terms and conditions of the Creative Commons Attribution (CC BY) license (https://creativecommons.org/licenses/by/4.0/).
Share and Cite
Orchi, H.; Sadik, M.; Khaldoun, M. On Using Artificial Intelligence and the Internet of Things for Crop Disease Detection: A Contemporary Survey. Agriculture 2022, 12, 9. https://doi.org/10.3390/agriculture12010009
Orchi H, Sadik M, Khaldoun M. On Using Artificial Intelligence and the Internet of Things for Crop Disease Detection: A Contemporary Survey. Agriculture. 2022; 12(1):9. https://doi.org/10.3390/agriculture12010009
Chicago/Turabian StyleOrchi, Houda, Mohamed Sadik, and Mohammed Khaldoun. 2022. "On Using Artificial Intelligence and the Internet of Things for Crop Disease Detection: A Contemporary Survey" Agriculture 12, no. 1: 9. https://doi.org/10.3390/agriculture12010009
APA StyleOrchi, H., Sadik, M., & Khaldoun, M. (2022). On Using Artificial Intelligence and the Internet of Things for Crop Disease Detection: A Contemporary Survey. Agriculture, 12(1), 9. https://doi.org/10.3390/agriculture12010009