Abstract
Based on the grain production data of the counties (cities, districts) in Poyang Lake Basin, this paper uses the productivity index of Epsilon Based Measure of Malmquist Luenberger (EBM-ML Index) to analyse the green total factor productivity (GTFP) of grain in Poyang Lake Basin. Kernel density function and Markov analysis are used to discuss the dynamic evolution process of the distribution of GTFP of grain. The results show the following: (1) From the time dimension, the GTFP of grain is on the rise and fluctuates more frequently from 2001 to 2017, and its trend of change is determined by the combination of technical efficiency and technological progress. Moreover, from a spatial dimension, the number of counties (cities, districts) with GTFP of grain greater than 1.0 has shown an overall increase, indicating that the overall level of GTFP of grain is increasing. (2) According to the kernel density estimation results, the crest of the main peak of the kernel density curve corresponding to the GTFP of grain in Poyang Lake Basin shifts to the right, and the area formed by the right part of the GTFP of grain corresponding to the crest of the main peak of its kernel density curve gradually increases. The peak of the kernel density curve changes from “multi-peak mode” to “single-peak mode,” and the height of the main peak of the kernel density curve of GTFP of grain shows an overall decrease. Meanwhile, the right tail of the kernel density curve shows an overall extending trend. (3) According to the estimation results of the Markov chain, the GTFP of grain in Poyang Lake Basin is highly mobile from 2001 to 2017, and the counties (cities, districts) have a certain degree of agglomeration in the low, medium-low, medium-high and high levels. In other words, the long-term equilibrium state of growth of GTFP of grain remains dispersed in the state space of four level types, indicating that the divergence state of GTFP of grain in counties (cities, districts) of Poyang Lake Basin will continue for a long time in the future. The study reveals the evolution and dynamic change of GTFP of grain in Poyang Lake Basin, which has important theoretical significance and practical value for optimizing the spatial pattern and realizing the balanced development of GTFP among counties (cities, districts) of Poyang Lake Basin and consolidating China’s food security strategy.
1. Introduction
Grain is the material basis for human survival and development, and is an important guarantee for national economic development, social harmony and stability and national security. Especially in the context of the global outbreak of COVID-19 in 2020, the nature of its strategic value has been highlighted. It is also an important guarantee for national economic development, social harmony and stability and national security. Food security is the foundation of the development of the national economy, which is of great significance in promoting the construction of ecological civilization and strengthening the strategy of rural revitalization for China. Therefore, the Chinese government attaches foremost importance to food security and has introduced a series of “supporting agriculture, supporting agriculture and benefiting agriculture” policies. Since 2004, the central government has abolished agricultural taxes and provided grain subsidies to grain farmers, which resulted in a considerable increase in the farmers’ motivation to grow grain and contributed to a steady increase in grain production. At present, China has an annual production capacity of 600 million tons, and the per capita annual grain output has exceeded 450 kg for seven consecutive years. As the “food” of the grains, chemical fertilizers play an irreplaceable role in promoting food production; however, the excessive use of chemical fertilizers has caused serious environmental pollution problems [1]. In response, China has introduced a series of countermeasures. For example, in October 2015, during the Fifth Plenary Session of the 18th Central Committee of the Communist Party of China proposed the concept of green development, which is considered one of the five concepts to guide the future economic and social development of the country. The agricultural supply-side structural reform plan proposed in the No.1 Central Document in 2017 emphasized the improvement of resource utilization and the promotion of agriculture and the transformation of rural development from excessive reliance on resource consumption to the pursuit of green, ecological and sustainable resources to realize the demand change from quantity to quality. The No. 1 Central Document in 2021 also highlights the promotion of the reduction of fertilizers and pesticides to increase efficiency and achieve green development of agriculture. It further stressed that the green development of grains is an inevitable choice for the high-quality development of grain, the key to realizing rural revitalization and an important part of accelerating the construction of ecological civilization. However, in recent years, because of the decrease in cultivated land, the decline in cultivated land quality, the adjustment of cultivated land structure, fallow and abandonment, the sown area of grains has been reduced significantly, posing a potential threat to China’s food security to a certain extent [2]. The administrative boundary of Poyang Lake basin and Jiangxi Province highly overlaps, and the grain production of Jiangxi Province plays an important role in the major grain production areas. Jiangxi is one of the two provinces that have never interrupted the provision of commodity grain to the state since the founding of the People’s Republic of China, which makes an important contribution to ensuring national food security. We focus more attention in determining how to minimize the negative external effects of grain production on the environment in the Poyang Lake Basin, optimize the allocation of cultivated land, water resources, labour and other factors, and improve the quality of grain development in the future. In other words, under the condition of resource conservation, there is a need to improve the green total factor productivity (GTFP) of grain in Poyang Lake Basin, realize the development of grain economy in the direction of green and efficiency and accelerate the process of promoting the construction of ecological civilization. Therefore, the study on GTFP of grain in Poyang Lake basin is of great significance to China’s food security.
At present, the measurement methods of the total factor productivity (TFP) of grain include two kinds of parametric and non-parametric methods. One is the parameter method that measures production efficiency by constructing the production frontier function. Generally, a parameter method to measure TFP is stochastic frontier analysis (SFA), which has been widely used in the measurement of TFP of grain [3,4]. This method needs to set the specific form of the production function, which may raise the risk that a specific production function is set incorrectly. The other is the nonparametric method that does not require setting the specific form of function compared with the parameter method, which can avoid the error of measurement results caused by the selection of the wrong production function.
Nonparametric methods are widely used in the field of TFP evaluation [5,6,7], and include data envelopment analysis (DEA) and free disposal hull (FDH) belong to the category of linear programming modelling. The DEA is the most widely applied research method for measuring the TFP of grain [8,9], while the FDH method is rarely used [10]. With the increasingly serious environmental problems, the measurement method for traditional TFP cannot meet the needs of existing research. Some scholars have begun to focus on environmental problems, such as agricultural non-point source pollution and industrial waste and improve the traditional TFP model scientifically and reasonably [11,12,13]. The most common methods are directional distance function (DDF), SBM undesirable model, epsilon-based measure (EBM) function, etc., which has been widely employed in research on agricultural TFP [14,15,16,17].
Moreover, some scholars investigated the convergence of grain total factor productivity from the evolution of spatial dimension and temporal dimension [18,19], who mainly used the relevant theories of σ convergence and β convergence to test [20]. Some scholars conducted convergence test on agricultural (grain) total factor productivity of European member states, and the results showed that agricultural (grain) total factor productivity is generally similar, but the convergence rate is relatively slow [21]. Shi et al. [22] used the method of panel unit root to conduct random convergence test for regional differences of total factor productivity of China’s agriculture from 1993 to 2013, and the results showed that the inter-provincial gap of agricultural total factor productivity in China would exist for a long time.
In summary, existing studies have different methods to calculate the TFP of grain, and widely study the convergence of the TFP of grain, which laid a solid foundation for this study. However, the lack of discussions on the development of grain green production and the characteristics of grain production mobility in different regions require further exploration. Therefore, this paper takes Poyang Lake Basin as an example in attempt to bring environmental factors into the traditional analysis framework of TFP of grain, and applies the EBM-ML index to measure the GTFP of grain in Poyang Lake Basin by considering environmental factors, and explores the characteristics and laws of spatial-temporal evolution of GTFP of grain. The study further analyses the dynamic distribution and evolution of GTFP of grain in different counties (cities, districts), and identifies the characteristics of regional differences in GTFP by using the methods of kernel density estimation and Markov transfer matrix. Finally, based on the research conclusions, relevant countermeasures and suggestions are proposed to optimise the space of grain production layout and to achieve the balanced development of GTFP of grain among the counties (cities, districts) in Poyang Lake Basin, which is of great theoretical significance and practical value to improve the comprehensive grain production capacity of Poyang Lake Basin, effectively identify the balance of supply and demand in China’s grain production, and realize the national food security strategy.
2. Method and Data
2.1. Research Methods
2.1.1. Measuring Method of GTFP of Grain
The idea of static production efficiency is limited to a fixed time frame, which makes it difficult to characterise the dynamic changes of grain green production efficiency. The change in the levels of technological progress in grain production will cause the change of grain green production efficiency, while the static production efficiency cannot depict the change in technological progress. Therefore, we develop the EBM-ML productivity index (ML) combined with the EBM directional distance function to measure the GTFP of grain, which can identify the changes in technological progress of grain. The ML from period t to period t + 1 can be calculated as follows [23]:
where ML is the level of GTFP, and if ML > 1 (<1), the level of GTFP of grain has increased (decreased). and are factor input and expected output, respectively. is the direction of the vector, is the year, and is the efficiency value. Moreover, ML can be decomposed further into technical efficiency index (MLEC) and technical progress index (MLTC), as follows:
where the MLEC reflects the speed at which the technological laggards catch up with the advanced ones, also known as the “catch-up effect” [24]. If MLEC is greater than 1.0, it means that the technical efficiency is improved. On the contrary, the technical efficiency is reduced. The MLEC can be calculated as follows:
The MLTC can be calculated as follows:
where MLTC reflects the degree of outward expansion of the production frontier. When the technological progress is greater than 1.0, it means the production frontier is moving toward the expected output and the undesired output is decreasing. On the contrary, it means the production frontier is sinking in the opposite direction.
2.1.2. Kernel Density Function Estimation
The kernel density function estimation is used as a nonparametric estimation method for the distribution of random variables [25,26]. The principle is to assume that the kernel density function of the random variable is , and the probability density distribution function of at sample point is as follows:
where N is the number of sample observations, K is the kernel density function, and the constant h is the bandwidth, which determines the accuracy and smoothness of kernel density estimation. If the bandwidth is too large or too small, the kernel density estimation will be biased [27]. According to the Silverman best criterion, the best bandwidth selection should minimize the integration error.
The location, shape and wave crests of the kernel density function distribution can be observed through the kernel density function estimation results. The corresponding relationship between the probability density function distribution form of the variable distribution and the gap level [28,29] is shown in Table 1.

Table 1.
Corresponding relationship between the distribution of the kernel density function and the gap level.
2.1.3. Markov Chain Method
The Markov Chain is a random time series method that involves constructing a Markov transition matrix with “no aftereffect” [30]. Assuming that represents the probability of a random process transitioning from state type
at time to state type at the time and is the probability that the state is at the time at , the formula is as shown:
where is the state probability of period, which is only determined by the state probability and transition probability of the time element, and is not related to the past state. In this paper, the probability distribution of GTFP of grain in each county (cities, districts) in year is expressed as the state probability vector of , then the GTFP in different years can be expressed by Markov chain transfer matrix of [31], as shown in Table 2.
Table 2.
Markov transition probability matrix (k = 4).
Table 2 shows the transition probability of the county (city, district) whose GTFP of initial grain is in type to type in the next year [32]. The can be calculated as follows:
where represents the number of counties (cities, districts) of type transferred to type in the next year in a certain research period and represents the number of counties (cities, districts) of type in all years. If a county (city, district) of GTFP of grain is in type at the initial stage and remains at type after the next year, the transfer of GTFP of grain in the region is translational. If the state transition probability matrix does not change with time, the distribution of GTFP of grain after periods is . When , if converges, that is, all counties (cities, districts) have a convergence of GTFP of grains, the stable distribution of GTFP of grains of all counties (cities, districts) in Poyang Lake Basin can be obtained, which is the long-term equilibrium state of GTFP of grain distribution in Poyang Lake Basin [33]. The stationary distribution of is the only solution for formula system (3).
Through the stable distribution state, it can be predicted whether the GTFP of grain among the counties (cities, districts) can achieve coordinated development. If the distribution of is stable and concentrated, the GTFP of grain in all counties (cities, districts) will be concentrated at the same level range, indicating that the difference in GTFP of grain in all counties (cities, districts) can eventually be eliminated. If the distribution is scattered or cannot be solved, it means the difference in the GTFP of grain in various counties (cities, districts) has always existed, and the coordinated development of grain production cannot finally be realized.
2.2. Data Sources
The Poyang Lake basin is an important grain production area in China that includes 100 counties (cities, districts), such as Nanchang County and Chaisang District. This paper considers the 19 municipal districts (including Lianxi, Qingshan Lake, Linchuan, Yushui, Anyuan, Qingyuan, Zhanggong, Xinzhou, Wanli, Changjiang, Xunyang, Yuehu, West Lake, Donghu, Jizhou, Zhujiang, Qingyunpu, Xiangdong, Yuanzhou) and Gongqingcheng city with a high level of urbanization and very low proportion of grain production, or even no grain production, and has limited effects on the research results [34]. Therefore, the study selects 80 counties (cities, districts) in Poyang Lake Basin as the research objects and the time series is from 2001 to 2017. The research data are from the statistical yearbooks of various cities and the statistical bulletins of counties (cities, districts) in Jiangxi Province over the years. Part of the data are calculated based on the above-mentioned yearbook data. The spatial data are from the 1:1.5 million vector data provided by the National Basic Geographic Information Data Centre from China.
3. Evolution Analysis of GTFP of Grain in Poyang Lake Basin
For the calculation of grain’s GTFP, this paper combined with existing relevant research intends to select five kinds of input indicators, namely labour, land, mechanical power, water resources and fertilizer inputs [35,36]. Among them, the labour input is measured by the employees of the primary industry, land input is expressed by the sown area of grain crops, mechanical power input is represented by the total power of agricultural machinery, water resource input is measured by the effective irrigation area and chemical fertilizer input is measured by the application amount of agricultural chemical fertilizer (chemical fertilizer purity). Moreover, this paper plans to select two types of output indicators, namely expected and undesired outputs. The expected output is expressed by the total grain output of each year, while the undesired output is measured by the total nitrogen (TN) and total phosphorus (TP). The pollution sources of grain include chemical fertilizer, pesticide and agricultural film, while the main food crop in Poyang Lake Basin is rice. Chemical fertilizer and pesticide are the main sources of agricultural non-point source pollutants during rice production. Considering the data availability and the measurability of non-point source pollution, this paper only calculates the amount of non-point source pollution of chemical fertilizer as the unexpected output [34]. Relevant studies have confirmed that excessive application of chemical fertilizer not only produces negative externalities to the environment but also gradually becomes the main source of agricultural non-point source pollution [37,38,39], and the method for calculation is based on Wu’s (2012) method of agricultural non-point source pollution in the Poyang Lake Area [40]. Based on the above indicators, the software MaxDEA8.0 is used to calculate the GTFP of grain in Poyang Lake Basin (see the Appendix A), and the temporal and spatial evolution of GTFP of grain is analysed.
3.1. Evolution of GTFP of Grain Based on Time Dimensions
In general, the annual average value of GTFP of grain in Poyang Lake Basin from 2001 to 2017 is 1.0136, indicating that the average annual growth rate of GTFP of grain is 1.36% (Figure 1). From the perspective of the decomposition of GTFP of grain, the annual average value of grain technical efficiency in Poyang Lake Basin from 2001 to 2017 is 1.0059, which means the average annual growth rate of technical efficiency is 0.61%. The annual average value of technological progress is 1.0109, illustrating that the average annual growth rate of grain green technological progress is 1.09%.
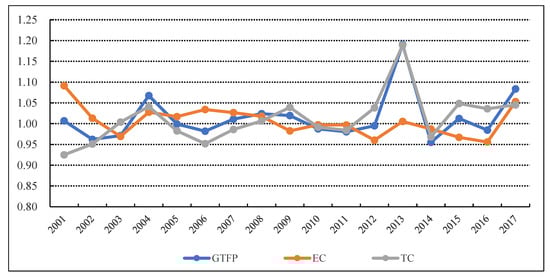
Figure 1.
Evolution trends of GTFP of grain in Poyang Lake Basin from 2001 to 2017.
From the perspective of time-series evolution, the GTFP of grain has an overall upward trend from 2001 to 2017 and fluctuates frequently, which is determined by the combination of technical efficiency and technological progress.
From 2001 to 2012, except for 2004, the GTFP of grain in Poyang Lake Basin fluctuated slightly, which may be due to the cancellation of agricultural tax in Jiangxi Province in 2003 and the mobilization of farmers’ enthusiasm for growing grains leading to a substantial increase in GTFP of grain in the next year. From 2013 to 2017, the GTFPs of grain were lower than the previous year in 2014 and 2016, while the GTFPs of grains for the rest of the years were greater than 1.000, indicating that the GTFP of grains in Poyang Lake Basin increased during this period. The probable reason is that in 2015, the Ministry of Agriculture pointed out the necessity of a good job in grain production and accelerate the transformation of agricultural development mode. The local government actively responded and implemented it to improve the level of production technology, promote the intensive production of grain and promote the use of organic fertilizer.
3.2. Evolution of GTFP of Grain Based on Spatial Dimensions
To show the spatial dynamic evolution of GTFP of grain in Poyang Lake Basin more intuitively, this paper uses the equal interval method for specific analysis which takes 2001 as the base period that the relevant years are extracted every six years. The last year 2017 is also included in the analysis. Finally, the GTFP data of grain in 2001, 2007, 2013 and 2017 are selected, and the spatial distribution is mapped by using arcgis10.6 spatial measurement software (Figure 2).
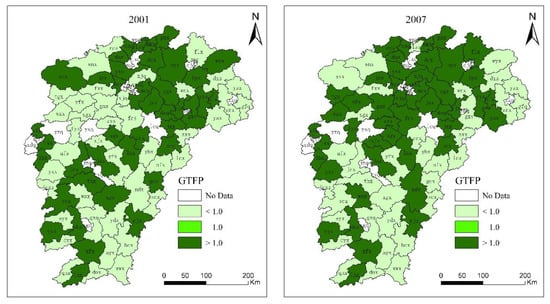
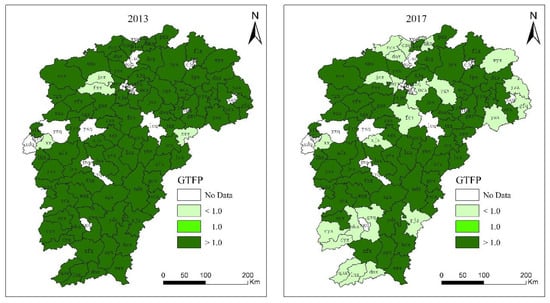
Figure 2.
Spatial pattern evolution of GTFP of grain in Poyang Lake Basin from 2001 to 2017.
Figure 2 shows that the number of counties (cities, districts) with GTFP of grain greater than 1.0 in Poyang Lake Basin is increasing, which reflects the overall level of GTFP of grain is increasing. The result is closely related to a series of “supporting agriculture, agriculture and benefiting agriculture” policies issued by the state in recent years to promote the implementation of chemical fertilizer and pesticide reduction to pursue high-quality agricultural development. In general, the level of GTFP of grain in Poyang Lake Basin is developing to a high level, but certain instabilities were also observed. For example, the overall GTFP of grain in 2013 is higher than that in 2001, 2007, 2017, and even some counties (cities, districts) have shifted from a relatively high level to a low level of GTFP of grain, indicating that the capacity of green grain production in this region needs to be improved further. In terms of spatial distribution, the vast majority of counties (cities and districts) with GTFP of grain greater than 1.0 in the northern of Poyang Lake Basin, which is mainly attributed to the official approval of the Poyang Lake Ecological Economic Zone Planning by the State Council of China in 2009. This policy marks the construction of Poyang Lake Ecological Economic Zone as a national strategy, which is of great significance to promote the GTFP of grain in the Poyang Lake. Moreover, the number of counties (cities and districts) with the GTFP of grain greater than 1.0 in the southern of Poyang Lake Basin are increasing in general, but those are not stable. This may be because the southern region is mainly mountainous and hilly, which is not conducive to large-scale grain production and the improvement of GTFP of grain. In addition, a considerable number of counties (cities, districts) with low levels of GTFP for the grain can be observed, which may be due to differences in natural conditions and resource endowments among different counties (cities, districts). Therefore, how to ensure the improvement of the overall GTFP of grain and narrow grain production among counties (cities, districts) in Poyang Lake Basin are the focus of future attention.
4. Dynamic Distribution Analysis of GTFP of Grain in Poyang Lake Basin
The dynamic distribution of GTFP of grain evolution in Poyang Lake Basin is conducted using the dynamic growth distribution dynamic method to further understand the dynamic evolution of the growth distribution and relative position of GTFP of grain among the counties (cities, districts) in Poyang Lake Basin. According to the different state settings of the data sequence, the growth distribution dynamic method can be divided into kernel density function estimation method and Markov chain method [33,41]. The former treats GTFP of grain sequence as a continuous state to describe the overall shape of GTFP of grain distribution while the latter treats GTFP of grain sequence as a discrete state. By analysing the mobility of the internal distribution of GTFP of grain among counties (cities, districts), this paper explores its dynamic change and occurrence probability and studies the long-term trend of the distribution evolution of GTFP of grain in the Poyang Lake Basin.
4.1. Analysis of Kernel Density Distribution of GTFP of Grain
This paper also uses the equal distance method for specific analysis and selects the kernel density distribution of GTFP of grain in 2001, 2007, 2013 and 2017 by applying the Stata15.0 [29], as shown in Figure 3, which reflects the dynamic evolution characteristics of the overall form of GTFP of grain in Poyang Lake Basin.
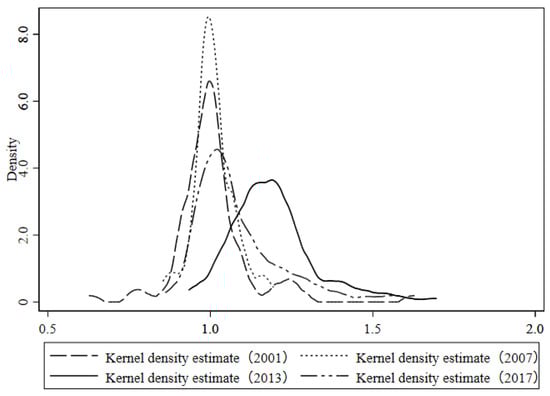
Figure 3.
Distribution of GTFP of grain kernel density in representative years.
(1) From an overall point of view, the GTFP of grain corresponding to the main peak of the kernel density curve shifts to the right, and the area formed by the right part of the main peak of the kernel density curve corresponds to the right part of the GTFP of grain gradually increase. It further verified that the overall level of GTFP of grain in all counties (cities, districts) is improving. (2) The crest of the kernel density curve from 2001 to 2017 changed from “multi-peak mode” to “single-peak mode”. It shows that the difference in GTFP of grain in the counties (cities, districts) in Poyang Lake Basin is gradually shrinking, and will eventually converge to the same equilibrium point in the long term. (3) From the perspective of the vertical height of the kernel density curve, the height of the main peak of the GTFP of grain curve has an overall decreasing trend. The results show that the differences in GTFP of grain among different counties (cities, districts) decreased from 2001 to 2017, indicating a convergence trend, but specifically, the differences of GTFP of grain among different counties (cities, districts) increase from 2001 to 2007, while the differences of GTFP of grain among different counties (cities, districts) decrease significantly from 2007 to 2013. It indicates a significant convergence characteristic. From 2013 to 2017, the growth of GTFP of grain difference among various counties (cities, districts) is small, but it is still necessary to strengthen exchanges and cooperation among different counties (cities, districts) to narrow the GTFP of grain difference between them. (4) From 2001 to 2017, the right tail of the kernel density curve shows an overall trend of extension, indicating that the GTFP of grain in Poyang Lake Basin shows an overall growth trend, and the GTFP of grain level in several counties (cities, districts) is higher, and a trend of further improvement can be observed. However, from 2013 to 2017, the kernel density curve had left tailing phenomenon, indicating that several counties (cities, districts) still had GTFP of grain that changed to a low level, and the gap with other counties (cities, districts) in grain green production efficiency has increased.
4.2. Analysis of Internal Mobility of the Growth Distribution of GTFP of Grain
The above analysis on the overall pattern of the distribution of GTFP of grain in Poyang Lake Basin using the kernel density function estimation method could not reveal the long-term development trend of the GTFP of grain in different counties (cities and districts) of Poyang Lake Basin. Based on the above evolution of GTFP of grain growth distribution, this section uses the Markov chain method to explore the state transition of counties (cities, districts) in the distribution of green total factor productivity of food, to reveal the long-term change trend of grain green total factor productivity differences among different counties (cities, districts) in Poyang Lake Basin.
According to the calculation results of GTFP of counties (cities, districts) in Poyang Lake Basin from 2001 to 2017 and using the quartile method, the GTFP of counties (cities, districts) can be discretized into four state-level types, namely, low, medium-low, medium-high and high levels. To further understand the dynamic evolution trend of GTFP of grain in Poyang Lake Basin in different periods, the Markov transfer matrix of GTFP of grain in Poyang Lake Basin in three periods of 2001–2009, 2009–2017 and 2001–2017 is calculated by using MATLAB (Table 3) [33]. Among them, the number of samples in Table 3 represents the number of counties (cities, districts) in each state-level type (each state-level type is low, medium-low, medium-high and high levels in turn) in the initial period. The value on the line indicates the probability that the county (city, district) is at a certain state level and type will always remain unchanged. The value on the off-diagonal line indicates the corresponding counties’ (cities, districts) zones and the probability of transition from a certain state-level type to another state-level type.
Table 3.
Markov transition matrix results of GTFP of grain in Poyang Lake Basin.
Table 3 shows the Markov chain estimation results of the GTFP of grain in Poyang Lake Basin. (1) In different periods, the probability value on the diagonal line in the Markov transition matrix of GTFP of grain is low, which indicates that regardless of the period, the counties (cities, districts) of Poyang Lake Basin have great changes in GTFP of grain, and the probability of each county (cities, districts) tending to maintain the status quo is very small. However, the probability of shifting to other state levels is larger, indicating that all counties (cities, districts) have strong liquidity of GTFP of grain. (2) With the change of GTFP, each county (city, district) is in the adjacent state, the maximum probability of transfer between level types is 34.16%, and the minimum is 14.09%. Each county (city, district) is in a state of leapfrog, the maximum probability of horizontal type transfer is 45.07% and the minimum probability is 15.53%. It shows that with the change of GTFP of grain, each county (city, district) is in the initial and final state, and the transfer between level types occurs not only in the adjacent level types but the leap forward transfer phenomenon also exists between different level types. (3) With the change of GTFP of grain, counties (cities, districts) are at low, medium-low, medium-high, and high-level types with a certain degree of agglomeration.
From the comparison of the initial distribution and the steady-state distribution (Table 4), the probability of the GTFP of grain in the low medium and high level types increases, while the probability of the low and medium high level types decreases. It shows that the evolution trend of the green total elements of grain in Poyang Lake Basin intensifies to the middle-low and high level types, and the other level types are weakened. According to this trend of agglomeration toward low medium and high level types and weakening of other types, it is difficult for counties (cities, districts) to achieve the same steady-state level of GTFP of grain without external interference measures. In the end, it is impossible to achieve balanced development of green grain production in all counties (cities, districts). It further illustrates that increasing green grain production, narrowing the gap in green grain production among counties (cities, districts) in Poyang Lake Basin, and achieving high-quality grain development is still challenging.
Table 4.
Initial distribution and steady distribution probability of GTFP of grain in Poyang Lake Basin.
5. Conclusions and Suggestions
The paper analyses the GTFP and dynamic evolution characteristics of grain in Poyang Lake Basin from 2001 to 2017, and draws the following conclusions:
(1) In general, the annual average of GTFP of grain in Poyang Lake Basin from 2001 to 2017 is 1.0136, which indicates that the annual average growth rate of GTFP of grain is 1.36%. From the time evolution trend, the GTFP of grain has an overall upward trend from 2001 to 2017, and the fluctuation is more frequent. The change trend is determined by technical efficiency and technological progress. From the perspective of spatial evolution trend, the number of counties (cities, districts) of grain’s GTFP that greater than 1.0 shows an overall increasing trend, which indicates that the overall level of GTFP of grain is increasing. (2) According to the results of kernel density estimation, the GTFP of the grain of Poyang Lake Basin corresponding to the main peak of kernel density curve moves to the right, and the area formed by the right part of GTFP of grain corresponding to the main peak of kernel density curve increases gradually. The peak of kernel density curve changes from “multi-peak mode” to “single peak mode.” The height of the main peak of the kernel density curve of GTFP of grain shows an overall decreasing trend. The kernel density curve shows an overall extension trend with the right tail. The results show that the GTFP of grain in Poyang Lake Basin has an overall growth trend. The level of GTFP of grain in several counties (cities, districts) is higher and has a trend of further improvement, but some counties (cities, districts) still have GTFP of grain that has changed to a low level, thereby widening the gap of green production of grain in different counties (cities, districts). (3) According to the Markov chain estimation results, the flow of GTFP of grain in Poyang Lake Basin is strong from 2001 to 2017, and the counties (cities and districts) are in low, low, medium-high and high levels, and a certain degree of agglomeration can be observed. That is, the long-term equilibrium state of the growth of GTFP of grain is still scattered in the state space of four levels. It shows that the state of GTFP of grain in each county (city and district) in Poyang Lake Basin will continue to exist for a long time in the future.
Through the analysis of the GTFP and dynamic evolution of grain in Poyang Lake Basin, the following suggestions are proposed:
First, the infrastructure construction should be improved and the GTFP of grain should be promoted. The Poyang Lake Basin is composed of mountains and hills, with high terrain around and low terrain in the middle. The terrain inclines from the outside to the inside, which determines that the method of optimizing its food production infrastructure is a key factor to improve the level of TFP of grain. First, reliance on the terrain should be done to strengthen its water conservancy infrastructure construction, such as farmland construction, low-pressure irrigation, irrigation ditches and other irrigation facilities coexist. Second, strengthening the continuous improvement of modern facilities such as transportation and communication is conducive to flood control and drought relief, and improving the ability of grain production in Poyang Lake basin to resist natural disasters. At the same time, the improvement of infrastructure construction is conducive to the mechanization of grain production and the improvement of GTFP.
Second, the structure of grain production should be adjusted, and the rational allocation of grain production factors coordinated to reduce agricultural non-point source pollution. (1) Different types of grains are not only affected by local resource endowments but other production factors such as labour and fertilizers also play a significant role in grain production. According to the local natural resource endowment, reasonable adjustment of the grain production structure will help improve the level of TFP and increase grain yield. (2) Reasonable and scientific allocation of food production factors can help reduce waste caused by excessive production factors in the production process and avoid excessive production factors leading to a decline in the level of grain total factor productivity and damage to the original soil structure. (3) The planting area of grain crops with large fertilizer consumption should be appropriately reduced according to the influence of different grain structures on non-point source pollution of chemical fertilizer. The possibility of nutrient loss and pollution can be effectively reduced by continuously improving the utilization rate of chemical fertilizer, using straw returns, increasing organic fertilizer and other organic nutrients. According to the actual situation of each county (city, district), the local non-point source pollution prevention and control policies is formulated to effectively control the amount of chemical fertilizer input, improve the level of chemical fertilizer input, reduce agricultural non-point source pollution and improve the level of GTFP of grain.
Third, promote cross-regional exchanges and cooperation, effectively improve the level of GTFP of grain in surrounding areas, and achieve regional balanced development. From the perspective of the long-term development of GTFP of grain, all county (city, district) governments should strengthen close cooperation in grain production, establish cross county (city, district) exchange and cooperation mechanism, and provide a good external environment for the county (city, district) exchange and cooperation, To improve the GTFP of grain, narrow the gap with neighbouring counties (cities, districts) and form a virtuous circle of win-win cooperation, counties (cities, districts) should actively cultivate and introduce professional technical talents, learn advanced technology and good management mode of neighbouring counties (cities, districts), etc, to improve the GTFP of grain in Poyang Lake Basin and even the great lake basin, to achieve high-quality development of grain and ensure food security.
6. Discussion
The measurement methods of total factor productivity of grain include the parametric and nonparametric methods [34]. In general, the parameter method needs to set a specific form of the production function, while the non-parameter method does not need to set the specific form of the production function, which can avoid the error of the calculation results because of the selection of the wrong production function. Non-parametric methods have been widely used in the measurement of the annual rate of the GTFP of grain [7]. Moreover, the convergence analysis of total factor productivity of grain is mainly manifested in the distribution of spatial dimension and the evolution of time dimension, which is tested by using the methods of σ convergence and β convergence. Base on this, the study incorporates agricultural non-point source pollution into the analytical framework of the GTFP of grain analysis and uses the EBM-ML productivity index to measure the GTFP of grain in the Poyang Lake Basin. The results reveal that the change of the GTFP of grain in Poyang Lake Basin is jointly determined by the “two-track drive” of technological efficiency and technological progress during the period 2001–2017. Furthermore, the methods of Kernel density function estimation method and Markov chain method are used to analyze the dynamic evolution of the distribution of GTFP of grain in Poyang Lake Basin. The former can describe the overall form of the distribution GTFP of grain. The latter can analyze the dynamic change and occurrence probability of GTFP in Poyang Lake Basin by analyzing the internal distribution mobility of GTFP, and explore the long-term trend of the evolution of GTFP in Poyang Lake Basin, which has important significance in optimizing the spatial distribution of grain production and ensure food security. However, there are still some limitations in this study that need further discussion. First, this study does not subdivide grain varieties and discuss the GTFP of different grain types due to the limitation of statistical data and other factors. Hence, this study only considers the total amount of grain, and lacks the research on cereal crops, potato crops, edible legume crops and other different types. Second, this paper lacks analysis on the influencing factors of GTFP. This study investigates the overall change trend and the mobility of GTFP among different counties (cities and districts) in Poyang Lake Basin, but the influencing factors of GTFP of grain are not considered. In future studies, we will further explore the main influencing factors on GTFP of grain in Poyang Lake Basin, which is more targeted to optimize the layout of grain production and further consolidate food security.
Author Contributions
B.B. and L.L. designed the study and drafted the manuscript, S.J. collected the Data, X.G. and K.D. managed the literature review, and gave good advice and revised the manuscript. All authors have read and agreed to the published version of the manuscript.
Funding
This research was supported by the National Natural Science Foundation of China (71873095, 71673200) and China Postdoctoral Science Foundation (2021M691345) and Key Project of Labor Union Theory Research Institute of Shandong Institute of Management (2019GH-Z03).
Informed Consent Statement
Informed consent was obtained from all farmers involved in the study.
Data Availability Statement
The data presented in this study are available on request from the corresponding author.
Acknowledgments
We would like to thank the editor and the anonymous reviewers for their helpful suggestions and comments.
Conflicts of Interest
The authors declare that they have no conflict of interests.
Appendix A
Table A1.
GTFP of grain in counties (cities and districts) of Poyang Lake Basin from 2001 to 2017.
Table A1.
GTFP of grain in counties (cities and districts) of Poyang Lake Basin from 2001 to 2017.
| District | 2001 | 2002 | 2003 | 2004 | 2005 | 2006 | 2007 | 2008 | 2009 | 2010 | 2011 | 2012 | 2013 | 2014 | 2015 | 2016 | 2017 |
|---|---|---|---|---|---|---|---|---|---|---|---|---|---|---|---|---|---|
| ncx | 1.0167 | 1.0746 | 0.9431 | 1.0452 | 0.9761 | 0.9936 | 1.018 | 1.0428 | 0.9878 | 0.947 | 1.0742 | 1.0017 | 1.1785 | 1.0142 | 0.9557 | 0.9906 | 0.9179 |
| jxx | 1.0947 | 1.0398 | 0.9705 | 1.1046 | 0.9941 | 1.0567 | 1.0108 | 1.0472 | 1.0586 | 0.9549 | 1.0355 | 1.0183 | 1.1183 | 0.9118 | 0.9684 | 1.0139 | 1.1541 |
| ayx | 1.005 | 0.9892 | 0.9944 | 1.024 | 0.9444 | 1.0155 | 1.097 | 1.0069 | 1.0128 | 0.9864 | 1.0129 | 1.0175 | 1.1748 | 0.9865 | 1.0203 | 0.9833 | 0.9947 |
| xjq | 0.9664 | 1.0033 | 0.8862 | 1.2128 | 1.0833 | 1.0121 | 1.0525 | 1.0424 | 0.9763 | 0.9189 | 1.0054 | 1.0023 | 1.1943 | 0.9776 | 1.004 | 1.0077 | 1.1319 |
| flx | 0.9958 | 0.9902 | 0.9659 | 1.04 | 0.9533 | 1.0068 | 1.0349 | 1.0642 | 1.0215 | 1.0336 | 0.7544 | 0.9647 | 1.3531 | 0.9572 | 1.0497 | 1.0089 | 1.0109 |
| lps | 1.0186 | 0.9999 | 0.9911 | 1.0733 | 0.9763 | 0.9965 | 1.0478 | 1.0162 | 1.0328 | 0.9951 | 0.8871 | 0.9707 | 1.2891 | 0.9779 | 0.9418 | 0.9994 | 1.0942 |
| lhx | 1.0232 | 1.079 | 0.9229 | 1.1579 | 0.8831 | 1.0429 | 1.0028 | 1.033 | 1.0484 | 0.9814 | 0.9988 | 1.0225 | 1.2519 | 0.9508 | 1.0053 | 1.0057 | 1.0069 |
| slx | 1.0101 | 1.0406 | 0.849 | 1.0806 | 0.9792 | 0.9752 | 1.0435 | 1.0044 | 1.0071 | 1.0029 | 0.9847 | 1.0308 | 1.1176 | 1.0159 | 0.9961 | 1.0469 | 1.1665 |
| lxx | 1.0079 | 0.9412 | 0.9815 | 1.0525 | 1.003 | 1.0011 | 1.0042 | 1.0038 | 1.0092 | 1.0106 | 0.9981 | 1.0262 | 0.9846 | 1.0006 | 1.0097 | 0.9972 | 0.9797 |
| fyx | 0.77 | 0.8545 | 0.834 | 1.1219 | 0.9886 | 1.0021 | 1.194 | 1.0461 | 0.9719 | 0.9575 | 1.0586 | 0.8978 | 1.1395 | 0.9081 | 1.0016 | 1.0777 | 1.0073 |
| jjx | 1.2619 | 1.1279 | 1.1684 | 1.2143 | 0.8527 | 1.0934 | 1.0032 | 0.9996 | 1.0792 | 1.0249 | 0.9819 | 0.8414 | 1.4776 | 0.9692 | 1.0459 | 0.821 | 0.9619 |
| wnx | 0.977 | 1.0061 | 1.0274 | 1.1224 | 1.0176 | 0.9961 | 0.8541 | 1.0208 | 1.1775 | 1.0082 | 0.9947 | 0.999 | 1.0458 | 0.9821 | 1.0675 | 0.8927 | 1.0121 |
| xsx | 1.0128 | 0.9204 | 1.1118 | 1.0104 | 0.9591 | 0.9978 | 0.9969 | 1.0621 | 0.9778 | 0.9879 | 0.981 | 0.9285 | 1.5387 | 0.8678 | 1.6597 | 0.6157 | 1.2267 |
| yxx | 1.0716 | 0.9235 | 1.2086 | 0.7557 | 0.7935 | 1.0569 | 1.0779 | 1.1041 | 1.0257 | 0.9847 | 1.1502 | 0.9446 | 1.1348 | 0.908 | 1.2846 | 0.6913 | 1.0549 |
| dax | 1.2812 | 0.8403 | 1.1504 | 1.0735 | 0.9983 | 0.9943 | 1.002 | 1.0183 | 1.018 | 1.0045 | 0.9044 | 0.8191 | 1.6956 | 1.0898 | 1.0613 | 0.9223 | 0.9982 |
| dcx | 1.2279 | 0.9299 | 0.8394 | 1.1979 | 1.2164 | 0.9953 | 1.0041 | 1.0048 | 1.0463 | 0.9393 | 1.0186 | 0.9409 | 1.1352 | 0.9597 | 1.0146 | 0.8303 | 1.2376 |
| hkx | 1.0898 | 0.9149 | 1.052 | 1.0101 | 0.9624 | 1.006 | 1.0335 | 0.9898 | 1.0889 | 0.9955 | 0.99 | 1.0184 | 1.4132 | 0.9839 | 1.1003 | 0.9531 | 0.9807 |
| pzx | 1.208 | 0.9808 | 1.2049 | 1.0046 | 0.8655 | 1.0296 | 1.0666 | 1.0649 | 1.0146 | 1.0448 | 0.9086 | 0.8985 | 1.3353 | 1 | 1.0022 | 0.986 | 1.0187 |
| rcs | 0.9408 | 1.1656 | 1.1526 | 1.0569 | 0.877 | 1 | 1.0991 | 1.0035 | 0.9727 | 0.9597 | 0.8375 | 1.1499 | 1.0934 | 0.9979 | 1.5266 | 0.7218 | 0.952 |
| lss | 1.2334 | 0.6949 | 1.0113 | 1.2724 | 1.1465 | 0.8613 | 0.9796 | 1.0511 | 1.0788 | 0.9981 | 0.8887 | 1.0794 | 1.5581 | 0.912 | 1.1545 | 0.7122 | 1.0553 |
| yjq | 1.0344 | 1.0367 | 0.9436 | 1.046 | 0.9611 | 0.971 | 1.0007 | 0.9584 | 1.003 | 0.9407 | 1.0994 | 0.935 | 1.2682 | 0.8168 | 0.8332 | 0.95 | 1.3523 |
| gxs | 1.0541 | 0.9936 | 0.9691 | 1.0972 | 0.9117 | 0.9589 | 0.8771 | 0.9995 | 1.015 | 0.9942 | 1.0141 | 0.9814 | 1.0183 | 0.976 | 0.9541 | 0.9717 | 1.1323 |
| nkq | 1.0301 | 0.9252 | 0.9685 | 0.9679 | 1.023 | 0.9756 | 1.0063 | 1.0157 | 1.0034 | 1.017 | 1.0925 | 0.8738 | 1.1845 | 0.9902 | 0.9521 | 1.3251 | 0.8718 |
| gx | 0.98 | 0.9424 | 0.9426 | 1.0185 | 0.9674 | 0.9708 | 0.9588 | 0.9891 | 1.0097 | 0.9519 | 1.0074 | 0.9721 | 1.1683 | 0.9836 | 0.9643 | 1.0588 | 0.9619 |
| xfx | 1.0064 | 0.9584 | 0.987 | 0.9962 | 1.0106 | 0.9622 | 1.0268 | 1.0199 | 1.0235 | 0.9781 | 0.966 | 0.9654 | 1.2601 | 0.9094 | 0.9399 | 1.064 | 1.0683 |
| dxx | 0.9342 | 0.8789 | 0.9315 | 0.9861 | 1.0146 | 0.9805 | 0.9903 | 1.0187 | 0.9663 | 0.9897 | 0.958 | 1.0494 | 1.136 | 0.9861 | 0.999 | 1.0215 | 0.9859 |
| syx | 0.9864 | 0.953 | 0.9317 | 0.9576 | 0.9804 | 0.9558 | 0.9813 | 0.9982 | 0.9678 | 1.0092 | 0.9707 | 1.0815 | 1.2534 | 0.9819 | 0.9841 | 1.0008 | 1.0044 |
| cyx | 1.0622 | 0.7968 | 0.9146 | 0.9974 | 1.0406 | 0.9784 | 1.0093 | 1.0265 | 0.9702 | 1.0761 | 0.9697 | 1.0672 | 1.0807 | 0.9972 | 0.9943 | 1.0594 | 0.9459 |
| ayx | 0.9319 | 0.9553 | 0.9413 | 0.9317 | 0.9585 | 0.9408 | 0.9626 | 0.9265 | 0.9873 | 0.9639 | 0.9124 | 1.0634 | 1.2446 | 0.9585 | 0.9647 | 1.1537 | 1.1243 |
| lnx | 1.0464 | 0.8979 | 1.0044 | 0.9395 | 0.9621 | 0.9772 | 1.0129 | 0.9986 | 1.0322 | 0.9792 | 0.9174 | 1.0903 | 1.1705 | 0.9863 | 1.0098 | 1.0532 | 0.994 |
| dnx | 0.9806 | 0.931 | 1.0242 | 0.9817 | 0.9938 | 0.9774 | 0.9788 | 1.0405 | 1.0406 | 0.9776 | 0.9638 | 1.064 | 1.0822 | 0.9831 | 1.0096 | 0.9869 | 0.9885 |
| qnx | 0.9899 | 0.9492 | 0.9735 | 0.9758 | 1.0648 | 0.9254 | 0.9735 | 1.0188 | 1.0174 | 0.9648 | 0.9307 | 1.018 | 1.2416 | 0.9967 | 1.0112 | 1.0139 | 0.9878 |
| ndx | 0.9702 | 0.8938 | 0.9913 | 1.0296 | 0.9055 | 1.0241 | 1.0055 | 0.98 | 0.9992 | 0.9612 | 1.0223 | 0.9457 | 1.2245 | 0.8825 | 0.9465 | 0.9838 | 1.1624 |
| ydx | 0.9238 | 0.9402 | 0.9034 | 0.9805 | 1.0072 | 0.9207 | 0.9407 | 0.9651 | 0.9997 | 0.9769 | 0.9877 | 0.9839 | 1.2433 | 0.9828 | 0.9512 | 1.0605 | 1.0446 |
| xgx | 1.0304 | 0.8791 | 0.9573 | 1.0814 | 0.9929 | 0.9731 | 0.9791 | 0.9652 | 0.9928 | 0.9859 | 0.9857 | 0.9836 | 1.2186 | 0.905 | 0.9074 | 0.9898 | 1.2025 |
| hcx | 0.8976 | 0.9147 | 0.8701 | 1.0758 | 0.9847 | 0.8608 | 0.873 | 0.9287 | 0.9941 | 1.0061 | 0.9396 | 1.0053 | 1.3795 | 0.9988 | 0.9926 | 0.9954 | 1.0612 |
| xwx | 0.9739 | 0.8017 | 1.0263 | 0.9981 | 0.9483 | 0.95 | 0.9627 | 1.0106 | 1.0186 | 0.9891 | 0.9093 | 1.045 | 1.234 | 0.8574 | 1.03 | 1.1943 | 1.0925 |
| scx | 0.9533 | 0.8175 | 0.8248 | 1.1472 | 0.9647 | 0.9918 | 0.9762 | 1.0288 | 1.0369 | 0.9542 | 0.9341 | 1.0066 | 1.191 | 1.0338 | 0.9758 | 0.8826 | 1.4424 |
| rjs | 1.0209 | 0.8929 | 0.9261 | 1.0942 | 0.9789 | 0.9727 | 1.0193 | 0.9929 | 1.0088 | 0.9793 | 0.9752 | 0.9933 | 1.1321 | 0.9973 | 0.9975 | 1.1399 | 0.9798 |
| jax | 1.0235 | 1.0264 | 0.8765 | 1.2748 | 1.2424 | 1.0683 | 0.9668 | 1.0049 | 1.0377 | 0.9653 | 0.9977 | 0.9951 | 1.108 | 0.8868 | 0.9652 | 1.005 | 1.0218 |
| jsx | 1.0095 | 0.9372 | 0.936 | 1.0954 | 1.1563 | 0.9887 | 1.0515 | 1.1634 | 1.1299 | 1.0009 | 0.9899 | 0.9486 | 1.1971 | 0.9115 | 0.9635 | 1.0109 | 1.1771 |
| xjx | 0.9805 | 1.0099 | 0.9834 | 1.0806 | 1.0001 | 0.9199 | 1.0033 | 1.0027 | 0.9959 | 0.9517 | 0.9671 | 0.9721 | 1.2359 | 0.9931 | 0.9868 | 0.9943 | 0.9484 |
| xgx | 1.022 | 0.9469 | 1.0084 | 0.9833 | 1.0191 | 0.9415 | 1.0553 | 0.9855 | 1.0325 | 0.9871 | 0.9495 | 0.9937 | 1.1627 | 0.9281 | 0.966 | 1.0381 | 1.1135 |
| yfx | 0.8547 | 0.9135 | 0.9858 | 1.0091 | 0.9529 | 0.961 | 0.9675 | 1.0548 | 1.0547 | 1.0353 | 1.1126 | 0.9712 | 1.1952 | 0.8869 | 0.9399 | 1.0488 | 1.088 |
| thx | 1.001 | 0.8315 | 0.9312 | 1.14 | 0.9875 | 1.1479 | 0.9784 | 1.1338 | 1.0119 | 0.9973 | 0.9333 | 0.9467 | 1.1854 | 0.8601 | 0.9466 | 0.9814 | 1.023 |
| scx | 1.0693 | 0.9232 | 0.978 | 1.0076 | 1.0318 | 0.9882 | 0.9469 | 0.9492 | 1.0313 | 0.9872 | 1.0476 | 0.9793 | 1.2152 | 0.9554 | 0.9792 | 1.0931 | 1.0918 |
| wax | 0.9367 | 0.8397 | 0.9215 | 1.2891 | 1.363 | 1.0428 | 1.0555 | 1.0508 | 0.9746 | 1.0522 | 0.9688 | 0.874 | 1.2387 | 0.8108 | 0.9667 | 0.9576 | 1.1621 |
| afx | 0.9364 | 0.9423 | 0.885 | 1.1776 | 1.0617 | 1.003 | 0.9933 | 1.0799 | 1.0177 | 1.0027 | 0.9991 | 1.003 | 1.1724 | 0.953 | 0.9609 | 1.0486 | 1.0583 |
| yxx | 0.9848 | 1.0692 | 0.8809 | 1.1207 | 1.0836 | 0.9851 | 1.1293 | 1.0262 | 1.1012 | 0.9942 | 1.0004 | 1.0013 | 1.0795 | 0.9837 | 0.9681 | 1.0522 | 1.0131 |
| jgss | 0.9334 | 1.2127 | 0.9941 | 0.9275 | 1.052 | 1.0009 | 0.9829 | 1.0031 | 0.9132 | 1.0096 | 1.0238 | 0.9949 | 1.0909 | 0.9972 | 1.005 | 1.0067 | 1.0782 |
| fxx | 0.9504 | 0.9321 | 0.874 | 1.3276 | 1.0992 | 0.9825 | 0.9912 | 1.063 | 0.9898 | 1.0261 | 1.1286 | 0.9821 | 0.9338 | 0.9199 | 1.0111 | 0.916 | 1.2283 |
| wzx | 0.9235 | 0.9561 | 1.0351 | 0.9883 | 0.992 | 0.8441 | 1.1451 | 0.9546 | 0.9981 | 0.9901 | 1.0053 | 1.0008 | 1.1335 | 0.9005 | 0.9048 | 0.9354 | 1.3246 |
| sgx | 0.982 | 0.9936 | 1.0008 | 1.0782 | 1.0074 | 0.986 | 0.9995 | 1.0041 | 0.9969 | 0.9561 | 1.0561 | 0.9603 | 1.1432 | 0.8587 | 0.9483 | 1.0268 | 1.2641 |
| yfx | 0.9159 | 0.908 | 0.8872 | 1.1143 | 1.0954 | 0.9268 | 1.0952 | 1.0299 | 1.0007 | 0.9624 | 1.0357 | 1.1752 | 1.0737 | 0.9827 | 1.005 | 0.8539 | 1.003 |
| jax | 1.0013 | 1.0317 | 0.9846 | 1.0081 | 0.8579 | 1.1867 | 1.0018 | 1.0052 | 1.0209 | 0.9792 | 0.9975 | 1.0157 | 0.9923 | 0.9848 | 1.0112 | 1.0116 | 0.9976 |
| tgx | 0.7841 | 1.0648 | 0.9073 | 1.1199 | 0.8375 | 1.0861 | 1.0797 | 1.1023 | 0.9473 | 0.9729 | 0.9184 | 1.0959 | 1.0857 | 1.005 | 1.0327 | 1.0236 | 1.0267 |
| fcs | 0.6261 | 0.9412 | 0.9758 | 1.0591 | 1.0163 | 0.9825 | 1.0725 | 1.018 | 0.9666 | 1.0744 | 0.9348 | 0.9453 | 1.1435 | 0.9725 | 0.986 | 0.9904 | 0.9892 |
| zss | 0.8816 | 0.9892 | 1.0895 | 1.1917 | 1.0397 | 1.0002 | 1.003 | 1.0066 | 1.002 | 1.0045 | 0.9954 | 0.9639 | 1.1906 | 0.8435 | 0.9612 | 1.1609 | 1.0639 |
| gas | 0.9761 | 0.9864 | 1.016 | 1.0592 | 1.0135 | 0.9876 | 1.059 | 1.1182 | 1.0279 | 0.9775 | 1.009 | 0.9828 | 1.193 | 0.8431 | 0.9796 | 1.0963 | 1.0813 |
| ncx | 1.0016 | 0.9771 | 0.9436 | 1.1025 | 1.0031 | 0.9888 | 1.0013 | 1.0055 | 0.9979 | 1.0017 | 1.0023 | 0.9962 | 1.083 | 0.9725 | 1.0052 | 0.9776 | 1.0748 |
| lcx | 0.9858 | 0.9715 | 0.9201 | 0.9771 | 1.0511 | 0.9457 | 0.9606 | 1.0221 | 0.9988 | 0.8611 | 1.0114 | 1.0133 | 1.1416 | 1.0754 | 0.956 | 0.9697 | 1.2861 |
| nfx | 0.994 | 0.8764 | 1.0722 | 1.097 | 0.9937 | 0.9211 | 0.8902 | 0.9039 | 0.9841 | 1.0558 | 0.9793 | 0.9297 | 1.3442 | 0.9532 | 0.9727 | 0.9188 | 1.1025 |
| crx | 1.0063 | 0.9872 | 1.0048 | 1.1328 | 0.9984 | 0.9188 | 0.9921 | 0.9918 | 1.0435 | 0.986 | 0.9954 | 0.9906 | 1.0745 | 0.9293 | 0.9326 | 0.9869 | 1.5904 |
| lax | 1.169 | 0.8912 | 0.8611 | 1.2857 | 1.154 | 0.7037 | 1.0954 | 0.8335 | 1.0313 | 1.0013 | 1.0348 | 0.987 | 1.1996 | 0.9043 | 1.0488 | 0.9748 | 1.5276 |
| yhx | 0.9859 | 0.9904 | 0.9703 | 1.0107 | 0.9896 | 0.9923 | 0.9938 | 0.994 | 0.9947 | 0.9948 | 0.9552 | 1.0559 | 1.0674 | 1.0017 | 1.0428 | 0.9661 | 1.0076 |
| jxx | 1.0054 | 0.9202 | 0.8148 | 1.2359 | 1.0201 | 0.9283 | 1.0071 | 0.9752 | 0.9555 | 0.8944 | 0.9798 | 0.9584 | 1.1006 | 1.0154 | 0.9448 | 1.0264 | 1.2319 |
| zxx | 0.9244 | 0.934 | 0.9735 | 1.0373 | 1.0105 | 1.0127 | 0.9824 | 1.006 | 0.9942 | 0.9468 | 0.9447 | 1.0956 | 0.968 | 1.0265 | 1.0388 | 1.0399 | 1.0138 |
| dxx | 1.1012 | 0.9379 | 1.1313 | 1.1193 | 0.9642 | 0.8841 | 1.0227 | 1.0687 | 0.9256 | 0.9796 | 0.9784 | 0.9695 | 1.4086 | 0.7913 | 0.9488 | 1.0051 | 1.2847 |
| gcx | 1.0083 | 0.945 | 0.9277 | 1.0123 | 1.0089 | 0.9958 | 0.9911 | 1.0408 | 1.0526 | 0.8118 | 0.9285 | 1.5037 | 1.0141 | 1.0022 | 0.9954 | 1.0124 | 1.0993 |
| gfq | 0.9855 | 1.0836 | 0.7885 | 1.3326 | 0.9915 | 1.0058 | 0.9958 | 1.0004 | 0.8331 | 1.0429 | 0.9473 | 0.9541 | 1.1899 | 1.023 | 1.118 | 0.8374 | 0.9966 |
| srx | 0.9179 | 0.9776 | 1.0299 | 0.978 | 0.9228 | 0.9796 | 0.9284 | 1.5961 | 1.2506 | 0.865 | 0.8985 | 0.9251 | 1.1953 | 0.9979 | 1.0549 | 0.8628 | 1.0117 |
| ysx | 0.9236 | 1.0943 | 1.215 | 0.8459 | 0.9737 | 1.0067 | 0.9439 | 1.0348 | 1.0603 | 1.3577 | 0.704 | 0.9841 | 1.2019 | 1.0053 | 0.9947 | 0.8824 | 0.9946 |
| ysx | 0.9774 | 0.9742 | 0.9948 | 0.9488 | 0.9814 | 0.9344 | 1.0374 | 1.0074 | 1.0897 | 0.9622 | 0.9839 | 0.8032 | 1.2641 | 0.9433 | 1.0995 | 0.9377 | 0.9906 |
| hfx | 1.015 | 0.9553 | 0.7893 | 1.1676 | 0.8509 | 1.124 | 1.0354 | 1.0558 | 1.0635 | 1.0592 | 0.85 | 1.1929 | 1.0939 | 0.974 | 0.9995 | 0.9538 | 1.0156 |
| yyx | 1.6282 | 0.991 | 0.9929 | 0.616 | 0.9915 | 1.0252 | 1.1572 | 0.9668 | 1.0442 | 0.9304 | 1.1218 | 0.9329 | 1.2585 | 0.8941 | 1.0589 | 1.0191 | 1.0284 |
| ygx | 1.0578 | 0.9971 | 0.994 | 1.2765 | 1.0914 | 0.9029 | 1.0815 | 1.0373 | 0.9843 | 1.0162 | 1.0971 | 0.9068 | 1.2396 | 0.9964 | 0.9965 | 1.0788 | 0.8611 |
| pyx | 1.0798 | 0.9809 | 0.7863 | 1.22 | 0.9661 | 0.849 | 1.1723 | 1.0946 | 1.0196 | 1.0022 | 0.9932 | 0.9972 | 1.0716 | 0.8817 | 1.0605 | 0.7938 | 1.3653 |
| wnx | 0.9508 | 1.0456 | 0.9969 | 1.0351 | 0.9831 | 0.9573 | 0.9907 | 1.0019 | 1.0416 | 0.9761 | 0.977 | 0.9943 | 1.0476 | 0.9739 | 1.0006 | 1.0146 | 1.0341 |
| wyx | 1.111 | 1.1332 | 1.06 | 1.0401 | 0.9509 | 0.9576 | 0.9564 | 0.9699 | 1.2265 | 0.9187 | 0.9759 | 0.9702 | 1.1303 | 1.0049 | 0.9974 | 0.9851 | 0.9958 |
| dxs | 0.9078 | 0.9868 | 0.9834 | 0.9467 | 0.975 | 1.0858 | 0.9111 | 1.0355 | 1.0251 | 0.9706 | 0.9794 | 0.9243 | 1.4268 | 0.9728 | 0.9381 | 1.082 | 1.0379 |
| mean | 1.0069 | 0.9623 | 0.9712 | 1.0675 | 0.9990 | 0.9819 | 1.0110 | 1.0238 | 1.0195 | 0.9874 | 0.9804 | 0.9948 | 1.1907 | 0.9551 | 1.0122 | 0.9845 | 1.0834 |
References
- Wu, Y.S. The construction of agricultural ecological environment is the basis for the transformation of agricultural development mode. Rural Econ. 2011, 2, 104–107. (In Chinese) [Google Scholar]
- Wei, H.K. Ten cutting-edge research topics on agriculture, rural areas and farmers. Chin. Rural Econ. 2019, 4, 2–6. (In Chinese) [Google Scholar]
- Alem, H. Source of total factor productivity change: An empirical analysis of grain producing regions in Norway. Rev. Econ. 2017, 69, 8–18. [Google Scholar]
- Arshad, M.; Amjath-Babu, T.S.; Aravindakshan, S.; Krupnik, T.J.; Toussaint, V.; Kächele, H.; Müller, K. Climatic variability and thermal stress in Pakistan’s rice and wheat systems: A stochastic frontier and quantile regression analysis of economic efficiency. Ecol. Indic. 2018, 89, 496–506. [Google Scholar] [CrossRef]
- Li, L.; Tsunekawa, A.; Tsubo, M.; Koike, A.; Wang, J. Assessing total factor productivity and efficiency change for farms participating in Grain for Green program in China: A case study from Ansai, Loess Plateau. J. Food Agric. Environ. 2010, 8, 1185–1192. [Google Scholar]
- Zhang, L.; Bao, B. Empirical analysis on spatio-temporal evolution and driving forces of food total factor production in major grain producing Areasofour Country. Econ. Geogr. 2016, 36, 147–152. (In Chinese) [Google Scholar]
- Mukherjee, D.N.; Vasudev, N.; Kumari, R.V.; Suhasini, K. Nonparametric estimation and decomposition of total factor productivity of rice and maize in Telangana State. Bull. Environ. Pharmacol. Life Sci. 2017, 6, 26–31. [Google Scholar]
- Monga, S.; Sidana, B.K. Total factor productivity of coarse cereals in India: State-level analysis using Malmquist approach. J. Pharmacogn. Phytochem. 2020, 9, 683–689. [Google Scholar]
- Divya, K.; Devi, I.B.; Kumari, P.L. Total Factor Productivity Growth of Rice and Maize in Andhra Pradesh, India. Int. J. Curr. Microbiol. Appl. Sci. 2020, 9, 2852–2857. [Google Scholar] [CrossRef]
- Boussemart, J.P.; Leleu, H.; Ojo, O. The spread of pesticide practices among cost-efficient farmers. Environ. Model. Assess. 2013, 18, 523–532. [Google Scholar] [CrossRef]
- Blancard, S.; Boussemart, J.; Briec, W.; Kerstens, K. Short-and long-run credit constraints in French agriculture: A directional distance function framework using expenditure-constrained profit functions. Am. J. Agric. Econ. 2006, 88, 351–364. [Google Scholar] [CrossRef]
- Singbo, A.G.; Lansink, A.O. Lowland farming system inefficiency in Benin (West Africa): Directional distance function and truncated bootstrap approach. Food Secur. 2010, 2, 367–382. [Google Scholar] [CrossRef] [Green Version]
- Min, R.; Li, G.C. Spatial differentiation of grain production technical efficiency in China from the perspective of “two types”. Econ. Geogr. 2013, 33, 144–149. (In Chinese) [Google Scholar]
- Watto, M.A.; Mugera, A.W. Measuring production and irrigation efficiencies of rice farms: Evidence from the Punjab Province, Pakistan. Asian Econ. J. 2014, 28, 301–322. [Google Scholar] [CrossRef]
- Kijek, A.; Kijek, T.; Nowak, A.; Skrzypek, A. Productivity and its convergence in agriculture in new and old European Union member states. Agric. Econ. 2019, 65, 01–09. [Google Scholar] [CrossRef]
- Liu, Y.; Feng, C. What drives the fluctuations of “green” productivity in China’s agricultural sector? A weighted Russell directional distance approach. Resour. Conserv. Recycl. 2019, 147, 201–213. [Google Scholar] [CrossRef]
- Song, M.; Zhao, X.; Choi, Y. Technical efficiency of Chinese forestryand its total factor productivity for the adaption of the climate change. J. For. Econ. 2020, 35, 149–175. [Google Scholar]
- Coelli, T.; Rahman, S.; Thirtle, C. Technical, allocative, cost and scale efficiencies in Bangladesh rice cultivation: A non-parametric approach. J. Agric. Econ. 2002, 53, 607–626. [Google Scholar] [CrossRef]
- Fang, F. Spatial-temporal pattern and convergence of agricultural production efficiency in Beijing-Tianjin-Hebei region. World Reg. Stud. 2019, 28, 130–140. (In Chinese) [Google Scholar]
- Zhang, H.; Han, P. Measurement and convergence analysis of agricultural total factor productivity: Based on Hicks-Moorsteen index. Rural Econ. 2018, 06, 55–61. (In Chinese) [Google Scholar]
- Fuglie, K.O. Is agricultural productivity slowing? Glob. Food Secur. 2018, 17, 73–83. [Google Scholar] [CrossRef]
- Shi, C.; Zhu, J.; Jie, C. Regional differences and convergence analysis of agricultural total factor productivity growth in China: Based on fixed effects SFA model and panel unit root method. Explor. Econ. Probl. 2016, 04, 134–141. (In Chinese) [Google Scholar]
- Zhou, P.; Shen, Y.; Zhang, Z. Promoting effect of new urbanization on high quality development of agriculture. J. Fujian Agric. Univ. (Philos. Soc. Sci. Ed.) 2021, 24, 1–11. (In Chinese) [Google Scholar]
- Ban, L.; Yuan, X. Differences and spatial influence mechanism of green economic efficiency between China’s Eight Regions. J. Xi’an Jiao Tong Univ. (Soc. Sci.) 2016, 36, 22–30. (In Chinese) [Google Scholar]
- Chambers, R.G.; Chung, Y.; Färe, R. Benefit and Distance Functions. J. Econ. Theory 1996, 70, 407–419. [Google Scholar] [CrossRef]
- Hintz, E.; Hofert, M.; Lemieux, C. Normal variance mixtures: Distribution, density and parameter estimation. Comput. Stat. Data Anal. 2021, 157, 107175. [Google Scholar] [CrossRef]
- Han, H.B.; Li, G.C.; He, A. Spatail-temporal characteristics and dynamic evolution of agricultural growth quality in China from 2000 to 2015. J. Guangdong Univ. Financ. Econ. 2017, 32, 95–105. (In Chinese) [Google Scholar]
- Wu, P.; Jin, X.Y.; Ma, L. China’s regional economic development gap from the perspective of numerical distribution and spatial distribution from 1952 to 2008. Econ. Sci. 2010, 46–58. (In Chinese) [Google Scholar]
- Pan, D. Research on China’s Agricultural Productivity Considering Resource and Environmental Factors. Ph.D. Thesis, Nanjing Agricultural University, Nanjing, China, 2012. (In Chinese). [Google Scholar]
- Sharififar, A.; Sarmadian, F.; Minasny, B. Mapping imbalanced soil classes using Markov chain random fields models treated with data resampling technique. Comput. Electron. Agric. 2019, 159, 110–118. (In Chinese) [Google Scholar] [CrossRef]
- Lin, X.; Zhang, G.; Wei, S. Velocity prediction using Markov Chain combined with driving pattern recognition and applied to Dual-Motor Electric Vehicle energy consumption evaluation. Appl. Soft Comput. 2021, 101, 106998. (In Chinese) [Google Scholar] [CrossRef]
- Hu, S.; Jiao, S.; Zhang, X. The Spatio-temporal Evolution and Influencing Factors of China’s Urban Tourism Development—Based on the Analysis of the Dynamic Spatial Markov Chain Model. J. Nat. Resour. 2021, 36, 854–865. (In Chinese) [Google Scholar]
- Dong, Y.; Sun, J. Analysis of the dynamic evolution of income distribution of regional economy: A case of Zhejiang province. Contemp. Financ. Econ. 2009, 3, 25–30. (In Chinese) [Google Scholar]
- Bao, B.; Jiang, A.; Jin, S.; Zhang, R. The evolution and influencing factors of total factor productivity of grain production environment: Evidence from Poyang Lake Basin, China. Land 2021, 10, 606. [Google Scholar] [CrossRef]
- Zhang, L.; Bao, B.; Pan, D. Spatial-Temporal Evolution and Environmental Coordination of Technical Efficiency of Grain Production in Poyang Lake Eco-Economic Zone. Econ. Geogr. 2016, 36, 116–123. (In Chinese) [Google Scholar]
- Tian, X.; Wang, S. Environmental efficient and its determints regarding China grain production. Resour. Sci. 2016, 38, 2106–2116. (In Chinese) [Google Scholar]
- Fischer, G.; Winiwarter, W.; Ermolieva, T.; Cao, G.Y.; Qui, H.; Klimont, Z. Integrated modeling framework for assessment and mitigation of nitrogen pollution from agriculture: Concept and case study for China. Agric. Ecosyst. Environ. 2010, 136, 116–124. [Google Scholar] [CrossRef]
- Chen, Y.; Feng, Y.; Yang, G. Verification of Environmental Kuznets curve of agricultural non-point source pollution in Shaanxi Province. J. Agrotech. Econ. 2010, 183, 22–29. (In Chinese) [Google Scholar]
- Hou, M.; Yao, S. Convergence and differentiation characteristics on agro-ecological efficiency in China from a spatial perspective. China Popul. Resour. Environ. 2019, 29, 116–126. (In Chinese) [Google Scholar]
- Wu, L. Study on Temporal-spatial Distribution of Agricultural Non-point Source Pollution in Poyang Lake Region. Acta Agric. Jiangxi 2012, 24, 159–163. (In Chinese) [Google Scholar]
- Guo, H.; Liu, X. Spatio-temporal evolution of China’s agricultural green total factor productivity. Chin. J. Manag. Sci. 2020, 28, 66–75. (In Chinese) [Google Scholar]
Publisher’s Note: MDPI stays neutral with regard to jurisdictional claims in published maps and institutional affiliations. |
© 2021 by the authors. Licensee MDPI, Basel, Switzerland. This article is an open access article distributed under the terms and conditions of the Creative Commons Attribution (CC BY) license (https://creativecommons.org/licenses/by/4.0/).