Abstract
The superimposed magnetic field affects the microstructure and mechanical properties of additively manufactured metal parts. In this work, the samples were fabricated from Inconel 718 superalloy by directed energy deposition under a 0.2 T static field. The magnetohydrodynamic 1D model is proposed for the estimation of a fluid flow inside a molten pool. According to the theoretical predictions, the fluid flow is slightly decreased by an applied field. The estimated thermoelectric magnetic convection in the mushy zone is shown to be negligible to change in subgrain size, but enough to reduce the hard-to-dissolve Nb-rich phase, thereby improving the average ultimate elongation from 23% to 27%. The obtained results confirm that an external static magnetic field can modify and enhance the mechanical properties of additively manufactured materials.
1. Introduction
The physical properties of additively manufactured (AM) material via directed energy deposition (DED) attract interest in various industries [1,2,3]. Nevertheless, both engineers and researchers struggle against uncontrollable multiscale physical processes, whose consequences can be mitigated by utilizing the magnetic field (MF) [4,5,6], ultrasound [7], preheating [8], etc.
The hydrodynamics at the molten pool scale are usually controlled by the dominant Marangoni force and recoil pressure [9,10,11,12]. The Marangoni convection is caused by a gradient of surface tension that is a function of concentration and temperature. The motion of the electrically conductive medium in the MF induces an electric current inside it. This phenomenon is called the magnetohydrodynamic (MHD) effect. The emerging Lorentz force dampens fluid convection [13,14], thereby reducing the residual porosity.
In a mushy zone, the temperature gradient near the liquid–solid interface generates the thermoelectric (TE) current (Seebeck effect) [15,16,17]. Depending on the applied MF and the TE current density, a thermoelectric magnetohydrodynamic (TEMHD) force arises [6]. The resulting interdendritic TEMHD convection can provoke the columnar to equiaxed transition (CET) and alter the solute distribution, thereby changing the subgrain (cell) microstructure, which in turn affects the overall mechanical properties [18,19]. At low solidification rates, a fluid flow in the interdendritic region is controlled by the buoyancy-driven force based on the thermal and solutal gradients, leading to a density difference [19,20]. However, in AM technology, the buoyancy-driven force becomes negligible.
Du et al. [14] found that applying a 0.12 T vertical static MF in laser powder bed fusion (LPBF) increases the ultimate strength by 23% and elongation by 32% in processed AlSi10Mg alloy. They also showed that the number of columnar grains decreases by 44% when exposed to an MF, while the dendrite arm spacing is reduced only slightly. In contrast, Du et al. [5] established that the cell spacing is increased at a 0.1 T MF during the DED for Inconel 718 superalloy. Wang et al. [21] showed that an applied 1.8 T MF leads to enhanced grain alignment along the preferable direction without changing the average size for Inconel 718 superalloy. Moreover, they showed that the TEMHD convection drastically increases the dissolution of hardly soluble elements by removing the brittle Laves phases. Liu et al. [22] demonstrated a 22% increase in ultimate elongation of fabricated Inconel 718 superalloy using 0.08 T electromagnetic stirring with 50 Hz frequency. Additionally, they observed that the Vickers microhardness is increased by 15%, and the volume fraction of the Laves phases is decreased by 56%.
Although the MF effects on the structural and mechanical properties of AM material are widely studied, and some results have already shown significant benefits in material performance, the obtained experimental outcomes for the cell spacing are ambiguous. Moreover, there is currently no thorough theoretical analysis of the MF influence on the evolution of the AM material microstructure.
This study has a twofold purpose. Firstly, to analyze a 0.2 T vertical and a 0.15 T horizontal MF influence on the material performance of fabricated Inconel 718 superalloy by the DED. Secondly, to explain the observed results using theoretical analysis.
2. Theoretical Methods
2.1. Fluid Flow in the Molten Pool
The following equations, written in conventional SI units, describe the flow of incompressible viscous electrically conducting fluid in the presence of an MF [23,24]:
where is the velocity of the fluid flow, is the magnetic field, = 1.256 × 10⁻⁶ H m−1 is the vacuum permeability, is the electrical conductivity, is the density, is the dynamic viscosity, p is the internal pressure.
The above system of equations supposes that the electric current density is derived via generalized Ohm’s law [16]:
where is the electric field intensity, S is the absolute TE power of the medium or the absolute Seebeck coefficient, T is the temperature.
Finally, it is assumed that the magnetic permeability 1 and the displacement current is much less than the electric current due to the low-frequency (non-relativistic) assumption, thereby eliminating the polarization of the medium. The following boundary conditions are valid at the gas–liquid interface [24]:
where subscripts and correspond to the gas and liquid quantities, respectively, is the surface tension, is the unit normal directed into the gas, and
is the viscous stress tensor. In the case of a temperature-dependent surface tension, , . Additionally, conditions
are imposed in the case and .
The general boundary conditions at the liquid–solid interface are derived by integrating Equation (4) around the narrow loop straddling the interface [15]:
where subscript corresponds to the solid quantity, are obtained from Maxwell’s equation [15,25]:
Let us consider a simplified 1D model of the molten pool under the static vertical MF as a unidirectional flow along the x axis between two infinite parallel surfaces: the upper one () corresponds to the gas–liquid interface, and the lower one () corresponds to the liquid–solid interface, where the fluid is resting (Figure 1). The uniform temperature gradient exists along the gas–liquid interface. The ambient pressure is equal to .
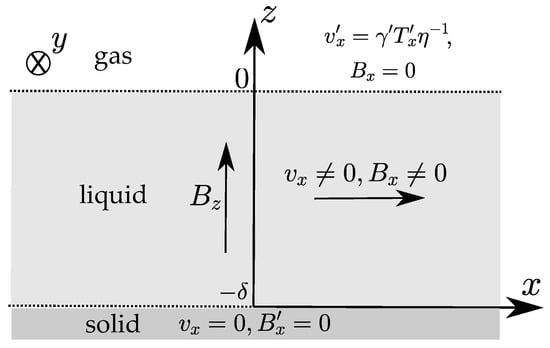
Figure 1.
The problem geometry under the vertical static MF.
The general solution of Equation (10) is given as
where and are some specific constants. The boundary conditions (5) and (7) take the form
at . Here, it is assumed that the gas viscous stress tensor is negligible. In addition, due to the absence of the electric current in the gas, , which defines the field to a constant. However, for the sake of certainty, we zero it out.
Here, it is supposed that the longitudinal temperature gradient is assumed to also be negligible. The constants are given by
Therefore, the general solution (11)–(12) takes the form
which can be nondimensionalized as
according to the following relations:
where Ha is the Hartmann number, which determines the ratio between the magnetic and viscous forces, and are the characteristic velocity and induced MF, respectively, given by
The obtained solutions are shown in Figure 2.
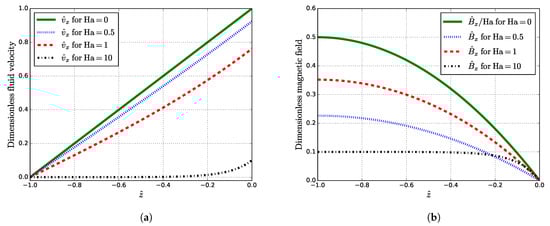
As shown in Figure 2a, the value of is dampened as Ha grows. As the Ha number increases, decays (Figure 2b). Notice that at , the induced MF at the liquid–solid interface is slightly higher than at . Velocity and induced MF reach their maxima at and , respectively, where their values are
Furthermore, the change in the fluid velocity at the liquid–solid interface () is proportional to the viscous force that acts tangentially on the solid surface:
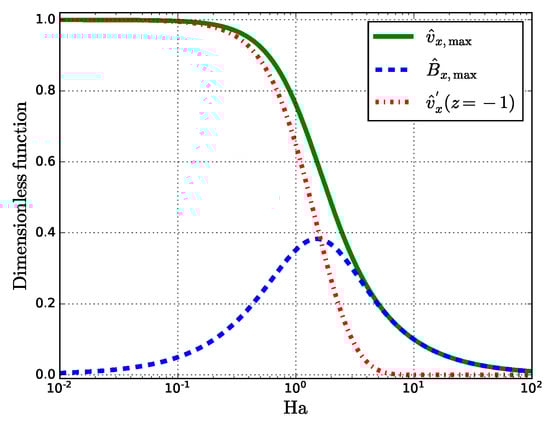
Figure 3.
Semi-log plot of , , and versus Ha.
Since is a monotonically decreasing function of Ha, it should be inferred that the induced Lorentz force, regardless of its strength, has a damping effect and brakes the fluid flow. The behavior of the induced MF near (Figure 2b) can be explained by reaching a maximum with a subsequent drop. For small Ha, the maximum induced MF is that gives the following relation to the external static MF :
2.2. Fluid Flow in the Mushy Zone
The 2D picture of the fluid flow near the liquid–solid interface (a mushy zone) under the static horizontal MF and a longitudinal temperature gradient is schematically shown in Figure 4. The primary dendrite arm spacing (PDAS) and the thickness of the mushy layer h limit the interdendritic fluid flow.
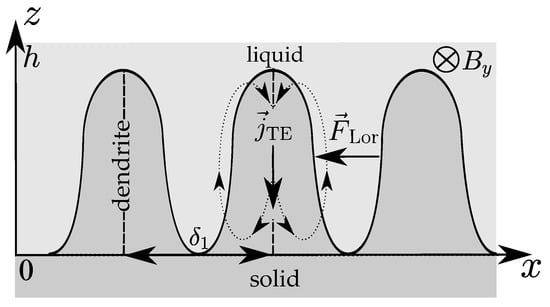
Figure 4.
The problem geometry under the horizontal static MF.
According to the approach proposed by Lehmann et al. [16], Darcy’s equation can accurately describe the behavior of the fluid flow:
where is fluid velocity, K is the permeability of a mushy zone, and are the buoyancy force and the Lorentz force per unit volume, respectively, which are given by [16,17,18]:
where is the solutal expansion coefficient, is the difference of the eutectic concentration and initial concentration of the alloying element .
The electric current density in the liquid can be found from the boundary conditions (8). Additionally, the condition for conserving the total current is added [15,26]:
where
where is the volume fraction of the particular phase. It should be emphasized that Equation (27) is obtained according to the Oberbeck–Boussinesq approximation, where the thermal expansion coefficient ( [27]) is omitted due to its smallness compared to ( [17]).
Owing to the specific liquid–solid distribution in the mushy zone, the definition of the permeability value is complicated. Moreover, since the structure of AM material mainly consists of columnar dendrites, the permeability should be considered anisotropic instead of the generally accepted Blake–Kozeny equation for the equiaxed dendrites [28]. Chamsri et al. [29] adapted the empirical Kozeny–Carman equation for the vertical columnar dendrites (cylindrical case):
According to the lever rule [30,31], the liquid fraction can be obtained from phase diagrams, assuming the temperature grows linearly along dendrites [32,33]. Moreover, the liquid fraction can be accurately predicted using kinetic models, but this is beyond the scope of this study. Thus, for simplicity, we take .
Assuming that is negligible compared to (the corresponding Lorentz–buoyancy ratio will be presented below in Section 4.1), Equation (26) shows that the direction of the total force is determined generally by . Thus, the magnitude of the velocity U is as follows:
Additionally, the Péclet number (Pe), which determines the ratio between the convection velocity and the rate of diffusion, is as follows [16]:
where D is the diffusion coefficient.
3. Experimental Methods
3.1. Sample Preparation
Inconel 718 (Carpenter Powder Products Inc., Bridgeville, PA, USA) powder was used as a feedstock material, which has a particle size distribution of d10 = 45 μm and d90 = 150 μm. The DED technology, which is implemented through the direct metal tooling (DMT) InssTeK MX-1000 printer with an ytterbium fiber laser with a power of 2 kW and a wavelength of 1070 nm (InssTeK DMT Metal AM Technology Specialist, Daejeon, Korea), was used for the two types of sample manufacturing in a protective argon atmosphere. The parallelepipedic and rectangular parts with a 6 × 6 × 12 mm3 size and a 20 × 60 × 12 mm3 size were printed in vertical MF (the applied MF coincides with the build direction) at corresponding volume energy densities (Figure 5a,c). In addition, the same rectangular parts were fabricated in the horizontal MF using the developed magnetic nozzle (the applied MF is normal to the build direction) (Figure 5b,d). The corresponding optimal laser-related settings, such as the laser power and laser spot diameter, and scan-related parameters, such as the scan speed, hatch spacing, and other printing parameters, are shown in Table 1. The scan strategy consisted of square and rectangular patterns rotated at intervals of 90° in each x-y plane. An additional laser pause of 5 s between rotations was provided to ensure a smoother surface and remove corner swellings due to overheating. Additionally, to avoid structural changes in the magnet that can cause field instability and amplitude attenuation, an 3 mm air gap was provided between the upper part of the magnet surface and the lower part of the substrate. Additionally, the magnet surface was shielded by copper foil, reflecting approximately 95% of the incident infrared radiation at a wavelength of 1070 nm.
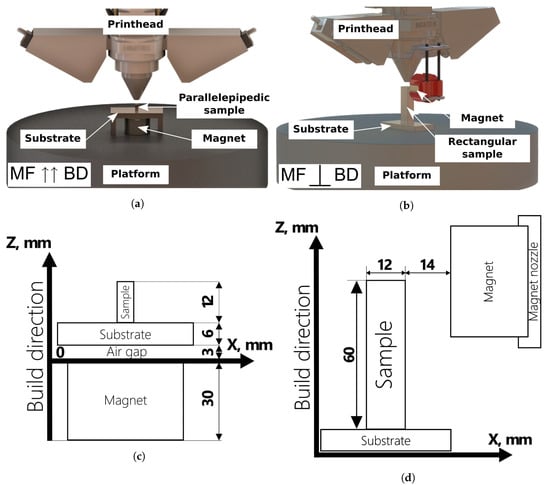
Figure 5.
Experimental setups for 3D printing and their schematic illustrations for the case of vertical (a,c) and horizontal (b,d) MF directions.

Table 1.
The printing parameters recommended by InssTeK.
The as-deposited parallelepipedic samples were sliced along and across (half-height) the build direction using the Accutom-100 cutting machine (Struers, Ballerup, Denmark). The sample mounting was performed via a TechPress 2 machine (Allied Corp., Rancho Dominguez, CA, USA) and then ground using 800-grit SiC via a MetPrep 3 machine (Allied Corp.). The final polishing was completed with a 40 nm colloidal silica (OP-U) suspension on a porous neoprene cloth with the applied force of 30 per sample and a dwell time of 30 (Allied Corp.). All polished samples were cleaned by water and air-blasting.
The flat dog-bone specimens were cut from rectangular samples for the tensile testing using the Mitsubishi MV-1200 (MV1200R) Advance wire electrical discharge machine (MC Machinery Systems, Inc., Elk Grove Village, IL, USA). The geometry of the samples was established by the American Society for Testing and Materials (ASTM) E8 standard. The working surfaces of cut-out samples were ground using 1000-grit SiC (Allied Corp.).
3.2. External Magnetic Field
The static MF was generated by the cylinder permanent neodymium Nd2Fe14B N52 magnet with a diameter of 50 mm and a height of 30 mm. The MF induction was measured using the Aktakom ATE–8702 magnetic meter (gaussmeter) with a maximum measurement of 3 T in the DC range (Lutron Electronic Enterprise Co., Ltd., Taipei, Taiwan). Additionally, to verify that the decrease in MF induction is negligible until a temperature threshold (maximum operating temperature) is reached, the measurements were conducted at room temperature and close to a maximum declared temperature (0.75 = 60 °C. The result obtained for the MF profile is shown in Figure 6.
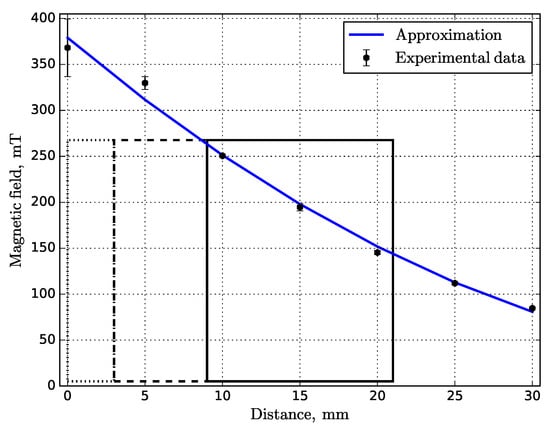
Figure 6.
MF versus the distance from the top of the magnet surface. The corresponding rectangular regions are as follows: air gap (dotted), substrate (dashed), printed sample (solid). The average value of the vertical MF .
3.3. Microstructure and Mechanical Properties Characterization
A Thermo Scientific Helios G4 PFIB UXe microscope (Thermo Fisher, Waltham, MA, USA) equipped with the Octane Elite Super detector (EDAX Inc., Mahwah, NJ, USA) was used for energy-dispersive X-ray spectroscopy (EDX), only for as-deposited parallelepipedic samples (front view). The mapping of the investigated sample surface was performed near the center of samples to obtain a more accurate result of the elemental distributions. The nitrogen and oxygen content was determined using a LECO TC-136 determinator (LECO Corporation, St. Joseph, MI, USA) for the fabricated sample under no and horizontal superimposed MF conditions. The hydrogen content was measured using an ELTRA ONH-2000 analyzer (Eltra GmbH, Haan, Nordrhein-Westfalen, Germany). According to the scanning electron microscopy (SEM) images taken with a Quattro S (Thermo Fisher), the average cell (subgrain) size was estimated by the mean linear intercept method using the open-source image processing software ImageJ 1.53e (Bethesda, MD, USA) for both views.
The front view of the fabricated sample under no and superimposed MF conditions was analyzed with X-ray diffraction (XRD) using a Bruker D8 ADVANCE (Bruker Corporation, Billerica, MA, USA) diffractometer with CuK radiation (with a wavelength of 1.5418 Å) over a 2 range between 30° and 100° at room temperature. The step size and dwell time were 0.03° and 100 s, respectively.
The parallelepipedic samples were investigated at room temperature for the planar porosity and microhardness in x-y and x-z planes. The planar porosity was determined using Axio Scope.A1 optical microscopy (Carl Zeiss AG, Jena, Germany) with Thixomet Pro software V 3.0.0048 (Thixomet Company, Saint Petersburg, Russia) and analyzed based on the ASTM E1245-03.
The microhardness was measured by microindentation testing using the Metrotest Vickers microhardness Tester ITV-1-AM (Metrotest LLC, Neftekamsk, Russia). The Vickers pyramid diamond indenter was used with an expansion angle of 136°. The microhardness measurements in the x-z plane included 24 points on each sample in the equivalent four regions with a width of ∼2 3 mm. The approximate vertical distance between the measurement points was at least 10 15 characteristic stamp sizes ( ), the applied load was 3N, and the creep time was 10 s. The microhardness measurements in the x-y plane included 10 points per sample with the same parameters of indentation described above.
The cut-out flat dog-bone specimens were subjected to tensile testing (gauge length was 32.0 ± 0.1 mm) at room temperature using the Instron 5969 Tensile Strength Tester (Illinois Tool Works Inc., Glenview, IL, USA) with a 10−3 s−1 strain rate in the build direction (vertical samples) and across (horizontal samples).
4. Results and Discussion
4.1. Theoretical Analysis
Let us use Equations (17), (18) and (32) for the numerical characterization of the fluid flow and induced MF for Inconel 718 superalloy. The physical properties of the used material and other parameters are presented in Table 2.
Table 2.
Physical properties of Inconel 718 and other parameters used for the calculations.
The temperature gradients and are defined as follows:
where and are the boiling and melting temperatures, respectively, is the dendrite tip temperature, is the melting point of the last interdendritic liquid or the eutectic temperature [18].
The estimated values are presented in Table 3. As seen, temperature gradients and have the same order ( K m−1), so for the simplification, can be taken instead of the . The obtained dependencies of the fluid velocity on depth are plotted in Figure 7a. The profiles for the maximums of fluid velocity and induced MF from Ha are shown in Figure 7b,c, respectively.
Table 3.
The estimated quantities.
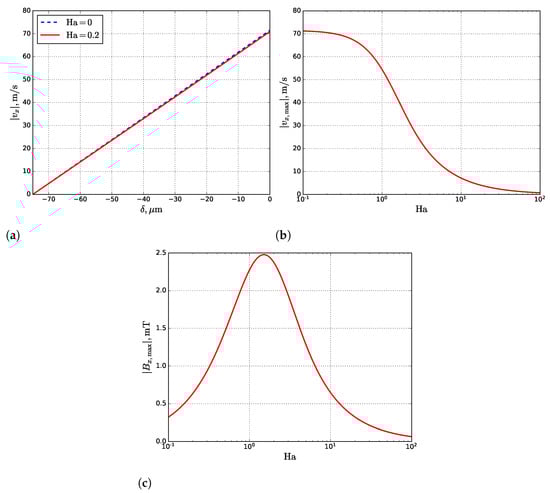
Figure 7.
The profiles of fluid velocity (a) inside the molten pool, given by Equation (17) at corresponding Ha, and semi-log plots of the maximum of fluid velocity (b) at the gas–liquid interface (), given by Equation (17), and induced MF (c) at the liquid–solid interface (), given by Equation (18) for the different Ha.
As seen in Figure 7b,c, a significant fluid velocity damping and maximum possible induced MF are reached at . However, the estimated Ha for the molten pool is , which affects the Marangoni convection weakly (Figure 7a). Moreover, to reduce the maximum fluid velocity by at least two times, the external MF must be T.
4.2. Microstructural and Phase Analysis
Figure 8 presents the result of the backscattered electron (BSE) image analysis for printed Inconel 718 samples under no and superimposed MF conditions. The microstructure consists of the differently shaped grains, which are formed by columnar cells. The MF influence on the cell size seems negligible and the results obtained are within the error range. For the front view, average cell size was unchanged at 5.2 μm, while for the top view, the average cell size was increased from 5.0 μm to 7.1 μm.
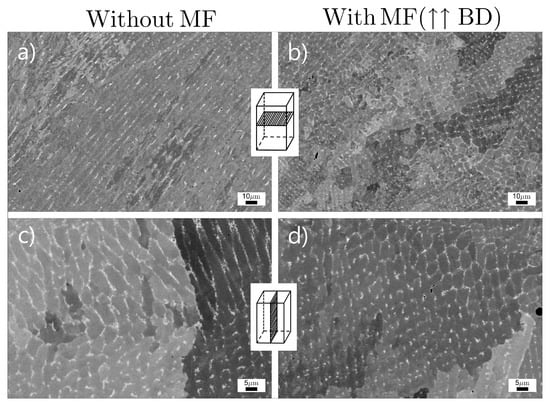
Figure 8.
BSE images of the as-deposited Inconel 718 samples in various investigated planes: (a,b) top and (c,d) front, and no (a,c) and with (b,d) applied vertical MF. The estimated cell sizes are as follows: (a) 5.0 ± 1.0 μm, (b) 7.1 ± 1.4 μ, (c) 5.2 ± 1.5 μm, and (d) 5.2 ± 1.0 μm.
Du et al. [14] showed that the estimated value of the Lorentz force is N m−3, which is sufficient for the destruction of the columnar dendrites and the cause of CET. Based on current calculations, the obtained value of is higher on one order ( N m−3), which should also underline the possibility of CET appearance.
According to the criterion proposed by Lehmann et al. [16], the PDAS depends on the TEMHD convection U:
where is the primary spacing without convection (pure diffusive solute transport regime), R is the solidification rate. Let , and then for the large , the dendrite arm spacing should decrease significantly. Otherwise, no distinct refinement should be expected, thus . Moreover, as mentioned in [16,20], when the diffuse-convective transition occurs (the balance of buoyancy and Lorentz force), the primary spacing increases until maximum, which identifies the planar solidification front [18]. As seen in Table 3, the Lorentz–buoyancy ratio is , so the developed Lorentz force is dominant, and no diffuse- convective transition should be observed.
Nevertheless, the value of can be estimated to verify the applicability of Equation (35) for AM technologies. The solidification rate R is proportional to the laser scan speed V, and the former is very high [21]. Then is close to 0, and no effect of the dendrite arm spacing decrease should be seen. However, based on the experiments, the results are the opposite of what was predicted. Du et al. [14] showed that the cellular dendrite spacing was decreased in the range of error even at a small for the LPBF processed AlSi10Mg alloy. Simultaneously, V is two orders smaller for the DED technique, so assuming that U is the same, the PDAS should decrease more obviously. However, according to the result obtained in [5], the spacing increased when the external MF increased. The authors suggested that convection in the molten pool is the same as in the interdendritic region, which contradicts [16]. According to the qualitative results obtained in [41], the imposition of the MF causes an increase in U as at a weak MF. Therefore, this should immediately cause the dendrite arm spacing to decrease. Based on our calculations (Table 3), the order of is , so there is no distinctive difference in the cell spacing (Figure 8c,d).
Gamma phase is observed as the main phase in Figure 9, which is also mentioned in [4,22,42,43]. The XRD analysis revealed no presence of Ni3(Al, Ti), Ni3Nb, and intermetallic Laves ((Ni, Cr, Fe)2(Nb, Mo, Ti)) phases [4,44,45]. As shown in Figure 9, the intensity of the maximums varies, which can be explained by differences in texture. The diffraction line (111) presents a slightly higher relative intensity for samples printed in the MF.
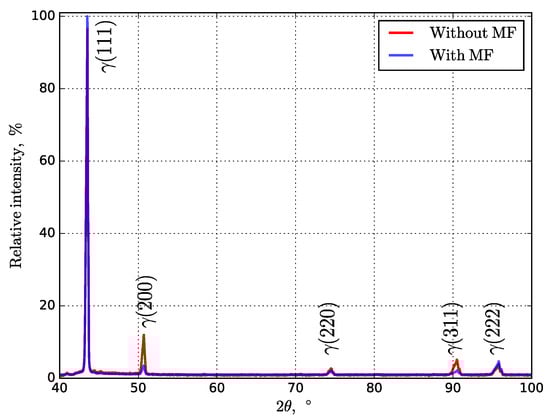
Figure 9.
Normalized XRD patterns up to the maximum for investigated Inconel 718 samples printed under no and superimposed MF conditions.
The chemical composition of the printed Inconel 718 samples under no and superimposed MF was analyzed using mapping (Table 4). It can be seen that the corresponding differences in the content of nitrogen and oxygen differ slightly, while the content of hydrogen increases twice. Although the XRD analysis result (Figure 9) did not reveal a delta phase, possibly due to its low content up to 5%, the Ni and Nb content decreased drastically, while the Fe content rose slightly when the MF was applied. According to the EDX results, almost all chemical elements seem homogeneously distributed, unlike the Nb and Mo located only in specific places (Figure 10, bright inclusion surrounded by the dashed lines) that possibly correspond to the delta phase. The accumulation of the Nb and Mo defines the growth kinetics of the formed phase, whose variable contrast is derived from the entire or partial dissolution of solid refractory metals. Therefore, microsegregation of the Nb and Mo occurs because not all elements are dissolved during solidification. The induced TEMHD convection in the interdendritic region can decrease the concentration of elements, pushing them towards the solidification front where the local temperature is higher [46]. Moreover, the estimated Pe is more than unity, leading to the prevailing convection over diffusion. Then, the probability of forming an intermetallic phase, where the Nb is the main trigger, decreases. In contrast, according to the spot analysis carried out exclusively at the cell boundaries, the average concentration of Nb and Mo was increased in an MF from 7.6 wt.% to 17.5 wt.% and from 2.9 wt.% to 3.8 wt.%, respectively. Besides, the cell boundaries were more explicit, emphasizing a more uniform ordering of Nb and Mo.
Table 4.
Energy-dispersive X-ray elemental analysis (EDX) and nitrogen, oxygen, and hydrogen content for AM Inconel 718 samples under no and superimposed MF.
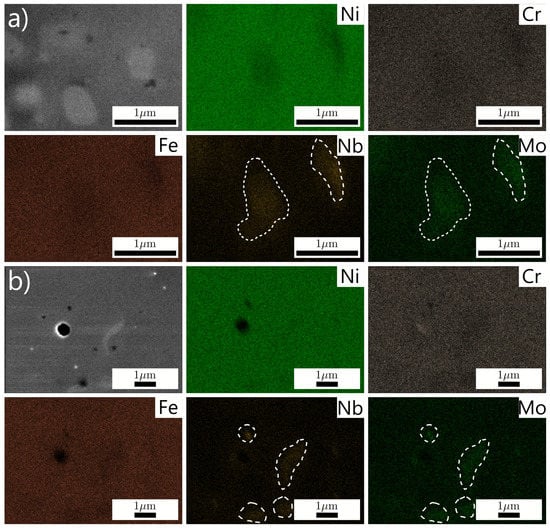
Figure 10.
Elemental distribution maps of AM Inconel 718 samples under no (a) and superimposed (b) vertical MF conditions.
4.3. Porosity, Microhardness, and Mechanical Testing
The experimental results of planar porosity, Vickers microhardness, and tensile tests for specimens printed in different configurations without and with MF are summarized in Table 5. The planar porosity results in the front view are illustrated in the optical micrographs (Figure 11). According to the analysis, the average porosity in the front view is decreased negligibly from 0.3% to 0.2% when exposed to an MF. However, the average pore size was slightly increased from 36 μm to 41 μm under superimposed MF. The porosity in the top view is not changed and equals 0.1%. Although the mechanisms of the pore formation are not definitively established, the observed spherical pores are dominant over irregularly shaped pores. This can identify the mechanism of porosity through the trapped gas by the initial powder feedstock and molten pool instead of the lack of fusion or keyhole mode [47,48]. Based on the predicted analytical results, the difference in magnitude of fluid velocity under the MF influence is negligible due to the smallness of Ha. Nevertheless, this is somewhat consistent with the optical micrographs (Figure 11), indicating a direct effect of fluid velocity on the final planar porosity.
Table 5.
Measured planar porosity, Vickers microhardness, and tensile strength values for fabricated Inconel 718 horizontal and vertical specimens under no and superimposed MF conditions.
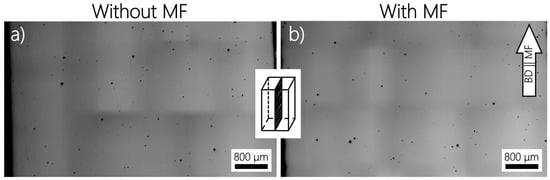
Figure 11.
The porosity of AM Inconel 718 samples under no (a) and superimposed (b) vertical MF. The estimated pore sizes are as follows: (a) 36 ± 16 μm and (b) 41 ± 24 μm.
The average Vickers microhardness in the front view was slightly increased from 273 HV to 278 HV under the MF influence, while in the top view was decreased from 281 HV to 267 HV. In addition, for the front view of both as-deposited samples, a specific correlation between the results of the planar porosity and Vickers microhardness was observed under no and superimposed MF conditions. The porosity was increased from the bottom to the top, while the Vickers microhardness was decreased.
The typical engineering stress–strain curves are plotted in Figure 12. The average ultimate tensile strength () of Inconel 718 samples was changed negligibly under the vertical and horizontal MF influence, from 1056 MPa to 1063 MPa and 821 MPa to 831 MPa, respectively. The apparent difference in average yield stresses () for samples fabricated vertically and horizontally, regardless of the MF, can be explained by the applied tensile load across and along the tracks. Finally, the observed average ductility () was enhanced from 23% to 27% under the horizontal MF, which confirms a decrease in the Nb-rich precipitates in the intragranular region and an increase in the intergranular [49]. In contrast, in the case of the vertical MF, there is no difference in ductility, which can be explained by the zero Lorentz force in the mushy zone.
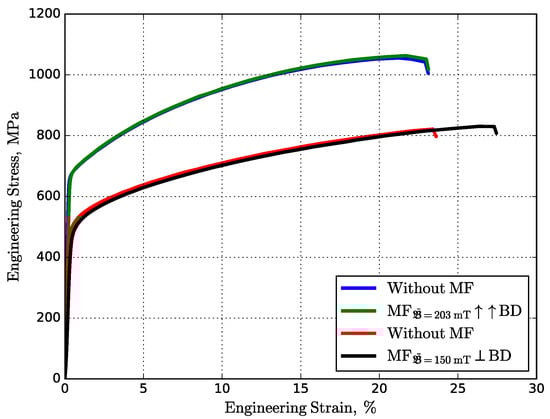
Figure 12.
Typical engineering stress–strain curves of fabricated Inconel 718 samples obtained at different mutual orientations between the MF and build direction. (The blue/green and red/black lines correspond to the printed horizontal and vertical samples.)
5. Conclusions
This work provides experimental results and theoretical validation for the fabricated Inconel 718 superalloy by directed energy deposition under a 0.2 T static magnetic field. According to the theoretical analysis, the induced Lorentz force dampens the Marangoni convection in the molten pool negligibly due to the small Ha, thereby slightly reducing the average planar porosity from 0.3% to 0.2%. The average Vickers microhardness was increased insignificantly for the front view under the MF and decreased by 5% for the top view. Notably, the Nb-based precipitates are reduced from 14.1 wt.% to 9.1 wt.% which can be explained by the dominant thermoelectric magnetohydrodynamic convection in the mushy zone. Finally, an average ultimate elongation was increased slightly by 4%. Although the obtained findings broaden the physical understanding of a magnetic field effect on metal 3D printing, a higher magnetic field is required to remarkably improve material performance. In addition, the solidification simulation under the TEMHD convection can provide insight into the microsegregation evolution in the interdendritic region that is crucial by means of mechanical properties.
Author Contributions
Conceptualization, A.M.F., O.A.R., I.S.A., and S.A.E.; theoretical analysis, A.M.F. and O.A.R.; sample preparation, A.M.F. and O.N.D.; microstructural and phase analysis, A.M.F., Y.O.K., O.N.D., and A.A.S.; investigation of mechanical properties, A.M.F., Y.O.K., and A.A.S.; writing—original draft preparation, A.M.F., O.A.R., I.V.O., and S.A.E.; supervision, O.A.R., I.S.A., I.V.O., and S.A.E. All authors have read and agreed to the published version of the manuscript.
Funding
Oleg N. Dubinin is grateful to the Ministry of Science and Higher Education of the Russian Federation as part of the World-class Research Center Program: Advanced Digital Technologies (contract No. 075-15-2020-903 of 16.11.2020).
Institutional Review Board Statement
Not applicable.
Informed Consent Statement
Not applicable.
Data Availability Statement
No new data were created or analyzed in this study. Data sharing is not applicable to this article.
Acknowledgments
The authors would like to thank the Additive Manufacturing Lab for conducting the experiments and providing equipment. Additionally, the authors are most grateful to Ilya N. Krupatin, Research Engineer, for his assistance with the SEM and EDX studies.
Conflicts of Interest
The authors declare no conflict of interest.
References
- Gibson, I.; Rosen, D.; Stucker, B. Additive Manufacturing Technologies: 3D Printing, Rapid Prototyping, and Direct Digital Manufacturing, 2nd ed.; Springer: New York, NY, USA, 2015; pp. 1–498. [Google Scholar] [CrossRef]
- Piscopo, G.; Atzeni, E.; Salmi, A. A hybrid modeling of the physics-driven evolution of material addition and track generation in laser powder directed energy deposition. Materials 2019, 12, 2819. [Google Scholar] [CrossRef] [Green Version]
- Piscopo, G.; Salmi, A.; Atzeni, E. Influence of High-Productivity Process Parameters on the Surface Quality and Residual Stress State of AISI 316L Components Produced by Directed Energy Deposition. J. Mater. Eng. Perform. 2021. [Google Scholar] [CrossRef]
- Wang, J.; Wang, Y.; Shi, J.; Su, Y. Effect of external magnetic field on the microstructure of 316L stainless steel fabricated by directed energy deposition. In Proceedings of the ASME 2019 International Mechanical Engineering Congress and Exposition, Salt Lake City, UT, USA, 11–14 November 2019; Volume 2B-2019, pp. 1–5. [Google Scholar] [CrossRef]
- Du, D.; Dong, A.; Shu, D.; Wang, D.; Zhu, G.; Sun, B.; Lavernia, E.J. Influence of Static Magnetic Field on the Microstructure of Nickel-Based Superalloy by Laser-Directed Energy Deposition. Metall. Mater. Trans. A Phys. Metall. Mater. Sci. 2020, 51, 3354–3359. [Google Scholar] [CrossRef]
- Kao, A.; Gan, T.; Tonry, C.; Krastins, I.; Pericleous, K. Study of thermoelectric magnetohydrodynamic convection on solute redistribution during laser additive manufacturing. IOP Conf. Ser. Mater. Sci. Eng. 2020, 861, 1–8. [Google Scholar] [CrossRef]
- Todaro, C.J.; Easton, M.A.; Qiu, D.; Zhang, D.; Bermingham, M.J.; Lui, E.W.; Brandt, M.; StJohn, D.H.; Qian, M. Grain structure control during metal 3D printing by high-intensity ultrasound. Nat. Commun. 2020, 11, 142. [Google Scholar] [CrossRef] [PubMed]
- Chen, Q.; Zhao, Y.; Strayer, S.; Zhao, Y.; Aoyagi, K.; Koizumi, Y.; Chiba, A.; Xiong, W.; To, A.C. Elucidating the effect of preheating temperature on melt pool morphology variation in Inconel 718 laser powder bed fusion via simulation and experiment. Addit. Manuf. 2021, 37, 101642. [Google Scholar] [CrossRef]
- Saldi, Z.S. Marangoni Driven Free Surface Flows in Liquid Weld Pools. Ph.D. Thesis, Delft University of Technology, Delft, The Netherlands, 2012. [Google Scholar]
- Leung, C.L.A.; Marussi, S.; Atwood, R.C.; Towrie, M.; Withers, P.J.; Lee, P.D. In situ X-ray imaging of defect and molten pool dynamics in laser additive manufacturing. Nat. Commun. 2018, 9, 1355. [Google Scholar] [CrossRef] [PubMed] [Green Version]
- Xia, M.; Gu, D.; Yu, G.; Dai, D.; Chen, H.; Shi, Q. Selective laser melting 3D printing of Ni-based superalloy: Understanding thermodynamic mechanisms. Sci. Bull. 2016, 61, 1013–1022. [Google Scholar] [CrossRef] [Green Version]
- Zhao, Y.; Aoyagi, K.; Yamanaka, K.; Chiba, A. Role of operating and environmental conditions in determining molten pool dynamics during electron beam melting and selective laser melting. Addit. Manuf. 2020, 36, 101559. [Google Scholar] [CrossRef]
- Tohru, M.; Ichiro, T. Effect of magnetic field on onset of Marangoni convection. Int. J. Heat Mass Transf. 1988, 31, 285–293. [Google Scholar] [CrossRef]
- Du, D.; Haley, J.C.; Dong, A.; Fautrelle, Y.; Shu, D.; Zhu, G.; Li, X.; Sun, B.; Lavernia, E.J. Influence of static magnetic field on microstructure and mechanical behavior of selective laser melted AlSi10Mg alloy. Mater. Des. 2019, 181, 107923. [Google Scholar] [CrossRef]
- Shercliff, J.A. Thermoelectric magnetohydrodynamics. J. Fluid Mech. 1979, 91, 231–251. [Google Scholar] [CrossRef]
- Lehmann, P.; Moreau, R.; Camel, D.; Bolcato, R. A simple analysis of the effect of convection on the structure of the mushy zone in the case of horizontal Bridgman solidification comparison with experimental results. J. Cryst. Growth 1998, 183, 690–704. [Google Scholar] [CrossRef]
- Lehmann, P.; Moreau, R.; Camel, D.; Bolcato, R. Modification of interdendritic convection in directional solidification by a uniform magnetic field. Acta Mater. 1998, 46, 4067–4079. [Google Scholar] [CrossRef]
- Kurz, W.; Fisher, D.J. Fundamentals of Solidification; Number V. 1; Trans Tech Publications: Zurich, Switzerland, 1986. [Google Scholar]
- Strickland, J.; Nenchev, B.; Dong, H. On directional dendritic growth and primary spacing—A review. Crystals 2020, 10, 627. [Google Scholar] [CrossRef]
- Dupouy, M.D.; Camel, D.; Favier, J.J. Natural convective effects in directional dendritic solidification of binary metallic alloys: Dendritic array primary spacing. Acta Metall. Mater. 1992, 40, 1791–1801. [Google Scholar] [CrossRef]
- Wang, Y.; Shi, J. Texture control of Inconel 718 superalloy in laser additive manufacturing by an external magnetic field. J. Mater. Sci. 2019, 54, 9809–9823. [Google Scholar] [CrossRef]
- Liu, F.; Cheng, H.; Yu, X.; Yang, G.; Huang, C.; Lin, X.; Chen, J. Control of microstructure and mechanical properties of laser solid formed Inconel 718 superalloy by electromagnetic stirring. Opt. Laser Technol. 2018, 99, 342–350. [Google Scholar] [CrossRef]
- Landau, L.D.; Pitaevskii, L.P.; Lifshitz, E.M. Electrodynamics of Continuous Media: Course of Theoretical Physics. Volume 8, 2nd ed.; Butterworth–Heinemann: Oxford, UK, 1984; p. 460. [Google Scholar]
- Landau, L.D.; Lifshitz, E.M. Fluid Mechanics: Course of Theoretical Physics. Volume 6, 2nd ed.; Pergamon Press: Oxford, UK, 1987; p. 554. [Google Scholar]
- Shercliff, J.A. A Textbook of Magnetohydrodynamics; Pergamon Press: Oxford, UK, 1966; p. 1204. [Google Scholar] [CrossRef]
- Alboussiere, T.; Moreau, R.; Camel, D. Influence of a Magnetic Field on the Solidification of Metallic Alloys. Comptes Rendus I’Academie des Science 1991, 313, 749–755. [Google Scholar]
- Valencia, J.J.; Quested, P.N. Thermophysical Properties, ASM Handbook. ASM 2008, 15, 468–481. [Google Scholar] [CrossRef]
- Poirier, D.R. Permeability for flow of interdendritic liquid in columnar-dendritic alloys. Metall. Trans. B 1987, 18, 245–255. [Google Scholar] [CrossRef]
- Chamsri, K.; Bennethum, L.S. Permeability of fluid flow through a periodic array of cylinders. Appl. Math. Model. 2015, 39, 244–254. [Google Scholar] [CrossRef]
- Callister, W. Materials science and engineering: An introduction (2nd edition). Mater. Des. 1991, 12, 59. [Google Scholar] [CrossRef]
- Zhang, C.; Jahazi, M.; Gallego, P.I. On the impact of microsegregation model on the thermophysical and solidification behaviors of a large size steel ingot. Metals 2020, 10, 74. [Google Scholar] [CrossRef] [Green Version]
- Chang, S.; Stefanescu, D.M. A model for macrosegregation and its application to Al-Cu castings. Metall. Mater. Trans. Phys. Metall. Mater. Sci. 1996, 27, 2708–2721. [Google Scholar] [CrossRef]
- Beckermann, C.; Gu, J.P.; Boettinger, W.J. Development of a freckle predictor via Rayleigh number method for single-crystal nickel-base superalloy castings. Metall. Mater. Trans. A Phys. Metall. Mater. Sci. 2000, 31, 2545–2557. [Google Scholar] [CrossRef]
- McElroy, D.L.; Williams, R.K.; Moore, J.P.; Graves, R.S.; Weaver, F.J. The Physical Properties of Inconel Alloy 718 from 300 to 1000 K BT-Thermal Conductivity 15; Springer: Boston, MA, USA, 1978; pp. 149–151. [Google Scholar] [CrossRef]
- Butts, D.A.; Gale, W.F. Equilibrium diagrams. In Smithells Metals Reference Book; Butterworth–Heinemann: Oxford, UK, 2003; pp. 1–534. [Google Scholar] [CrossRef]
- Knapp, G.L.; Raghavan, N.; Plotkowski, A.; DebRoy, T. Experiments and simulations on solidification microstructure for Inconel 718 in powder bed fusion electron beam additive manufacturing. Addit. Manuf. 2019, 25, 511–521. [Google Scholar] [CrossRef]
- Cao, L.; Yuan, X. Study on the Numerical Simulation of the SLM Molten Pool Dynamic Behavior of a Nickel-Based Superalloy on the Workpiece Scale. Materials 2019, 12, 2272. [Google Scholar] [CrossRef] [Green Version]
- Knorovsky, G.A.; Cieslak, M.J.; Headley, T.J.; Romig, A.D.; Hammetter, W.F. INCONEL 718: A solidification diagram. Metall. Trans. A 1989, 20, 2149–2158. [Google Scholar] [CrossRef]
- Nastac, L.; Stefanescu, D.M. Macrotransport-solidification kinetics modeling of equiaxed dendritic growth: Part II. Computation problems and validation on INCONEL 718 superalloy castings. Metall. Mater. Trans. A 1996, 27, 4075–4083. [Google Scholar] [CrossRef]
- Chakraborty, S.S.; Dutta, S. Estimation of dilution in laser cladding based on energy balance approach using regression analysis. Sadhana Acad. Proc. Eng. Sci. 2019, 44, 150. [Google Scholar] [CrossRef] [Green Version]
- Li, X.; Fautrelle, Y.; Ren, Z. Influence of thermoelectric effects on the solid-liquid interface shape and cellular morphology in the mushy zone during the directional solidification of Al-Cu alloys under a magnetic field. Acta Mater. 2007, 55, 3803–3813. [Google Scholar] [CrossRef]
- Mukhtarova, K.S.; Shakhov, R.V.; Mukhtarov, S.K.; Smirnov, V.V.; Imayev, V.M. Microstructure and mechanical properties of the inconel 718 superalloy manufactured by selective laser melting. Lett. Mater. 2019, 9, 480–484. [Google Scholar] [CrossRef] [Green Version]
- Shakhov, R.V.; Mukhtarova, K.S. Nb rich precipitates in Inconel 718 produced by selective laser melting. Lett. Mater. 2018, 8, 105–109. [Google Scholar] [CrossRef]
- Caliari, F.R.; Guimarães, N.M.; Reis, D.A.P.; Couto, A.A.; De Moura Neto, C.; Candioto, K.C.G. Study of the secondary phases in Inconel 718 aged superalloy using thermodynamics modeling. Key Eng. Mater. 2013, 553, 23–28. [Google Scholar] [CrossRef]
- Yong, C.K.; Gibbons, G.J.; Wong, C.C.; West, G. A Critical Review of the Material Characteristics of Additive Manufactured IN718 for High-Temperature Application. Metals 2020, 10, 1576. [Google Scholar] [CrossRef]
- Chen, Y.; Guo, Y.; Xu, M.; Ma, C.; Zhang, Q.; Wang, L.; Yao, J.; Li, Z. Study on the element segregation and Laves phase formation in the laser metal deposited IN718 superalloy by flat top laser and gaussian distribution laser. Mater. Sci. Eng. A 2019, 754, 339–347. [Google Scholar] [CrossRef]
- Ng, G.K.L.; Jarfors, A.E.; Bi, G.; Zheng, H.Y. Porosity formation and gas bubble retention in laser metal deposition. Appl. Phys. A Mater. Sci. Process. 2009, 97, 641–649. [Google Scholar] [CrossRef]
- Wolff, S.J.; Wang, H.; Gould, B.; Parab, N.; Wu, Z.; Zhao, C.; Greco, A.; Sun, T. In situ X-ray imaging of pore formation mechanisms and dynamics in laser powder-blown directed energy deposition additive manufacturing. Int. J. Mach. Tools Manuf. 2021, 166, 103743. [Google Scholar] [CrossRef]
- Anderson, M.; Thielin, A.L.; Bridier, F.; Bocher, P.; Savoie, J. δ Phase precipitation in Inconel 718 and associated mechanical properties. Mater. Sci. Eng. A 2017, 679, 48–55. [Google Scholar] [CrossRef]
Publisher’s Note: MDPI stays neutral with regard to jurisdictional claims in published maps and institutional affiliations. |
© 2021 by the authors. Licensee MDPI, Basel, Switzerland. This article is an open access article distributed under the terms and conditions of the Creative Commons Attribution (CC BY) license (https://creativecommons.org/licenses/by/4.0/).