Abstract
Diagnostic data of transformers are essential in determining their integrity and to estimate their reliability. Such diagnostic data is not available for distribution transformers as only meagre attempts are made to accumulate this information. The reason for lack of such attention is attributed to the compromise made to meet financial constraints and cost-cutting measures. It is needless to emphasize the significance of these diagnostic data in evading premature failures and enhancing the accuracy of the maintenance program. Overall, the concepts of diagnostic methods are well defined regarding power transformers, but cannot be extended to distribution transformers. This paper attempts to fill this gap by measuring the diagnostic data from in-service and defective distribution transformers. For this purpose, eight transformers (six in-service, two defective) showing deviations in their diagnostic status were selected from a group. As per their kVA rating and operating status, the chosen transformers were categorized into three sets and their integrity of insulation and winding-core arrangement were analyzed. Later, the root-cause analysis was performed on defective transformers to understand their failure reasons and possibilities to evade them. The pertinent data obtained are quite valuable for making decisions regarding reliability-oriented maintenance and for extending its potential in the distributed generation.
1. Introduction
Distribution transformers are essential in securing a power supply to the industries and household applications []. The selection criteria of these transformers depend on energy requirements at the receiving end and the budget of the user and the service provider []. Naturally, they emerge as an important asset to the utilities and industries and requires undivided attention to ensure their operating condition and reliability []. Present energy requirements, environmental restrictions and financial constraints have put forth the notion to reduce the budget and life-cycle costs. In addition, there is a constant demand for stringent maintenance procedures and sensitive measurement techniques [,]. This implies inclusion of sensitive monitoring tools and diagnostic test methods to track their operating condition and efficiency of distribution transformers. Nevertheless, the modern distribution transformers are not provided with such monitoring or diagnostic support favouring the cost cutting measures []. It is also mentioned to be unlikely to outweigh the benefit of replacing a transformer than employing diagnostic tests and/or monitoring support [,,]. Nonetheless, it is critical for the service provider to know the failure reasons not only to evade its re-occurrence but also to always ensure the quality and reliability of the supplied electric power [,]. Pertinent monitoring and diagnostic solutions create a decisive data for effective management of the network of transformers and enhance their efficiency, performance, reliability []. So, any attempt to improve the existing maintenance procedures remains highly desirable.
The concepts of detecting premature failures and exercising diagnostic methods are well defined on power transformers, while extending the same to a distribution transformer may not reveal similar results. The corresponding reason may be due to the differences in geometry, construction, winding design, etc., which usually reflects in the measured responses as natural frequencies, resonant peaks, and so on []. For instance, the open and short-circuit natural frequencies of the power transformers appear as several resonant peaks within 700 to 900 MHz while the same for a distribution transformer will be entirely different and may appear (if any) above 1 MHz. So, the usual shift in the resonant peaks initiated by the terminal conditions and faulty situations which are observable in a power transformer may not appear in the distribution transformer []. In this context, the complete spectrum of the distribution transformer and the respective individual influence of winding, core, and insulation geometry must be studied. There are several literatures and technical reports that discusses the diagnostic concepts, methods, etc., with focus on its application on transformers, bushings, power cables, and rotating machines. Surprisingly, such concepts are not extended to distribution transformers only for the reasons of meeting financial constraints and cost-cutting measures [,]. The utilities report that the benefit of replacing a distribution transformer outweighs the cost of exercising a diagnostic method, which is incorrect []. Availing such diagnostic data of distribution transformers and failure root cause analysis are very important to retain their service time and widening their operating potential when venturing their application into renewable energy and distributed generation plants. Such diagnostic data is also very useful while enhancing the sensitivity and accuracy of reliability-oriented maintenance program.
A distribution network feeding a city predominantly contains a fleet of distribution transformers manufactured from different factories and are designed to operate under minimal supervision and maintenance [,,]. In recent years, the distribution transformers have occupied a significant role in the distributed generation []. Pertinent transformers have multiple purposes such as maintaining inverter output voltage to the desired level, interconnecting dispersed generators to the grid or utility, isolates faulty side and retains voltage regulation []. Although made from different factories, their design and construction are expected to be similar, as their voltage/current/kVA ratings are identical [,]. Despite design excel, robust construction and better-quality materials, a specific number of distribution transformers in a fleet inevitably fail during its service time [,,,,,,]. Pertinent failures are mostly internal and are attributed to overloading, over voltage, transients, and internal winding faults [,]. So, the usual practice is to limit the load of the transformer within 80% of its full capacity so as to minimize the ageing and deterioration [,,]. Alternatively, an adequate maintenance program that would constantly track, monitor, quantify the diagnostic status of the distribution transformers at all times may be exercised, which forms the subject matter of this paper [,,].
Modern asset management program involves three strategies viz., correction, prediction, and reliability-oriented maintenance, respectively []. Pertinent tests (electrical, visual inspection, etc.) are similar and depending on their application time, condition, etc., their objectives change. Amongst all, the corrective maintenance tests are performed only after the fault has occurred in the transformer [,]. Naturally, the corresponding repair tasks are too expensive and require skilled labour. The preventive maintenance tests involve time and/or condition-based monitoring tools and diagnostic testing methods that are slightly expensive, nevertheless ensures the normal life of the transformer [,]. In the meantime, the reliability centered maintenance tests have evolved recently and drawn wide attention of utilities and industries. This reliability centered approach not only evades the risk of premature failures but also provides the health index and quantifies the lifetime and reliability of the transformer in numerical terms []. Nevertheless, employing the reliability centered maintenance requires a large number of onsite/field data of in-service condition, rate of failures, mode of failures, etc. []. Such data is abundantly available for power transformers while the same is not true for distribution transformers [,].
2. Existing Literature
The importance of distribution transformers in a network and their significance in maintaining voltage regulation has been well known for several decades. In recent years, the distribution transformers in distributed generation have found a variety of applications. In this regard, there are several literatures that are available and describe all the aspects of design, construction, voltage regulation, etc. Despite all, the literature that are relevant to this study focusing on incipient fault conditions and premature failures are alone gathered and discussed in this paper. Pertinent literatures are grouped into five major categories and their inferences related to the present context are explained.
2.1. Significance of Distribution Transformers in Distributed Generation
The primary significance of distribution transformers in distributed generation lies in their ability to interconnect several distributed sources to grid and utility system []. Depending on their application, they are addressed as grid, interconnecting or distribution transformers []. In general, the grid and distribution transformers occupy a quite significant place in both conventional and distributed generation network []. During this, the distribution transformers step up the output voltage of the inverter sufficiently enough to meet the distribution level [,]. At the same time, the grid transformers, similar in construction to distribution transformers, are used to inject power into the grid by interconnecting the distributed generation network []. So, naturally, the operating cost and efficiency are one of the important factors that directly influence the plant income. In most cases, the operating conditions such as power rating, system voltage, duty cycle, site conditions, etc., are important criteria that decide the functionality of distribution transformers []. The corresponding average failure time of such distribution transformers used in the distributed generation network is estimated to be approximately 30 years, provided there are no external factors that cause premature failures [,,]. Nevertheless, these distribution transformers suffer premature failure caused by natural events, line to ground faults, etc., despite the fault current being equally handled by the distributed generation source [,]. In all, the probability of failures due to line to ground are higher than the other reasons.
2.2. Significance of Diagnostic Measurements
Currently available literatures mainly focus on reporting the sensitivity of diagnostic measurements on revealing the dielectric and mechanical status of power transformers [,,,,,]. The mechanical strength of the windings [], the influence of temperature and moisture on the transformer insulation [], and the impact of terminal connections in improvising the sensitivity of pertinent diagnostic method [,] and using non-conventional methods on determining the interwinding capacitance [,,] have received wide attention. In addition, availing the diagnostic data, the lifetime model of a transformer model under combined electrical and thermal stresses are reported []. However, extending the same to a distribution transformer is yet to be investigated [,,,]. The currently practiced test methods on distribution transformers are not diagnostic but only primitive and indicate only after the failure has occurred []. Instead, the focus of currently practiced tests on distribution transformers are related to load factors [,].
2.3. Current Focus on Distribution Transformers
It is reported that the distribution transformers are operated with a low load factor, i.e., 40% to 60% of loading during normal conditions [,]. Additionally, only 25% of the distribution transformers in a network carries peak load that too for a limited duration []. So, naturally it is believed that due to the low load factor, the distribution transformers are immune to any failure situation []. Consequently, corrective maintenance strategies are popularly used on the current distribution transformers [,,]. Nevertheless, it is well known that a certain percentage of distribution transformers suffer internal faults due to several factors such as overloading, transient condition or internal winding faults and so on [,,,]. Most of these internal failures may go unnoticed under the initial phase and appear only after they reach an adverse situation []. So, it is important to employ diagnostic tests to monitor distribution transformers.
2.4. Failures in Distribution Transformers
The failures in the distribution transformers can be broadly grouped into two categories viz., incipient, and developed faults [,,,,,,,]. The developed fault appears once the event has occurred and caused significant damage to the system []. As opposed to this, the incipient faults are nothing but evolving and have not created damage and can henceforth be rectified if identified within proper time [,,,]. The failures in a distribution transformer over their service time follows a curve which resembles the shape of a ‘bath-tub’ []. This ‘bath-tub’ curve indicates that the failures are at the highest at the initial (installation and commissioning) and final stages (normal end of service life) of a distribution transformer while the same is at its minimum within the intermediate stage [,,]. The failures in the intermediate phase are known as premature in nature and usually occur due to overloading, transients (lightning, switching, etc.), and short-circuit faults []. Literature indicates that around 17% of failures in distribution transformers are due to the insulation, and the same due to overloading and winding-core are within 24% and 25%, respectively [,,,,]. In any case, these failures are internal and broadly affect either the insulation and/or the winding-core arrangement.
2.5. Currently Practiced Maintenance Test Methods
The tests that are popularly employed on distribution transformers can be broadly grouped into two viz field tests (insulation resistance, polarization index, turns-ratio, etc.) and diagnostic tests (dielectric response analysis (DRA), frequency response analysis (FRA), dissolved gas analysis (DGA), low-voltage impulse, etc.), respectively [,,]. In all, the field tests are used to determine and quantify the developed faults in the distribution transformers. A subsequent step would be to bring the distribution transformer offline and initiate corrective measures such as oil change, refurbishment, etc., which only adds up as additional costs to the investment [,]. However, it is expected that the implementation of monitoring methods would be too expensive [,]. The corrective maintenance would cost up to 40% of the total investment and the pertinent aftermath would result in refurbishment and/or scrapping, which is non-profitable [,,]. At the same time, the predictive maintenance tests would reduce costs by 15%, avoid the expensive refurbishment, scrapping process and help in retaining the normal lifetime of the distribution transformers. In addition, the utilization of the distribution transformer is enhanced, which generates more revenue as intended [].
In summary, it appears from these literatures that the present distribution transformers are provided with field tests and corrective maintenance strategies are suited for determining faults that have developed after an event. Pertinent maintenance strategies are most correctly involving procedures that add additional costs to the investments. At the same time, diagnostic tests such as DGA, DRA, FRA, etc., are much more sensitive in detecting even the incipient faults yet are disregarded to be used on distribution transformers. It is due to the belief that the inclusion of such tests might increase the operating cost, which is not correct. The predictive maintenance is only 15% of the total costs and provides an excellent opportunity to retain their lifetime and reliability. The utilization of the transformer is further prolonged, which eventually generates more revenue []. Furthermore, the data obtained would be valuable for the reliability-oriented maintenance strategy, as it requires many onsite/field data of in-service conditions, rate of failures, mode of failures, etc. [,]. Such data is abundantly available for power transformers, while the same is not true for distribution transformers [,]. In this context, a group of in-service and defective distribution transformers are selected and subjected to diagnostic measurements.
3. Onsite Transformers
Eight distribution transformers that were in-service at the residential and industrial areas were selected and subjected to diagnostic measurements. Table 1 shows the list of in-service and defective distribution transformers involved in the present study. The chosen distribution transformers were of the same vector group (Dyn5), containing the same winding connection (Δ/Y-n) and were constructed at different factories on a different timeline or year. Nevertheless, their design and constructional features were expected to be similar, making them comparable.

Table 1.
List of distribution transformers involved.
So, the chosen transformers were classified as per their kVA rating into three groups viz., set-1, set-2, and set-3, and identified using their group and timeline. In all, the distribution transformers in set-1 and set-3 are in-service energizing residential area. In all, the distribution transformers in set-1 and set-3 are in-service energizing residential area. The transformers in set-3 were in-service and emerged to be defective during their service time. Two defective transformers manufactured in 1994 and 1998 were enlisted in the set-3 category. The first defective transformer, manufactured in set-3/1994 had suffered thermal failure while the second, manufactured on set-3/1998, suffered winding failure. Naturally, the DRA and FRA methods were employed to evaluate their complete diagnostic status. The transformer with thermal failure was energizing an industrial site and had failed at least two times in 2016 and 2017. The reason for the failure was identified as a thermal problem, as the same caused the oil to vent from its hermetically sealed tank.
4. Measurements and Analysis
Figure 1a–d shows the picture of test setups, in-service transformers, terminal connections, etc., adopted during DRA and FRA tests, while the terminal connection was adopted, and the parameters were measured. The excitation approach is shown in Figure 2a–h, respectively. It is well known that the DRA tests assess the insulation and its geometry [,,,] while the FRA identifies defects in the winding and core of the transformers [,,,,]. The results obtained from DRA and FRA methods collectively describe the complete diagnostic status of a distribution transformer. The basic test procedure of DRA and FRA methods are the same while the test frequencies applied are different. The DRA setup involves a dielectric response analyzer (Figure 1a) that generates sinusoidal test voltages up to 200 V with frequencies ranging from 100 µHz to 5 kHz in discrete steps. This study uses sinusoidal test voltage of 200 V in amplitude and frequencies ranging 500 µHz to 5 kHz. The frequency dependent insulation parameters such as the loss factor, permittivity, etc., are obtained. The same is compared with the model curve (using the XY model) generated using an inbuilt curve fitting algorithm []. The inbuilt algorithm then fits the measured data with the model curve and calculates the moisture level and oil conductivity by referencing to database []. The FRA test setup shown in Figure 1c,d comprises of a frequency response analyzer popularly used for diagnosing the windings of a transformer. The frequency response analyzer generates spectrally pure sinusoidal signal of 1 Vrms amplitude with frequency sweep from 10 Hz to 20 MHz. Initially, a suitable terminal connection and system function pair as recommended by the current literature and IEEE/IEC standards are adopted [,,]. Pertinent mode of excitation, terminal connection, measurable input, and output parameters, etc., are shown in Figure 2a–h. Following this, sinusoidal signals of 1 Vrms in amplitude with frequencies sweeping from 10 Hz to 2 MHz are injected into the terminals and the pertinent input, reference and output signals are recorded. The amplitude response is obtained from the measured data which is further analyzed to understand the diagnostic status of the transformer windings.
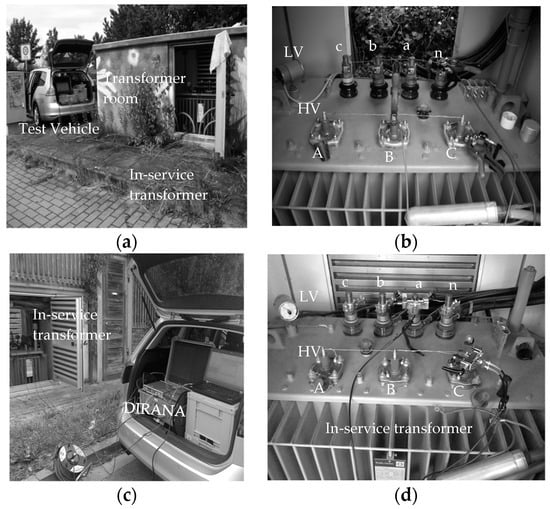
Figure 1.
Test setup used for assessing the diagnostic status of the chosen distribution transformers. (a) DRA method; (b) terminal connection (DRA); (c) FRA method; (d) terminal connection (FRA).
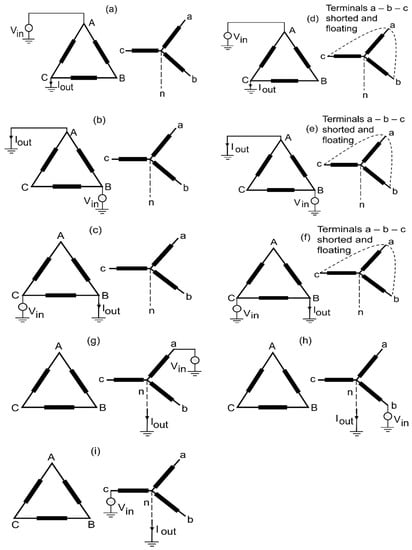
Figure 2.
Terminal connection and measurable parameters adopted as recommended by the standard IEEE PC57.149 and literature [,]. (a) High voltage open-circuit response: A-C; (b) B-A; (c) C-B; (d) high-voltage short-circuit response: A-C; (e) B-A; (f) C-B; (g) low-voltage open-circuit response: a-n; (h) b-n; (i) c-n.
4.1. In-Service Transformer Units
The DRA tests on in-service transformer units employ two important analysis strategies. First is the comparative analysis of measured data with the model curve developed by an algorithm inbuilt in the device. Later, using the geometry, temperature, etc., a response that fits to the measured data is calculated and the corresponding values of oil conductivity, moisture content, etc., are estimated []. The second strategy employs comparative analysis of measured data with the new or refurbished sister-unit transformers that are identical to the test object. Table 2 shows the loss factor, capacitance, oil conductivity and estimated level of moisture ingress in the chosen set-1 and set-2 in-service distribution transformers. It can be seen from the Table 2 that the insulation of the in-service transformers (set-1 and set-2) are in better status. The measured loss factor of all in-service units (set-1 and 2) lies within 0.002 to 0.003, which is well within the acceptable limit. The conductivity of the oil-paper insulation of set-1 distribution transformers remained within 1.3 pS to 3.7 pS, which is also within the acceptable limit. The same for the set-2 transformer manifested slightly higher values, i.e., within 6.1 pS to 7.2 pS. So, these two parameters confirm that there are no ageing or deterioration in the insulation system of set-1 and set-2 distribution transformers. However, the moisture levels of these transformers yielded different results.
Table 2.
Insulation parameters of set-1, set-2 in-service transformers.
Comparatively, the set-1 in-service transformers (2015 and 1994-1) emerged as ‘dry’ with a low level of moisture in its insulation. Pertinent values of moisture were estimated as 1.1% to 1.3%, respectively. At the same time, the in-service unit, identified as set-1/1994-2 emerged with a higher level of moisture in its insulation. The level of moisture is estimated to be around 3.6%, therefore marked as ‘moderately-wet’. The set-2 distribution transformers emerged as either ‘wet’ or ‘moderately wet’ as their estimated moisture levels remain within 2.0% to 3.6%. Particularly, the in-service unit identified as set-2/1983 manifested slightly higher level of moisture ingress, i.e., around 3.6%, henceforth marked as ‘wet’. The reason for such increased level of moisture might be their operating condition and location. The set-1 in-service transformer units (other than set-1/1994-2) are installed in residential areas while the set-2 transformers are installed and feeding households outside the city. Being exterior to the city limits, their constant exposure to the open weather conditions and lesser loads may be the reason for such minor deviations.
Figure 3a–d shows the insulation parameters (i.e., loss factor, capacitance, resistance, and impedance) of in-service distribution transformers grouped under set-1 category. It becomes clear from these figures that the insulation parameters of in-service transformers identified as set-1/2015 and set-1/1994-1 are within the acceptable level as their pertinent traces match each other. Pertinent insulation parameters such as loss factor (Figure 3a), capacitance (Figure 3b), resistance (Figure 3c), and impedance (Figure 3d) remain in-line to each other. Such observations are not surprising as these in-service units, grouped in set-1 category are either new (set-1/2015) or newly refurbished (set-1/1994-1). However, the transformer identified as set-1/1994-2 emerged with mild deviations in its respective insulation parameters. The loss factor of this set-1/1994-2 unit emerged with slight deviations throughout the frequency span. These deviations in the loss factor (Figure 3a), capacitance (Figure 3b) and impedance (Figure 3c) appeared more dominant at very lower frequencies (i.e., say from 100 mHz to µHz) indicating moisture ingress in the insulation. Such deviations in the resistance (Figure 3b) appeared predominantly from few 100 Hz to µHz, respectively. These deviations in insulation parameters collectively indicate that this transformer (set-1/1994-2) relatively has higher moisture ingress in insulation. This finding is in consonance with observations (moisture 3.6%) from Table 2.
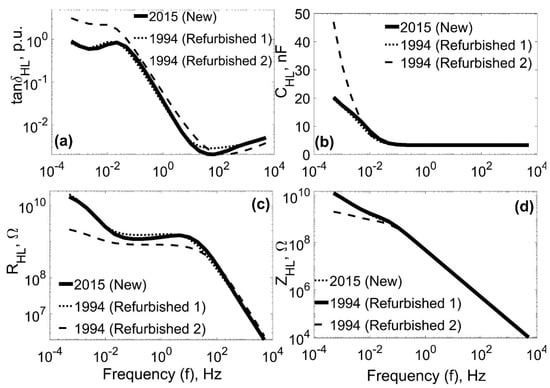
Figure 3.
Insulation parameters of set-1 in-service transformers (a) loss factor; (b) capacitance; (c) resistance; (d) impedance.
Figure 4a–d shows the insulation parameters measured from the in-service distribution transformers grouped under set-2 category. As opposed to the set-1 units, the insulation parameters of the set-2 distribution transformer manifested notable deviations in the response function. The loss factor of all the three units shown in Figure 4a manifested deviations throughout the frequency span. In particular, the deviations in the mid-frequency range (i.e., within 100 mHz to 100 Hz) of transformer unit set-2/2002 indicate a slightly higher level of oil conductivity. The same observation can also be made from Table 2. Nevertheless, the percentage of change in the oil conductivity is relatively smaller, and can therefore be deemed an acceptable level. At the same time, the deviations in the lower frequencies of the loss factor (Figure 4a), capacitance (Figure 4b), and resistance (Figure 4c) of set-2/1983 in-service unit indicates moisture ingress in the insulation, thereby positioning it in ‘wet’ state. This is expected as the in-service transformer unit identified as set-2/1983, is relatively older than the others and had been operating in the outer-skirts of residential area.
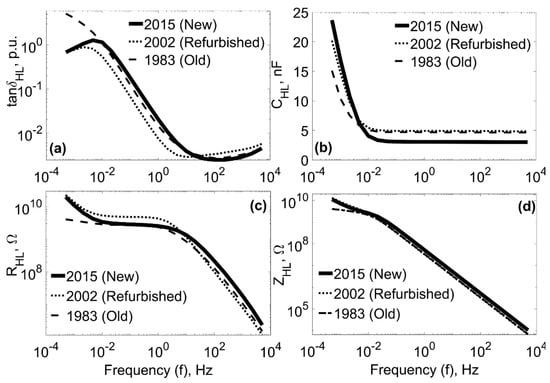
Figure 4.
Insulation parameters of set-2 in-service transformers; (a) loss factor; (b) capacitance; (c) resistance; (d) impedance.
Figure 5a–i shows the open and short-circuit responses of set-1 in-service distribution transformers. At first glance, it becomes clear from these figures that the in-service units identified as set-1/2015 and set-1/1994-1 manifested no significant deviations in their respective open and short-circuit response functions. The high voltage open-circuit (HVOC) response of phases A-C (Figure 5a), B-A (Figure 5d), and C-B (Figure 5g) exhibits an exact match between each other. Similarly, the high voltage short-circuits (HVSC) response of phases A-C (Figure 5b), B-A (Figure 5e), and C-B (Figure 5h) also exhibit an exact match between each other. Naturally, there are no significant changes observable in the low voltage open-circuit (LVOC) response of all the three phases viz., a-n (Figure 5c), b-n (Figure 5f) and c-n (Figure 5i). So, the outcome of the FRA tests altogether confirms that the windings of all the in-service units identified as set-1/2015 and set-1/1994-1 are intact without any major deviations from its diagnostic condition. However, the open and short-circuit response of the other in-service unit identified as set-1/1994-2 manifested a small deviation in its amplitude response function. These changes are insignificant and follows the pattern of other phases. It hence can be concluded that this transformer unit is also in good condition.
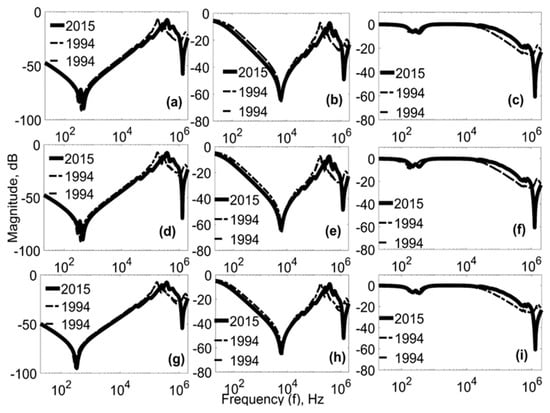
Figure 5.
Open and short-circuit responses of the set-1 in-service distribution transformers: HVOC (a) A-C; (b) B-A; (c) C-B, HVSC: (d) A-C; (e) B-A; (f) C-B, LVOC: (g) a-n; (h) b-n; (i) c-n.
Further FRA tests (Figure 6a–i) on set-2 in-service distribution transformers revealed similar results. Figure 6a–i shows the open and short circuit responses of set-2 in-service transformers adopted in this study. The open and short-circuit responses of units set-2/2015 and set-2/2002 manifested no notable deviations in their open and short-circuit response function. All their traces of HVOC and HVSC response of phases A-C (Figure 6a,b), B-A (Figure 6d,e) and C-B (Figure 6g,h) and their LVOC responses of phases a-n (Figure 6c), b-n (Figure 6f) and c-n (Figure 6i) match each other without any deviations. So, it can be confirmed that the windings of these in-service units (set-2/2015, set-2/2002) are in good condition. The in-service unit identified as set-2/1983 manifested mild deviations in their respective HVOC, HVSC, and LVOC response function. In all, the deviations appear more prominent at the low voltage phases, i.e., a-n, b-n, and c-n, respectively. As the deviations are quite smaller in magnitude and the respective pattern followed is similar to the other phases, it can be once again concluded that this in-service unit is in good condition.
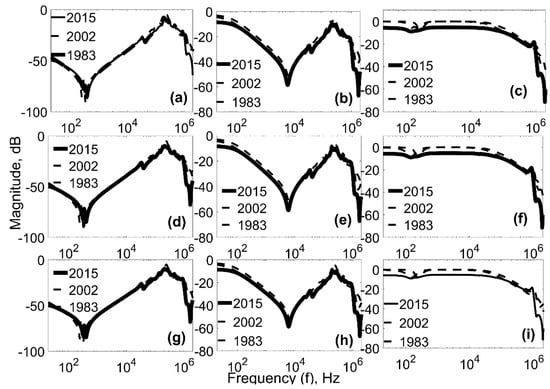
Figure 6.
Open and short-circuit responses of the set-2 in-service distribution transformers: HVOC (a) A-C; (b) B-A; (c) C-B, HVSC: (d) A-C; (e) B-A; (f) C-B, LVOC: (g) a-n; (h) b-n; (i) c-n.
Thus, it becomes clear from these experiments that there are no significant changes in the respective open and short circuit response functions. This confirms the fact that the transformers grouped in this category are in good condition and can be further employed in the distribution network. With this information, the defective distribution transformers grouped under set-3 category are subjected to diagnostic investigation.
4.2. Defective Distribution Transformer Units
Two distribution transformers (Table 1) that had several interruptions during its service time are selected and subjected to diagnostic tests. The first defective transformer (set-3/1994) grouped under set-3 category, was in-service at an industrial site and was tripped out at least by three intervals due to elevated temperature. During each interruption, an oil sample was extracted, and the gas dissolved in oil is estimated. After the third interruption, the transformer suffered a failure causing the oil to vent, forcing it to go offline. After gathering this information, the dielectric, mechanical and thermal integrity of this defective transformer (set-3/1994) is studied and the results that reveal interesting information are alone discussed. The second defective transformer (set-3/1998) was feeding a residential area in the outskirts of the city. Figure 7a,b shows the picture of set-3/1998, the second defective transformer that has winding failure initiated by the localized hot spot temperature and arcing phenomena. The oil system and thermal indicators of this transformer (set-3/1998) were initially normal, however the relay has tripped repeatedly at peak loads. Eventually, this transformer suffered an untimely failure, so it was removed from service and subjected to tests. After these tests, this transformer was opened to visually inspect the failure locations.
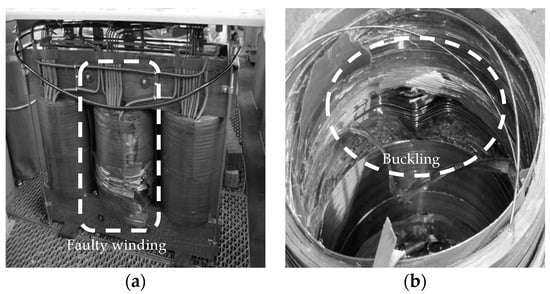
Figure 7.
Picture of 630 kVA, 20 kV/400 V, distribution transformers with defective windings grouped under set-3 category. (a) Frontal view showing defective winding; (b)internal bucking winding defect (interior view).
Figure 7a,b pictorially describes the failure locations in the windings. Table 3 lists the values of gases detected in the oil sample and the possible reasons for their development. The oil samples extracted during three interruptions are mentioned in the Table 3 as sampling intervals 1, 2, and actual. The actual being the present case and the intervals 1 and 2 are data from previous samples. It can be observed from Table 3 that the gases hydrogen (H2), carbon monoxide (CO), and carbon-dioxide (CO2) have gradually evolved to a higher value. In all, the H2 evolved from 14 ppm to 150 ppm, indicating minor interior discharge activities. The CO increased from 57 to 1000, indicating carbonization problems. The CO2 gas that increased from 4979 ppm to a higher value of 12,000 ppm indicated possible moisture content in the transformer. In addition, the presence and increase of methane (CH4) (up to 100 ppm) dissolved in the gas indicated interior sparking problems. Additionally, the ethane (C2H6) and ethylene (C2H4) gases were identified, which increased to higher values indicating localized heating in the transformer. So, acetylene (C2H2) gas evolved indicating winding hot spot.
Table 3.
Gas dissolved in oil of thermally defective transformer.
In all, the presence of H2, CO does not pose a serious threat as their values when compared with the reference data are well within the acceptable limit. The level of CO2 when compared with the reference values indicated minor moisture content, which is also not a serious threat. At the same time, the level of gases such as methane, C2H6, and C2H4 indicates sparking, localized heating and hot spot problems, which is a serious issue. This might be the reason for the thermal failure of this distribution transformer. Following this, the insulation condition of these defective transformers is studied. Table 4 shows the values of insulation parameters of defective transformers (set-3/1994, set-2/1998) measured using the DRA method. It can be observed from Table 4 that the status of the oil of both the defective transformers are in acceptable condition. However, a noticeable level of moisture has ingress into the insulation of both the defective transformers. The transformer with thermal fault emerged with 4.6% of moisture while the same for the winding fault was close to 4.5%, respectively. So, to make a detailed analysis, the measured insulation parameters are compared with a sister-unit transformer.
Table 4.
Measured insulation parameters of set-3 defective distribution transformers.
Figure 8a–d shows the insulation parameters of the thermally defective (set-3/1994) distribution transformer. It becomes clear from these figures that the insulation condition of the thermally defective transformer remains in acceptable condition. The loss factor of the thermally defective transformer within the frequency span of 10−2 Hz to 102 Hz appears to remain in-line. The loss factor beyond 100 Hz appears higher than its sister-unit counterpart. Similar observations can be made at frequencies below 10−2 Hz. The reason for the increase in loss factor can be attributed to the moisture ingress in the insulation. The other insulation parameters such as capacitance (Figure 8b) and impedance (Figure 8d), manifests a close match with the sister-unit data throughout the frequency. However, the resistance of the thermally defective seems to be slightly higher than the sister-unit data at very higher frequencies. This confirms the fact that the insulation system of the thermally defective transformer is intact, but suffers moisture problems. This finding is in consonance with the observation made from the Table 4.
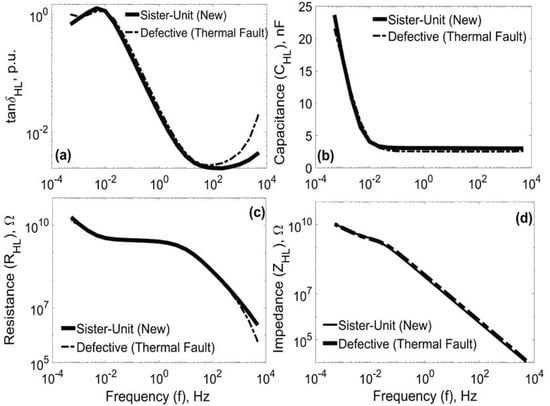
Figure 8.
Measured insulation parameters of thermally defective distribution transformer grouped under set-3 category (a) loss factor; (b) terminal capacitance; (c) resistance (d) impedance.
Figure 9a–d shows the insulation parameters measured from the set-3/1998 winding-defective transformer. It becomes clear from these figures that the condition of the insulation of the winding-defective transformer unit (set-3/1998) remains compromised. The values of the loss factor shown in Figure 9b are relatively higher, indicating a drastic change in the condition of the oil-paper insulation. Additionally, the changes of the loss factor in the mid-frequency span, i.e., between 10−2 Hz and 102 Hz indicate deviations in the condition of oil conductivity, which is in consonance with the model-curve algorithmic analysis (refer to Table 4).
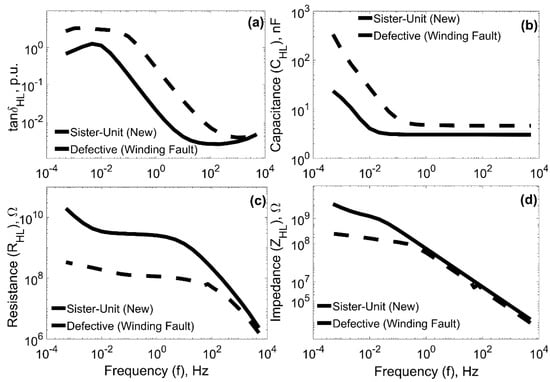
Figure 9.
Measured insulation parameters of winding defective distribution transformer grouped under set-3 category. (a) Loss factor; (b) terminal capacitance; (c) resistance (d) impedance.
So, these observations collectively confirm that the integrity of the insulation arrangement of the winding-defective transformer remains compromised. This is reasonable, as it can be observed from Figure 9a,b that the winding failure was so severe that it has disturbed the insulation arrangement at this location. The reason for such a failure is due to the lack of timely diagnostic support and inadequate maintenance strategy. Understanding this, detailed FRA tests are conducted on the set-3/1998 winding-defective transformer.
Figure 10a–c shows phase-to-phase comparison of open and short-circuit responses of set-3/1998 winding-defective transformer. It becomes clear from these figures that the windings in the outer phases A-C and C-B (Figure 10a,b) of high voltage and a-n, b-n, and c-n in the low voltage (Figure 10c) have no significant defect. Pertinent magnitude function match each other, indicating that there is no change in impedance. At the same time, the impedance of the winding in the middle phase has drastically changed. These changes appear more prominent at the lower and mid frequencies of open and short-circuit response functions (Figure 10a,b) indicating stronger displacement between the winding-core and individual turns, respectively. These changes altogether confirm that the winding in the middle phase (L2 or phase B-A of the high voltage winding) has suffered severe damage. This observation matches with the findings made during visual inspection (Figure 10a,b) of the winding defective (set-3/1998) defective transformer. In order to confirm this, the open and short-circuit responses of the faulty unit is compared with the sister-unit transformer. Figure 11a–i shows the magnitude function of the open and short-circuit responses of the defective transformer. It becomes clear from these figures that the winding in middle phase B-A (refer Figure 11d,e) has severe damage. Pertinent open and short-circuit impedance manifest stronger deviations against the sister-unit measurements. Additionally, the corresponding damages are so severe that they have induced or displaced the outer phase windings (phase A-C, C-B) that are in proximity. These induced damages in the outer phase windings appear as deviations in the magnitude responses shown in Figure 11a, b, g, and h, respectively. At the same time, it appears from Figure 11c,f,i that the low voltage windings are free from any defects as there are no changes appeared in its magnitude response. The same is ensured during visual inspection of the faulty transformer.
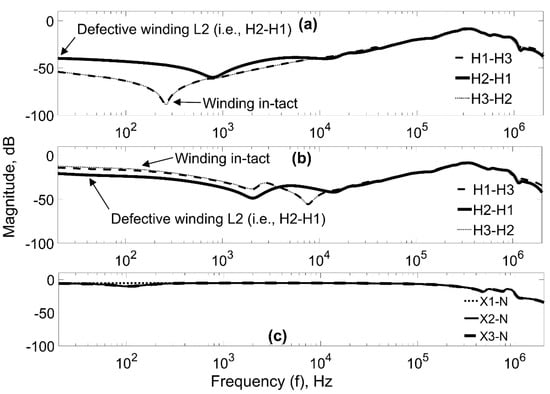
Figure 10.
Phase-to-phase comparison of open and short responses of set-3/1998 defective distribution transformer. (a) HVOC; (b) HVSC; (c) LVOC.
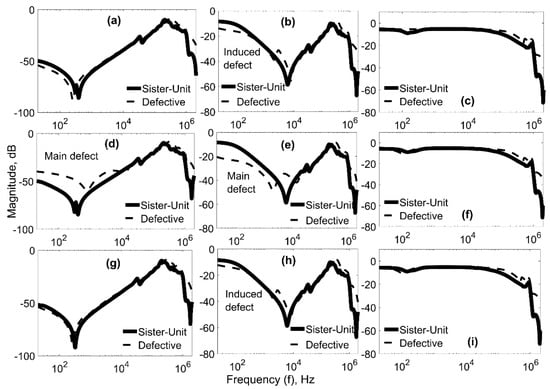
Figure 11.
Open and short-circuit responses of set-3/1998 defective distribution transformer. HVOC: (a) A-C (b) B-A (c) C-B, HVSC: (d) A-C (e) B-A (f) C-B, LVOC: (g) a-n (h) b-n (i) c-n.
Hence, it appears from this onsite study that it is essential to employ diagnostic test methods on in-service distribution transformers to monitor their operating condition and to ensure their lifetime and reliability. The major problems faced by the distribution transformers are caused by moisture ingress, intermittent loads, short-circuit, etc., which significantly affects either the insulation and/or the winding-core arrangement. In all, the current maintenance strategies exercised on the distribution transformers does not reveal the diagnostic status in timely manner, causing the failure events to be catastrophic. Naturally, the modern diagnostic methods such as DGA, DRA, and FRA tests adequately describe the integrity of the distribution transformers and help in exercising preventive measures to evade occurrence of an incipient fault condition. Such attempts are desirable as they improve the asset management.
Thus, the experiments on in-service and defective transformers revealed their diagnostic status clearly and therefore their corresponding data can be further accumulated with respect to time and can be used for resolving their lifetime and reliability.
5. Discussion of Failure Root-Cause Analysis
Literature indicates that the industries and utilities have gained a vast experience on meeting load-demand conditions and to minimize operational failures (such as in arc furnace transformers, etc.,) from a consumer point of view [,,,]. In addition, several attempts are made to understand failure modes through maintenance test program. Most of the maintenance tests correlate the effect of loading (or overloading) to the diagnostic changes with primary focus on oil temperature, hotspot and moisture in distribution transformers. Pertinent procedures collect information such as power requirements, utilization, demand, peak and dormant hours for determining the apparent load. This information along with the operational abnormalities such as overloading, switching, unbalanced loads, etc., are collectively used as indices for prioritizing the replacement of in-service transformer units. On contrary, exercising modern diagnostic methods might provide much more clear insight into the diagnostic condition of the transformer, thereby providing an excellent opportunity to evade any premature failures. Such a protection not only enhances the reliability of the equipment but also enhances its life and helps in better asset management. Surprisingly, the modern maintenance and failure prediction and proactive reliability and asset management programs have overseen the possibilities and collect a wide-sense diagnostic data, which might help in gathering failure root-cause analysis. In this context, the present study provides an overview and significance of diagnostic measurements and the points out the quantum of information obtained from the failure root-cause analysis of the defective transformers. Two transformers suffering thermal and winding defect conditions were chosen and subjected to investigations. The defects were chosen in such a way that they reflected a common fault condition experienced by a distribution that is in-service. It is clear from the measured data that the subjected diagnostic test methods are sensitive in revealing even a minute fault in a distribution transformer. Subsequently, to understand the root-cause of the failure, a deeper investigation including a visual inspection is necessary.
5.1. Defect Condition—1: Thermal Failure (Set-3/1994)
The transformer listed in set-3/1994© was in-service in an industrial area and had been handling several intermittent and continuous overloaded situations. In addition, it was noted during the periodic maintenance tests that the oil temperature of this particular unit was always higher and at the time of failure, the temperature recorded was close to 300 °C and had raised alarm on several occasions. Prior to its thermal failure, the service provider was informed that this transformer tripped the circuit breaker several times, forcing it to the go offline on several occasions. So, in due course of this time, this transformer was subjected to a severe maintenance procedure to mitigate the possibilities of premature failure. Pertinent data was stored as reference and used for further comparative and investigative analysis. Figure 12 shows the internal view of this transformer suffering thermal failure. It is experimentally identified that the transformer grouped as ‘set-3/1994©’ was defective and suffered a thermal failure. The same was ascertained by observing the gases that dissolved in the transformer. Pertinent values and the possible failure modes are shown in Table 3 and Figure 8, respectively. Following this, the reason for the failure and the consequences on material degradation were further investigated. It emerges from Figure 8 and Table 3 that the thermal failure did not majorly alter the dielectric and winding-core arrangement. At the same time, it appeared from Figure 8 that the insulation geometry and cellulose (or paper insulation) may have suffered material degradation. The same was visually ensured during the refurbishing procedure of the set-3/1994 transformer. The degradation in the oil-paper insulation and insulation geometry might be due to higher oil temperature and arcing or internal discharges. In order to investigate this, the defect gas contents dissolved in the oil were studied and the same were conspicuous and indicate the following pattern. The thermal fault raised the oil temperature up to 300 °C with a gas saturation level of 107%. In addition, the oil was saturated with nitrogen gas of 107% in value. As per the previous data, the data measured during the thermal failure indicated a dramatic raise in the defect gas. This confirms active internal arcing in the transformer, which caused material degradation in paper insulation.
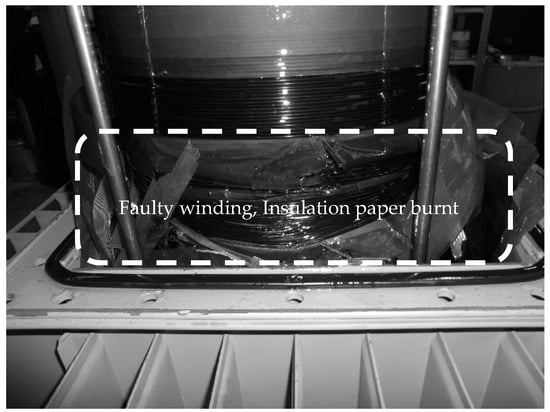
Figure 12.
Pictorial description of the location of failure in the set-3 distribution transformer suffering thermal fault: Insulation damage, winding burnt.
Thus, it appears from the failure root-cause analysis that the intermittent and constant overloading of this transformer forced a higher operating temperature. In addition, the arcing and intermittent internal discharges caused localized weak spots in the insulation, which triggered spurious tripping of the circuit breakers. Eventually, both the adverse conditions caused the transformer to suffer a thermal failure. Nevertheless, the winding-core arrangement remained intact and henceforth the complete unit can be refurbished and re-commissioned after ensuring its diagnostic status. The same was recommended to the service provider.
5.2. Defect Condition—2: Winding Failure (Set-3/1998)
The distribution transformer unit (grouped in set-3/1998$) that suffered a winding failure was in-service in a residential area, and henceforth was physically well protected, housed in a separate concealment and remained inaccessible to public. During its service time, this transformer unit was interconnected in the network with a sister-unit that was identical in design and construction. Both the transformers operated, feeding the residential area and were momentarily handling overloads, which was not at all a difficulty. However, in due course of time, the switching of the transformers started to trip the circuit breakers, which repeated on several occasions. Due to lack of attention, this in-service unit suffered a winding failure and subsequently a failure root-cause analysis was initiated. Figure 7b and Figure 13a,b shows the external and internal view of the failure windings extracted from this transformer. It is visually observed from this transformer unit that the windings other than the failed phase remained intact while the failed winding suffered a severe mechanical damage. Based on observation, it was concluded that the possible root-cause for the failure of this transformer unit was due to the surge voltages initiated by the intermittent switching and transient operation. During a surge phenomenon, the winding-core assembly, although being an inductive in nature, behaves as a complex RLC network with series-parallel connections. This causes the surge voltage to be highly non-uniform and most of the failures occur at the ends, causing winding rupture. In case, if the transient is setup in the low voltage winding, then its equivalent surge voltage is transferred to the high voltage winding. Since, the high voltage windings of the distribution transformers are helical types, they are mechanically supported and cannot handle such stronger mechanical forces setup due to the equivalent surge currents.
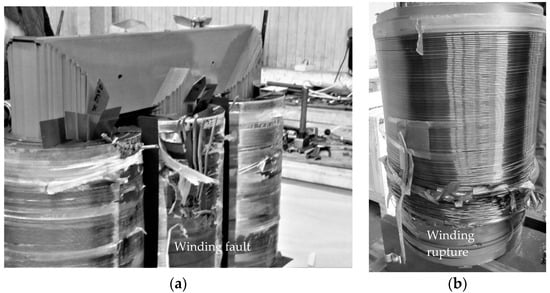
Figure 13.
Pictorial description of the location of failure in the set-3 distribution transformer suffering winding fault. (a) Overall view; (b) failed phase.
Thus, it was concluded from this transformer that the root-cause of failure of this transformer might be due to the surge voltage setup due to the spurious and/or intermittent switching operations and transient phenomenon. A possible way to minimize this is to provide additional mechanical support to the helically wound high voltage winding, which may incur additional costs. In the present context, it was visually found that such an arrangement was not adequate and henceforth recommended for more attention.
6. Conclusions
A field study was carried out for establishing the importance of diagnostic tests in preventive and reliability-oriented maintenance program of distribution transformers. Thus, it is evident from this field study that the diagnostic tests, rather than outweighing the benefits of replacing transformers, reduced cost consuming procedures such as refurbishment, scrapping, etc., and generate more revenue by increasing the utilization factor of the distribution transformers. The internally occurring premature failures in a distribution transformer primarily affect the integrity of the insulation and winding-core system, which is very different in the case of a power transformer. Experiments reveal that the multiple resonant peaks fail to appear in the distribution transformer, indicating the dominant inductive influence of winding-core assembly. Additionally, it is experimentally evident that the compromise in the insulation integrity does not show-up in the frequency response measurements. A special terminal connection and system function pair is required to reveal the same. At the same time, the thermal failure did not alter the dielectric and winding-core arrangement, but nevertheless caused material degradation. Furthermore, it emerged that the location and operating environment of the in-service distribution transformers plays a significant role in determining their lifetime and reliability. Experiments revealed that the transformers installed at the outskirts of the city have more affinity towards moisture. Such information is valuable when deciding the location for installing and commissioning distribution transformers. Nevertheless, a more realistic picture about the efficacy of such various aspects would emerge after extensive measurements on actual transformers are performed. It is hoped that such an exercise would attract active support and the involvement of power utilities in including such diagnostic methods and optimizing the maintenance and asset management program. Following this, based on the current findings, a deep investigation on estimating the lifetime and reliability of in-service distribution transformers using their diagnostic data is suggested.
Funding
This research received no external funding.
Conflicts of Interest
The author declares no conflict of interest.
References
- Chang, R.F.; Leou, R.C.; Lu, C.N. Distribution transformer load modeling using load research data. IEEE Trans. Power Deliv. 2002, 17, 655–661. [Google Scholar] [CrossRef]
- Humayun, M.; Degefa, M.Z.; Safdarian, A.; Lehtonen, M. Utilization Improvement of Transformers Using Demand Response. IEEE Trans. Power Deliv. 2015, 30, 202–210. [Google Scholar] [CrossRef]
- Zhang, X.; Gockenbach, E. Asset-Management of Transformers Based on Condition Monitoring and Standard Diagnosis. IEEE Electr. Insul. Mag. 2008, 24, 26–40. [Google Scholar] [CrossRef]
- Abu-Elanien, A.E.B.; Salama, M.M.A. Asset management techniques for transformers. J. Electr. Power Syst. Res. 2010, 80, 456–464. [Google Scholar] [CrossRef]
- Arumugam, S.; Gorchakov, S.; Schoenemann, T. Field Experience on Diagnostic Condition Assessment of Three Phase Distribution Class Transformers Over a Wide Frequency. In Proceedings of the IEEE Electrical Insulation Conference (EIC), Montreal, QC, Canada, 19–22 June 2016; pp. 237–240. [Google Scholar]
- IEEE Guide for Failure Investigation, Analysis, and Reporting for Power Transformers and Shunt Reactors, IEEE Std C57.125-2015 (Revision of IEEE Std C57.125-1991); IEEE Power and Energy Society: Piscataway, NJ, USA, 2015.
- Arritt, R.F.; Dugan, R.C. Distributed generation interconnection transformer and grounding selection. In Proceedings of the 2008 IEEE Power and Energy Society General Meeting-Conversion and Delivery of Electrical Energy in the 21st Century, Pittsburgh, PA, USA, 20–24 July 2008; pp. 1–7. [Google Scholar]
- Bhargavi, R.N.; Kumar, P.R.; Swarupa, M.L.; Shravani, C. Effect of Transformer connections in Distributed Generation system. In Proceedings of the International Conference on Renewable Energy Integration into Smart Grids: A Multidisciplinary Approach to Technology Modelling and Simulation (ICREISG), Bhubaneshwar, India, 14–15 February 2020; pp. 95–98. [Google Scholar]
- Heathcote, M. J and P Transformer Book, 13th ed.; Newnes: Burlington, MA, USA, 2011; pp. 230–249. [Google Scholar]
- Bossi, A.; Dind, J.E.; Frisson, J.M.; Khoudiakov, U.; Light, H.F.; Narke, D.V. An international survey on failures in large power transformers in service. Cigré Electra 1983, 88, 21–48. [Google Scholar]
- Christina, A.J.; Salam, M.A.; Rahman, Q.M.; Wen, F.; Ang, S.P.; Voon, W. Causes of transformer failures and diagnostic methods—A review. Renew. Sustain. Energy Rev. 2018, 82, 1442–1445. [Google Scholar]
- IEEE Guide for the Application and Interpretation of Frequency Response Analysis of Oil-Immersed Transformers, IEEE Std C57.149TM-2012; IEEE Power and Energy Society: Piscataway, NJ, USA, 2012.
- Clark, P.W. Detecting Distribution Transformer Faults; IFD Corp.: Vancouver, BC, Canada, 2005; pp. 1–19. [Google Scholar]
- Wang, H.; Butler, K.L. Finite element analysis of internal winding faults in distribution transformers. IEEE Trans. Power Deliv. 2001, 16, 422–428. [Google Scholar] [CrossRef]
- Bhowmick, S.; Nandi, S. Online Detection of an Interturn Winding Fault in Distribution Transformers Using a Terminal Measurement-Based Modeling Technique. IEEE Trans. Power Deliv. 2015, 30, 1007–1015. [Google Scholar] [CrossRef]
- Jaiswal, G.C.; Ballal, M.S.; Tutakne, D.R.; Vishnu, P. Intelligent condition monitoring system for distribution transformer and health status diagnosis. In Proceedings of the International Conference on Power, Instrumentation, Control and Computing Conference (PICC), Kerala, India, 18–20 January 2018; pp. 1–6. [Google Scholar]
- Hamzeh, M.; Vahidi, B.; Askarian-Abyaneh, H. Reliability evaluation of distribution transformers with high penetration of distributed generation. J. Electr. Power Energy Syst. 2015, 73, 163–169. [Google Scholar] [CrossRef]
- Agah, S.M.; Abyaneh, H.A. Distribution Transformer Loss-of-Life Reduction by Increasing Penetration of Distributed Generation. IEEE Trans. Power Deliv. 2011, 26, 1128–1136. [Google Scholar] [CrossRef]
- Agah, S.M.M.; Abyaneh, H.A. Quantification of the Distribution Transformer Life Extension Value of Distributed Generation. IEEE Trans. Power Deliv. 2011, 26, 1820–1828. [Google Scholar] [CrossRef]
- Awadallah, S.K.E.; Milanović, J.V.; Jarman, P.N. The Influence of Modeling Transformer Age Related Failures on System Reliability. IEEE Trans. Power Syst. 2015, 30, 970–979. [Google Scholar] [CrossRef]
- Cho, N.; Yun, S.; Jung, J. Determining the reverse fault current by the type of transformer and Distributed Generation in distribution system during the single-line to ground fault. Renew. Sustain. Energy Rev. 2019, 109, 102–115. [Google Scholar] [CrossRef]
- Shahzad, U.; Kahrobaee, S.; Asgarpoor, S. Protection of Distributed Generation: Challenges and Solutions. Energy Power Eng. 2017, 9, 614–653. [Google Scholar] [CrossRef] [Green Version]
- Bakshi, A.; Kulkarni, S.V. Analysis of Buckling Strength of Inner Windings in Transformers Under Radial Short-Circuit Forces. IEEE Trans. Power Deliv. 2014, 29, 241–245. [Google Scholar] [CrossRef]
- Bagheri, M.; Phung, B.T.; Blackburn, T. Influence of temperature and moisture content on frequency response analysis of transformer winding. IEEE Trans. Dielectr. Electr. Insul. 2014, 21, 1393–1404. [Google Scholar] [CrossRef]
- Satish, L.; Saravanakumar, A. Identification of Terminal Connection and System function Pair for Making Sensitive SFR Measurements. IEEE Trans. Power Deliv. 2008, 23, 742–750. [Google Scholar] [CrossRef]
- Arumugam, S. Experimental Investigation on Terminal Connection and System Function Pair during SFRA Testing on three phase transformers. J. Electr. Power Energy Syst. 2014, 58, 101–110. [Google Scholar] [CrossRef]
- Arumugam, S. Theoretical Considerations While Applying FRA Method in Determining the Inter-Winding Capacitance of Power Transformers at Higher Frequencies. Eng. Rep. 2019, 1, e12036. [Google Scholar]
- Arumugam, S. Experimental validation of using frequency response analysis method in measuring interwinding capacitance of power transformers. Eng. Rep. 2019, 1, e12079. [Google Scholar] [CrossRef] [Green Version]
- Koch, M. Reliable Moisture Determination in Power Transformer. Ph.D. Thesis, University of Stuttgart, Stuttgart, Germany, 2008; pp. 77–79. [Google Scholar]
- Koch, M.; Krueger, M. A Fast and Reliable Dielectric Diagnostic Method to Determine Moisture in Power Transformers. In Proceedings of the International Conference on Condition Monitoring and Diagnosis (CMD 2008), Peking, China, 21–24 April 2008. [Google Scholar]
- Pandey, S.B.; Lin, C. Estimation of life model of transformer insulation under combined electrical and thermal stress. IEEE Trans. Reliab. 1992, 41, 466–468. [Google Scholar] [CrossRef]
- Raetzke, S.; Koch, M.; Krueger, M. Condition assessment of instrument transformer using dielectric response analysis. E I Elektrotechnik Und Inf. 2013, 1–5. [Google Scholar] [CrossRef]
- Zhang, X.; Gockenbach, E. Assessment of the actual condition of the electrical components in medium-voltage networks. IEEE Trans. Reliab. 2006, 55, 361–368. [Google Scholar] [CrossRef]
- Milutinovich, J.S.; Mahon, W.T. Some Thoughts on Minimizing Cost of Arc-Furnace Transformers. IEEE Trans. Reliab. 1975, 24, 251–254. [Google Scholar] [CrossRef]
Publisher’s Note: MDPI stays neutral with regard to jurisdictional claims in published maps and institutional affiliations. |
© 2021 by the author. Licensee MDPI, Basel, Switzerland. This article is an open access article distributed under the terms and conditions of the Creative Commons Attribution (CC BY) license (https://creativecommons.org/licenses/by/4.0/).