
Bidimensional Increment Entropy for Texture Analysis: Theoretical Validation and Application to Colon Cancer Images

 and
and 
Abstract
1. Introduction
2. Methods
2.1. Two-Dimensional Increment Entropy, IncrEn2D
- 1.
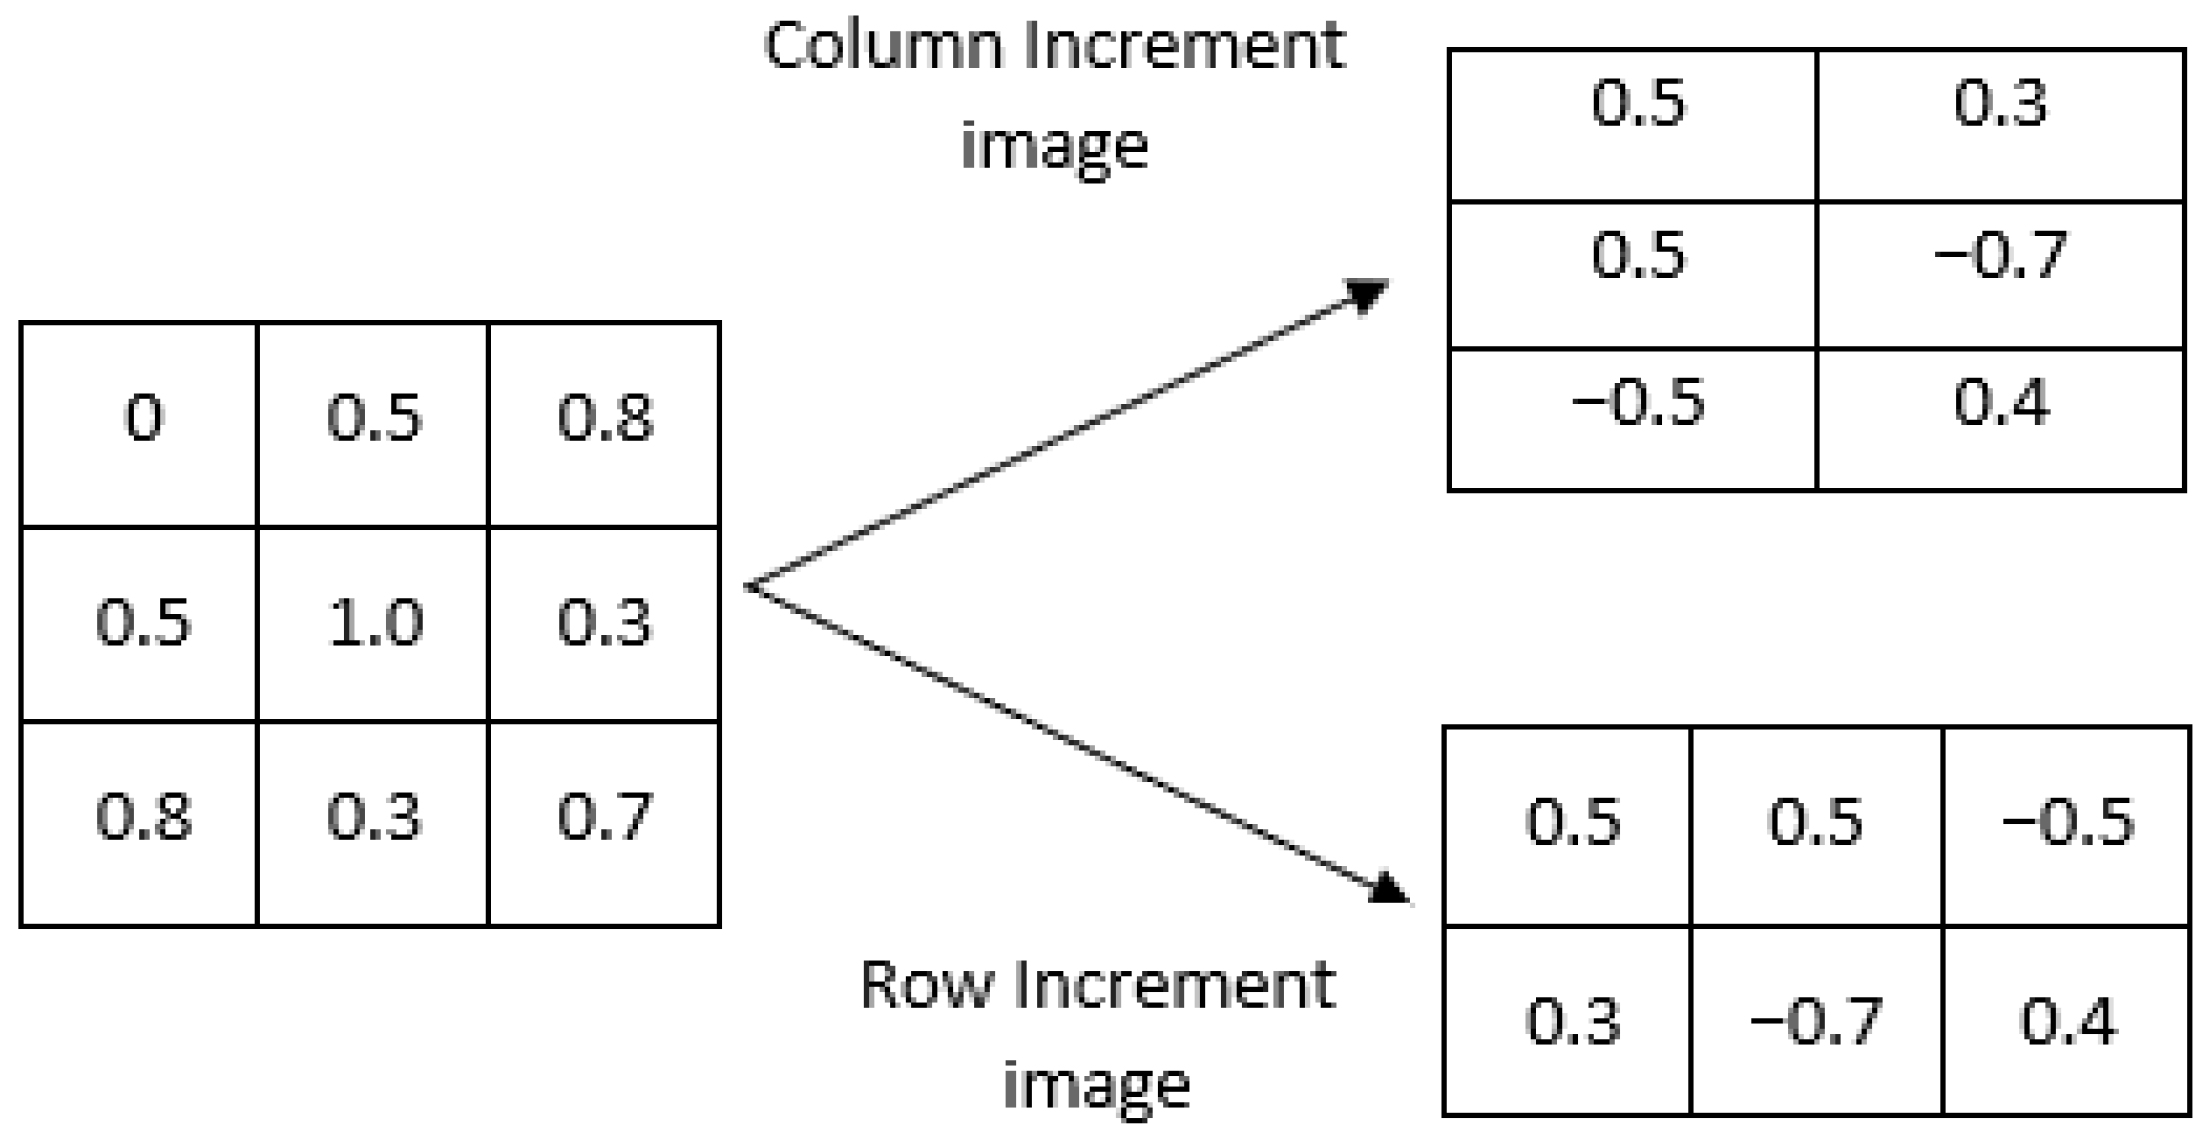
- First, an increment image V(I) is formed from the original image I. This can be performed in two different ways, as illustrated in Figure 1:
- (a)
- Row-wise increment image. In this case, pixel values are subtracted in adjacent rows so the size of the increment image would be .
- (b)
- Column-wise increment image. In this case, pixel values are subtracted in adjacent columns, and thus, the increment image would be .Figure 1. Illustration of the two possible methods for constructing the increment image V(I).
![Entropy 27 00080 g001]()
- 2.
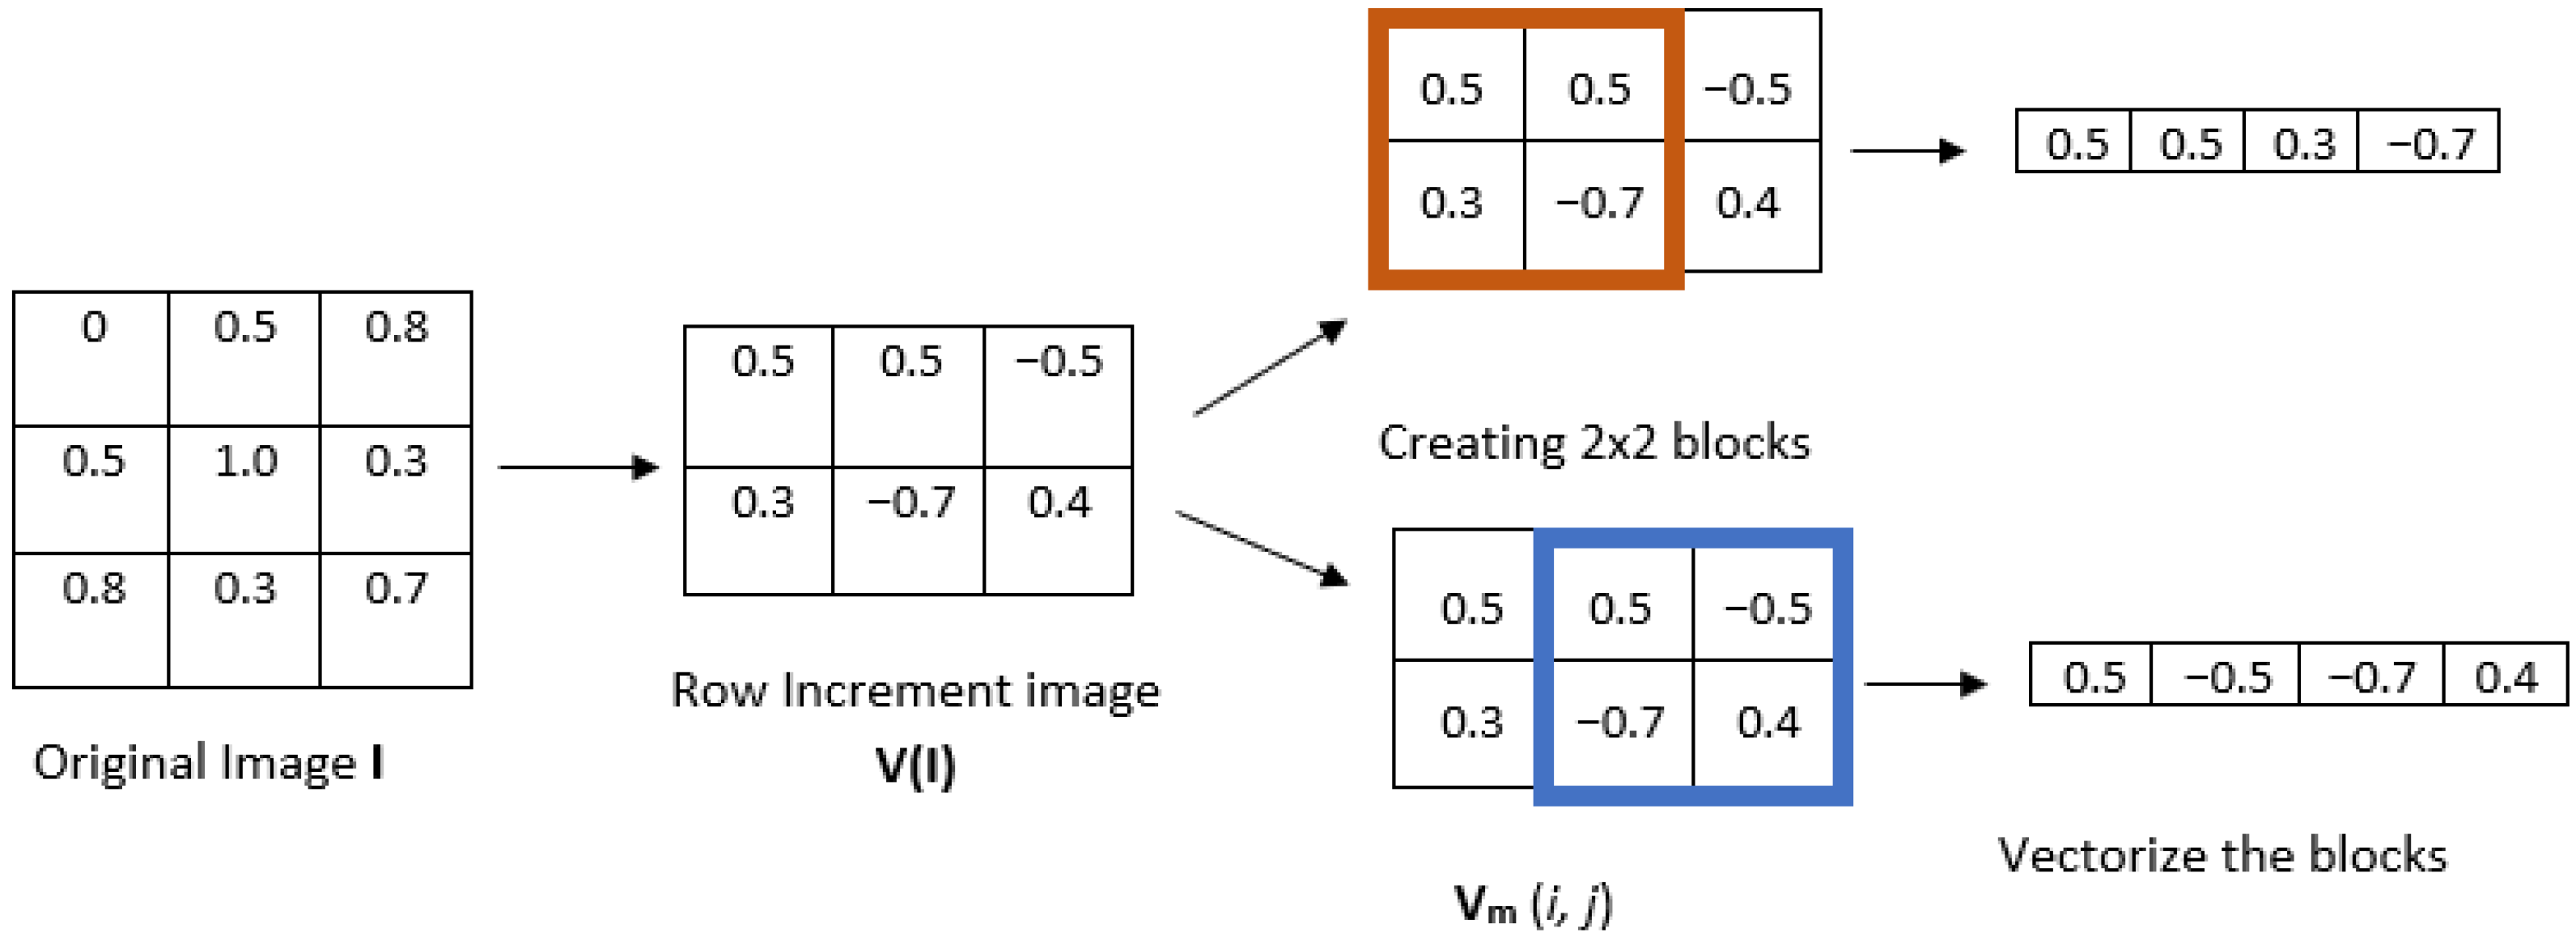
- Given a positive integer m, divide the increment image into overlapping blocks of size (see Figure 2, where ). We define Vm(i,j) as the m-length square block in image V(I), where the indices range from row i to and from column j to . The total number of blocks can be computed as for a row-wise increment image and for a column-wise increment image.
- 3.
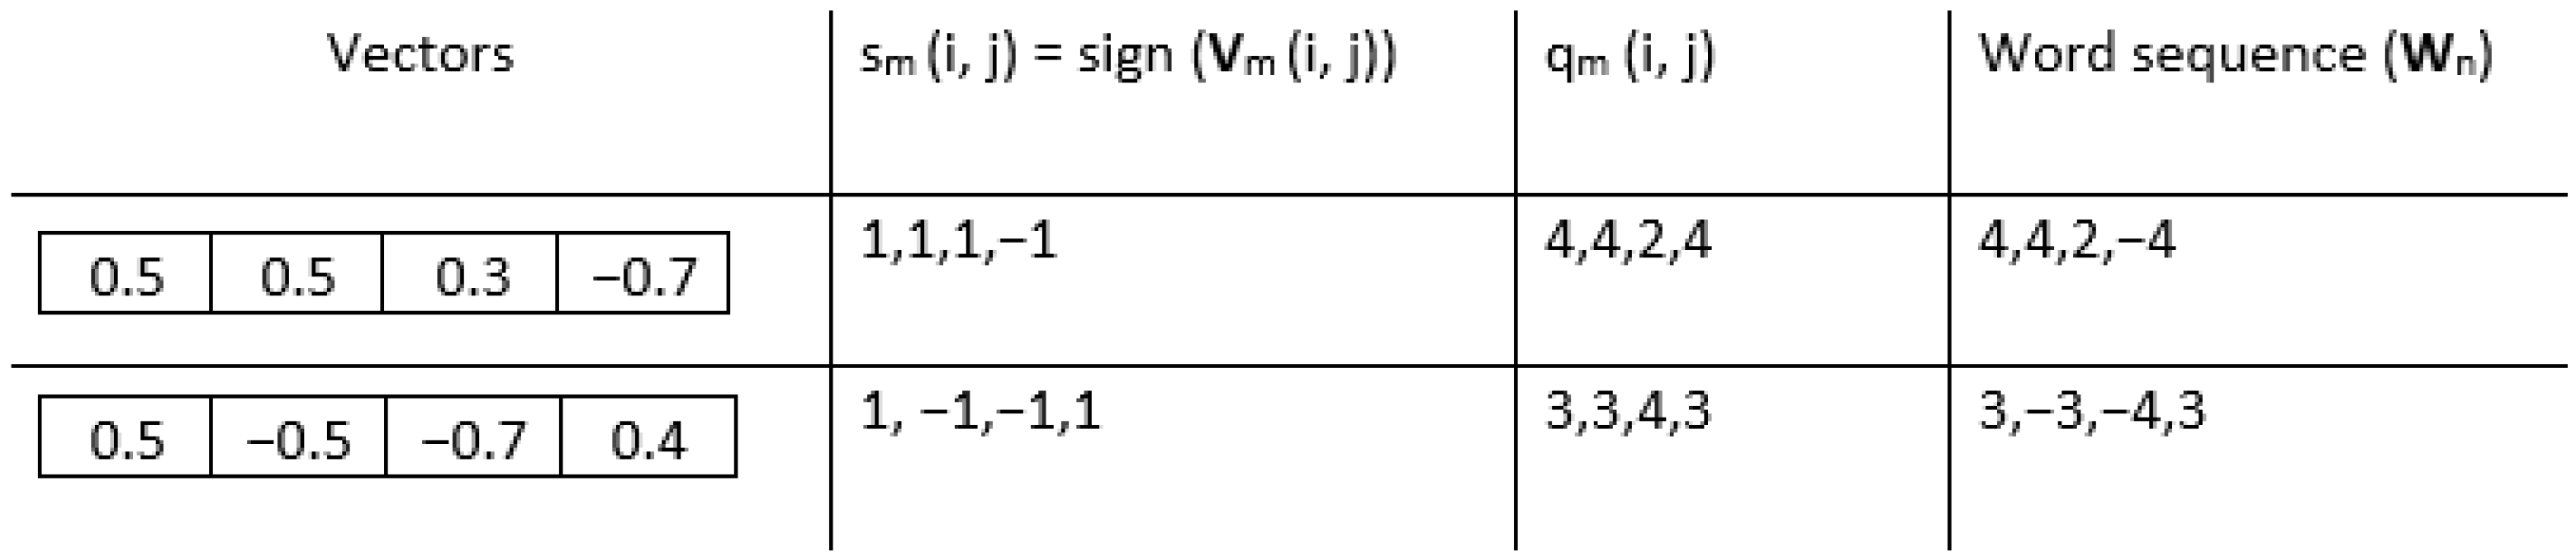
- Vectorize each block to obtain an increment vector Vm(i,j) and calculate the nth unique word sequence Wn for each Vm(i,j), for a given quantifying resolution R. Each element of the increment vector Vm(i,j) is mapped into word pattern composed of two parts: sign and magnitude . The sign function produces different results depending on the input element. If the input element is greater than 0, the function returns 1. If the input element is equal to 0, the function returns 0. If the input element is less than 0, the function returns −1. The magnitude that represents the extent of difference between these neighboring pixels is determined by the resolution parameter R. Subsequently, every increment vector is transformed into a pattern vector comprising elements (considering both sign and magnitude). To gain a complete understanding of creating a word pattern, let us consider the example of the template vectors illustrated in Figure 3, where the quantifying resolution R is taken as 4. The sign is calculated as = sign(Vm(i,j)), and magnitude is calculated using the following equation:
- 4.
- Count the total number of instances of every unique nth word pattern .
- 5.
- Compute the relative frequency of each unique word using the following equation:where is the total number of words for the given increment image.
- 6.
- Calculate the two-dimensional increment entropy, IncrEn2D, of image I using the following equation:
2.2. Multiscale 2D Increment Entropy
- 1.
- Coarse-graining procedure: The non-overlapping moving-average coarse-graining procedure is used in this study to divide the image into multiple scales. In this procedure, a non-overlapping window of size sweeps across the entire image, and the pixels within each window are averaged. These resulting average values shape the coarse-grained images. These images, while not being the subsets of the original, encapsulate information about the entire original image. When considering an image I of dimensions , a coarse-grained image G(τ) at scale factor is expressed mathematically as follows:where , and is the scale factor. For scale factor 1, the coarse-grained image corresponds to the original image. At higher scale factor, the dimensions of the coarse-grained image are reduced by a factor of .
- 2.
- Application of IncrEn2D: In the subsequent step, IncrEn2D is applied individually on each of the coarse-grained images.
2.3. Evaluation Images and Computational Steps
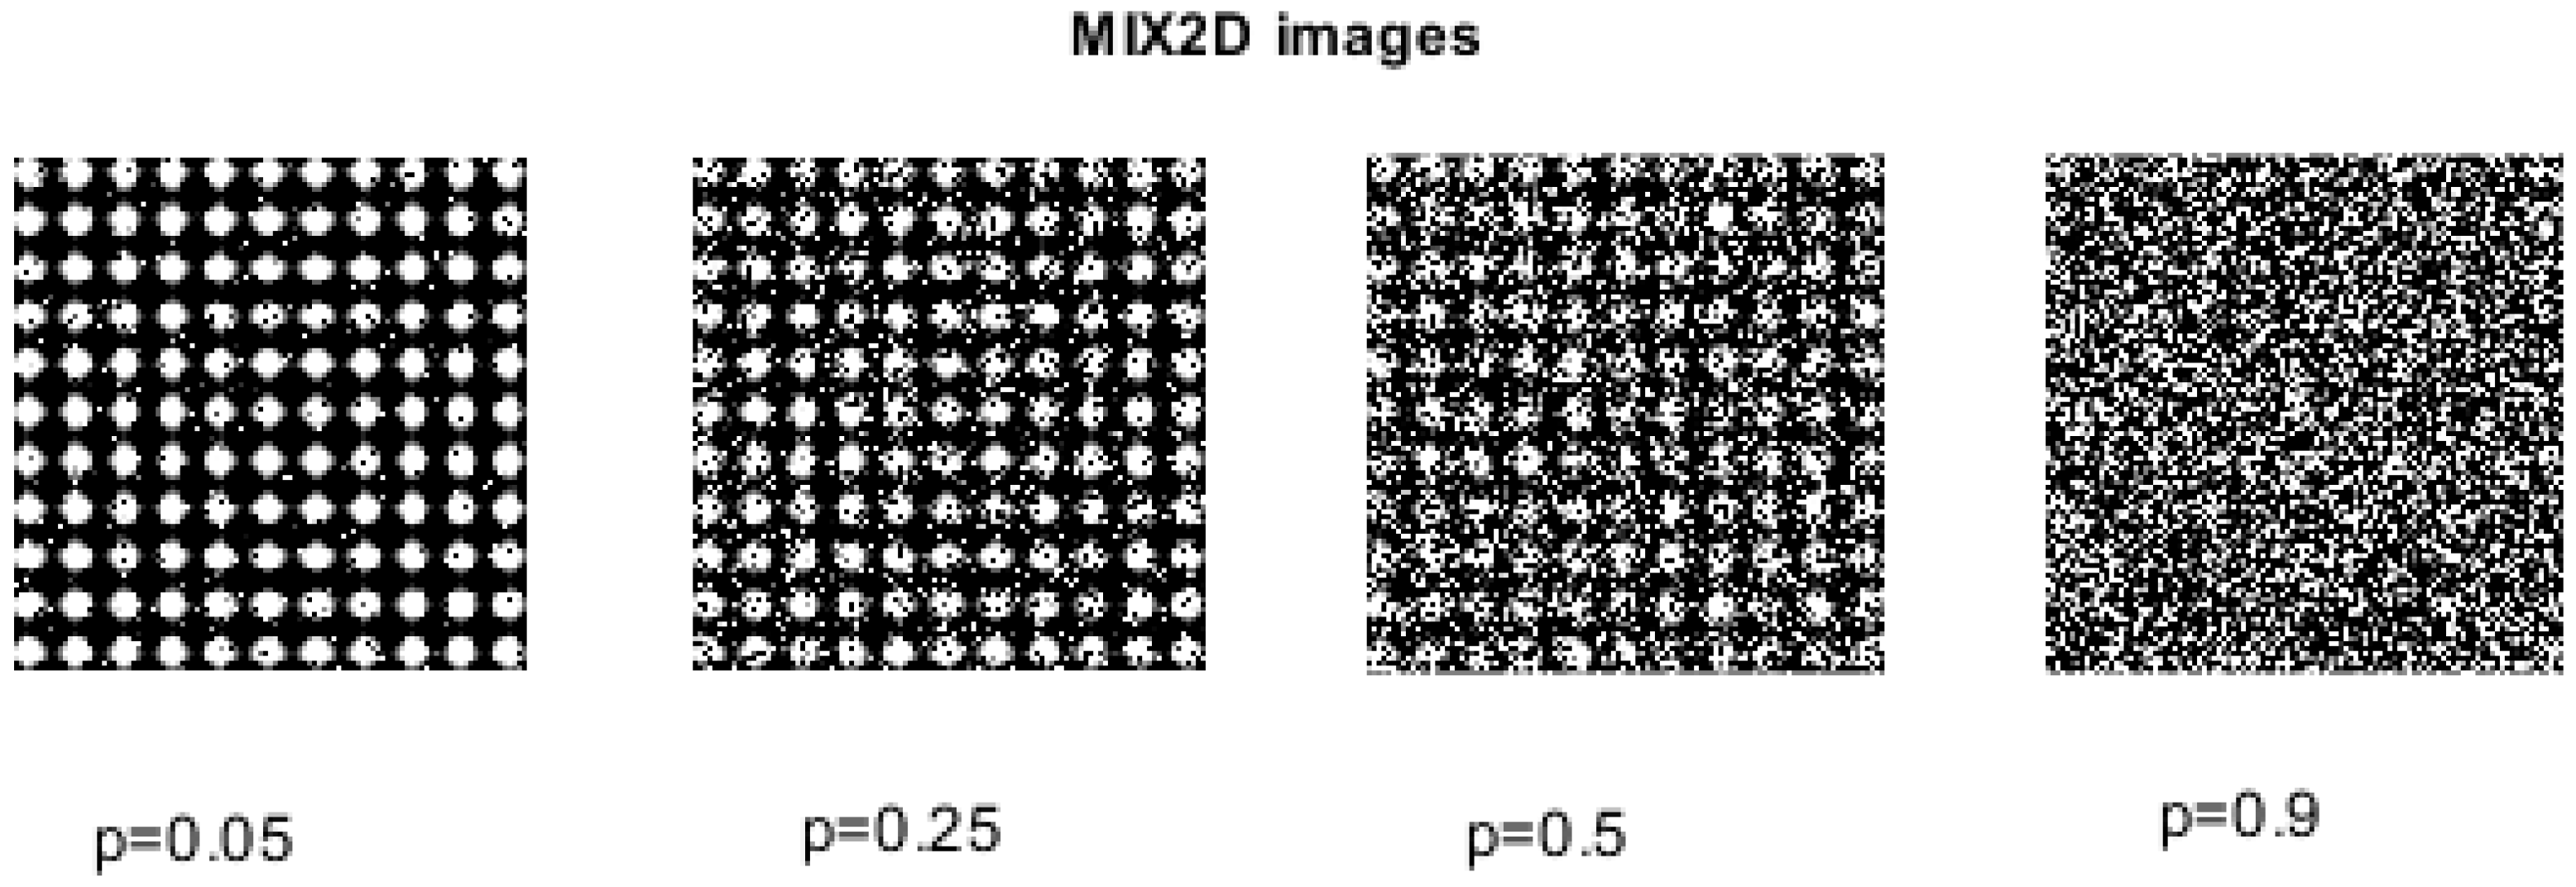
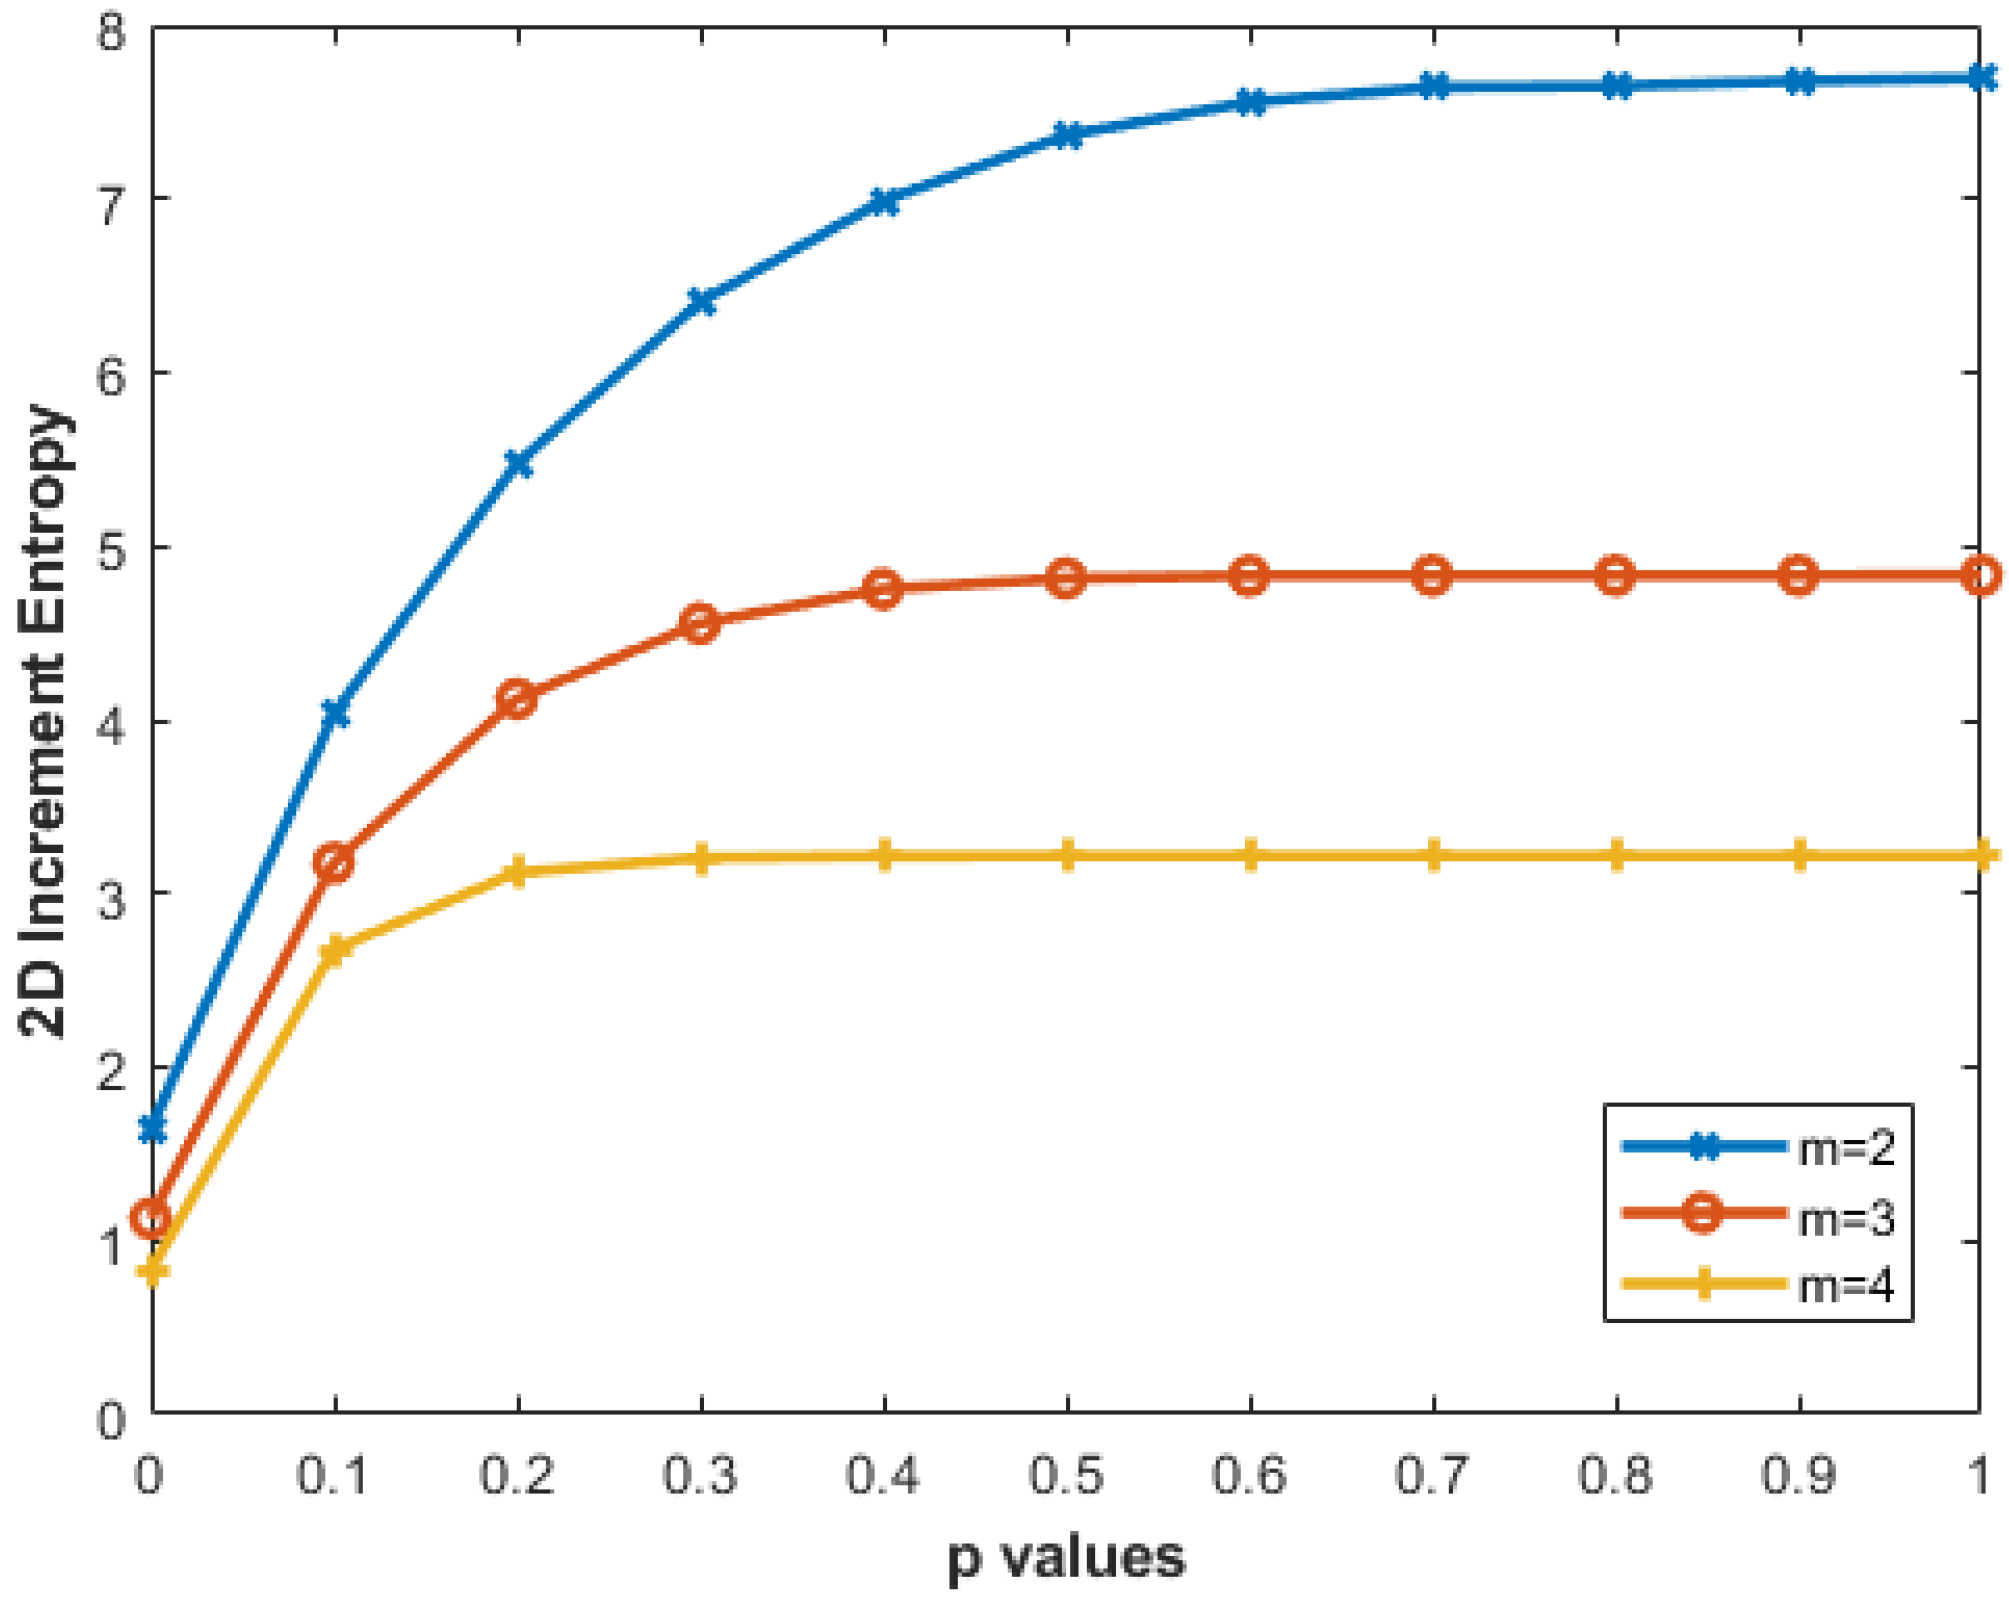
2.3.1. Two-Dimensional MIX Process (MIX2D(p))
2.3.2. Artificial Periodic and Synthesized Texture Images
2.3.3. Image with Additive Noise
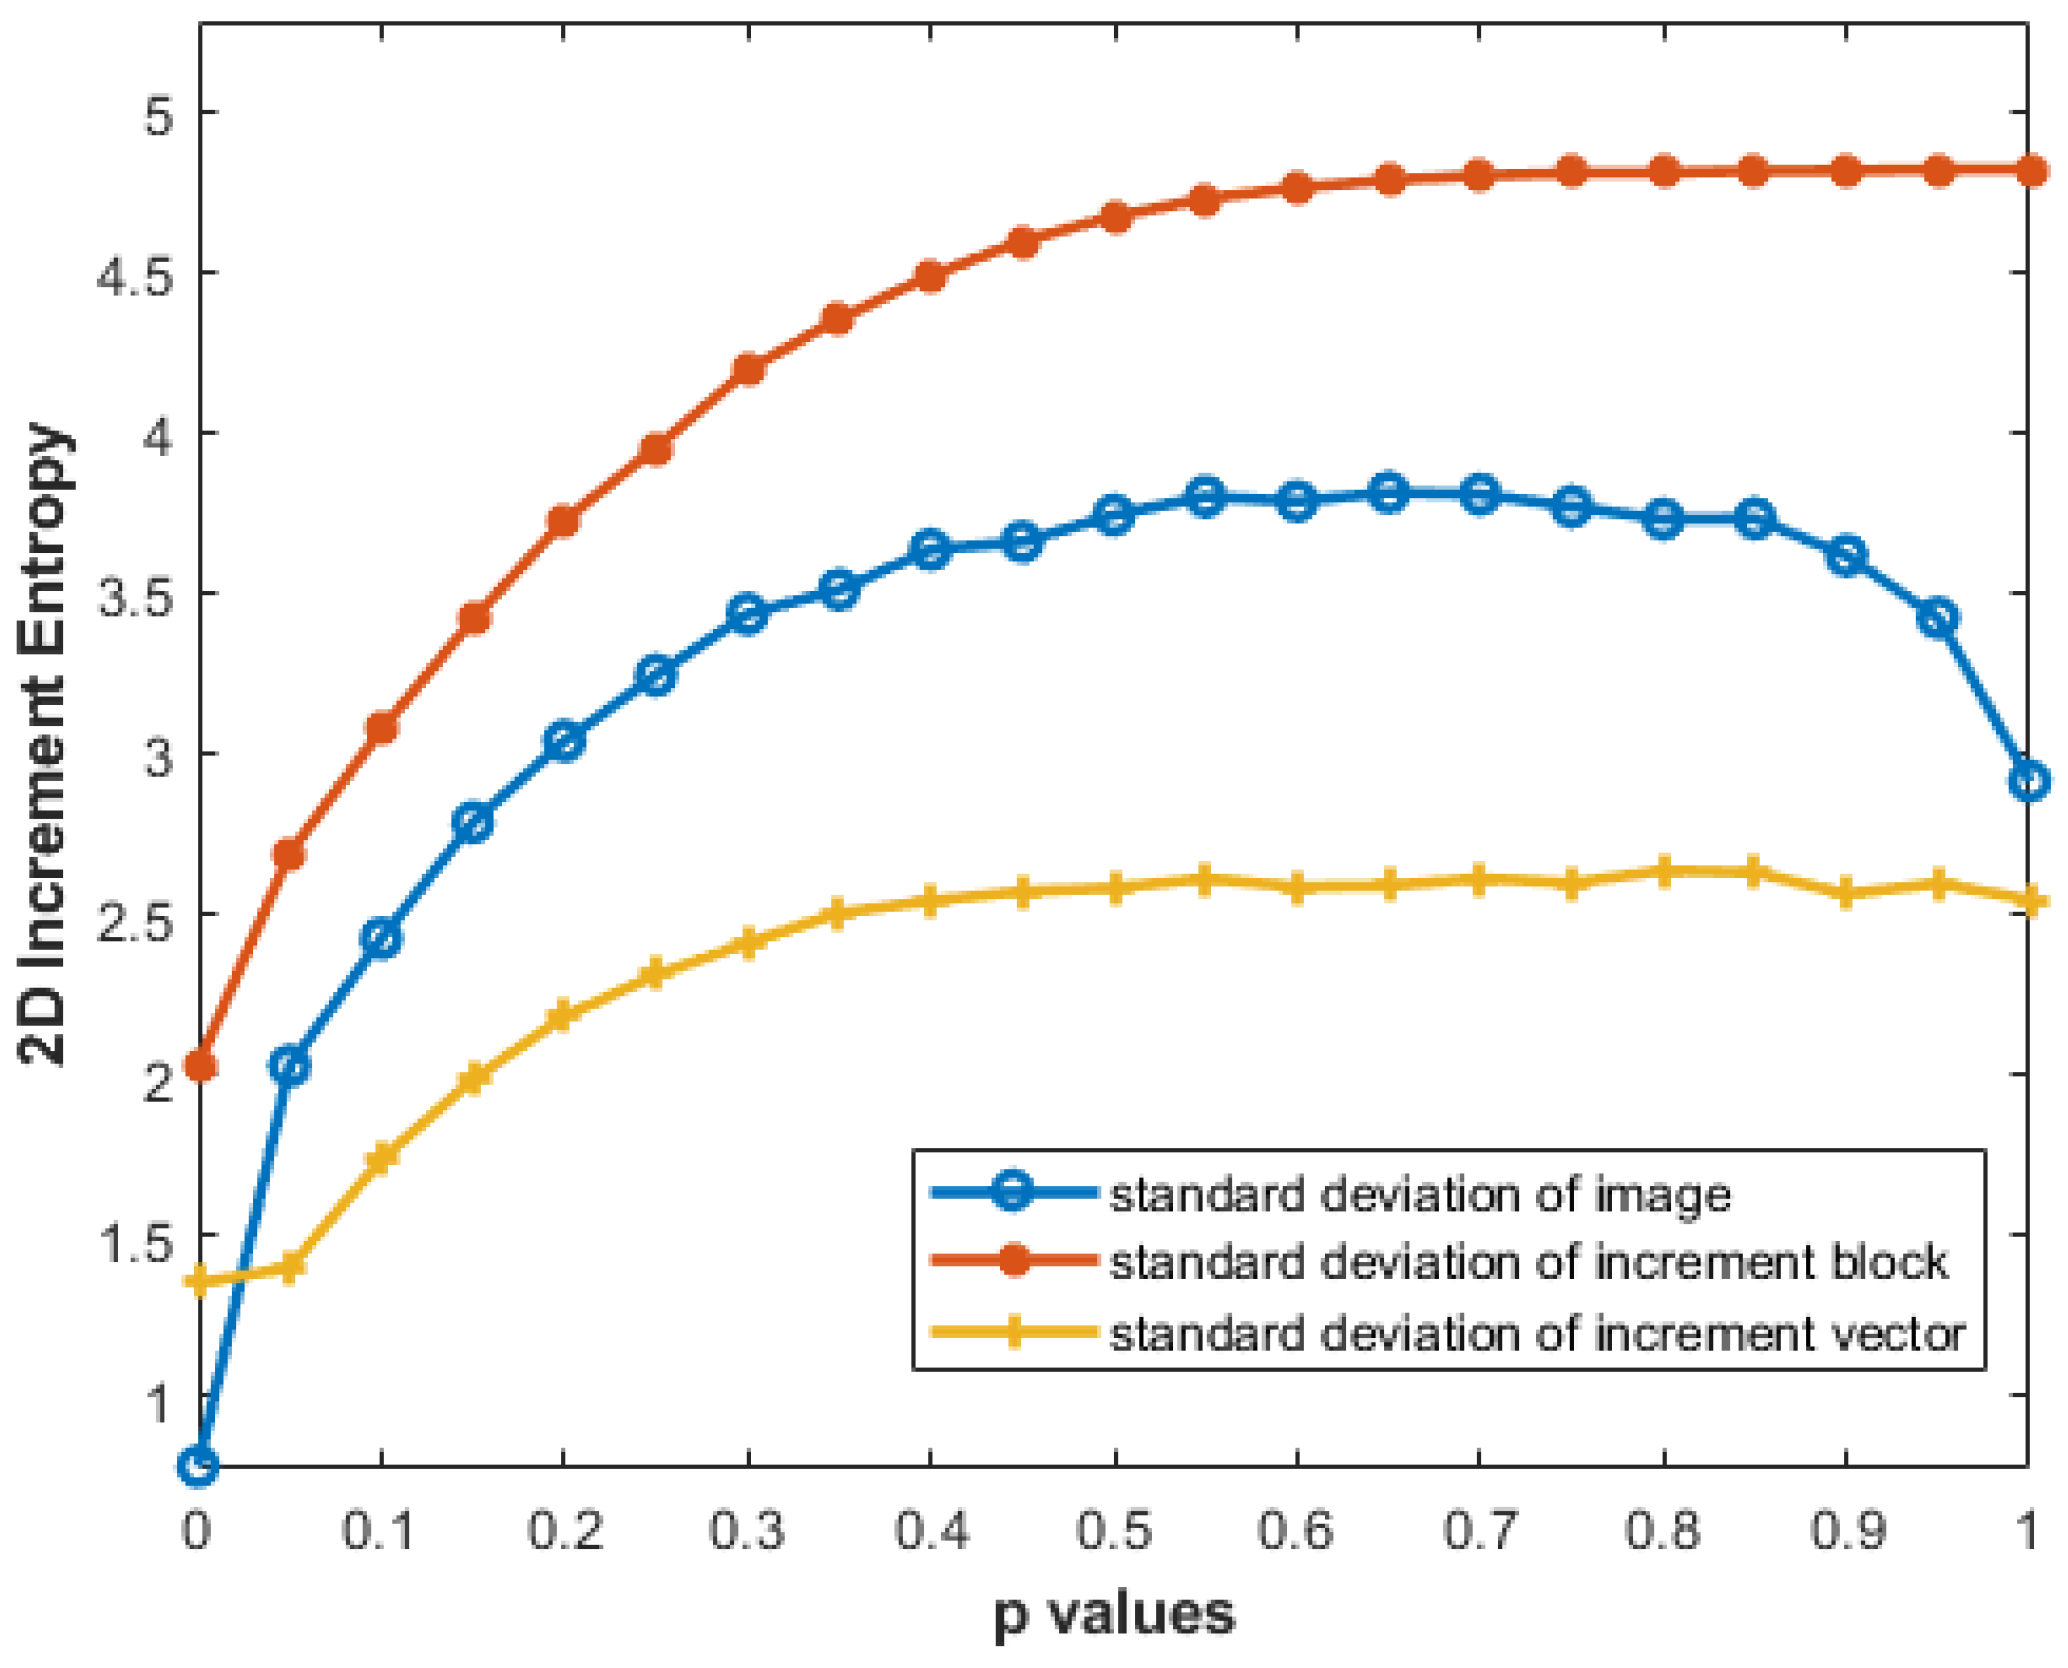
2.3.4. Effect of Different Standard Deviation Computations on IncrEn2D
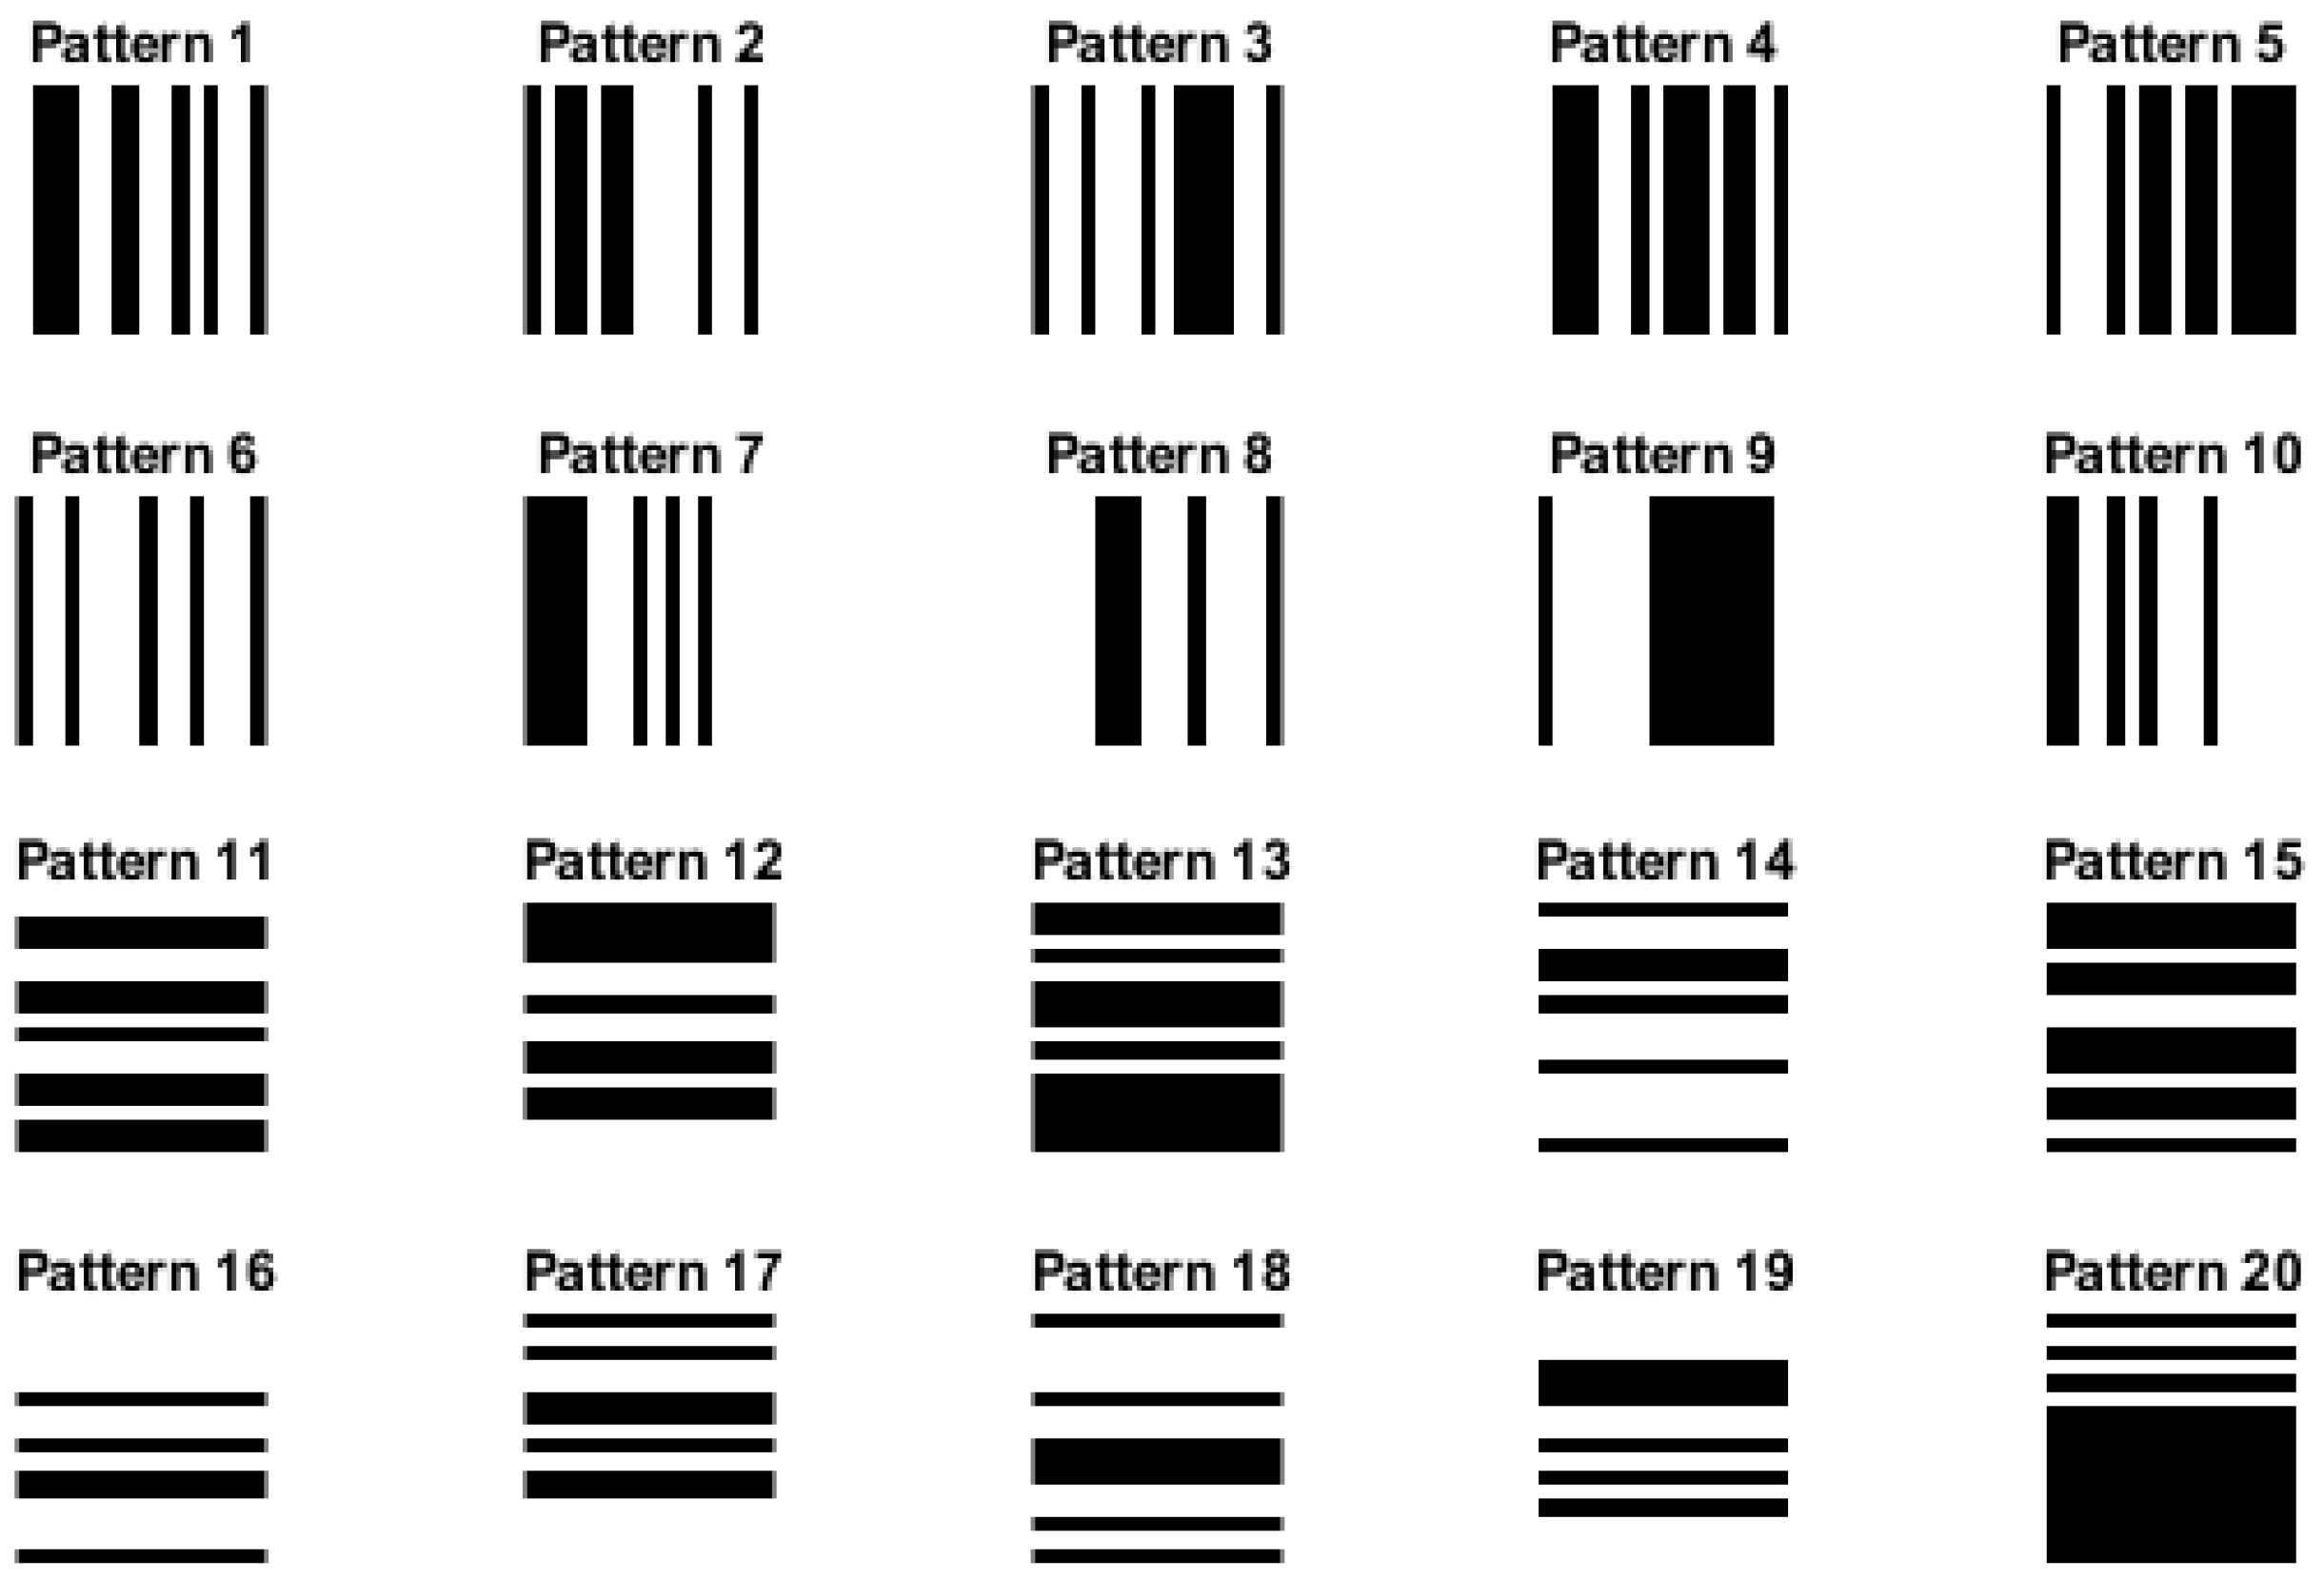
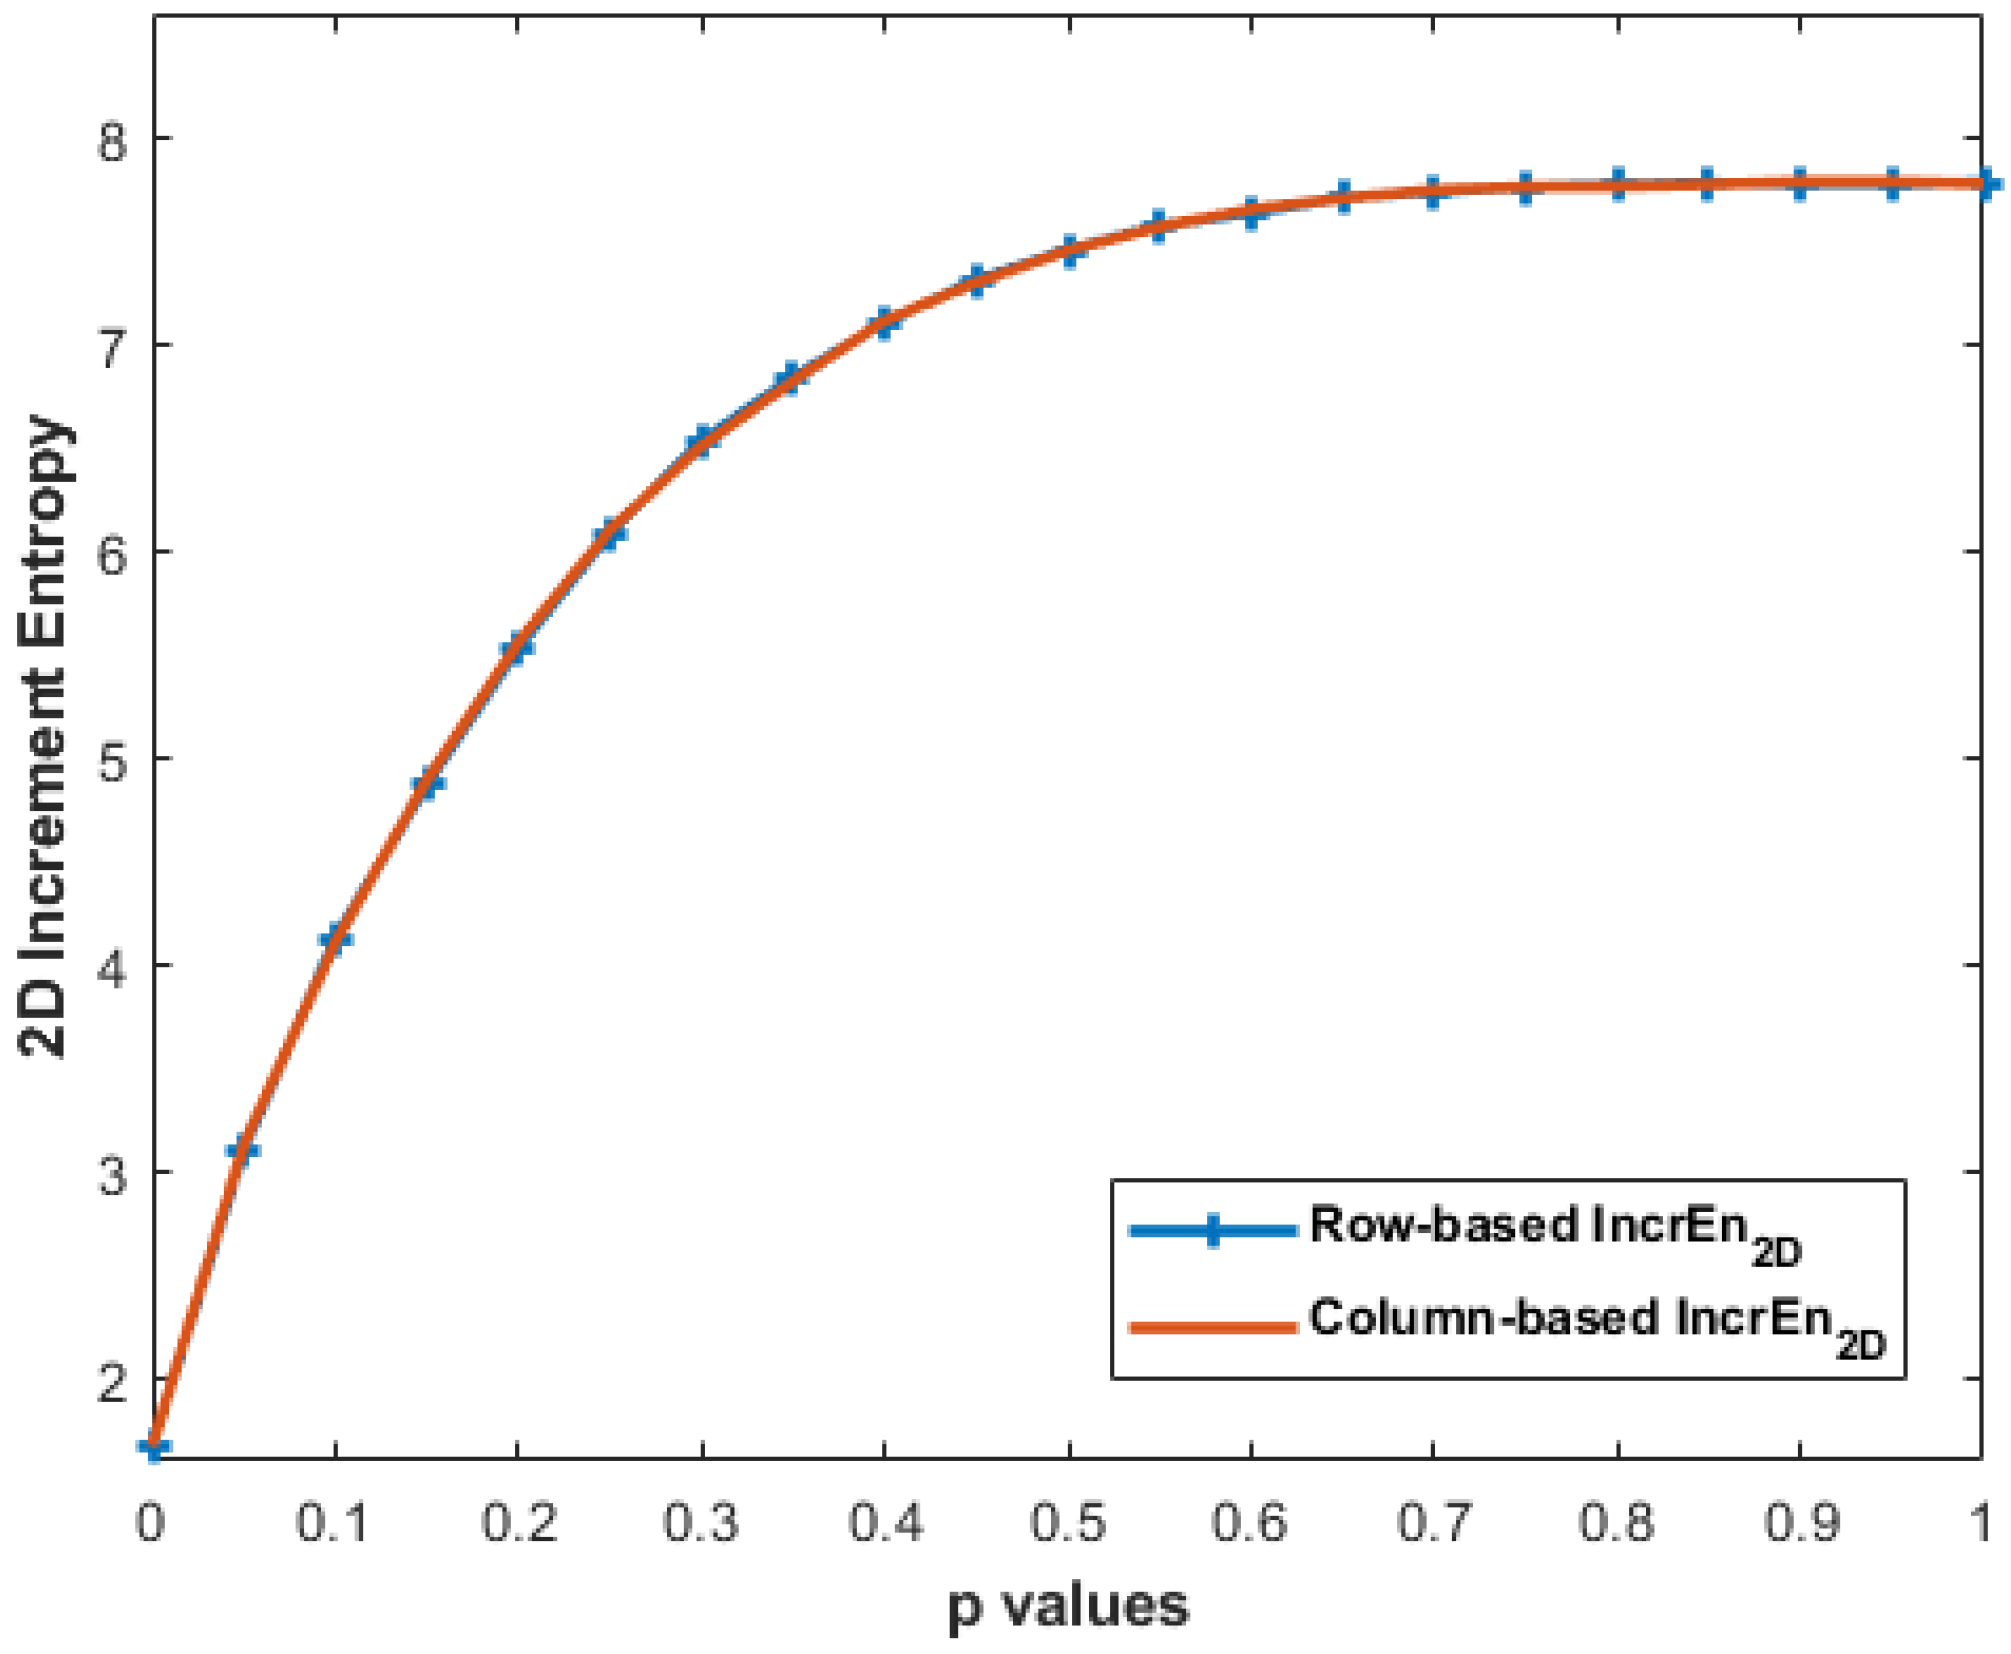
2.3.5. Effect of Row-Wise and Column-Wise Increment Images
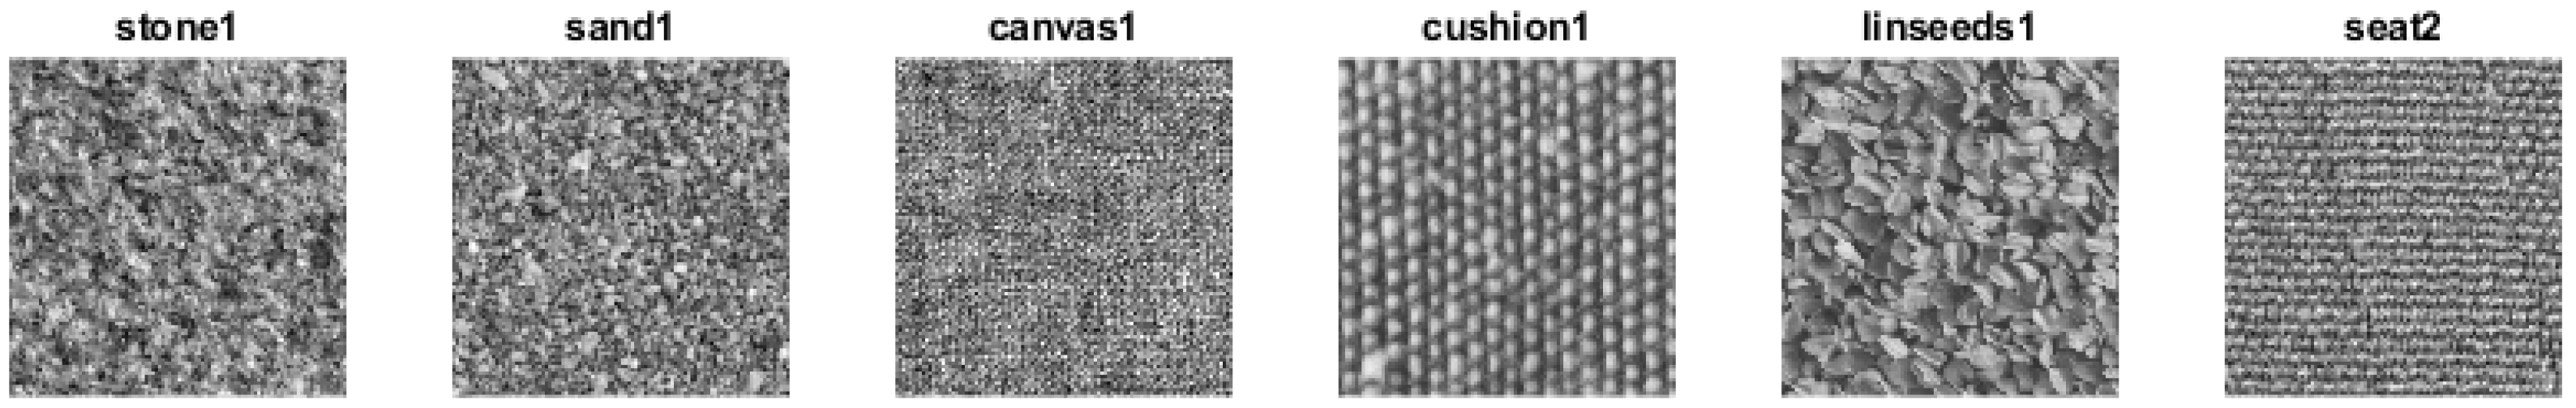
2.3.6. Kylberg Real Texture Dataset
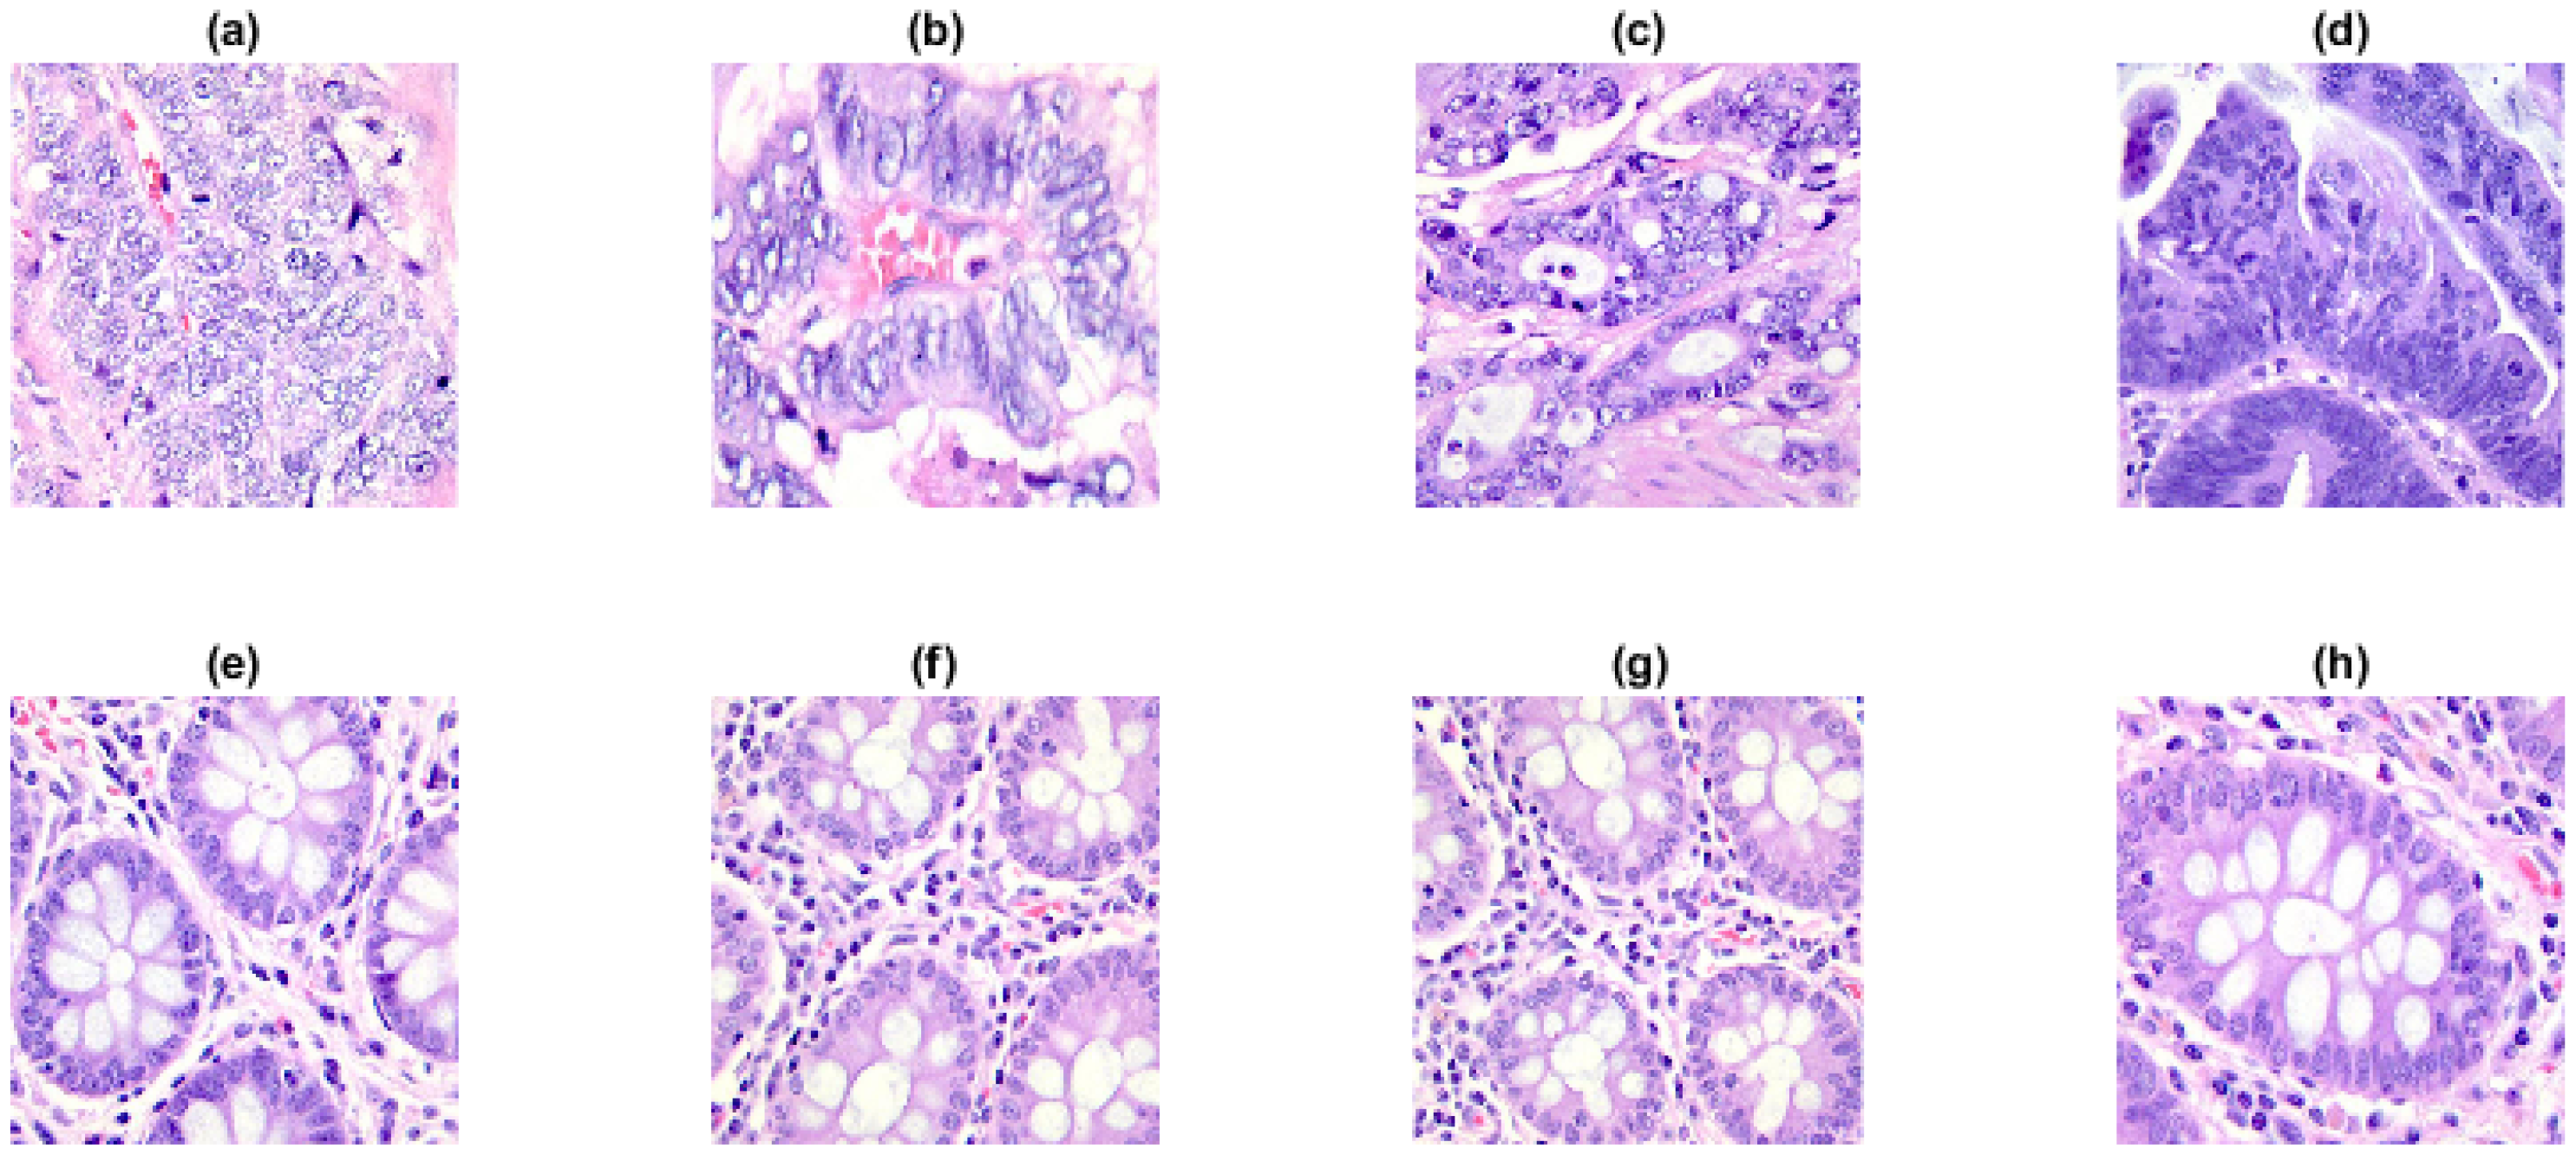
2.3.7. Colon Cancer Dataset
3. Results
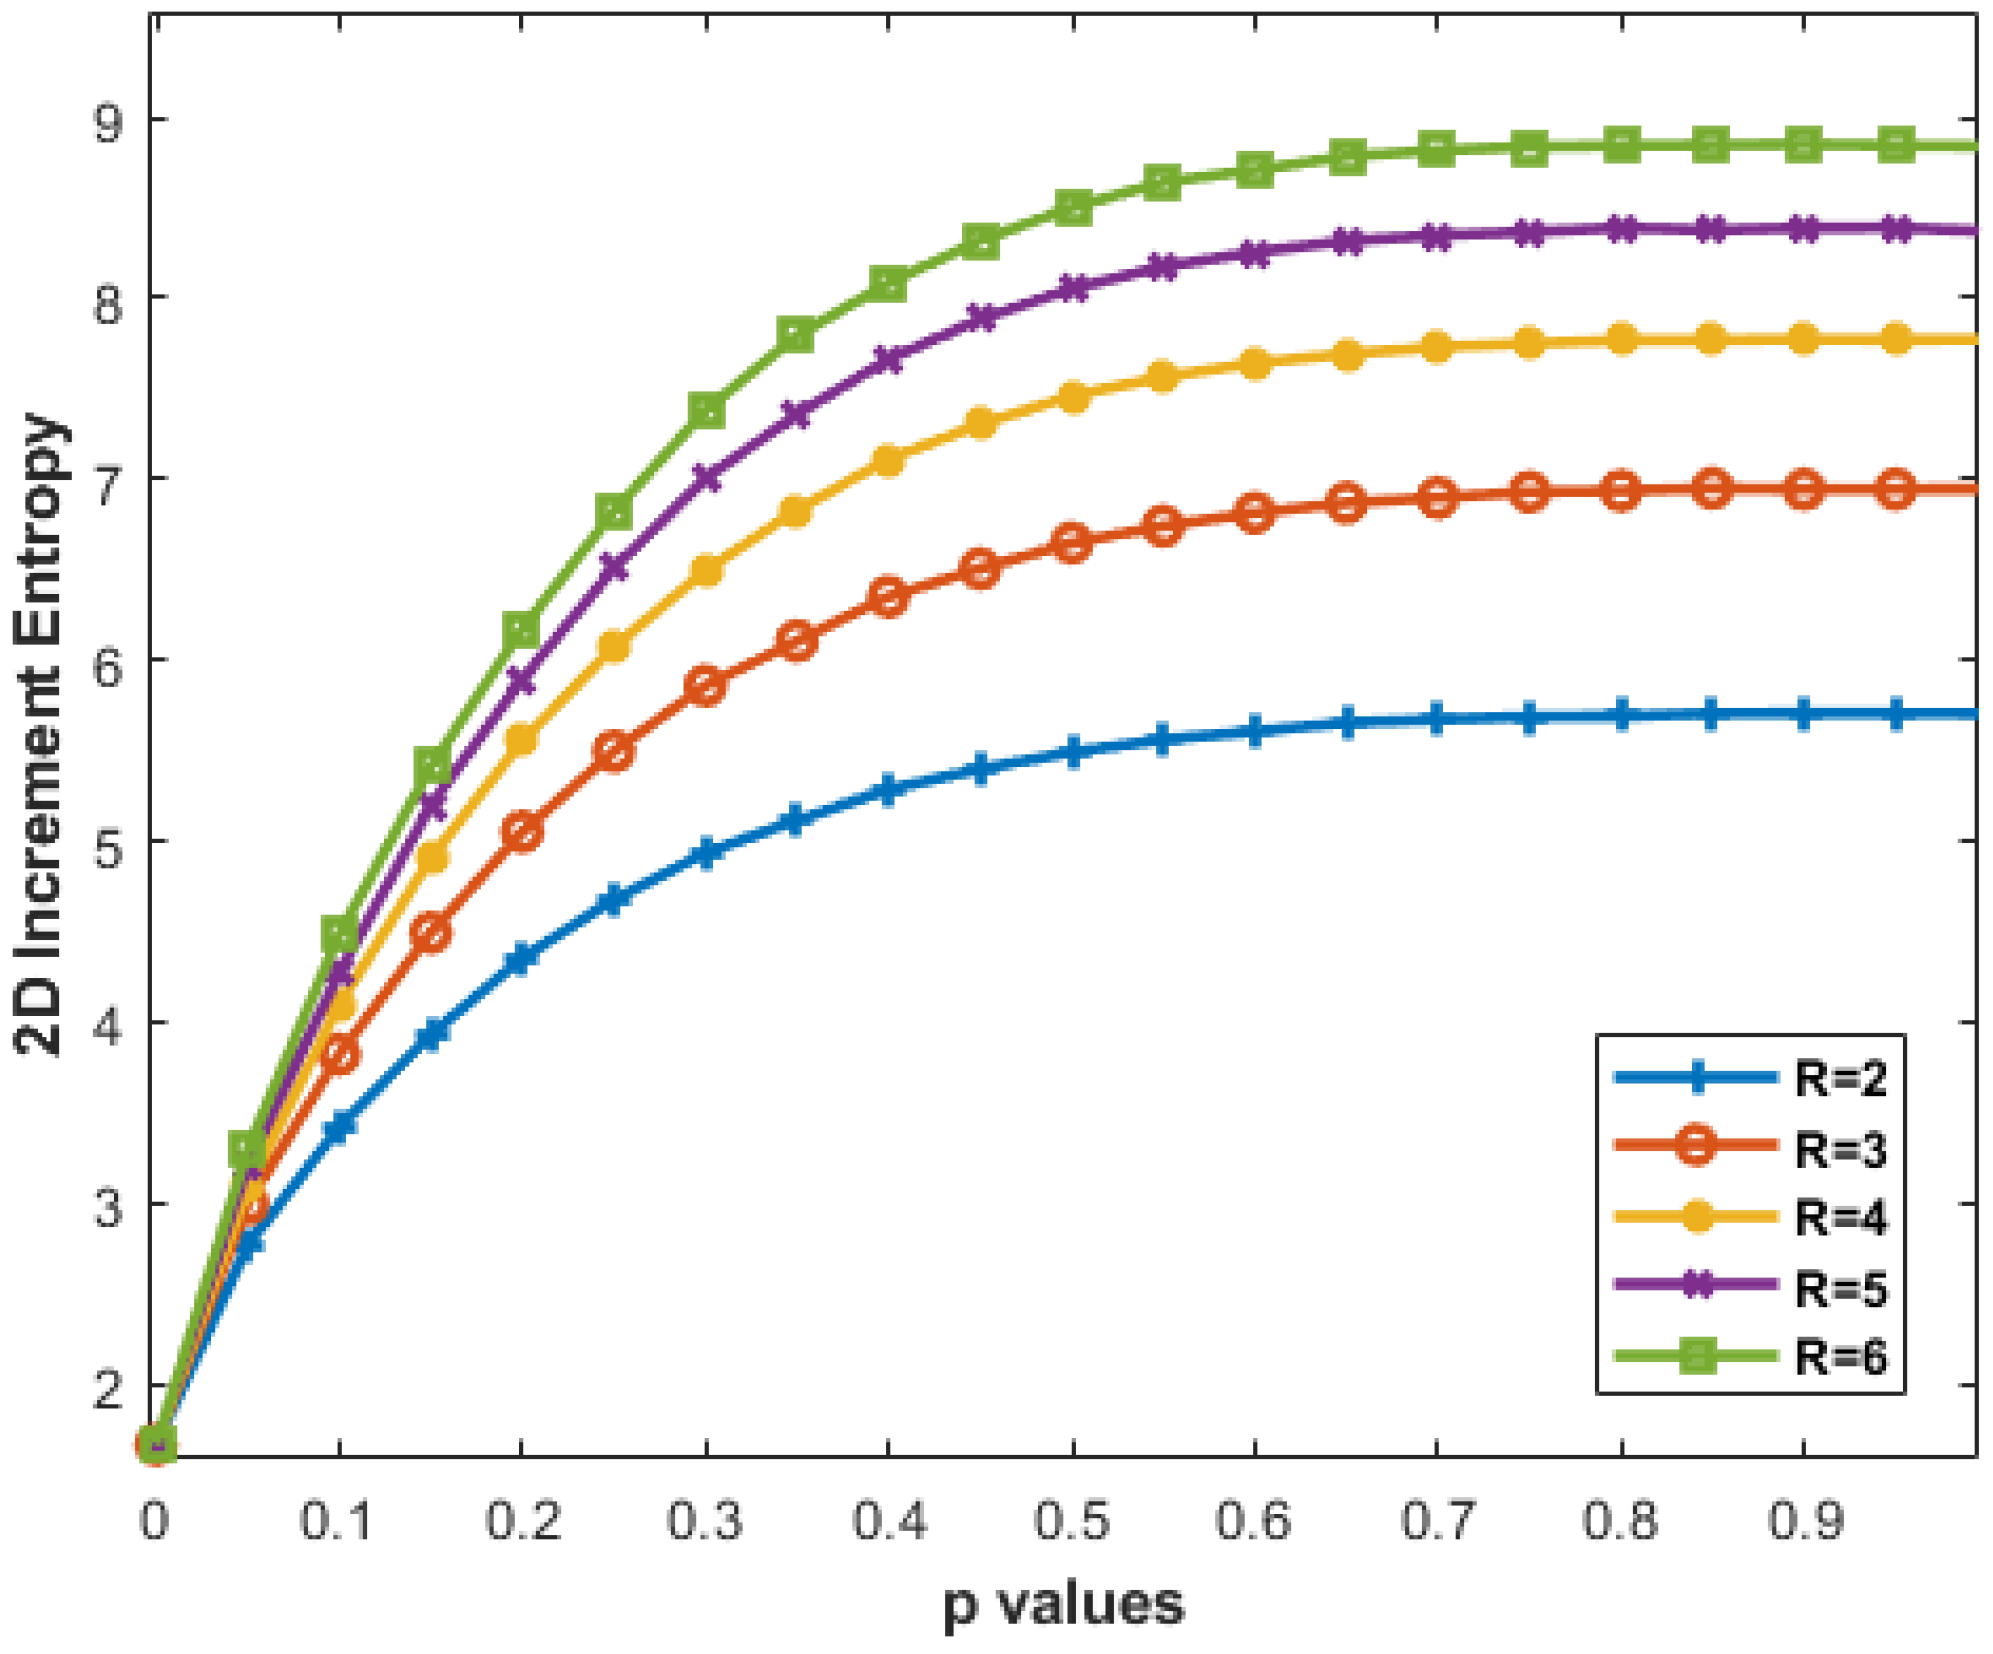
3.1. Two-Dimensional MIX Process (MIX2D(p))
3.2. Artificial Periodic and Synthesized Texture Images
3.3. Image with Additive Noise
3.4. Effect of Different Standard Deviation Computations on IncrEn2D
3.5. Effect of Row-Wise and Column-Wise Increment Images
3.6. Kylberg Real Texture Dataset
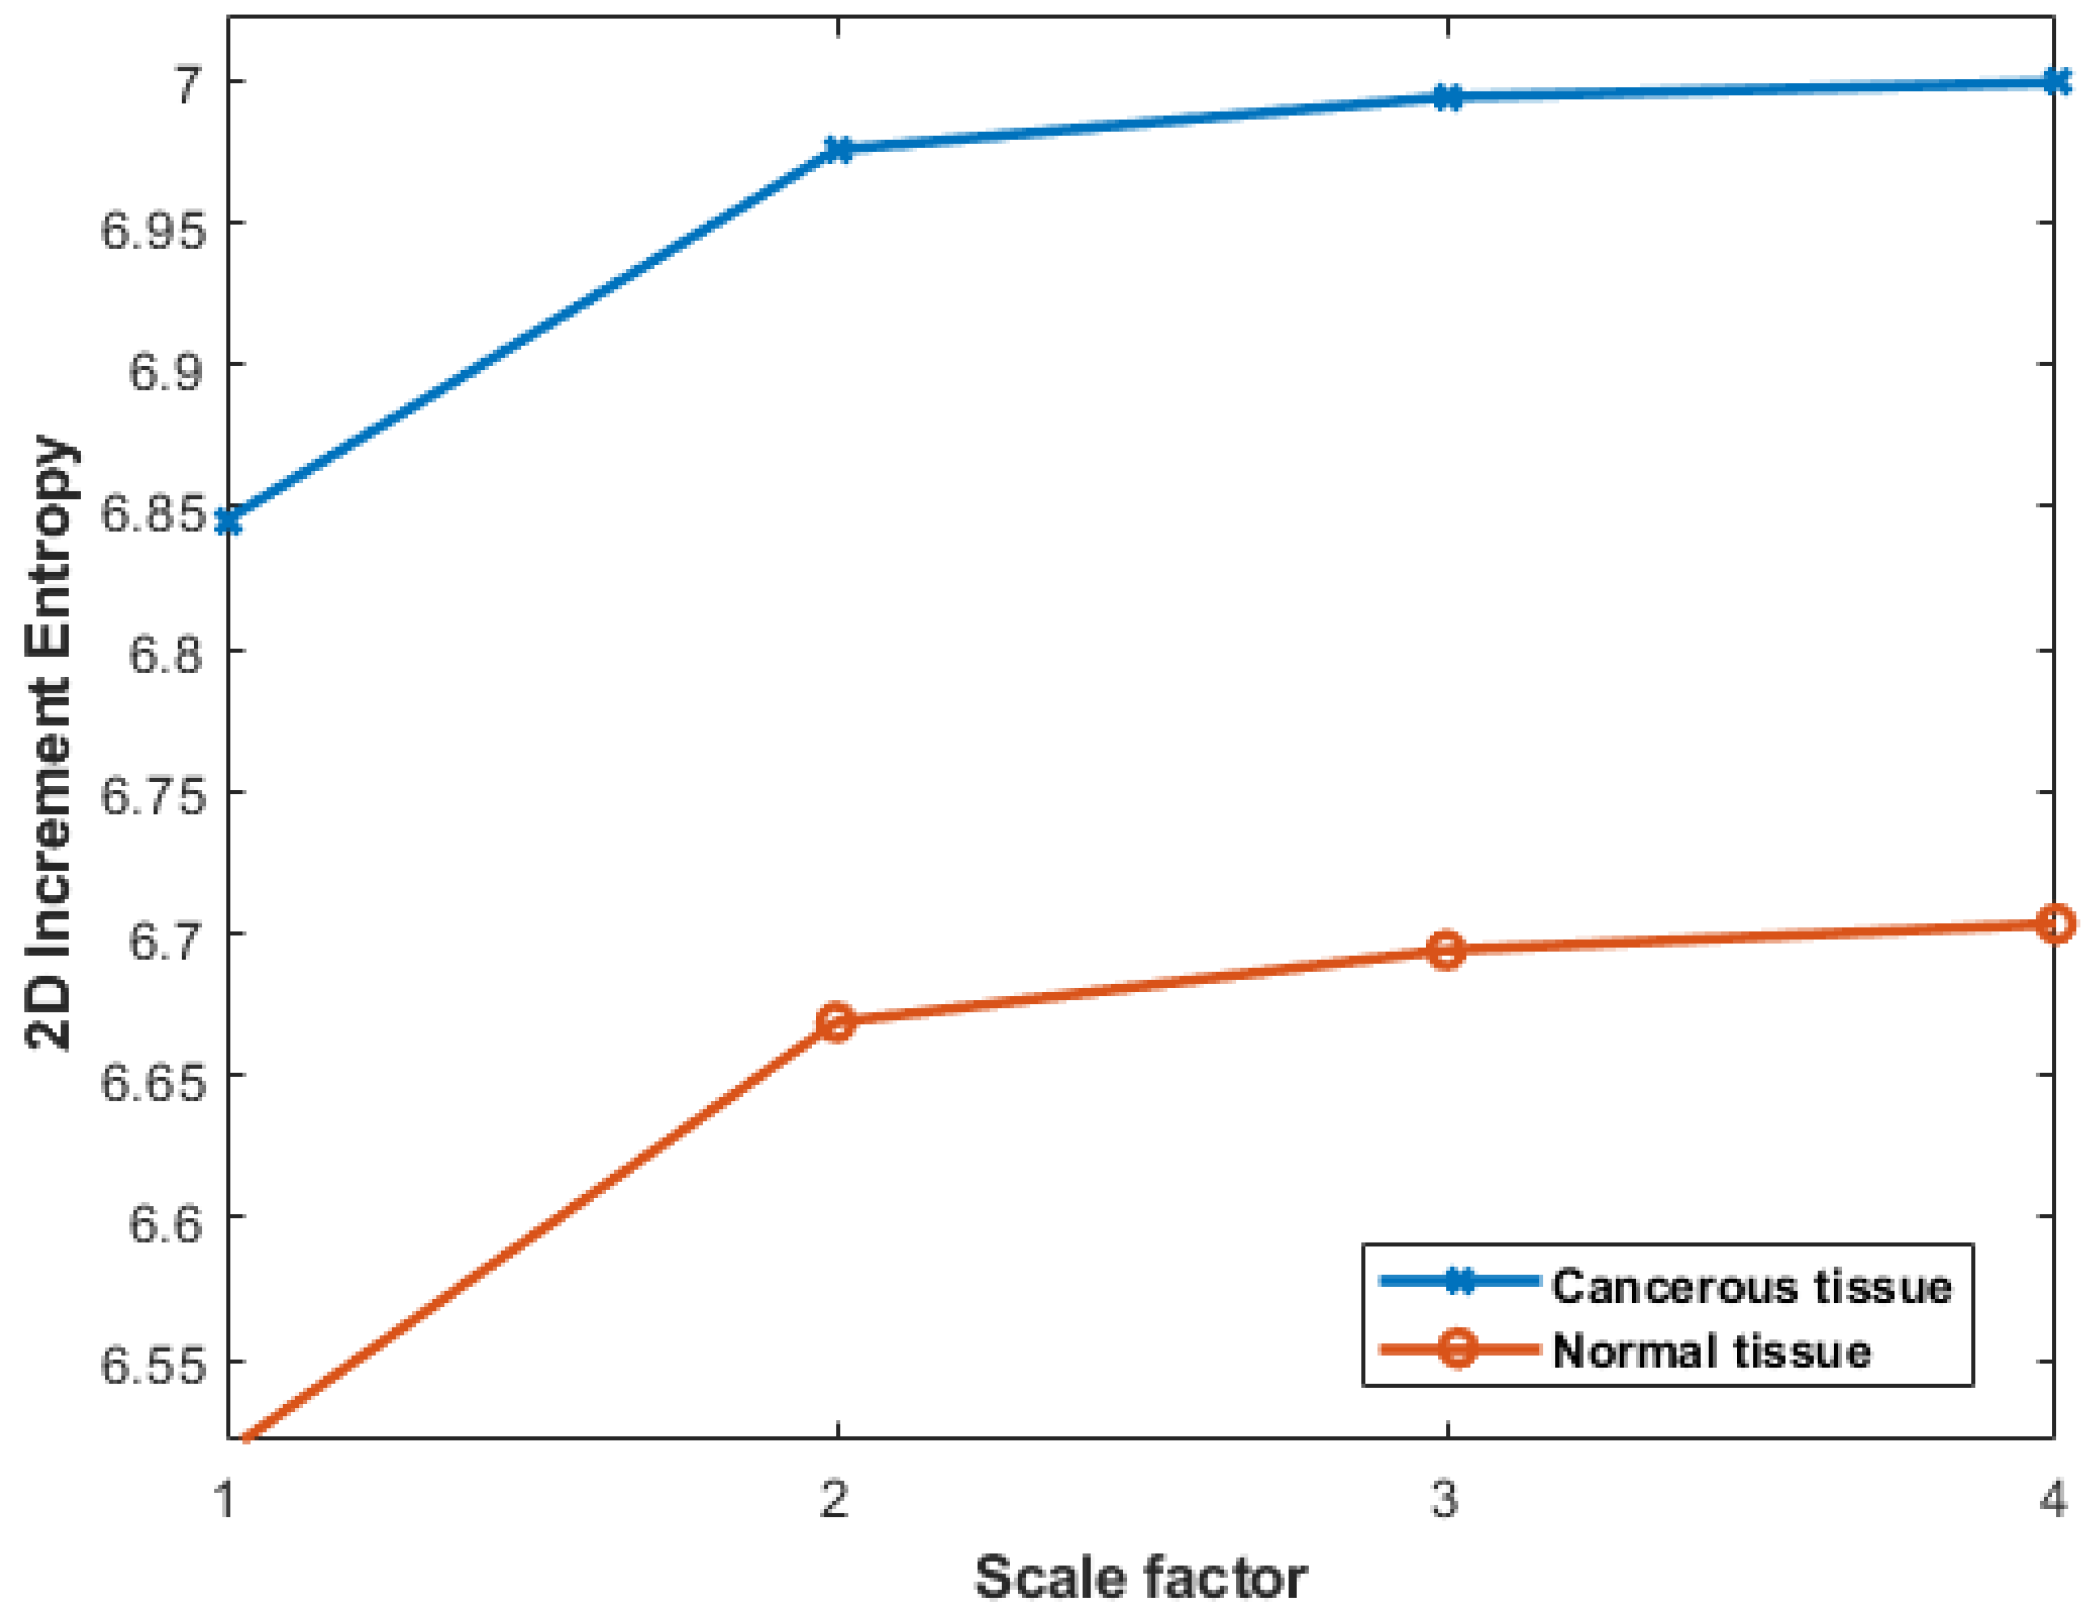
3.7. Colon Cancer Dataset
3.8. Computational Time
4. Discussion
5. Conclusions
Author Contributions
Funding
Institutional Review Board Statement
Data Availability Statement
Conflicts of Interest
References
- Shannon, C.E.; Weaver, W. A Mathematical Model of Communication; University of Illinois Press: Urbana, IL, USA, 1949; Volume 11, pp. 11–20. [Google Scholar] [CrossRef]
- Boaretto, B.R.R.; Budzinski, R.C.; Rossi, K.L.; Masoller, C.; Macau, E.E.N. Spatial permutation entropy distinguishes resting brain states. Chaos Solitons Fractals 2023, 171, 113453. [Google Scholar] [CrossRef]
- Deng, Z.; Li, T.; Deng, D.; Liu, K.; Zhang, P.; Zhang, S.; Luo, Z. Feature selection for label distribution learning using dual-similarity based neighborhood fuzzy entropy. Inf. Sci. 2022, 615, 385–404. [Google Scholar] [CrossRef]
- Xu, W.; Jiang, L.; Li, C. Improving data and model quality in crowdsourcing using cross-entropy-based noise correction. Inf. Sci. 2021, 546, 803–814. [Google Scholar] [CrossRef]
- Pincus, S.M. Approximate entropy as a measure of system complexity. Proc. Natl. Acad. Sci. USA 1991, 88, 2297–2301. [Google Scholar] [CrossRef]
- Richman, J.S.; Moorman, J.R. Physiological time-series analysis using approximate entropy and sample entropy. Am. J.-Physiol.-Heart Circ. Physiol. 2000, 278, H2039–H2049. [Google Scholar] [CrossRef]
- Bandt, C.; Pompe, B. Permutation entropy: A natural complexity measure for time series. Phys. Rev. Lett. 2002, 88, 174102. [Google Scholar] [CrossRef]
- Li, P.; Liu, C.; Li, K.; Zheng, D.; Liu, C.; Hou, Y. Assessing the complexity of short-term heartbeat interval series by distribution entropy. Med Biol. Eng. Comput. 2015, 53, 77–87. [Google Scholar] [CrossRef]
- Rostaghi, M.; Azami, H. Dispersion entropy: A measure for time-series analysis. IEEE Signal Process. Lett. 2016, 23, 610–614. [Google Scholar] [CrossRef]
- Liu, X.; Jiang, A.; Xu, N.; Xue, J. Increment entropy as a measure of complexity for time series. Entropy 2016, 18, 22. [Google Scholar] [CrossRef]
- Li, Y.; Tang, B.; Jiao, S.; Zhou, Y. Optimized multivariate multiscale slope entropy for nonlinear dynamic analysis of mechanical signals. Chaos Solitons Fractals 2024, 179, 114436. [Google Scholar] [CrossRef]
- Xiao-Feng, L.; Yue, W. Fine-grained permutation entropy as a measure of natural complexity for time series. Chin. Phys. B 2009, 18, 2690. [Google Scholar] [CrossRef]
- Wang, D.; Jin, N. Multivariate multiscale increment entropy: A complexity measure for detecting flow pattern transition in multiphase flows. Nonlinear Dyn. 2020, 100, 3853–3865. [Google Scholar] [CrossRef]
- Fabila-Carrasco, J.S.; Tan, C.; Escudero, J. Permutation entropy for graph signals. IEEE Trans. Signal Inf. Process. Netw. 2022, 8, 288–300. [Google Scholar] [CrossRef]
- Fabila-Carrasco, J.S.; Tan, C.; Escudero, J. Dispersion entropy for graph signals. Chaos Solitons Fractals 2023, 175, 113977. [Google Scholar] [CrossRef]
- Morel, C.; Humeau-Heurtier, A. Multiscale permutation entropy for two-dimensional patterns. Pattern Recognit. Lett. 2021, 150, 139–146. [Google Scholar] [CrossRef]
- Hilal, M.; Berthin, C.; Martin, L.; Azami, H.; Humeau-Heurtier, A. Bidimensional multiscale fuzzy entropy and its application to pseudoxanthoma elasticum. IEEE Trans. Biomed. Eng. 2019, 67, 2015–2022. [Google Scholar] [CrossRef]
- Gaudêncio, A.S.; Hilal, M.; Cardoso, J.M.; Humeau-Heurtier, A.; Vaz, P.G. Texture analysis using two-dimensional permutation entropy and amplitude-aware permutation entropy. Pattern Recognit. Lett. 2022, 159, 150–156. [Google Scholar] [CrossRef]
- Azami, H.; da Silva, L.E.V.; Omoto, A.C.M.; Humeau-Heurtier, A. Two-dimensional dispersion entropy: An information-theoretic method for irregularity analysis of images. Signal Process. Image Commun. 2019, 75, 178–187. [Google Scholar] [CrossRef]
- Espinosa, R.; Bailón, R.; Laguna, P. Two-dimensional EspEn: A new approach to analyze image texture by irregularity. Entropy 2021, 23, 1261. [Google Scholar] [CrossRef]
- Zheng, J.; Ying, W.; Tong, J.; Li, Y. Multiscale three-dimensional Holo–Hilbert spectral entropy: A novel complexity-based early fault feature representation method for rotating machinery. Nonlinear Dyn. 2023, 111, 10309–10330. [Google Scholar] [CrossRef]
- Ghalati, M.K.; Nunes, A.; Ferreira, H.; Serranho, P.; Bernardes, R. Texture analysis and its applications in biomedical imaging: A survey. IEEE Rev. Biomed. Eng. 2021, 15, 222–246. [Google Scholar] [CrossRef]
- Versaci, M.; Morabito, F.C. Image edge detection: A new approach based on fuzzy entropy and fuzzy divergence. Int. J. Fuzzy Syst. 2021, 23, 918–936. [Google Scholar] [CrossRef]
- Espinosa, M.; Ricardo, A. EspEn Graph for the Spatial Analysis of Entropy in Images. Entropy 2023, 25, 159. [Google Scholar] [CrossRef]
- Silva, L.E.V.; Senra Filho, A.C.S.; Fazan, V.P.S.; Felipe, J.C.; Junior, L.M. Two-dimensional sample entropy: Assessing image texture through irregularity. Biomed. Phys. Eng. Express 2016, 2, 045002. [Google Scholar] [CrossRef]
- Wang, X.; Liu, X.; Pang, W.; Jiang, A. Multiscale increment entropy: An approach for quantifying the physiological complexity of biomedical time series. Inf. Sci. 2022, 586, 279–293. [Google Scholar] [CrossRef]
- Simoncelli, E. Texture Synthesis: Misc Textures. 2023. Available online: https://graphics.stanford.edu/projects/texture/demo/synthesis_eero.html (accessed on 15 July 2023).
- Kylberg, G. The Kylberg Texture Dataset v. 1.0. External Report (Blue Series) 35, Centre for Image Analysis; Swedish University of Agricultural Sciences and Uppsala University: Uppsala, Sweden, 2011. [Google Scholar]
- Masud, M.; Sikder, N.; Nahid, A.; Bairagi, A.K.; AlZain, M.A. A machine learning approach to diagnosing lung and colon cancer using a deep learning-based classification framework. Sensors 2021, 21, 748. [Google Scholar] [CrossRef]
- Borkowski, A.A.; Bui, M.M.; Thomas, L.B.; Wilson, C.P.; DeLand, L.A.; Mastorides, S.M. Lung and colon cancer histopathological image dataset (lc25000). arXiv 2019, arXiv:1912.12142. [Google Scholar] [CrossRef]


| Texture a | Texture b | Texture c | Texture d |
| 3.6085 | 0.8242 | 3.2130 | 1.6720 |
| Synthesized a | Synthesized b | Synthesized c | Synthesized d |
| 3.8193 | 1.1930 | 4.0133 | 3.0262 |
| Type of Noise | Noise Level Addded | IncrEn2D |
|---|---|---|
| WGN2D | mean = 0, variance = 0.01 | 6.7972 |
| WGN2D | mean = 0, variance = 0.03 | 6.8522 |
| WGN2D | mean = 0, variance = 0.05 | 6.9075 |
| WGN2D | mean = 0, variance = 0.07 | 6.9304 |
| SPN2D | noise density = 0.01 | 2.3120 |
| SPN2D | noise density = 0.05 | 2.6380 |
| SPN2D | noise density = 0.09 | 2.9342 |
| Vertical Stripe Images | Horizontal Stripe Images | ||||
|---|---|---|---|---|---|
| Texture Image | Row-Wise Increment Image | Column-Wise Increment Image | Texture Image | Row-Wise Increment Image | Column-Wise Increment Image |
| Pattern 1 | 0 | 0.3537 | Pattern 1 | 0.2197 | 0 |
| Pattern 2 | 0 | 0.3537 | Pattern 2 | 0.2558 | 0 |
| Pattern 3 | 0 | 0.1836 | Pattern 3 | 0.3537 | 0 |
| Pattern 4 | 0 | 0.1836 | Pattern 4 | 0.1432 | 0 |
| Pattern 5 | 0 | 0.2558 | Pattern 5 | 0.3224 | 0 |
| Pattern 6 | 0 | 0.3224 | Pattern 6 | 0.3537 | 0 |
| Pattern 7 | 0 | 0.3224 | Pattern 7 | 0.2892 | 0 |
| Pattern 8 | 0 | 0.2197 | Pattern 8 | 0.3224 | 0 |
| Pattern 9 | 0 | 0.2197 | Pattern 9 | 0.2892 | 0 |
| Pattern 10 | 0 | 0.3537 | Pattern 10 | 0.2892 | 0 |
| Cushion1 | Sand1 | Linseeds1 | Stone1 | Canvas1 | Seat2 | |
|---|---|---|---|---|---|---|
| IncrEn2D | 5.0148 | 6.3386 | 6.4282 | 6.6797 | 7.6083 | 7.7559 |
| SampEn2D | 2.2899 | 4.3193 | 2.2025 | 4.9939 | 8.0463 | 6.1602 |
| DispEn2D | 2.4051 | 2.975 | 2.599 | 2.969 | 3.6843 | 3.1331 |
| Multiscale | Multiscale | Multiscale | |
|---|---|---|---|
| IncrEn2D | SampEn2D | DispEn2D | |
| Accuracy | 77.22% | 59.31% | 47.62% |
| Precision | 78.64% | 62.68% | 47.41% |
| Sensitivity | 80.95% | 24.20% | 33.33% |
| Specificity | 37.80% | 62.20% | 34.00% |
| F1-score | 78.60% | 61.03% | 47.51% |
| Size (Pixels) | ||||
|---|---|---|---|---|
| IncrEn2D | 0.137 | 0.458 | 0.897 | 3.000 |
| SampEn2D | 0.562 | 2.733 | 15.760 | 58.914 |
| DispEn2D | 0.123 | 0.049 | 0.077 | 0.097 |
Disclaimer/Publisher’s Note: The statements, opinions and data contained in all publications are solely those of the individual author(s) and contributor(s) and not of MDPI and/or the editor(s). MDPI and/or the editor(s) disclaim responsibility for any injury to people or property resulting from any ideas, methods, instructions or products referred to in the content. |
© 2025 by the authors. Licensee MDPI, Basel, Switzerland. This article is an open access article distributed under the terms and conditions of the Creative Commons Attribution (CC BY) license (https://creativecommons.org/licenses/by/4.0/).
Share and Cite
Abid, M.; Hitam, M.S.; Ali, R.; Azami, H.; Humeau-Heurtier, A. Bidimensional Increment Entropy for Texture Analysis: Theoretical Validation and Application to Colon Cancer Images. Entropy 2025, 27, 80. https://doi.org/10.3390/e27010080
Abid M, Hitam MS, Ali R, Azami H, Humeau-Heurtier A. Bidimensional Increment Entropy for Texture Analysis: Theoretical Validation and Application to Colon Cancer Images. Entropy. 2025; 27(1):80. https://doi.org/10.3390/e27010080
Chicago/Turabian StyleAbid, Muqaddas, Muhammad Suzuri Hitam, Rozniza Ali, Hamed Azami, and Anne Humeau-Heurtier. 2025. "Bidimensional Increment Entropy for Texture Analysis: Theoretical Validation and Application to Colon Cancer Images" Entropy 27, no. 1: 80. https://doi.org/10.3390/e27010080
APA StyleAbid, M., Hitam, M. S., Ali, R., Azami, H., & Humeau-Heurtier, A. (2025). Bidimensional Increment Entropy for Texture Analysis: Theoretical Validation and Application to Colon Cancer Images. Entropy, 27(1), 80. https://doi.org/10.3390/e27010080