
Prediction of Heat Transfer and Fluid Flow Effects on Entropy Generation in a Monolithic Catalytic Converter Using Large-Eddy Simulation

 , , and
Abstract
:1. Introduction
2. Large-Eddy Simulation
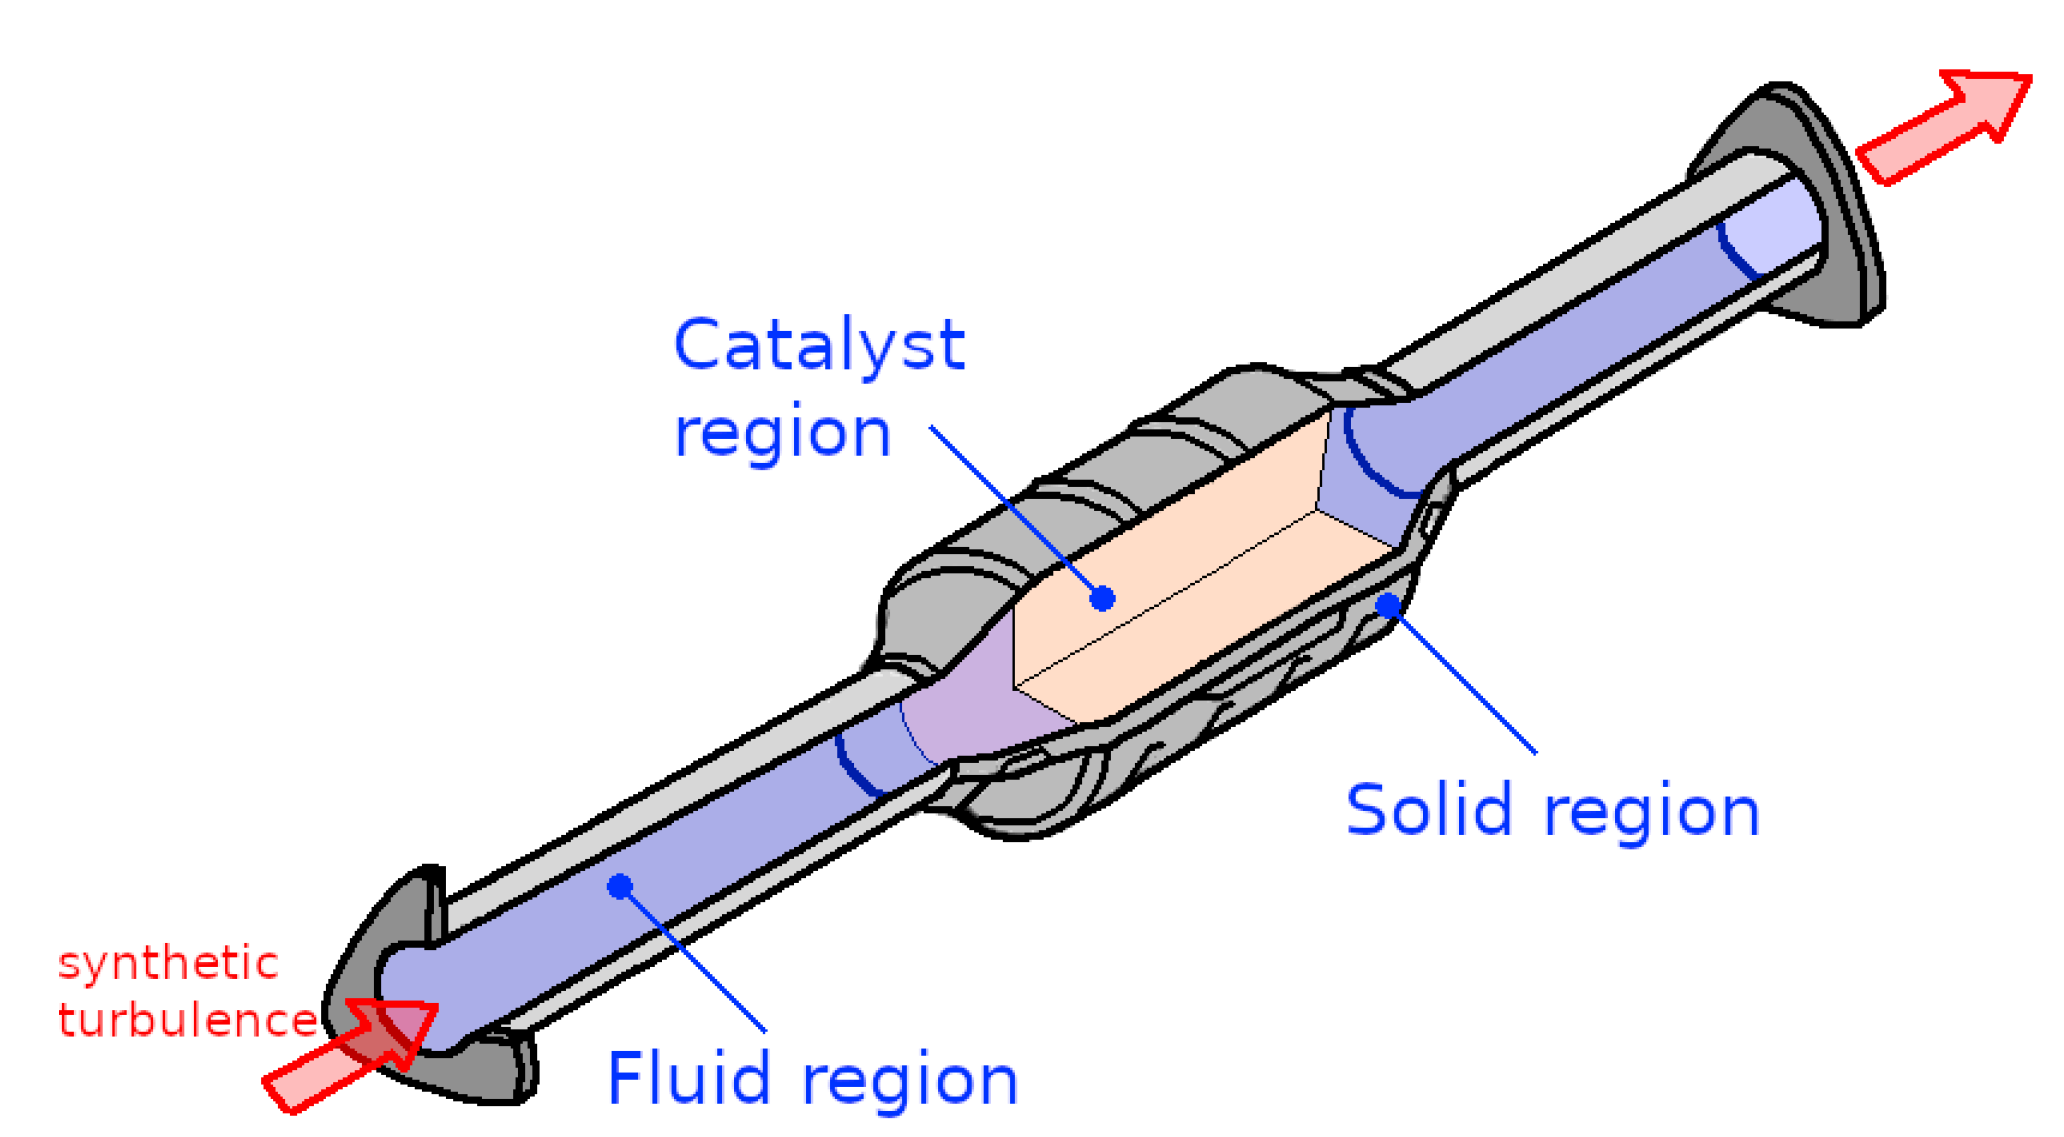
3. Test Case: The Catalytic Converter
3.1. Experimental Setup
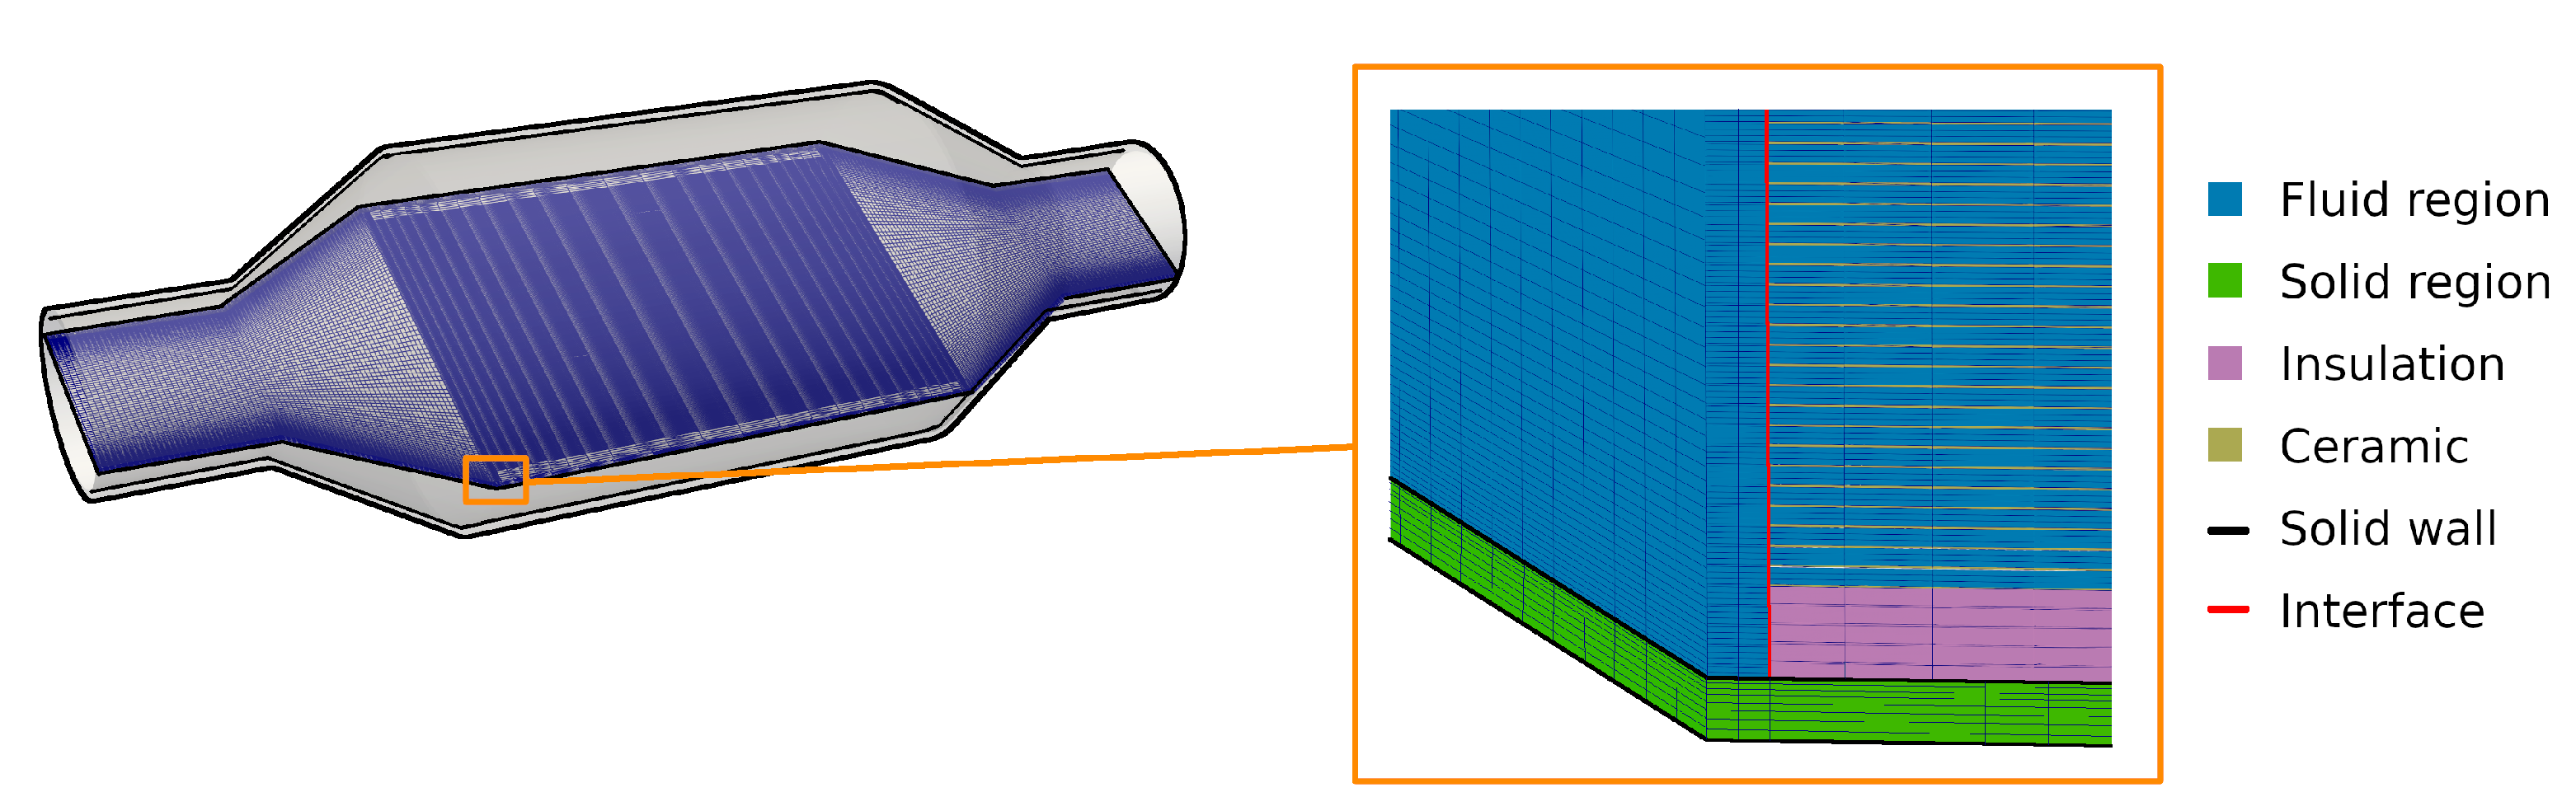
3.2. Numerical Setup
4. Results and Discussion
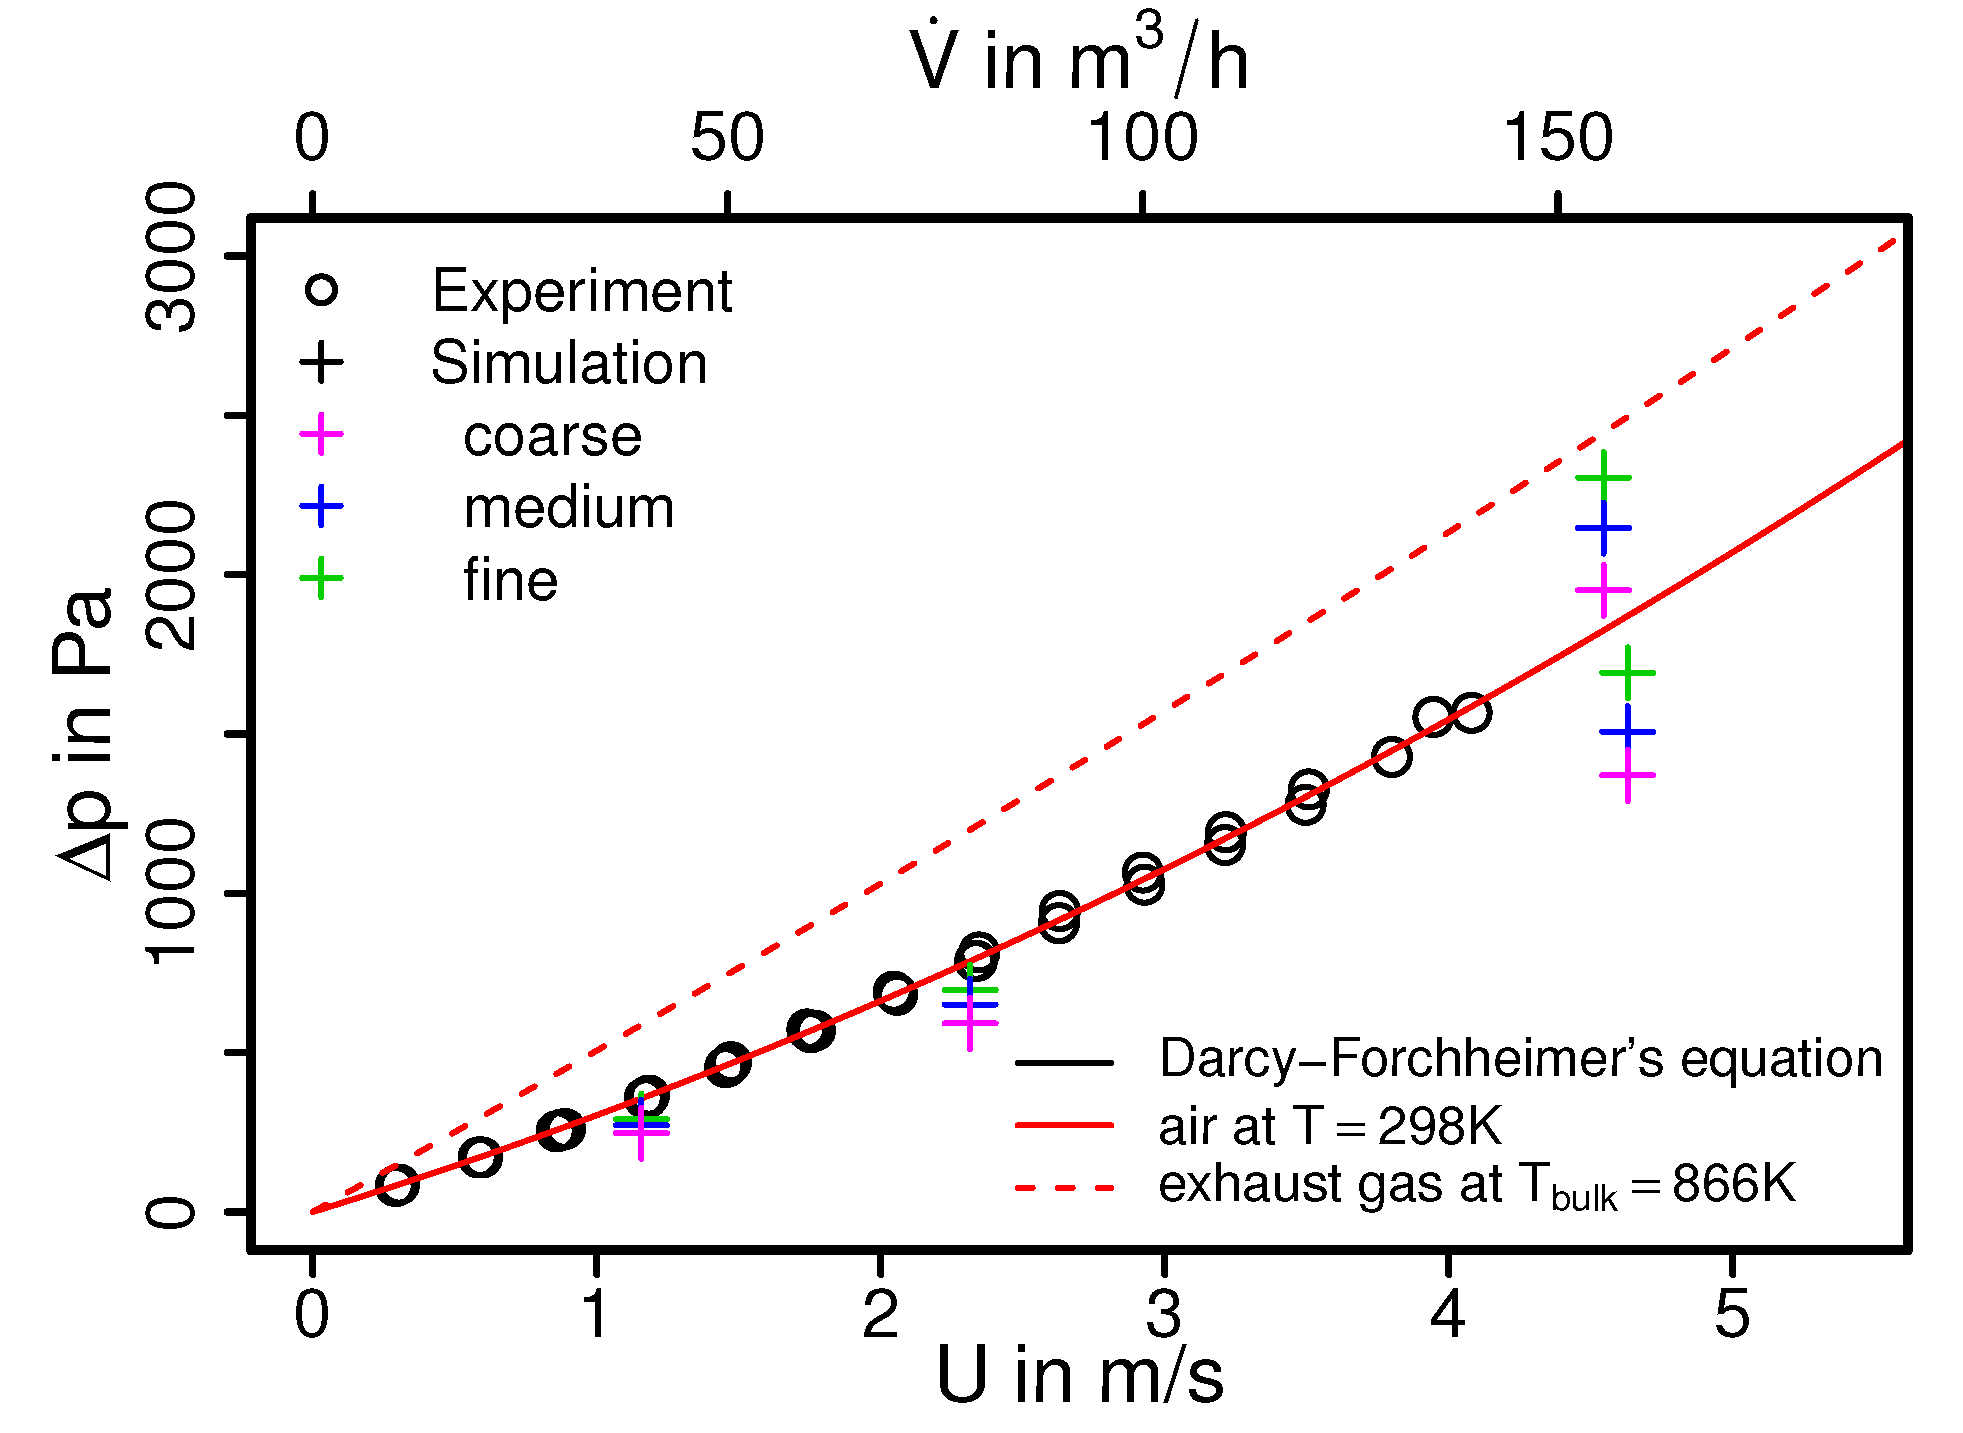
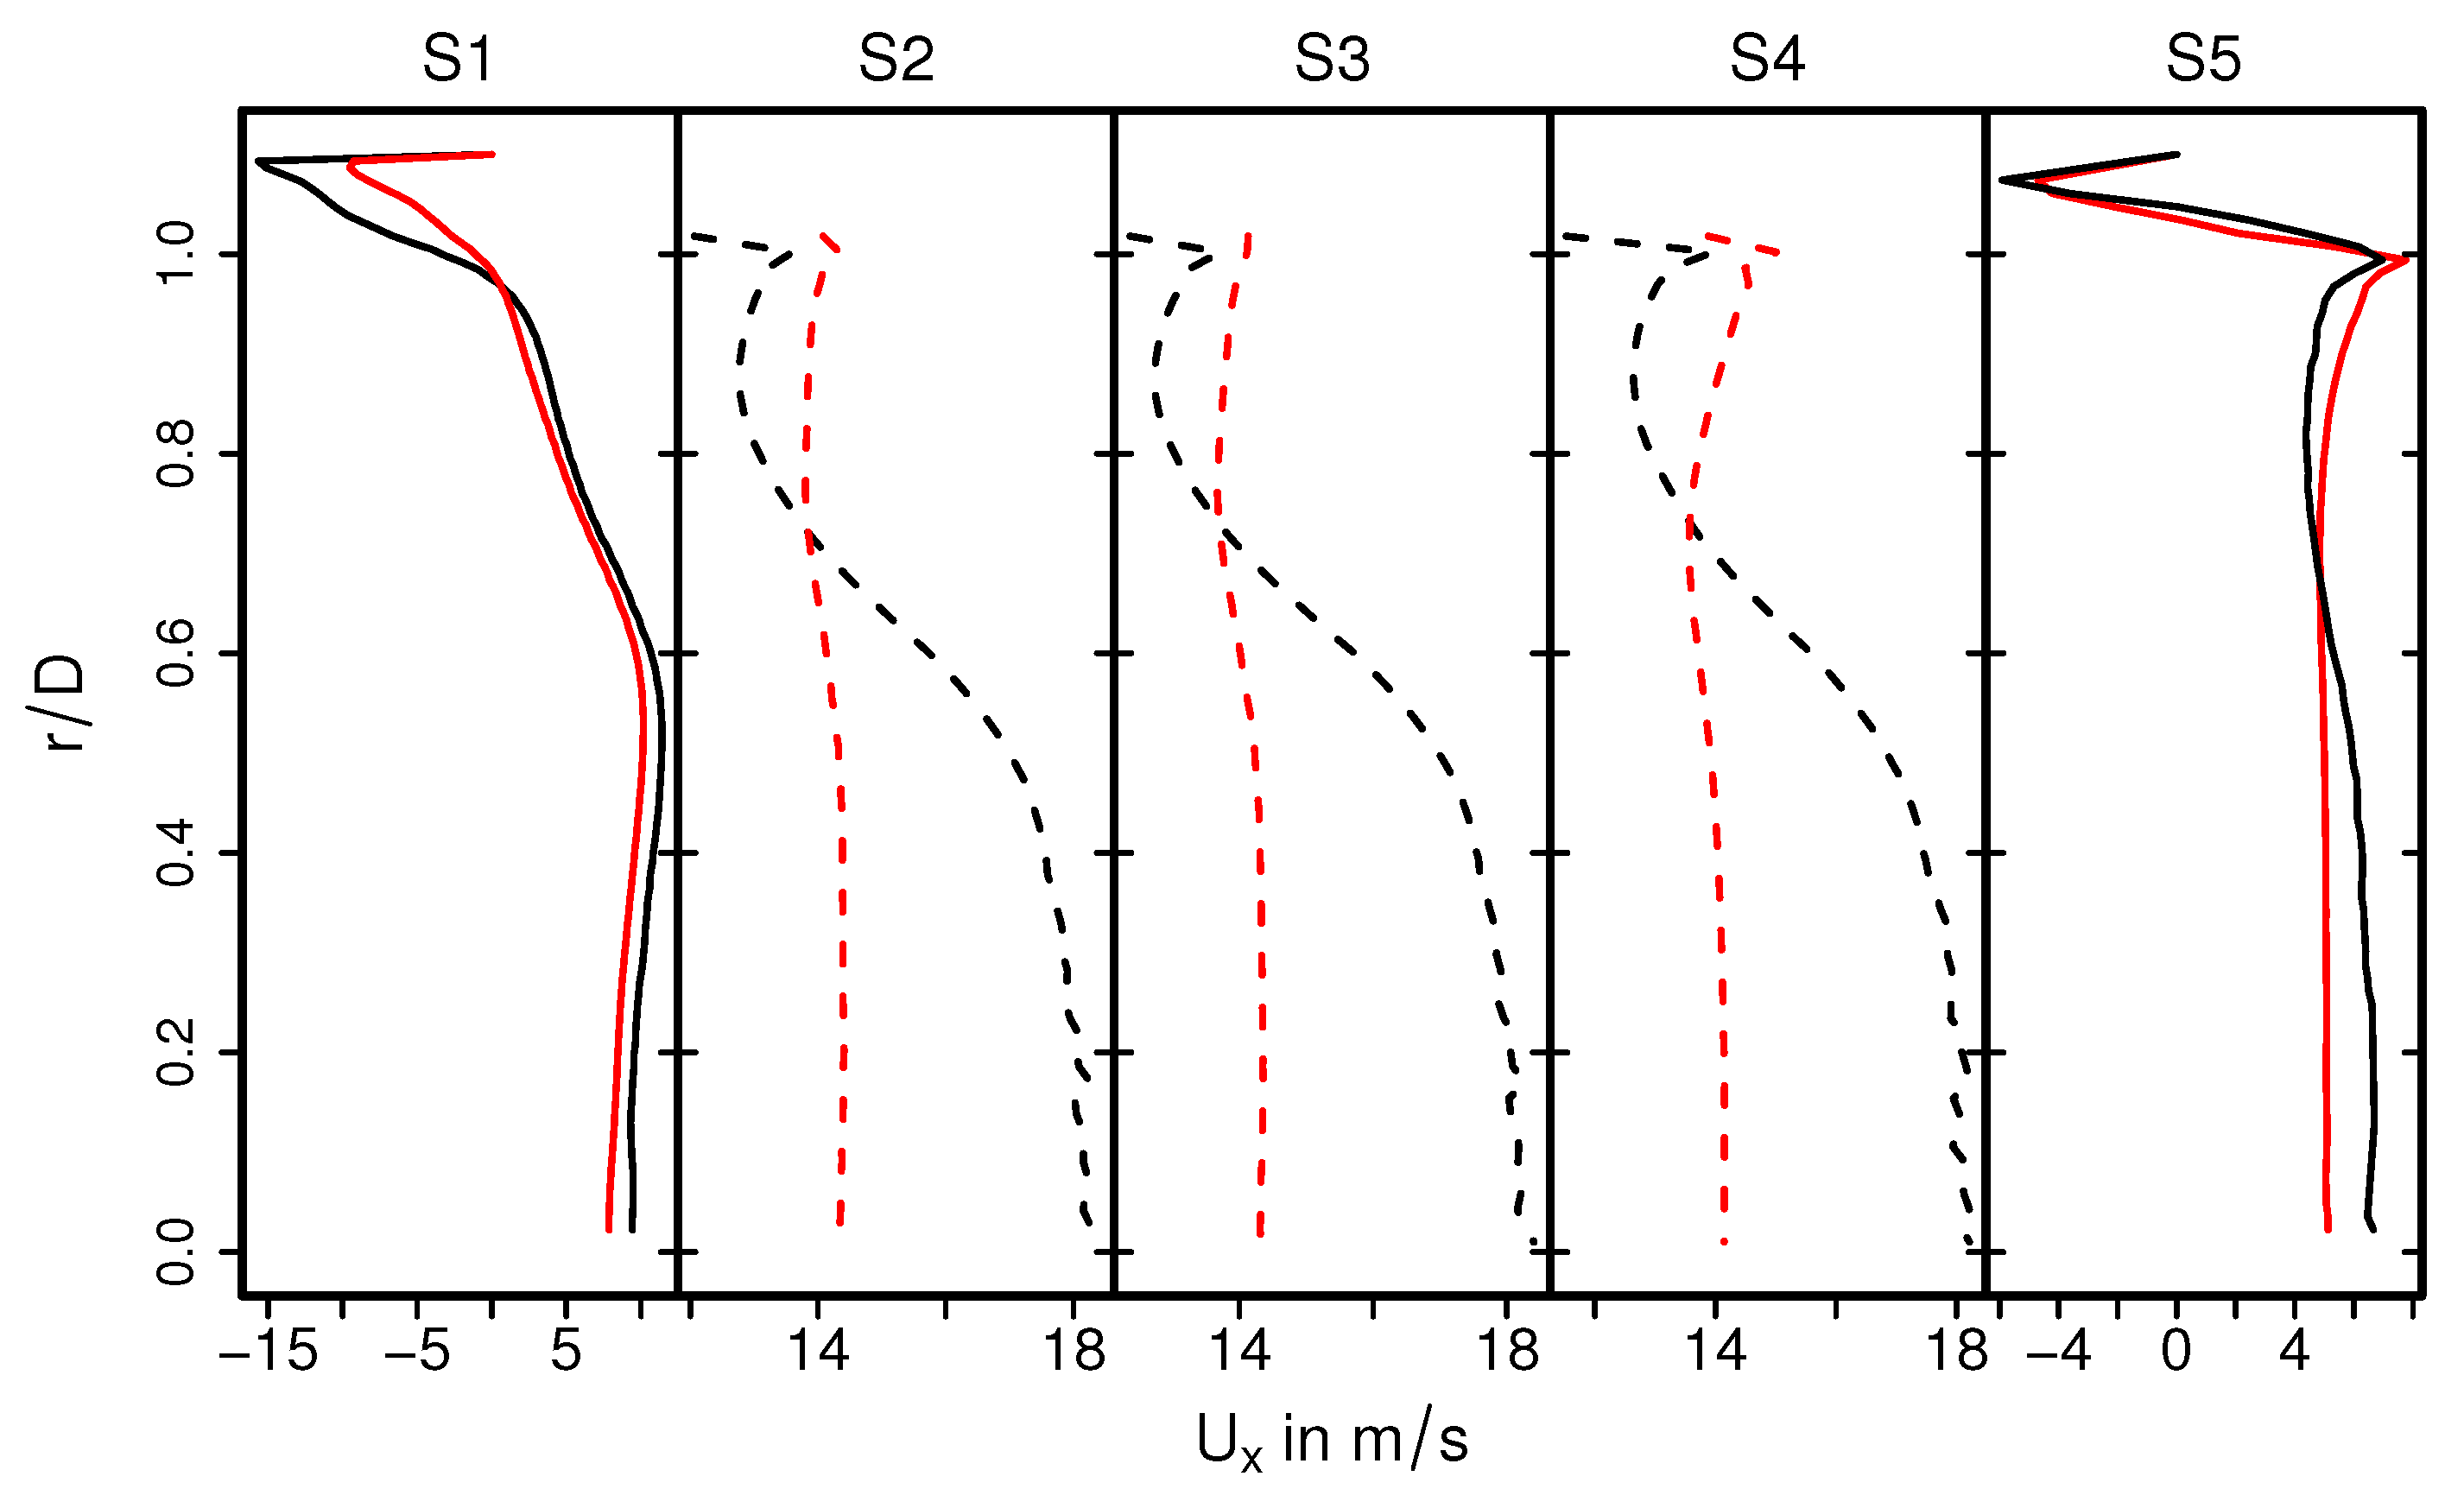
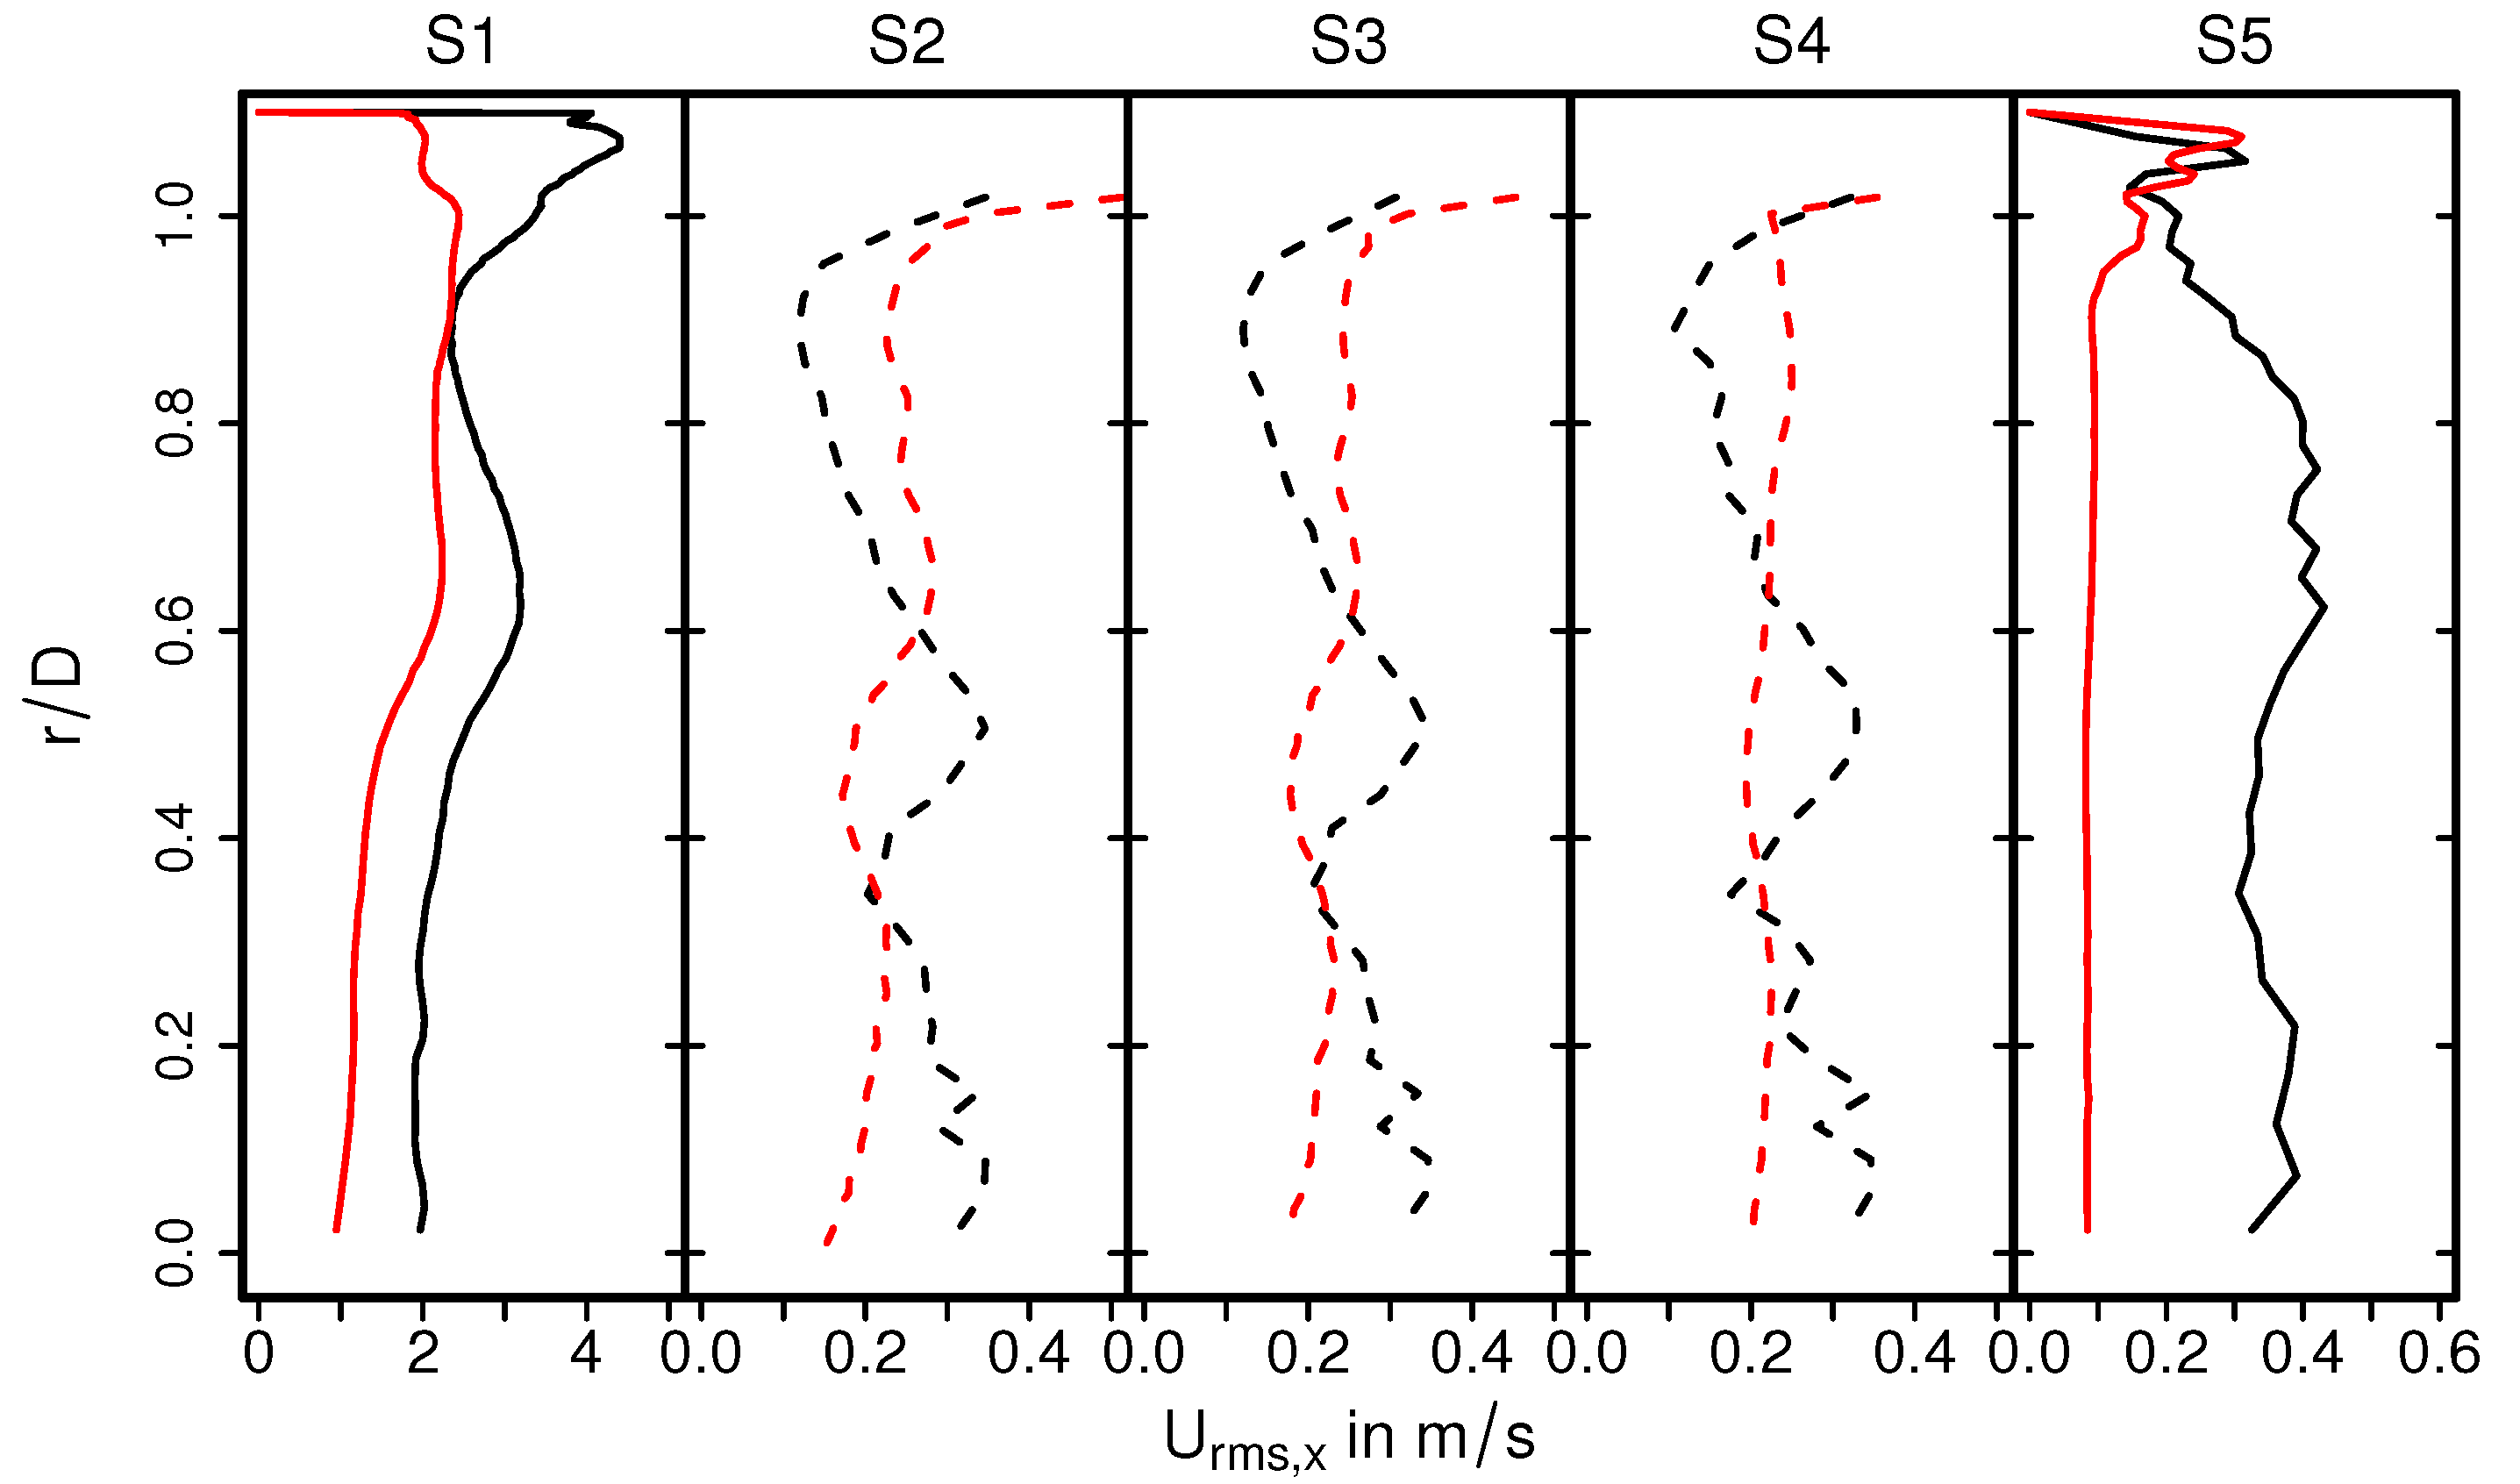
4.1. Comparison with Experimental Data (Case 1–12)
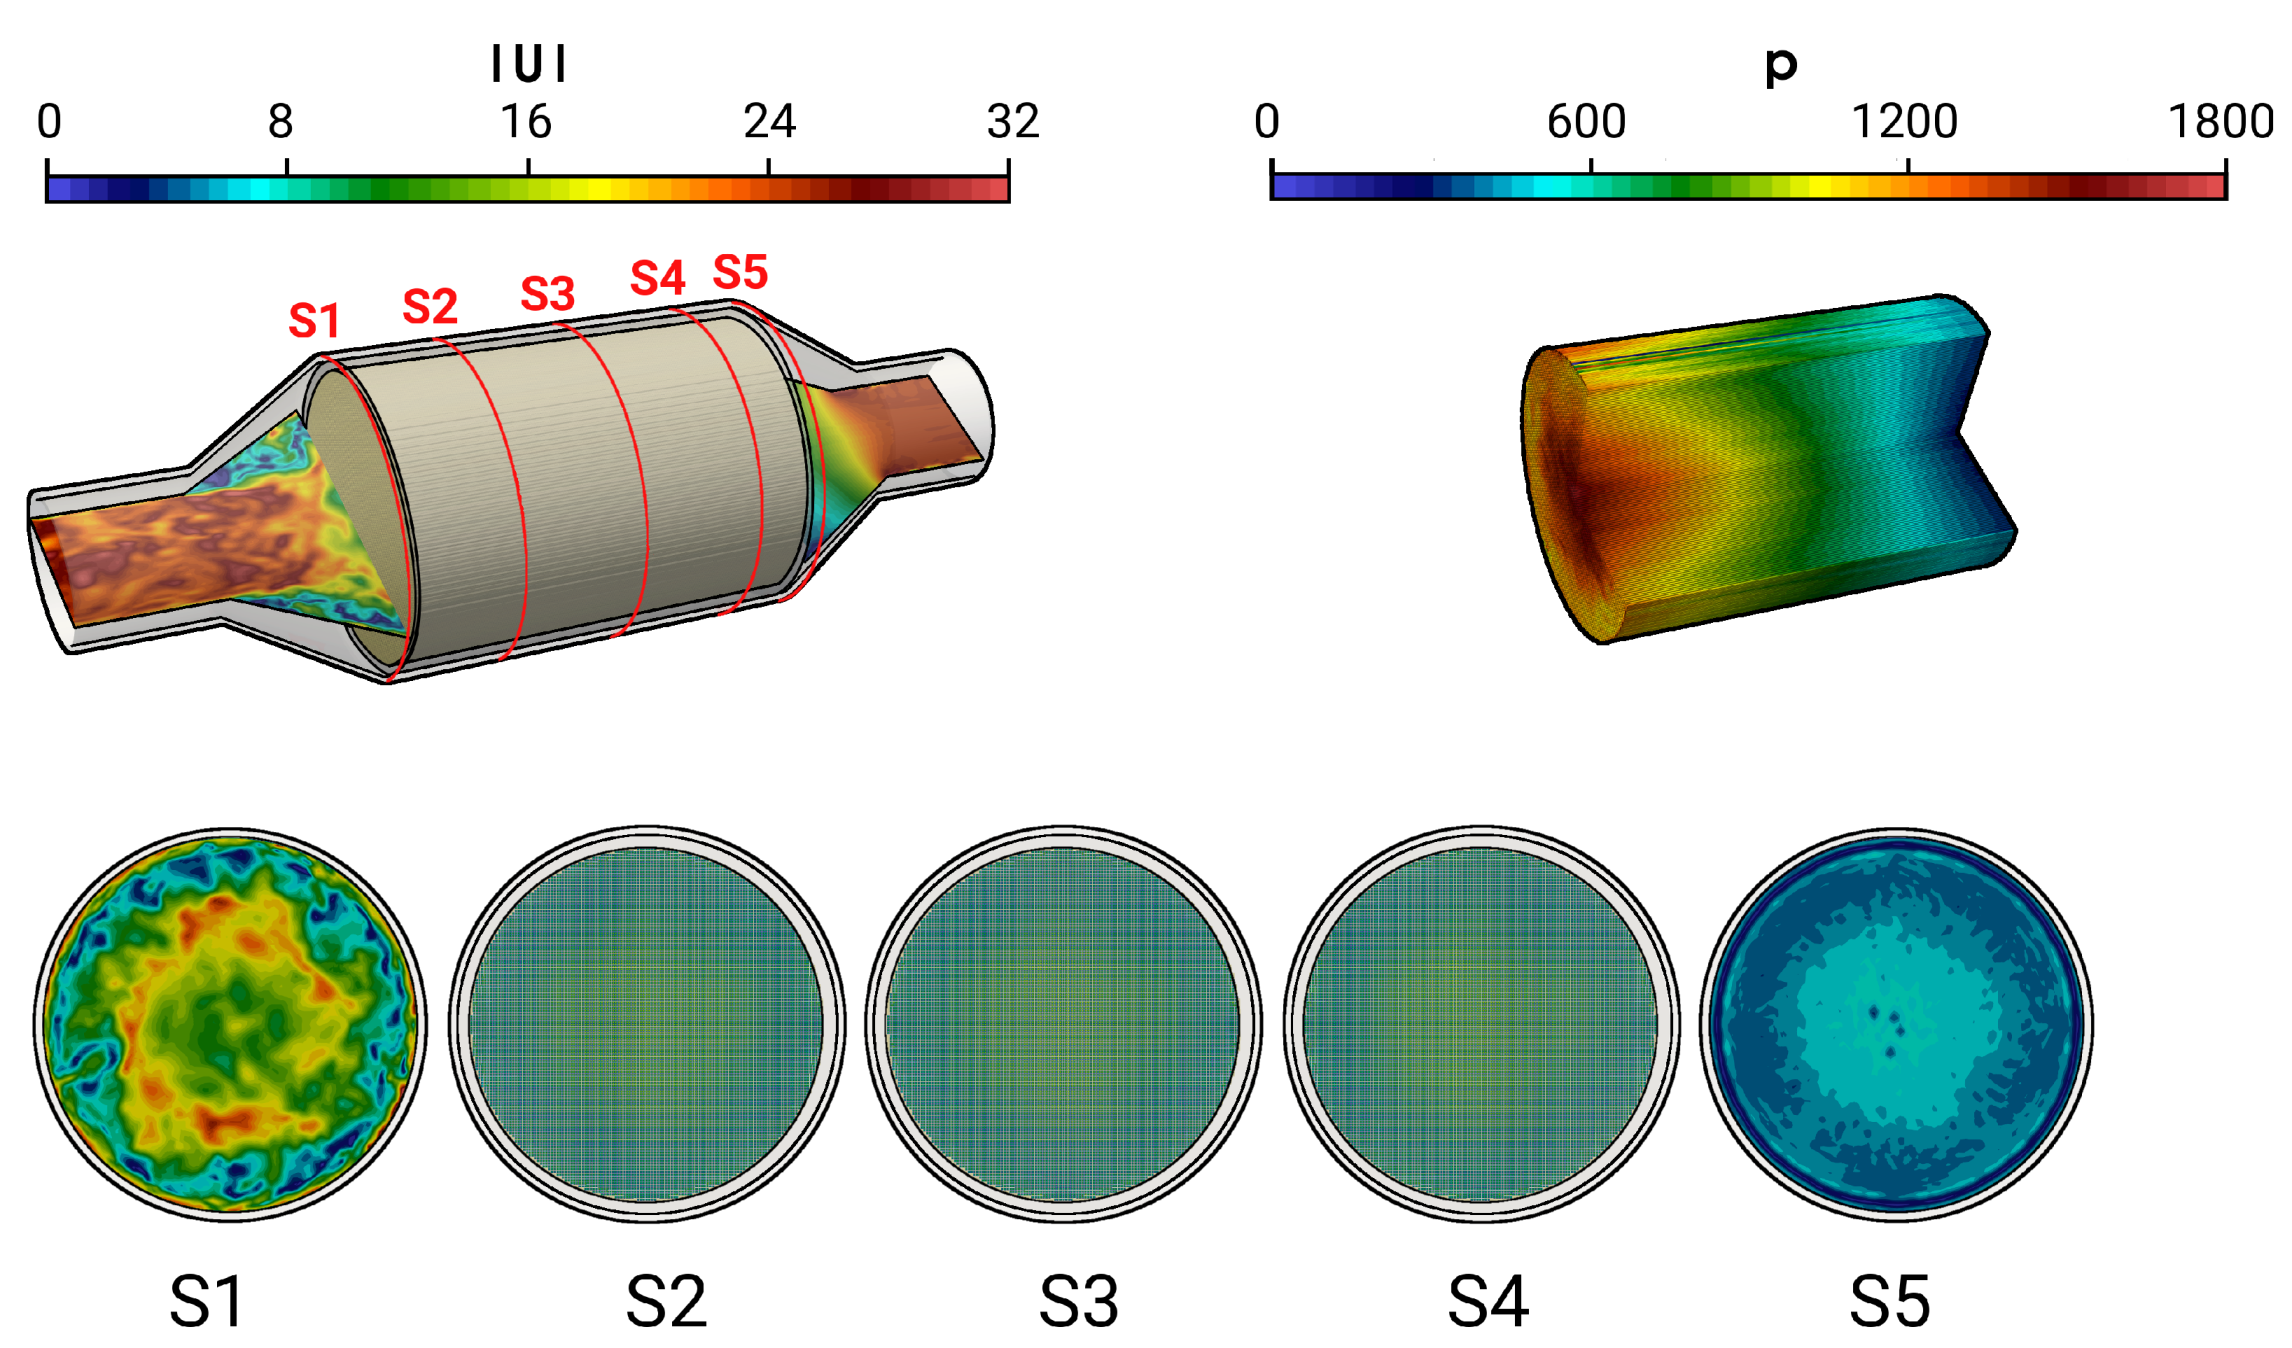
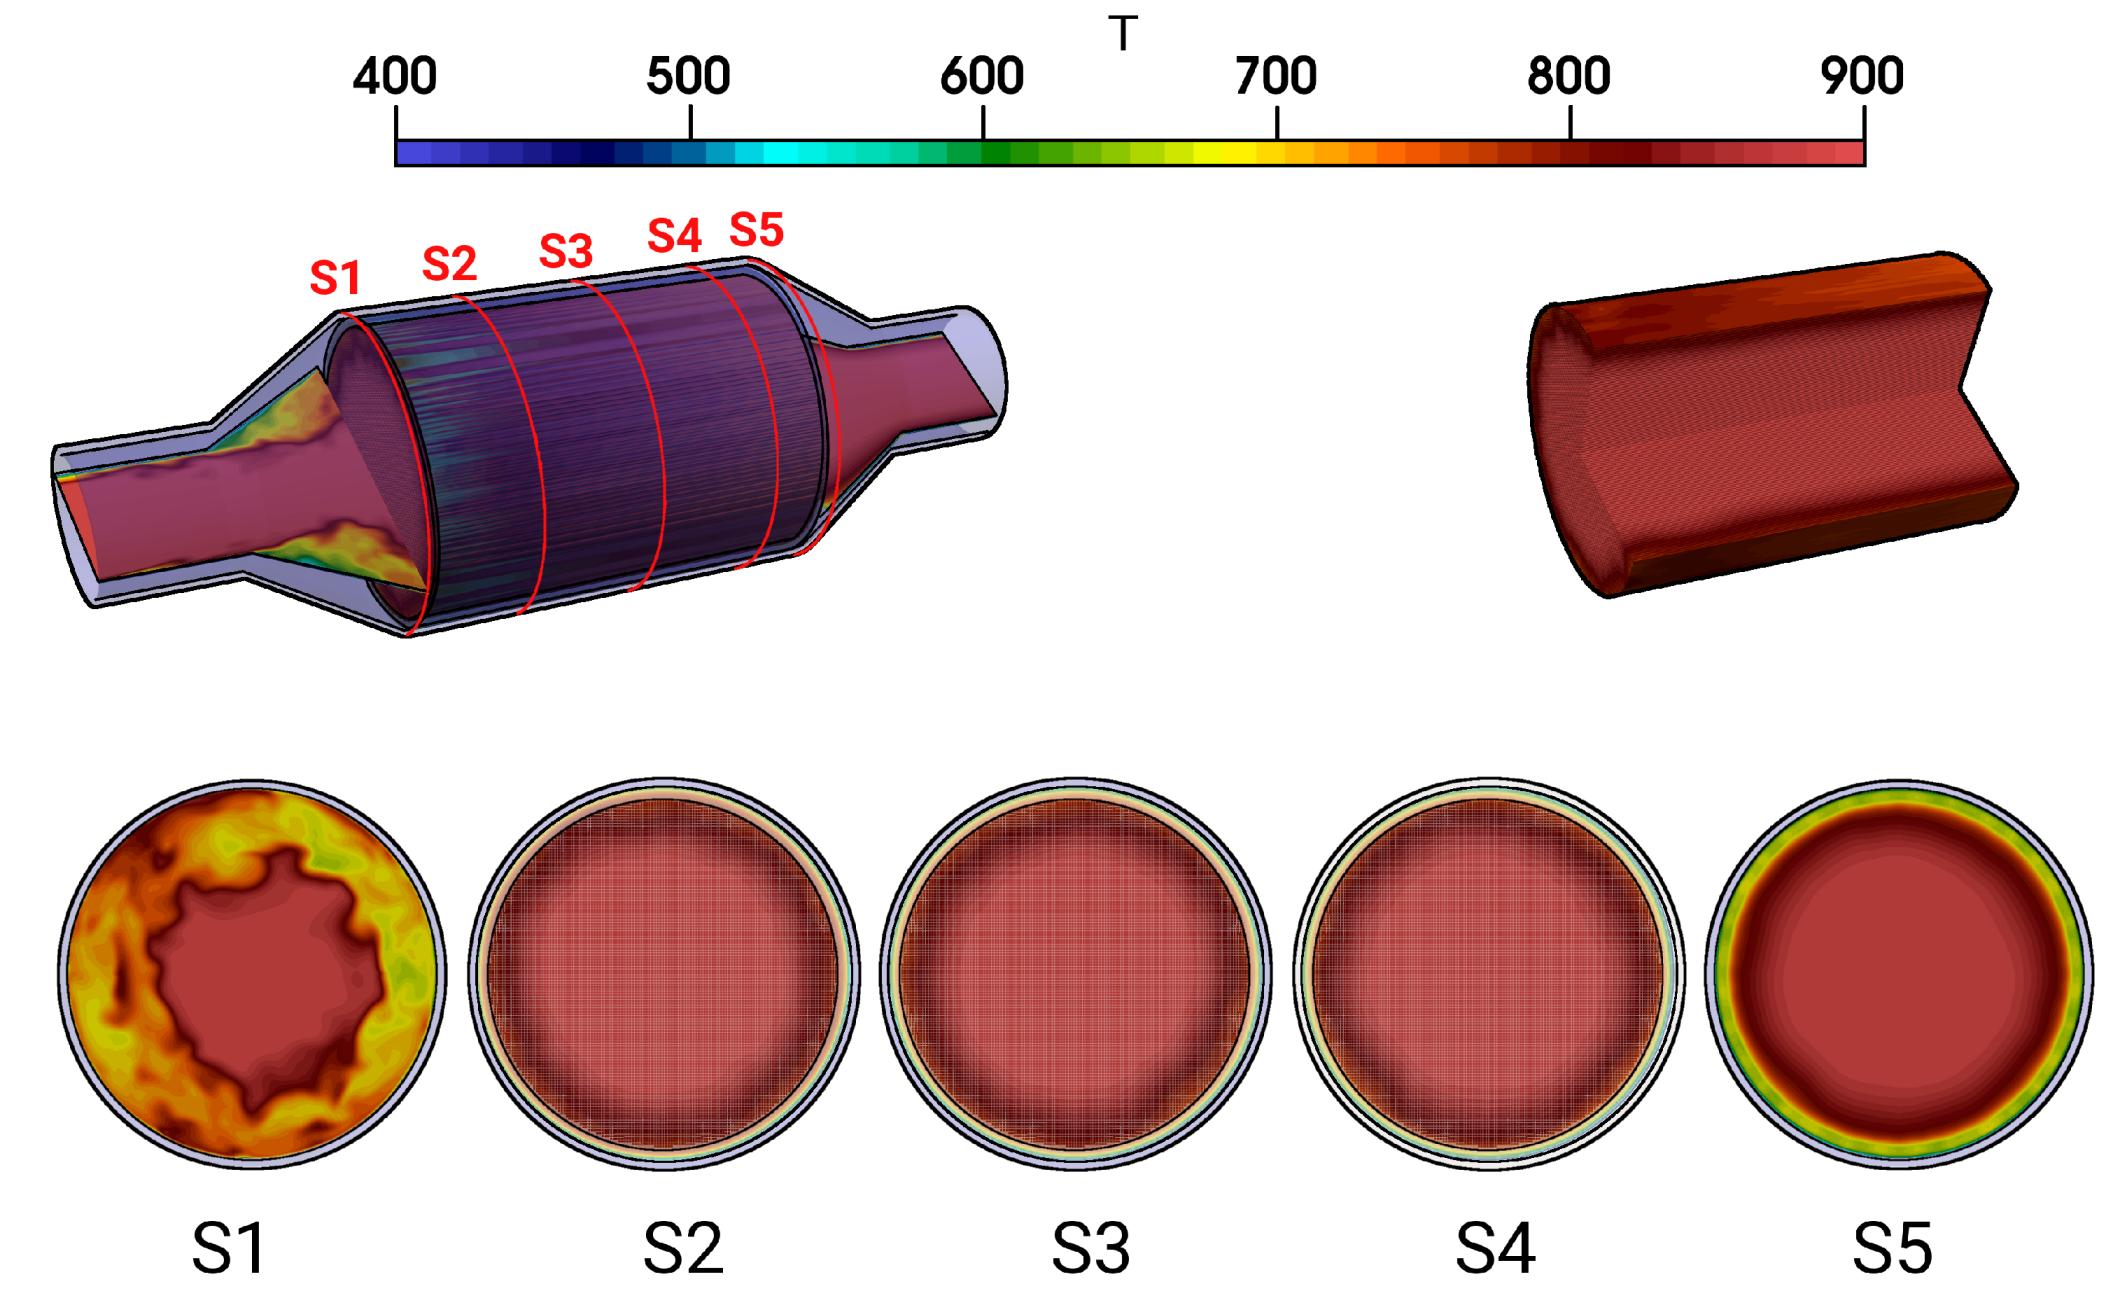
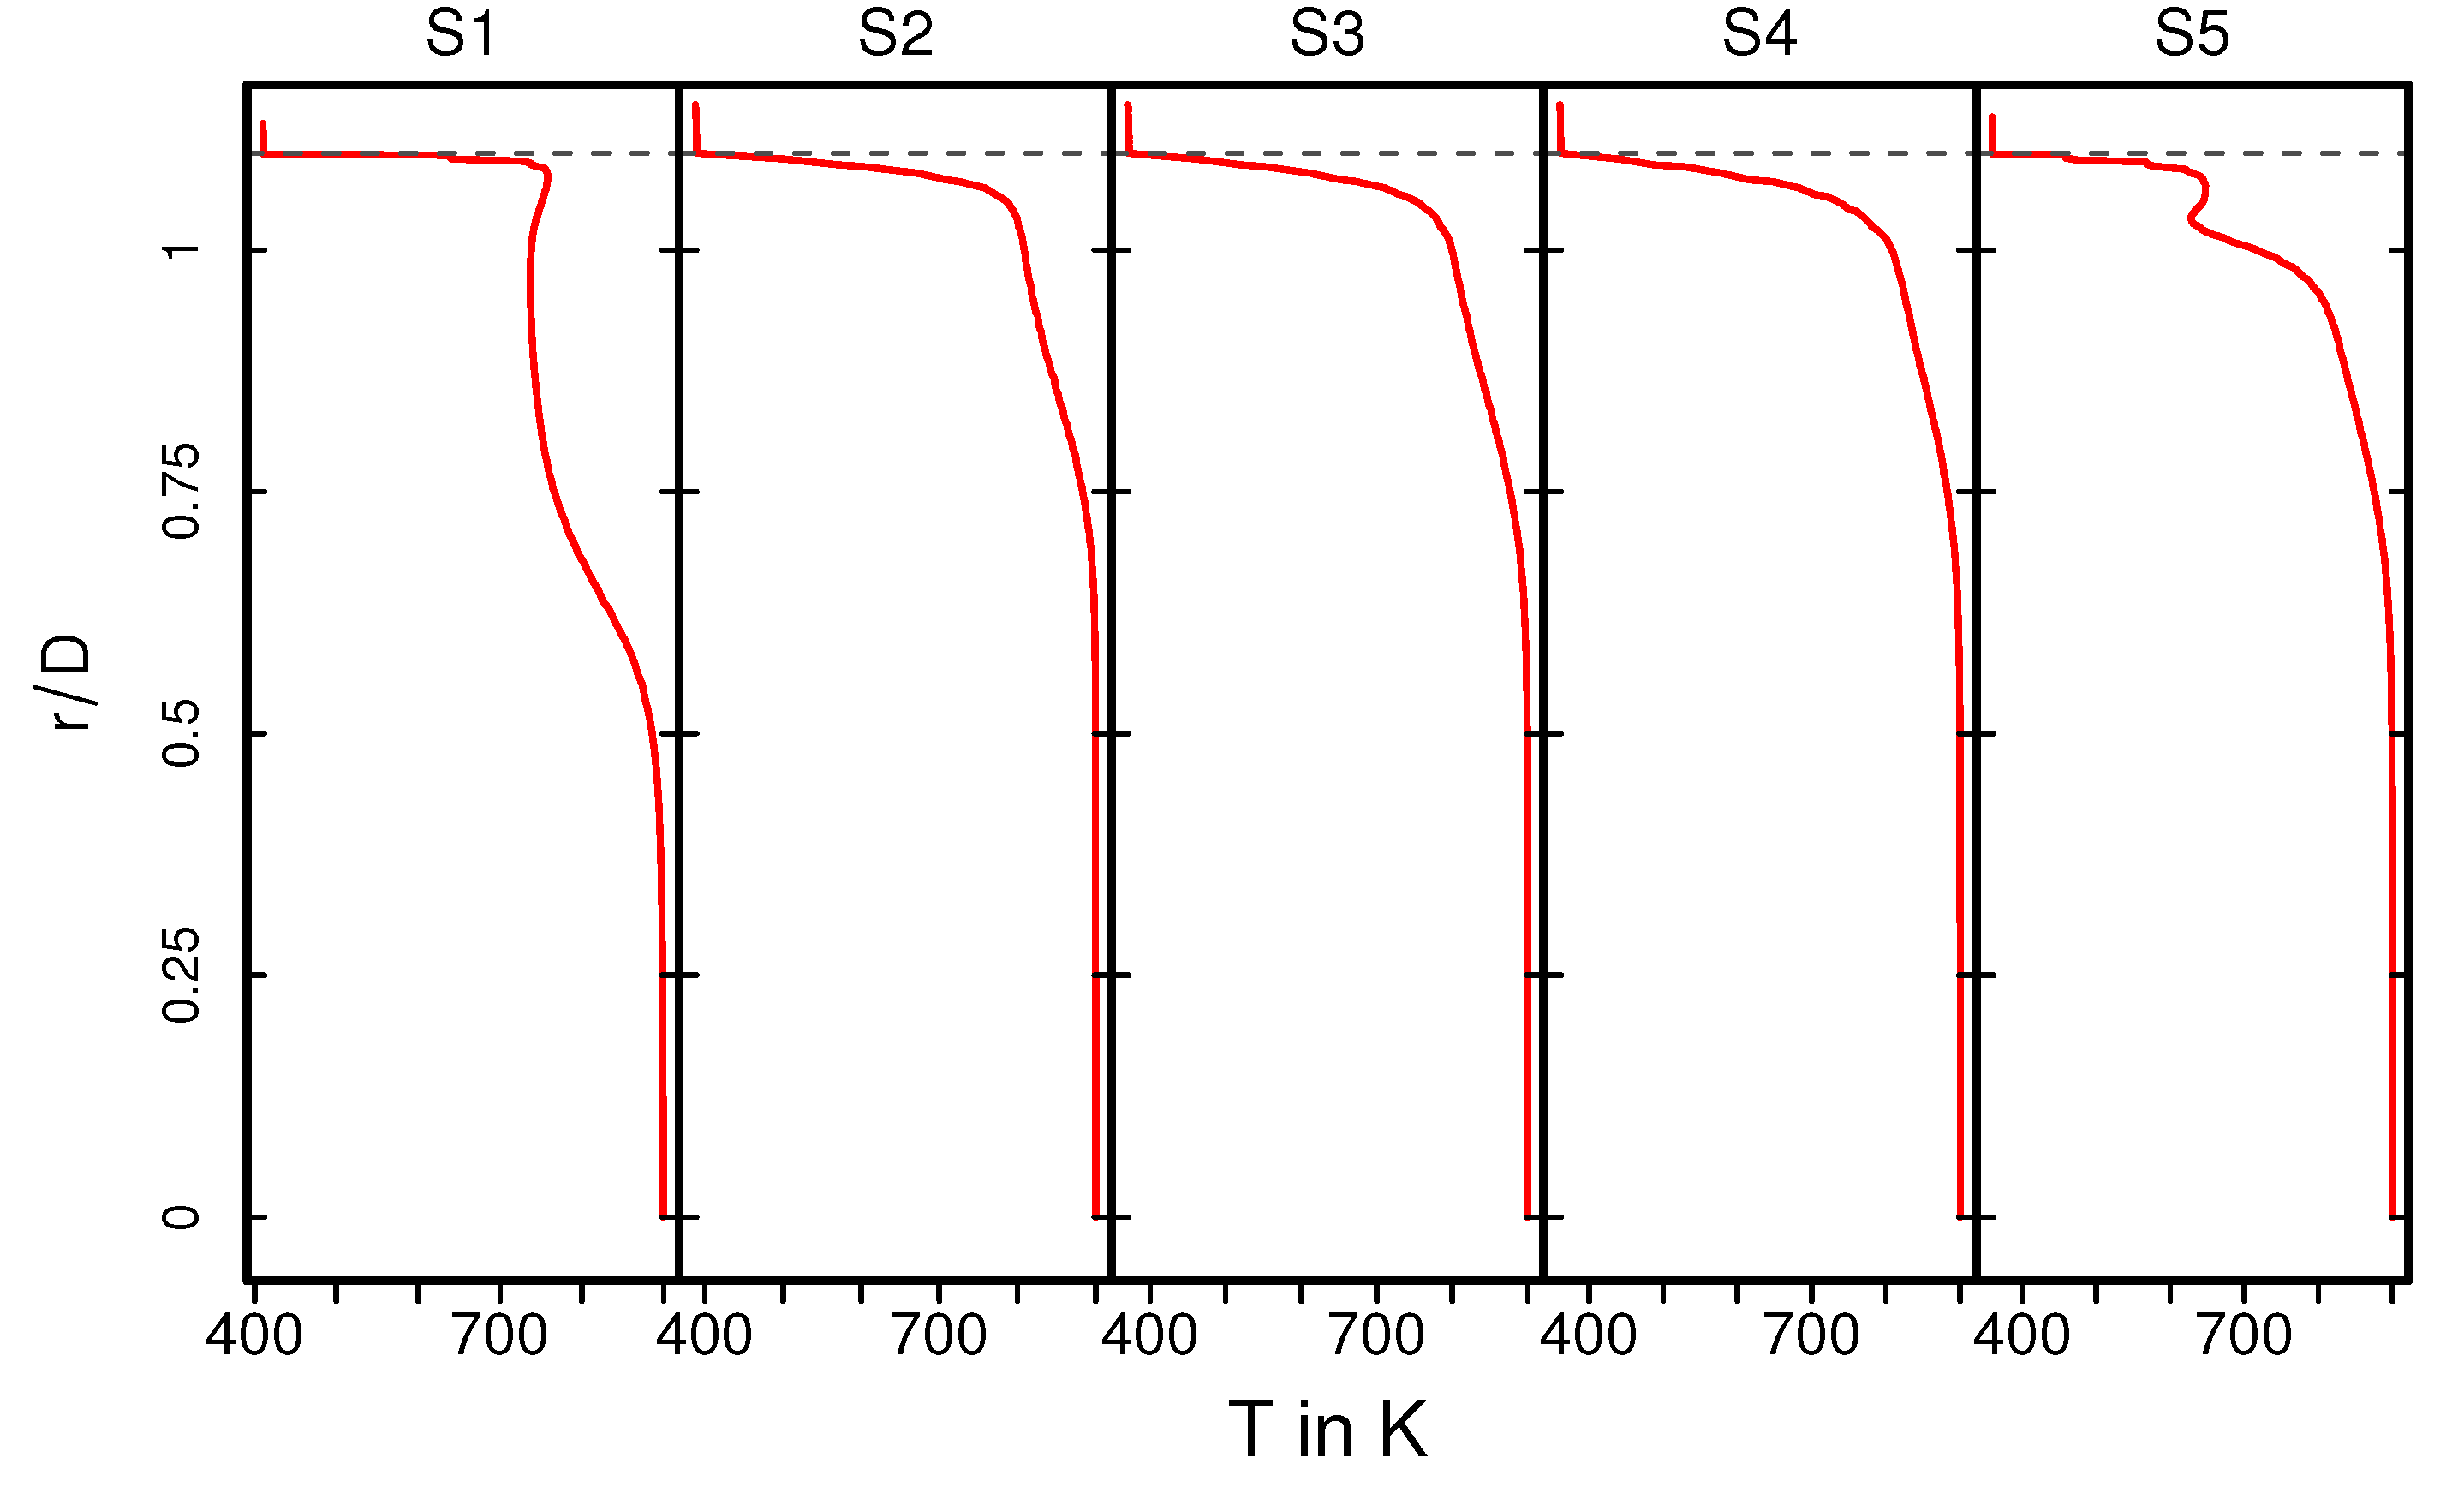
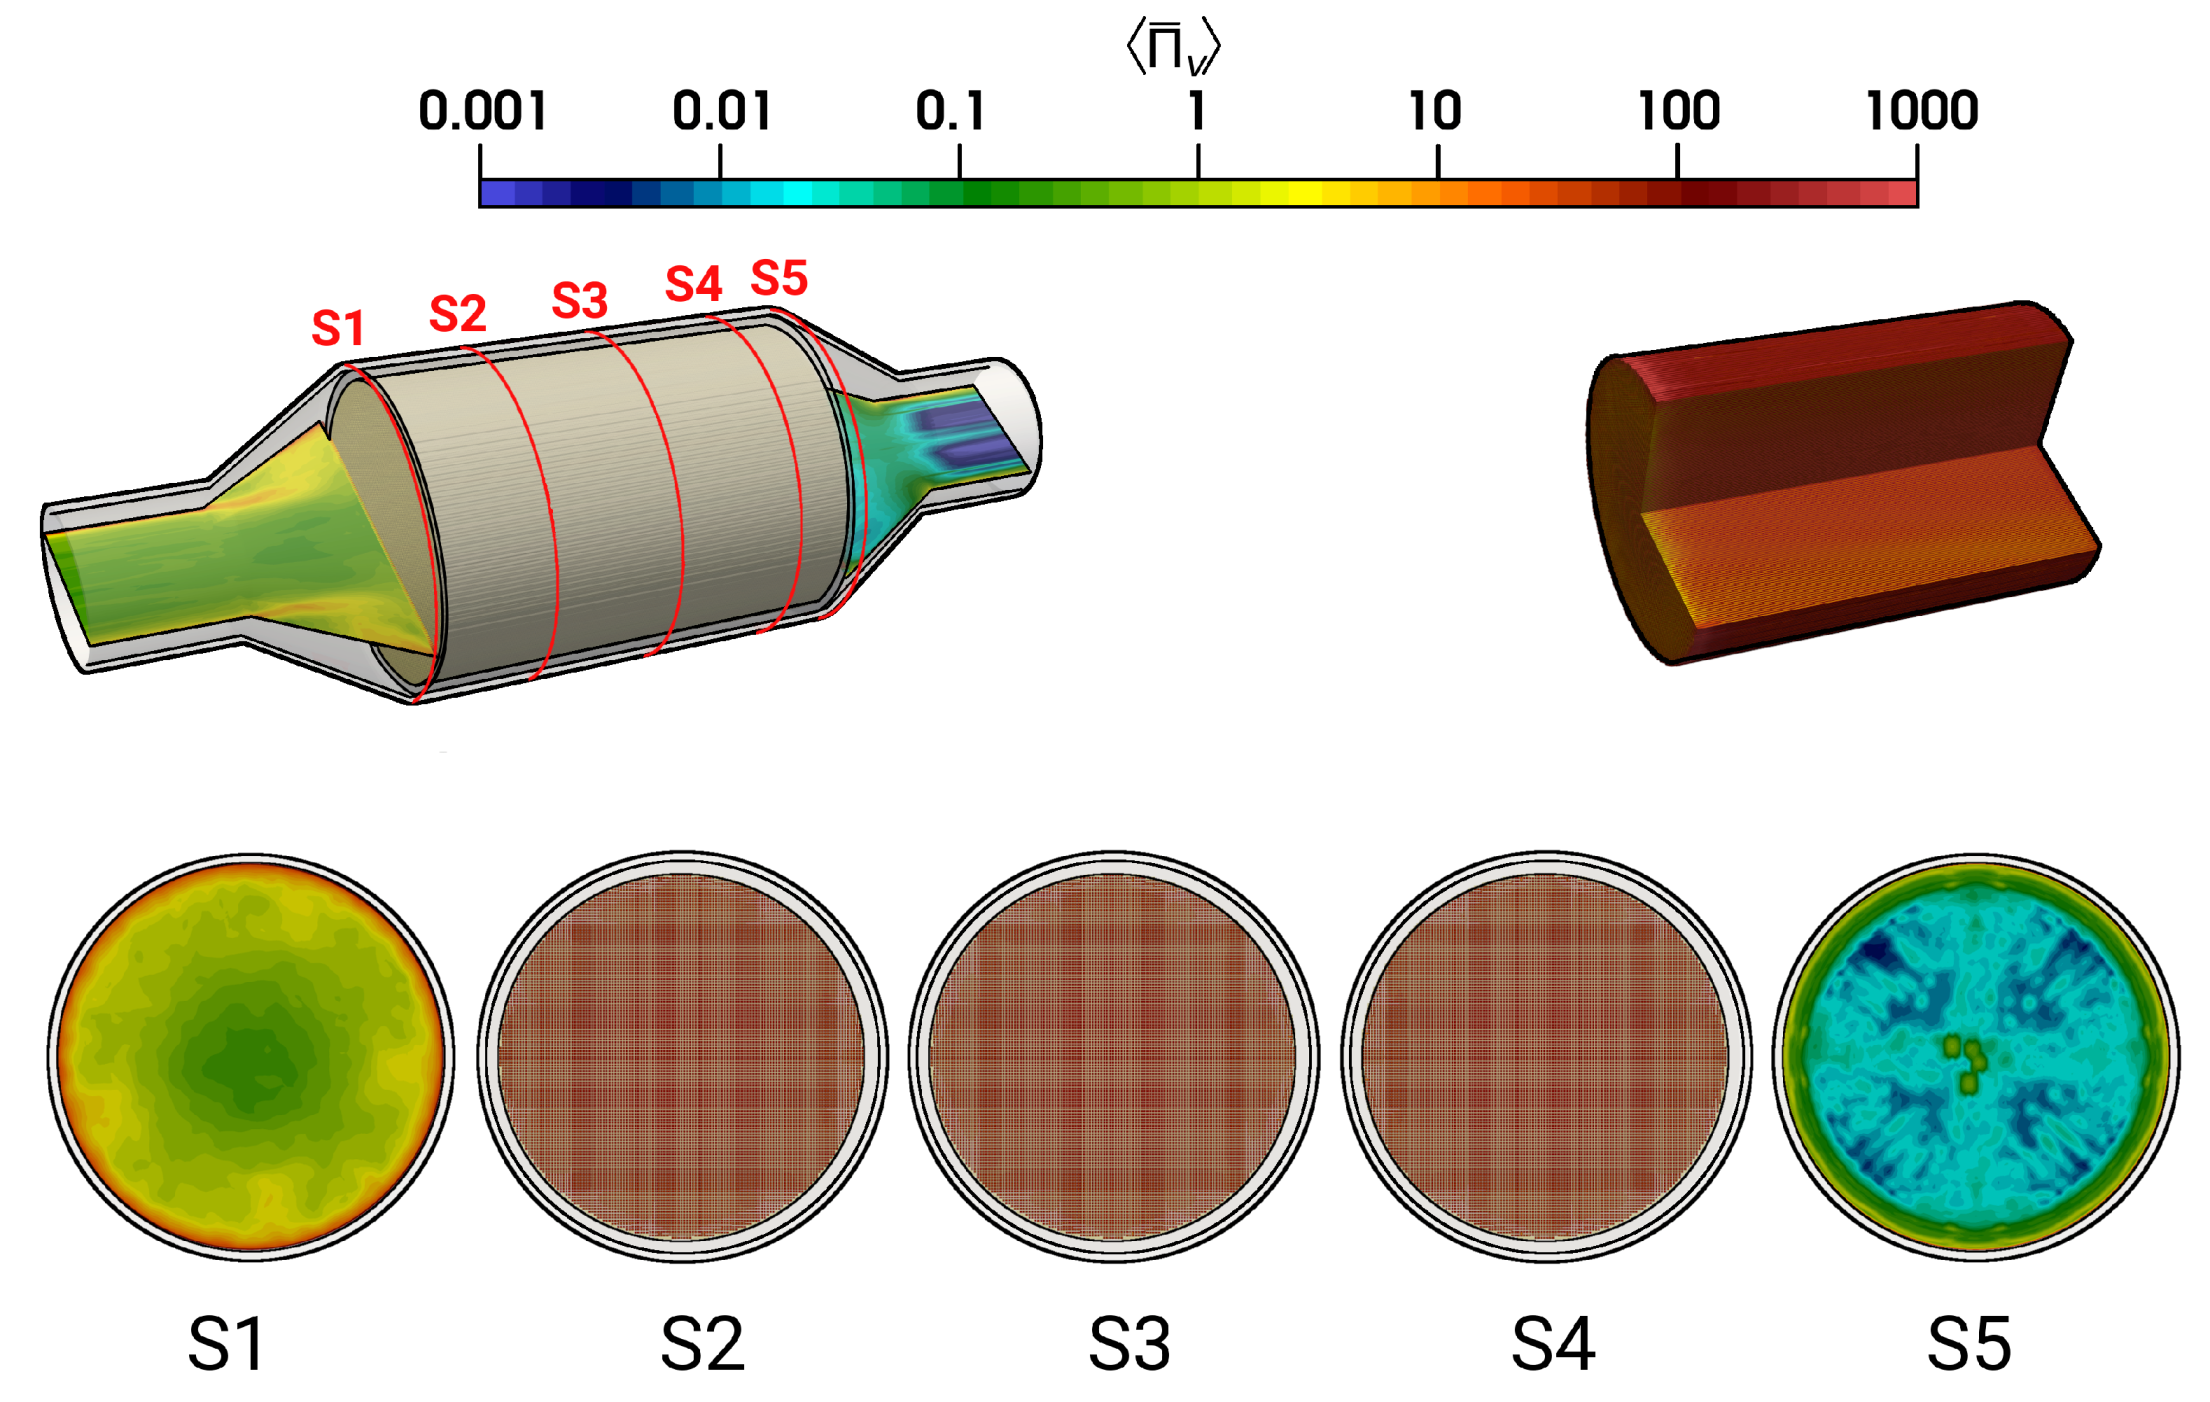
4.2. Predictions of Heat and Fluid Flow Features (Case 9 and 12)
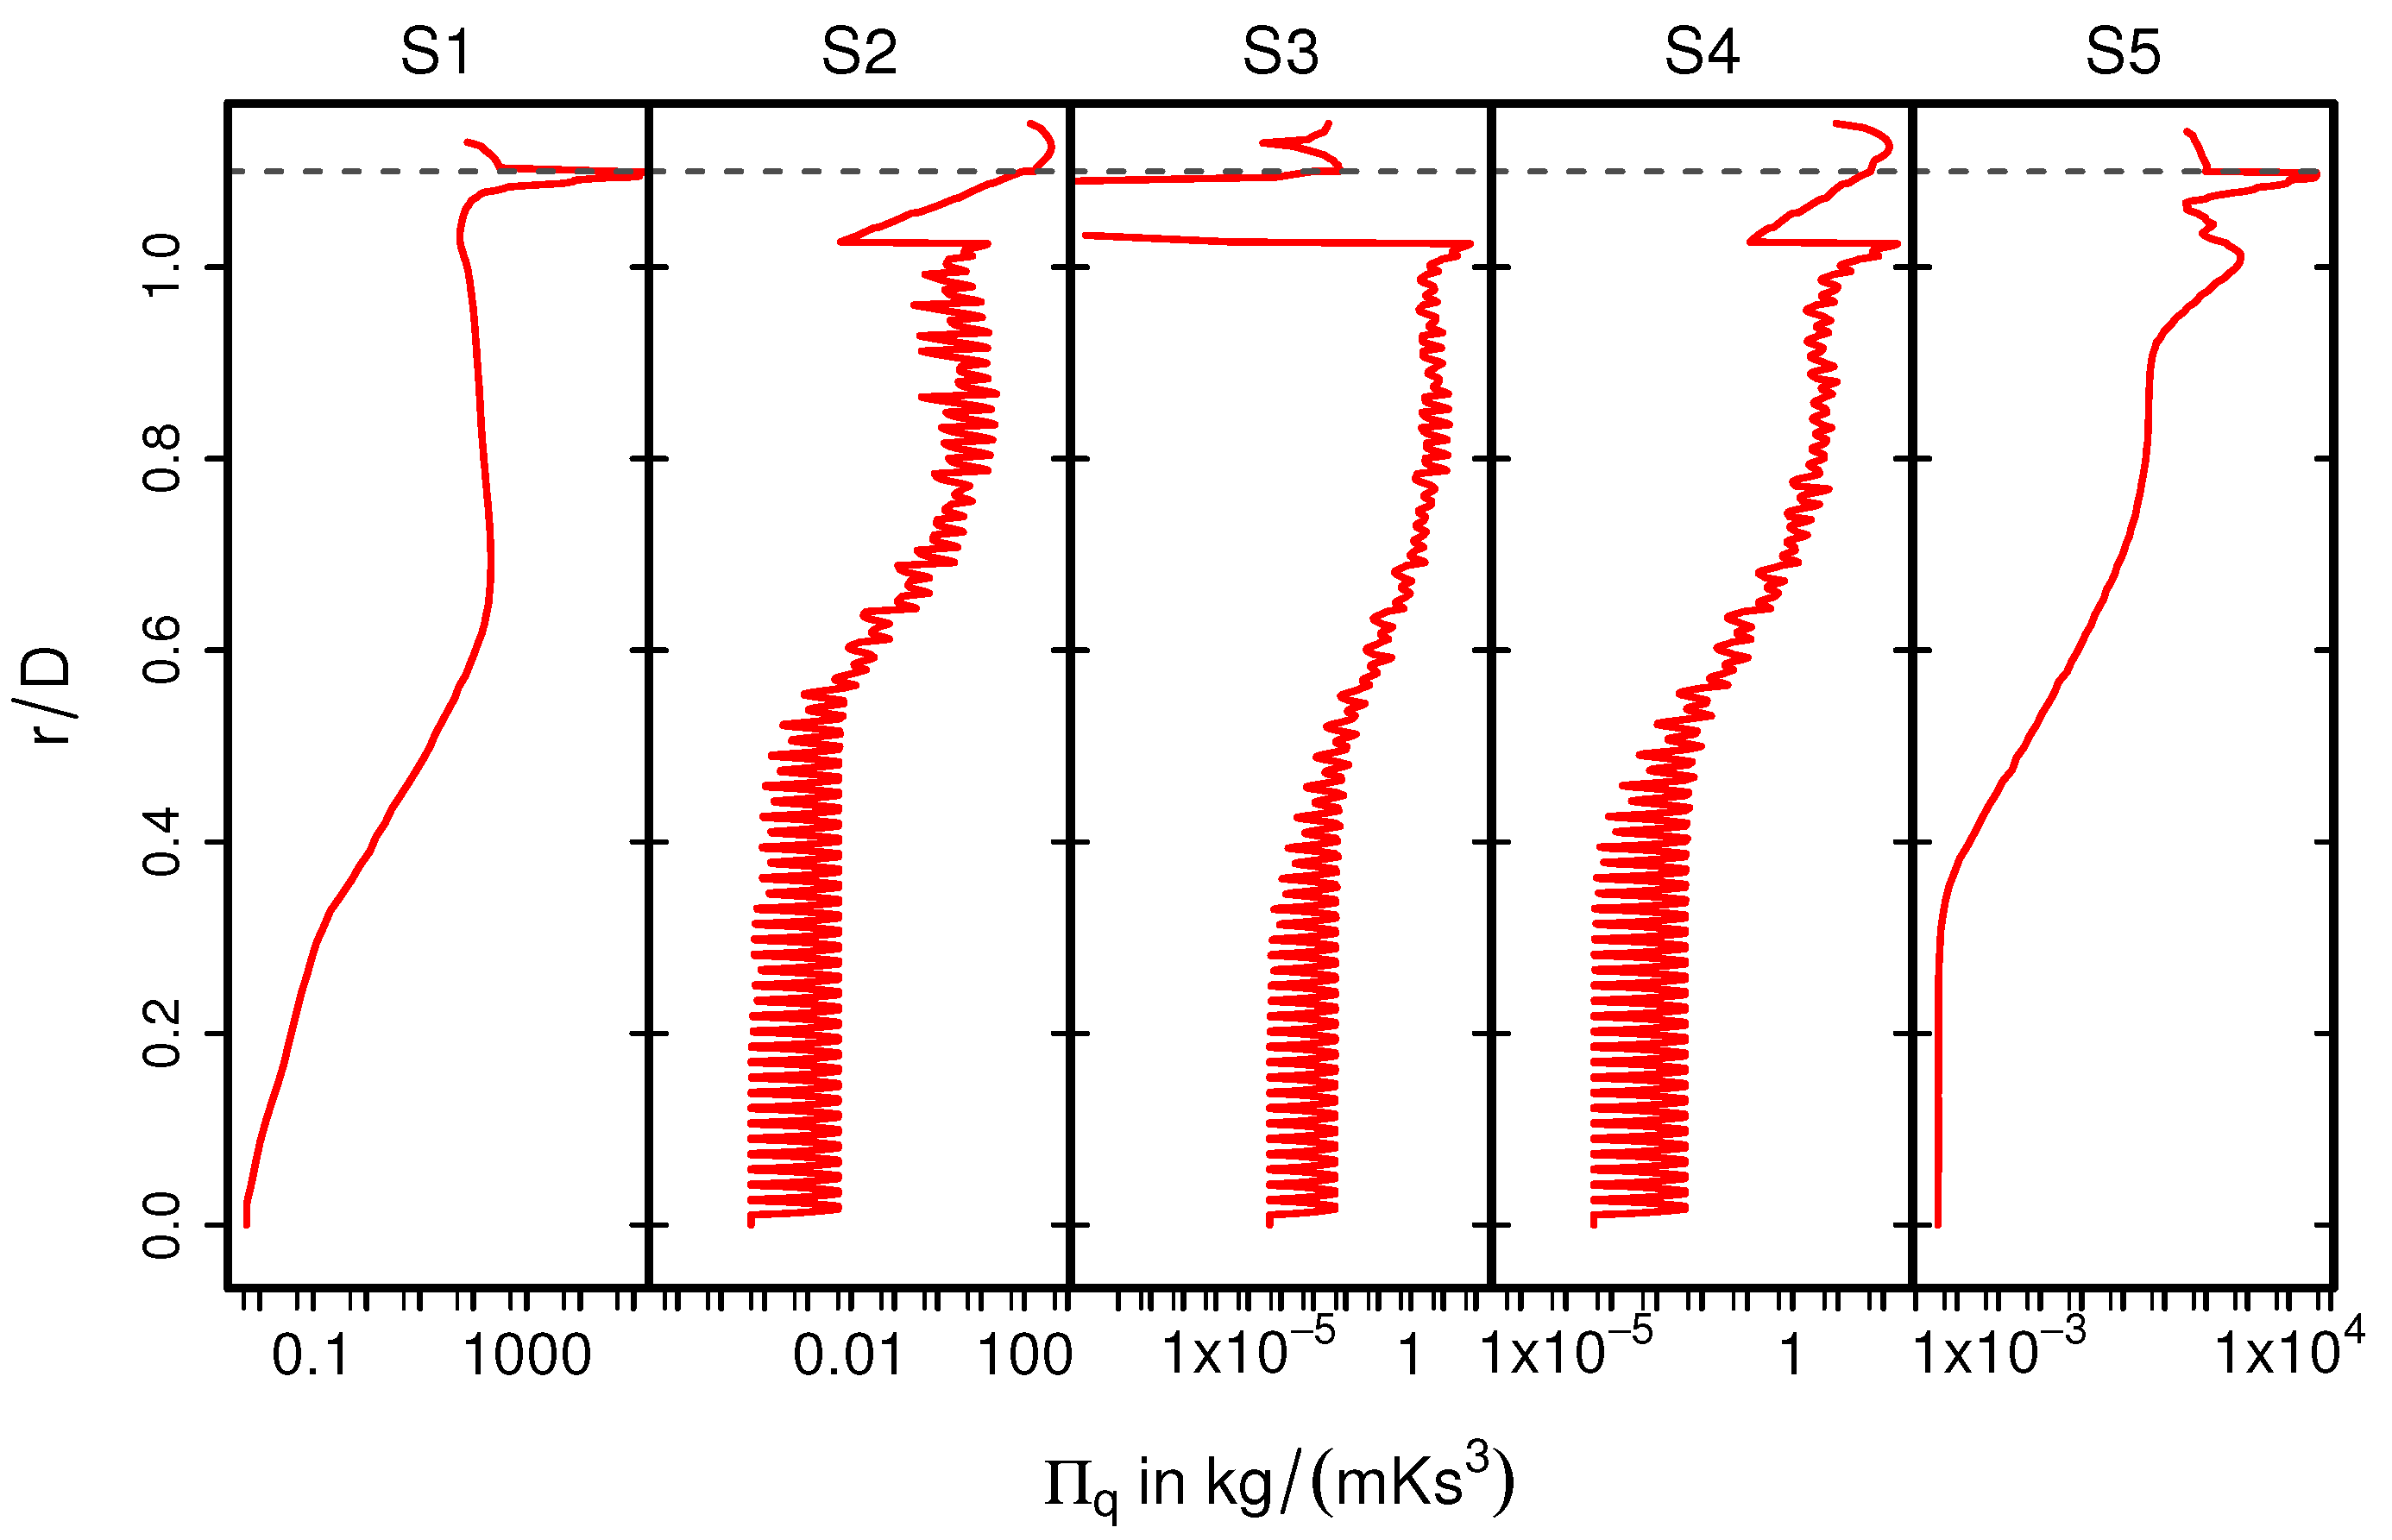
4.3. Predictions of Entropy Production Rates
5. Conclusions
- The Darcy-Forchheimer equation is well suited to describe the pressure drop in this specific catalytic converter. Correlation equations based on the experimental data are provided.
- Important characteristic flow features are identified in the catalytic converter, namely the impinging flow with stagnation, recirculation, flow separation, and laminarization within the fine ducts of the monolith.
- The rms velocity decreases rapidly in the monolith, attributing to the flow laminarization process in the narrow monolith channels. This physical process is influenced by the heat transfer dynamics through temperature-dependent thermophysical properties as simulations with and without heat transfer testify.
- The entropy production by viscous dissipation () occurs predominantly in the monolith region due to high-velocity gradients at the walls of the narrow monolith ducts. This suggests that the laminarization inside the monolith is purely a fluid flow process through temperature-dependent thermophysical properties.
- The entropy production rate due to heat transport is relatively small in the monolith region, while it overwhelms viscous dissipation effects in the pipe regions.
Author Contributions
Funding
Institutional Review Board Statement
Informed Consent Statement
Data Availability Statement
Acknowledgments
Conflicts of Interest
Abbreviations
| ICEV | Internal Combustion Engine Vehicle |
| BEV | Battery Electric Vehicle |
| EGM | Entropy Generation Minimization |
| EGAS | Exhaust Gas After-treatment System |
| CFD | Computation Fluid Dynamics |
| VANS | Volume-Averaging Navier–Stokes |
| RANS | Reynolds-Averaging Navier–Stokes |
| LES | Large-Eddy Simulation |
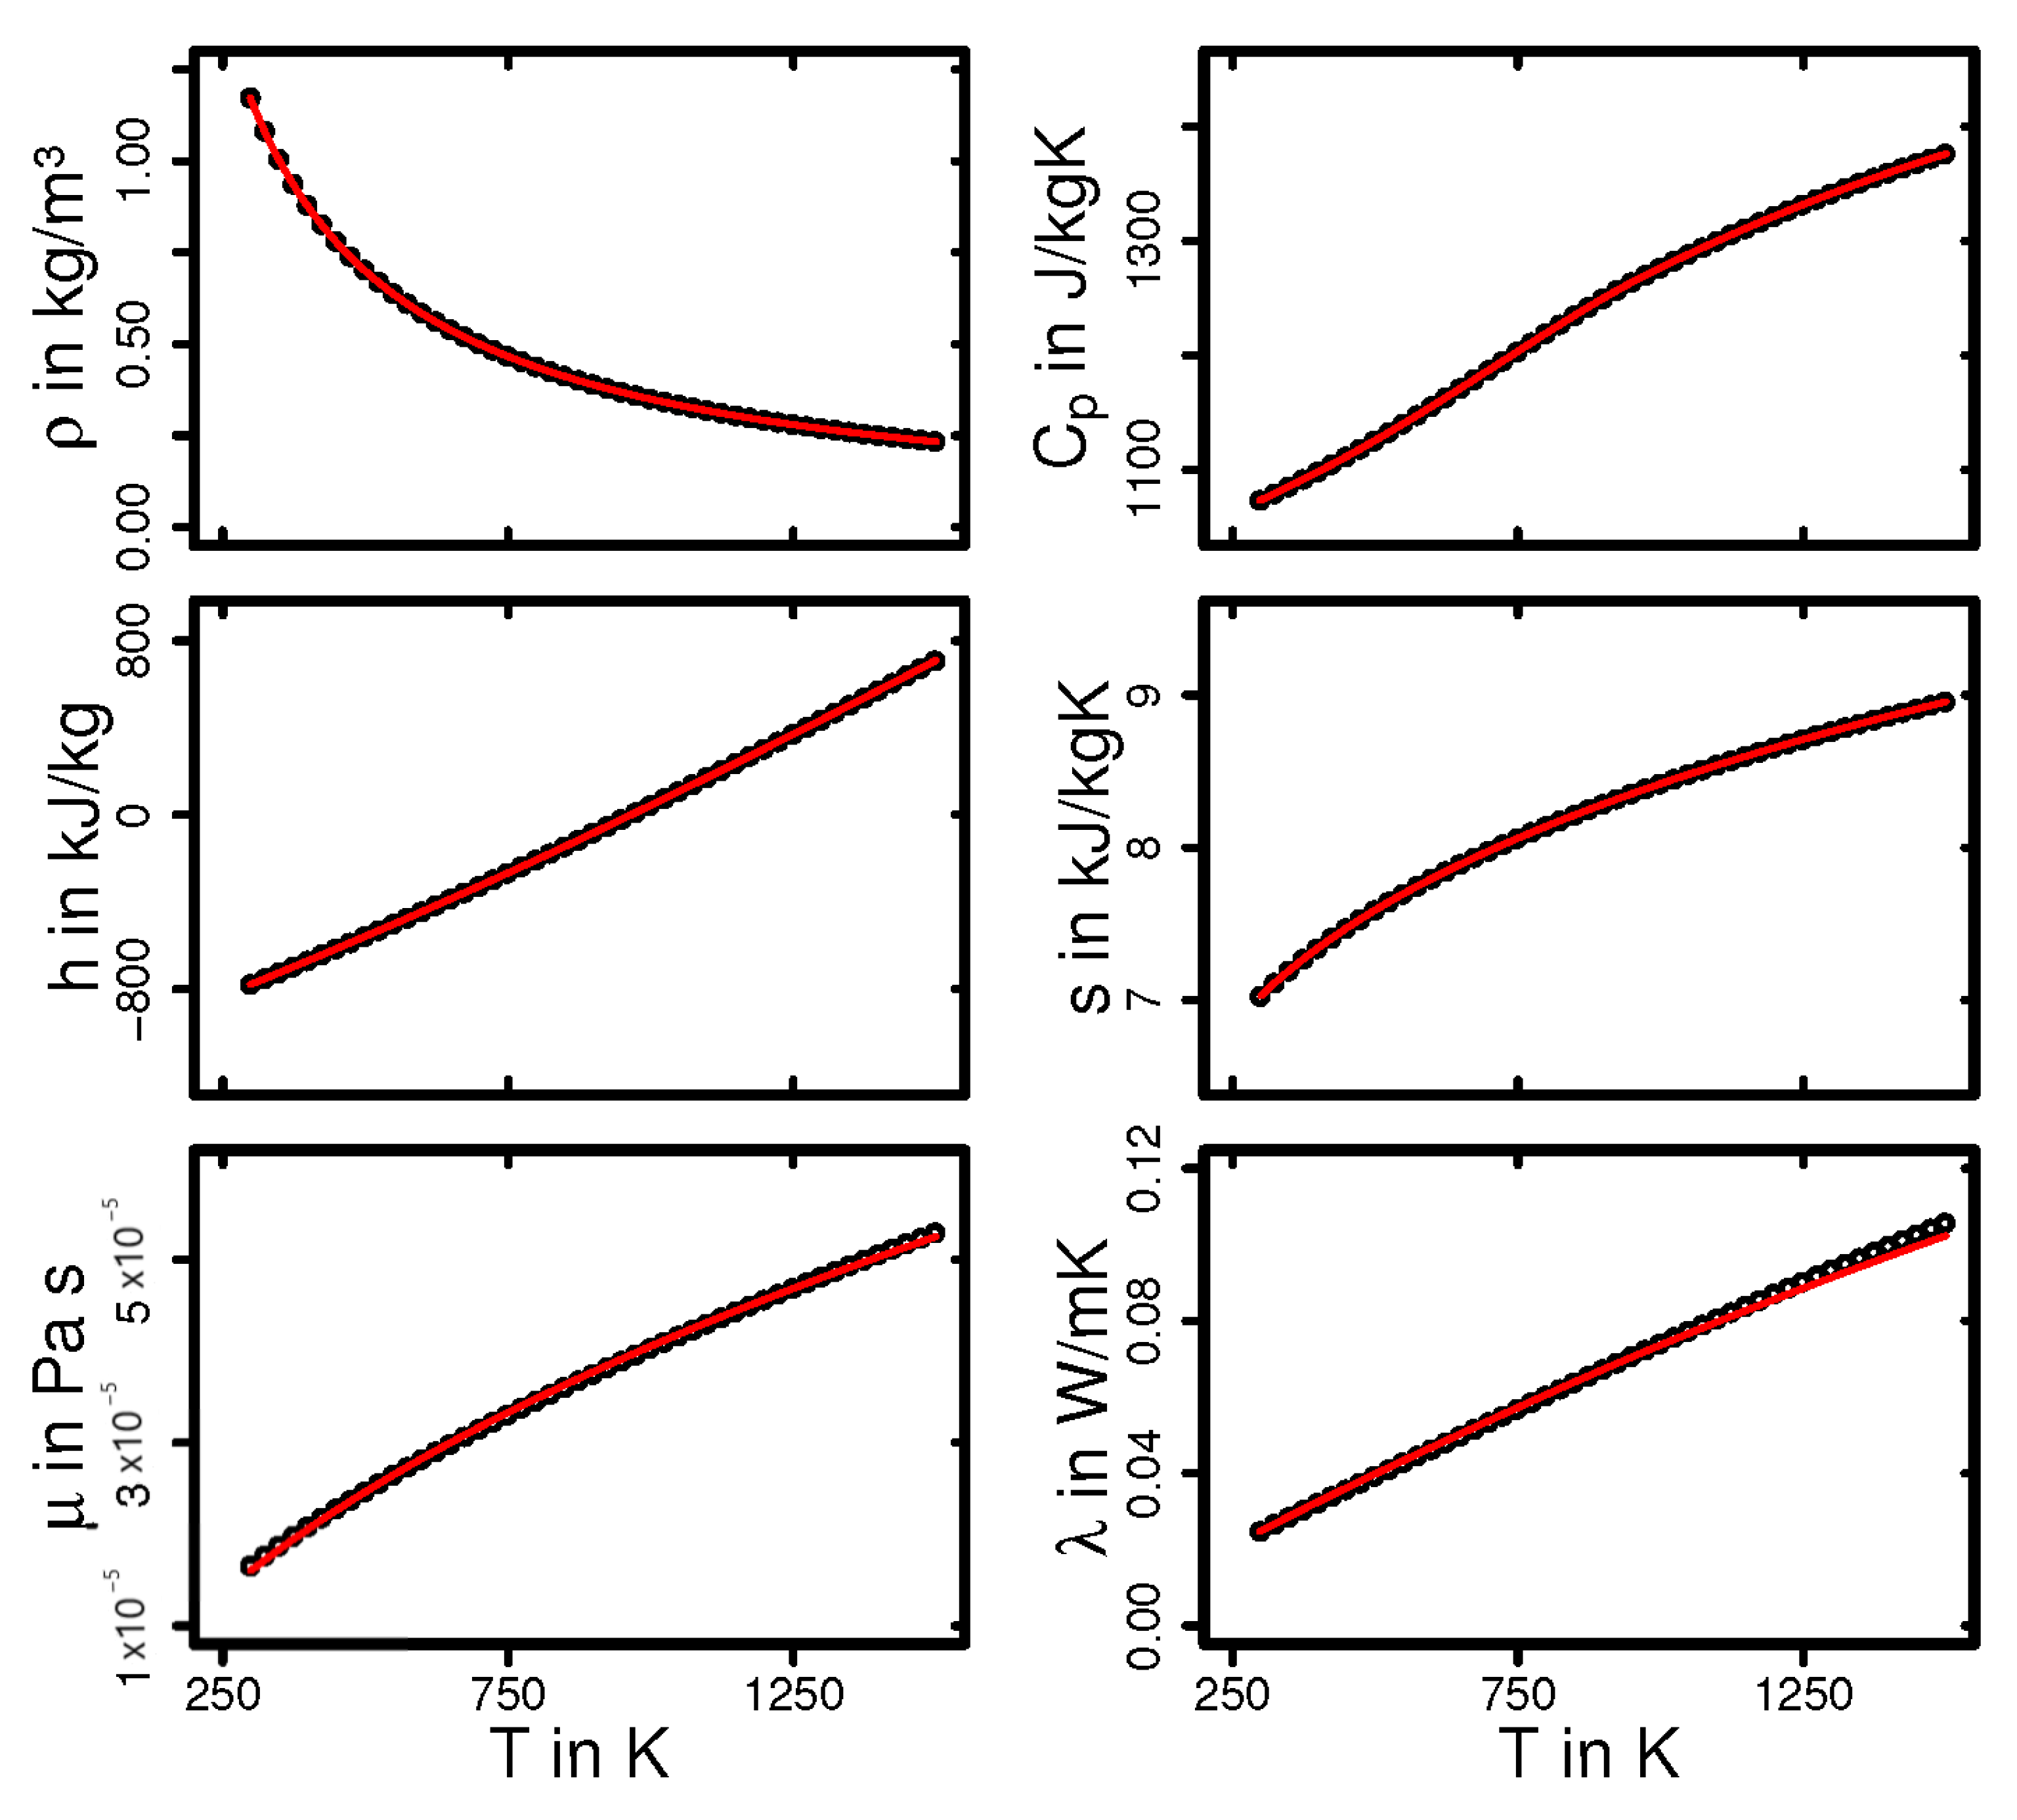
Appendix A. Thermodynamic Properties of Applied Exhaust Gas

| species [-] | |||||
| fraction [%] | 12.3 | 13.8 | 0.7 | 72.3 | 0.9 |
| NASA Coefficient | |||||||
|---|---|---|---|---|---|---|---|
| K | 3.48 | 7.08 × 10⁻⁴ | −2.61 × 10⁻⁷ | 1.24 × 10⁻⁹ | −7.77 × 10⁻¹³ | −1.10 × 10⁴ | 4.15 |
| K | 3.13 | 1.77 × 10⁻³ | −5.91 × 10⁻⁷ | 9.04 × 10⁻¹¹ | −5.10 × 10⁻¹⁵ | −1.10 × 10⁴ | 5.88 |
References
- Zhao, F.; Chen, K.; Hao, H.; Liu, Z. Challenges, Potential and Opportunities for Internal Combustion Engines in China. Sustainability 2020, 12, 4955. [Google Scholar] [CrossRef]
- Demirbas, A. Future Fuels for Internal Combustion Engines. Energy Sources Part A Recover. Util. Environ. Eff. 2010, 32, 1273–1281. [Google Scholar] [CrossRef]
- Wallner, T.; Miers, S.A. Internal Combustion Engines, Alternative Fuels for. In Encyclopedia of Sustainability Science and Technology; Meyers, R.A., Ed.; Springer: New York, NY, USA, 2012; pp. 5461–5499. [Google Scholar] [CrossRef]
- Bae, C.; Kim, J. Alternative fuels for internal combustion engines. Proc. Combust. Inst. 2017, 36, 3389–3413. [Google Scholar] [CrossRef]
- Martins, J.; Brito, F.P. Alternative Fuels for Internal Combustion Engines. Energies 2020, 13, 4086. [Google Scholar] [CrossRef]
- Deutschmann, O.; Grunwaldt, J.D. Abgasnachbehandlung in mobilen Systemen: Stand der Technik, Herausforderungen und Perspektiven. Chem. Ing. Tech. 2013, 85, 595–617. [Google Scholar] [CrossRef]
- Nieuwenhuys, B.E. The Surface Science Approach Toward Understanding Automotive Exhaust Conversion Catalysis at the Atomic Level. In Advances in Catalysis; Haag, W.O., Gates, B.C., Knözinger, H., Eds.; Elsevier: Amsterdam, The Netherlands, 1999; Volume 44, pp. 259–328. [Google Scholar] [CrossRef]
- Chorkendorff, I.; Niemantsverdriet, J.W. Concepts of Modern Catalysis and Kinetics; Wiley: New York, NY, USA, 2003. [Google Scholar] [CrossRef]
- Chatterjee, D.; Deutschmann, O.; Warnatz, J. Detailed surface reaction mechanism in a three-way catalyst. Faraday Discuss 2001, 119, 371–384. [Google Scholar] [CrossRef]
- Voltz, S.E.; Morgan, C.R.; Liederman, D.; Jacob, S.M. Kinetic Study of Carbon Monoxide and Propylene Oxidation on Platinum Catalysts. Ind. Eng. Chem. Prod. Res. Dev. 1973, 12, 294–301. [Google Scholar] [CrossRef]
- Oh, S.H.; Cavendish, J.C. Transients of monolithic catalytic converters. Response to step changes in feedstream temperature as related to controlling automobile emissions. Ind. Eng. Chem. Prod. Res. Dev. 1982, 21, 29–37. [Google Scholar] [CrossRef]
- Kumar, R.; Sonthalia, A.; Goel, R. Experimental study on waste heat recovery from an IC engine using thermoelectric technology. Therm. Sci. 2011, 15, 1011–1022. [Google Scholar] [CrossRef]
- Pong, H.; Wallace, J.; Sullivan, P.E. Modeling of Exhaust Gas Treatment for Stationary Applications; SAE Technical Paper Series; SAE International: Warrendale, PA, USA, 2012. [Google Scholar] [CrossRef]
- Hayes, R.; Fadic, A.; Mmbaga, J.; Najafi, A. CFD modelling of the automotive catalytic converter. In Catalysis Today; Elsevier: Amsterdam, The Netherlands, 2012; Volume 188, pp. 94–105. [Google Scholar] [CrossRef]
- Cornejo, I.; Nikrityuk, P.; Hayes, R.E. The influence of channel geometry on the pressure drop in automotive catalytic converters: Model development and validation. Chem. Eng. Sci. 2020, 212, 115317. [Google Scholar] [CrossRef]
- Cornejo, I. A Model for Correcting the Pressure Drop between Two Monoliths. Catalysts 2021, 11, 1314. [Google Scholar] [CrossRef]
- Keenan, J.H. Availability and irreversibility in thermodynamics. Brit. J. Appl. Phys. 1951, 2, 183–192. [Google Scholar] [CrossRef]
- Afridi, M.I.; Qasim, M.; Makinde, O.D. Entropy Generation Due to Heat and Mass Transfer in a Flow of Dissipative Elastic Fluid Through a Porous Medium. J. Heat Transf. 2018, 141, 022002. [Google Scholar] [CrossRef]
- Bejan, A. Second law analysis in heat transfer. Energy 1980, 5, 720–732. [Google Scholar] [CrossRef]
- Bejan, A. Method of entropy generation minimization, or modeling and optimization based on combined heat transfer and thermodynamics. Rev. Générale Therm. 1996, 35, 637–646. [Google Scholar] [CrossRef]
- Ries, F.; Li, Y.; Klingenberg, D.; Nishad, K.; Janicka, J.; Sadiki, A. Near-Wall Thermal Processes in an Inclined Impinging Jet: Analysis of Heat Transport and Entropy Generation Mechanisms. Energies 2018, 11, 1354. [Google Scholar] [CrossRef] [Green Version]
- Ries, F.; Li, Y.; Nishad, K.; Janicka, J.; Sadiki, A. Entropy Generation Analysis and Thermodynamic Optimization of Jet Impingement Cooling Using Large Eddy Simulation. Entropy 2019, 21, 129. [Google Scholar] [CrossRef] [Green Version]
- Afridi, M.I.; Qasim, M. Entropy Generation in Three Dimensional Flow of Dissipative Fluid. Int. J. Appl. Comput. Math. 2017, 4, 117–128. [Google Scholar] [CrossRef]
- Farooq, U.; Afridi, M.; Qasim, M.; Lu, D. Transpiration and Viscous Dissipation Effects on Entropy Generation in Hybrid Nanofluid Flow over a Nonlinear Radially Stretching Disk. Entropy 2018, 20, 668. [Google Scholar] [CrossRef] [Green Version]
- Reddy, G.J.; Kumar, M.; Kethireddy, B.; Chamkha, A.J. Colloidal study of unsteady magnetohydrodynamic couple stress fluid flow over an isothermal vertical flat plate with entropy heat generation. J. Mol. Liq. 2018, 252, 169–179. [Google Scholar] [CrossRef]
- Afridi, M.; Qasim, M.; Hussanan, A. Second Law Analysis of Dissipative Flow over a Riga Plate with Non-Linear Rosseland Thermal Radiation and Variable Transport Properties. Entropy 2018, 20, 615. [Google Scholar] [CrossRef] [PubMed] [Green Version]
- Khan, A.; ul Karim, F.; Khan, I.; Ali, F.; Khan, D. Irreversibility analysis in unsteady flow over a vertical plate with arbitrary wall shear stress and ramped wall temperature. Results Phys. 2018, 8, 1283–1290. [Google Scholar] [CrossRef]
- Adesanya, S.O.; Makinde, O.D. Effects of couple stresses on entropy generation rate in a porous channel with convective heating. Comput. Appl. Math. 2014, 34, 293–307. [Google Scholar] [CrossRef]
- Makinde, O. Entropy analysis for MHD boundary layer flow and heat transfer over a flat plate with a convective surface boundary condition. Int. J. Exergy 2012, 10, 142. [Google Scholar] [CrossRef]
- Rashidi, M.; Mohammadi, F.; Abbasbandy, S.; Alhuthali, M.S. Entropy Generation Analysis for Stagnation Point Flow in a Porous Medium over a Permeable Stretching Surface. J. Appl. Fluid Mech. 2015, 8, 753–765. [Google Scholar] [CrossRef]
- Ziefuss, M.; Karimi, N.; Ries, F.; Sadiki, A.; Mehdizadeh, A. Entropy Generation Assessment for Wall-Bounded Turbulent Shear Flows Based on Reynolds Analogy Assumptions. Entropy 2019, 21, 1157. [Google Scholar] [CrossRef] [Green Version]
- Ries, F.; Kütemeier, D.; Li, Y.; Nishad, K.; Sadiki, A. Effect Chain Analysis of Supercritical Fuel Disintegration Processes Using an LES-based Entropy Generation Analysis. Combust. Sci. Technol. 2020, 192, 2171–2188. [Google Scholar] [CrossRef]
- Li, Y.; Ries, F.; Nishad, K.; Sadiki, A. Predictions of Conjugate Heat Transfer in Turbulent Channel Flow Using Advanced Wall-Modeled Large Eddy Simulation Techniques. Entropy 2021, 23, 725. [Google Scholar] [CrossRef]
- Li, Y.; Ries, F.; Leudesdorff, W.; Nishad, K.; Pati, A.; Hasse, C.; Janicka, J.; Jakirlić, S.; Sadiki, A. Non-equilibrium wall functions for large Eddy simulations of complex turbulent flows and heat transfer. Int. J. Heat Fluid Fluid Flow 2021, 88, 108758. [Google Scholar] [CrossRef]
- Ries, F.; Obando, P.; Shevchuck, I.; Janicka, J.; Sadiki, A. Numerical analysis of turbulent flow dynamics and heat transport in a round jet at supercritical conditions. Int. J. Heat Fluid Fluid Flow 2017, 66, 172–184. [Google Scholar] [CrossRef]
- Ries, F. Numerical Modeling and Prediction of Irreversibilities in Sub- and Supercritical Near-Wall Flows. Ph.D. Thesis, Institute of Energy and Power Plant Technology, Technische Universität Darmstadt, Darmstadt, Germany, 2018. [Google Scholar]
- Nicoud, F.; Toda, H.B.; Cabrit, O.; Bose, S.; Lee, J. Using singular values to build a subgrid-scale model for large eddy simulations. Phys. Fluids 2011, 23, 085106. [Google Scholar] [CrossRef] [Green Version]
- Burcat, A.; Ruscic, B. Third Millennium Ideal Gas and Condensed Phase Thermochemical Database for Combustion with Updates from Active Thermochemical Tables; Technical Report; Argonne National Laboratory, The University of Chicago: Chicago, IL, USA, 2005. [Google Scholar]
- Sutherland, W. The viscosity of gases and molecular force. Lond. Edinb. Ans Dublin Philos. Mag. J. Sci. 1893, 36, 507–531. [Google Scholar] [CrossRef] [Green Version]
- Klein, M.; Sadiki, A.; Janicka, J. A digital filter based generation of inflow data for spatially developing direct numerical or large eddy simulations. J. Comput. Phys. 2003, 186, 652–665. [Google Scholar] [CrossRef]
- Baehr, H.D.; Stephan, K. Wärme- und Stoffübertragung; Springer: Berlin/Heidelberg, Germany, 2013. [Google Scholar] [CrossRef]
- Delplace, F. Laminar flow of Newtonian liquids in ducts of rectangular cross-section an interesting model for both physics and mathematics. Int. J. Theor. Math. Phys. 2018, 8, 52–55. [Google Scholar] [CrossRef]
- Corrsin, S. On the Spectrum of Isotropic Temperature Fluctuations in an Isotropic Turbulence. J. Appl. Phys. 1951, 22, 469–473. [Google Scholar] [CrossRef]
- Smagorinsky, J. General circulation experiments with the primitive equations. Mon. Weather. Rev. 1963, 91, 99–164. [Google Scholar] [CrossRef]


| Coarse | Medium | Fine | |
|---|---|---|---|
| solid part | 1,499,560 | 2,348,408 | 2,348,408 |
| fluid part | 5,556,400 | 13,959,292 | 46,349,536 |
| Case | Grid | Flow Rate | Fluid | Temperature | ||
|---|---|---|---|---|---|---|
| 1 | coarse | 40.3 m/h | air | 298 K | 15,921 | 73 |
| 2 | medium | 40.3 m/h | air | 298 K | 15,921 | 73 |
| 3 | fine | 40.3 m/h | air | 298 K | 15,921 | 73 |
| 4 | coarse | 79.8 m/h | air | 298 K | 31,527 | 144 |
| 5 | medium | 79.8 m/h | air | 298 K | 31,527 | 144 |
| 6 | fine | 79.8 m/h | air | 298 K | 31,527 | 144 |
| 7 | coarse | 160 m/h | air | 298 K | 63,213 | 289 |
| 8 | medium | 160 m/h | air | 298 K | 63,213 | 289 |
| 9 | fine | 160 m/h | air | 298 K | 63,213 | 289 |
| 10 | coarse | 160 m/h | exhaust gas | 900 K | 10,020 | 46 |
| 11 | medium | 160 m/h | exhaust gas | 900 K | 10,020 | 46 |
| 12 | fine | 160 m/h | exhaust gas | 900 K | 10,020 | 46 |
| Monolith Region | Pipe Regions | Conditions | |
|---|---|---|---|
| 182.877 | 5.104 | isothermal | |
| 102.886 | 3.112 | non-isothermal | |
| 82.221 | 1249.484 | non-isothermal |
Publisher’s Note: MDPI stays neutral with regard to jurisdictional claims in published maps and institutional affiliations. |
© 2022 by the authors. Licensee MDPI, Basel, Switzerland. This article is an open access article distributed under the terms and conditions of the Creative Commons Attribution (CC BY) license (https://creativecommons.org/licenses/by/4.0/).
Share and Cite
Li, Y.; Rico Cortes, L.F.; Hamel, H.; Nishad, K.; Biondo, L.; Ries, F. Prediction of Heat Transfer and Fluid Flow Effects on Entropy Generation in a Monolithic Catalytic Converter Using Large-Eddy Simulation. Entropy 2022, 24, 602. https://doi.org/10.3390/e24050602
Li Y, Rico Cortes LF, Hamel H, Nishad K, Biondo L, Ries F. Prediction of Heat Transfer and Fluid Flow Effects on Entropy Generation in a Monolithic Catalytic Converter Using Large-Eddy Simulation. Entropy. 2022; 24(5):602. https://doi.org/10.3390/e24050602
Chicago/Turabian StyleLi, Yongxiang, Luis Felipe Rico Cortes, Hardy Hamel, Kaushal Nishad, Luigi Biondo, and Florian Ries. 2022. "Prediction of Heat Transfer and Fluid Flow Effects on Entropy Generation in a Monolithic Catalytic Converter Using Large-Eddy Simulation" Entropy 24, no. 5: 602. https://doi.org/10.3390/e24050602
APA StyleLi, Y., Rico Cortes, L. F., Hamel, H., Nishad, K., Biondo, L., & Ries, F. (2022). Prediction of Heat Transfer and Fluid Flow Effects on Entropy Generation in a Monolithic Catalytic Converter Using Large-Eddy Simulation. Entropy, 24(5), 602. https://doi.org/10.3390/e24050602