Abstract
Studying heart rate dynamics would help understand the effects caused by a hyperkinetic heart in patients with hyperthyroidism. By using a multiscale entropy (MSE) analysis of heart rate dynamics derived from one-channel electrocardiogram recording, we aimed to compare the system complexity of heart rate dynamics between hyperthyroid patients and control subjects. A decreased MSE complexity index (CI) computed from MSE analysis reflects reduced system complexity. Compared with the control subjects (n = 37), the hyperthyroid patients (n = 37) revealed a significant decrease (p < 0.001) in MSE CI (hyperthyroid patients 10.21 ± 0.37 versus control subjects 14.08 ± 0.21), sample entropy for each scale factor (from 1 to 9), and high frequency power (HF) as well as a significant increase (p < 0.001) in low frequency power (LF) in normalized units (LF%) and ratio of LF to HF (LF/HF). In conclusion, besides cardiac autonomic dysfunction, the system complexity of heart rate dynamics is reduced in hyperthyroidism. This finding implies that the adaptability of the heart rate regulating system is impaired in hyperthyroid patients. Additionally, it might explain the exercise intolerance experienced by hyperthyroid patients. In addition, hyperthyroid patients and control subjects could be distinguished by the MSE CI computed from MSE analysis of heart rate dynamics.
1. Introduction
Hyperthyroidism is a clinical syndrome resulting from excessive thyroid hormones in the body. Patients with hyperthyroidism present symptoms and signs induced by a hypermetabolic state due to the action of the excessive thyroid hormones. Palpitation and tachycardia are frequent cardiac manifestations in hyperthyroid patients. Studying heart rate dynamics would help understand the effects caused by a hyperkinetic heart in patients with hyperthyroidism. Previous studies mainly used linear analyses of heart rate variability (HRV) to investigate the heart rate dynamics in hyperthyroid patients [1,2,3]. However, human physiological regulating systems consist of multiple mutually interacting controlling loops and operate under a nonlinear mechanism. Using linear HRV analysis alone might not fully elucidate the characteristics of the heart rate dynamical system in hyperthyroidism.
A complex system consists of many components interacting with each other and their environment in multiple ways. A physiological system is composed of many mutually, nonlinearly interacting parts, and it has the adaptability to finely adjust itself to accommodate internal or external environmental changes. Biological physiological systems including the heart rate dynamical system have the characteristics of complex systems and could be regarded as complex systems [4]. In general, complex systems could be characterized by their system complexity.
Multiscale entropy (MSE) analysis has been utilized to quantify the complexity of complex systems [5]. The MSE complexity index (CI) computed from MSE analysis indicates the system complexity [6]. A decreased MSE CI reflects reduced system complexity. The analysis of MSE has been adopted to investigate the complexity of human physiological dynamical systems such as heart rate [5,7,8,9,10,11,12], electroencephalogram (EEG) [13,14,15,16,17,18], gait [19], posture [6,20,21], and others [22] in various kinds of patients. These studies have observed a common phenomenon, that reduced complexity for the studied systems is related to disease or aging.
Hyperthyroid patients have an impaired heart rate dynamical system, as evidenced by previous HRV studies [1,2,3]. Up to the present, there has not been a study in using MSE analysis to investigate the heart rate dynamical system in patients with hyperthyroidism. The study objective was to use MSE analysis to compare the system complexity of heart rate dynamics between the hyperthyroid patients and the control subjects. We hypothesized that the system complexity of heart rate dynamics is reduced in the hyperthyroid patients.
2. Methods
2.1. Subjects
From the outpatient clinic of a teaching hospital, we enrolled 37 newly diagnosed hyperthyroid Graves’ disease patients and 37 healthy normal control subjects. The hyperthyroid patients and the control subjects were matched for age (30 ± 1 versus 29 ± 1 years, hyperthyroid versus control, means ± SE), sex (4 males and 33 females versus 4 males and 33 females), and body mass index (20.8 ± 0.4 versus 22.0 ± 0.5 kg/m2). Graves’ disease was diagnosed based on clinical manifestations, thyroid function tests, immunological autoantibody tests, and thyroid scintigraphy with uptake data. We excluded individuals with cardiovascular disease, cardiac arrhythmia, pregnancy, and diabetes, and those with medication in use. The local institutional review board approved the study protocol, and informed consent was obtained from all participants. The study was performed in accordance with the principles in the Declaration of Helsinki.
2.2. Study Protocol and Procedures
All participants assured not taking alcoholic or caffeine-containing drinks for at least one day before the measurement. After 5 min rest, all participants received one-channel electrocardiography in lying for 30 min in a quiet room during daytime. Participants were regulated to breathe naturally and to fully relax, as well as not to speak and not to fall asleep during the process of electrocardiogram (ECG) recording. For the hyperthyroid patients, ECG recording was performed after diagnosis and before receiving any treatment. The analog ECG recorded from the electrocardiograph was immediately digitized by a 16-bit analog-to-digital converter using 500 Hz sampling frequency and was stored into a personal computer for further off-line analysis. The R waves were located first. Subsequently, premature beats and artifacts were deleted. The ECG recordings were excluded if the deletion percentage was >5%. The time intervals measured from the consecutive adjacent R waves were resampled at 4 Hz to obtain a sequence of normal R-R intervals for subsequent analysis.
2.3. Linear Analysis
From the normal R-R interval sequence, the time domain parameters of HRV: mean R-R interval, standard deviation of the R-R intervals (SDNN), and root mean square of successive differences between adjacent R-R intervals (RMSSD) as well as the frequency domain parameters of HRV: Total power (TP) (0–0.5 Hz), very low frequency power (VLF) (0–0.04 Hz), low frequency power (LF) (0.04–0.15 Hz), high frequency power (HF) (0.15–0.5 Hz), LF in normalized units (LF%), HF in normalized units (HF%), and the ratio of LF to HF (LF/HF) were computed by a self-developed software coded in MATLAB according to the HRV Task Force guideline [23].
2.4. Multiscale Entropy Analysis
In general, the MSE analysis of an ordered sequence (the normal R-R interval sequence for our study) includes three steps [5].
First, from a total n points sequence, , we constructed a set of consecutive coarse-grained sequences by the equation
where τ is the scale factor, M is the given largest scale factor, and is the length of each coarse-grained sequence. Thus, from the original sequence, we obtained a total of M coarse-grained sequences.
Second, we calculated sample entropy for each coarse-grained sequence [24]. By given a template length m and a tolerance level r, sample entropy S is calculated as
where is the probability that two m length sequences are similar within a tolerance level r, and is the probability that two m + 1 length sequences are similar within a tolerance level r. Additionally, these probability does not count self-matches. Therefore, we would obtain the sample entropy for the corresponding scale factor.
Third, we calculated MSE CI [6] by summing sample entropy from τ = 1 to τ = M as
where Sτ is the sample entropy corresponding to the scale factor τ. For the calculation of sample entropy, we chose m = 2 and r = 0.15 of the standard deviation of the original sequence. In addition, the largest scale factor was set at M = 9 [24]. A self-developed software coded in MATLAB was used for MSE analysis.
2.5. Assays
In response to one of the anterior pituitary hormones, the thyroid-stimulating hormone (TSH), the thyroid gland secretes the thyroid hormones triiodothyronine (T3) and thyroxine (T4). In clinical practice, serum or plasma thyroid hormone measurement includes the free T3 (FT3) (and/or free T4 (FT4)) which is the T3 (and/or T4) not bound with proteins and the total T3 (T3) (and/or total T4 (T4)), which is the total amount of both bound and unbound T3 (and/or T4). Serum T3, T4, FT3, FT4 and TSH were quantified using a luminescent immunoassay (Vitros assay, Ortho-Clinical Diagnostics, UK).
2.6. Statistical Analysis
Comparisons of parameters for heart rate dynamics between the hyperthyroid patients and the control subjects were performed with the Mann–Whitney U test. Correlations were calculated by Spearman’s correlation coefficient. A p-value < 0.05 was considered significant. Data were expressed as means ± SE. The statistical software SPSS version 20.0 (IBM, Armonk, NY, USA) was used to analyze the data.
3. Results
High serum concentrations of thyroid hormones T3 (8.74 ± 0.45 nmol/L), (1.49–2.60, reference range); T4 (263.7 ± 9.1 nmol/L), (71.2–141); FT3 (30.43 ± 0.98 pmol/L), (4.26–8.10); FT4 (71.9 ± 2.7 pmol/L), (10.0–28.2); and a low serum concentration of TSH (0.006 ± 0.002 mIU/L), (0.465–4.68) were noted in the hyperthyroid patients.
The 30 min R-R interval tachograms and the MSE plots in a control subject and in a hyperthyroid patient are shown in Figure 1. The hyperthyroid patient compared with the control subject presented a grossly lesser fluctuation in the R-R interval tachogram (Figure 1). By plotting sample entropy to a scale factor from 1 to 9, the MSE plot was obtained. Corresponding to each scale factor in the MSE plots, the sample entropy was decreased in the hyperthyroid patient compared with the control subject (Figure 1).
The hyperthyroid patients exhibited significant differences (p < 0.001) as compared with the control subjects in the following heart rate dynamics parameters: decrease of mean R-R interval, SDNN, RMSSD, TP, VLF, LF, HF, and HF%; increase of LF% and LF/HF (Table 1). Moreover, the hyperthyroid patients compared with the control subjects revealed a lower MSE CI (hyperthyroid patients 10.21 ± 0.37 versus control subjects 14.08 ± 0.21, p < 0.001, Table 1).

Table 1.
Parameters of heart rate dynamics in control subjects and hyperthyroid patients.
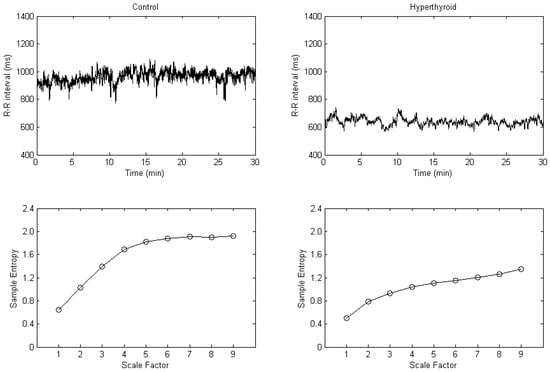
Figure 1.
R-R interval tachograms (upper) and multiscale entropy plots (lower) in a control subject (left) and in a hyperthyroid patient (right).
The average MSE plot of the control subjects and the hyperthyroid patients is shown in Figure 2. Corresponding to each scale factor, the mean of the sample entropy was calculated for all the control subjects and for all the hyperthyroid patients, respectively. The hyperthyroid patients (n = 37) compared with the control subjects (n = 37) exhibited lesser means of the sample entropy in all the scale factors from 1 to 9 (Figure 2 and Table 1).
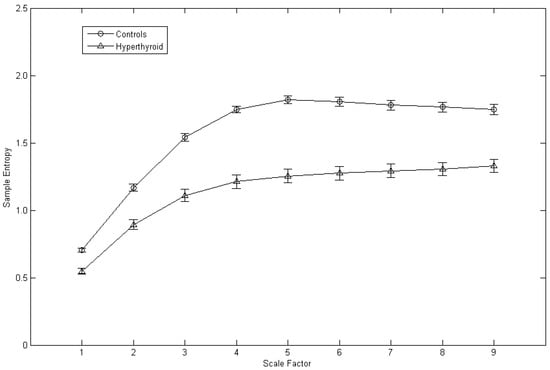
Figure 2.
Average multiscale entropy plot of the control subjects (n = 37) and the hyperthyroid patients (n = 37). Symbols (circles for the control subjects and triangles for the hyperthyroid patients) represent the means of sample entropy with respect to scale factor in each group. Bars represent the standard error of the mean.
For correlation analysis, MSE CI was negatively correlated with the serum concentrations of thyroid hormones T3 (r = −0.485, p = 0.002), T4 (r = −0.540, p = 0.001), FT3 (r = −0.382, p = 0.020), and FT4 (r = −0.576, p < 0.001) in the hyperthyroid patients.
4. Discussion
Our results showed a decreased MSE CI in the hyperthyroid patients compared with the control subjects via MSE analysis of the heart rate dynamical system. Such a finding suggests that the system complexity of heart rate dynamics is reduced in hyperthyroidism.
Hyperthyroidism presents symptoms and signs resembling those of a hyperadrenergic state. In addition, patients with hyperthyroidism manifest palpitation, tachycardia, and a higher prevalence of atrial fibrillation. The analysis of HRV offers a sensitive and non-invasive tool for the assessment of autonomic control of the heart [23,25,26]. In particular, the spectral analysis of HRV could correlate the respective effects of sympathetic and vagal control of the heart to different spectral powers, as indicated by the HRV spectrum [23,25]. Previous studies used the analysis of HRV to characterize the heart rate dynamics in the hyperthyroid patients. These studies mainly used a linear analysis of HRV and found that hyperthyroidism is characterized by both increased sympathetic and decreased vagal modulations of heart rate [2,3]. Our results of the linear HRV analysis are consistent with this finding, which might explain the apparent hyperadrenergic manifestations in patients with hyperthyroidism. However, similar to other physiological systems, the heart rate dynamical system is nonlinearly regulated by many mutually interacting systems such as neural, endocrine, etc. The method of nonlinear signal analysis would give new insight into the understanding of the heart rate dynamical system.
The heart rate dynamical system, a neuroautonomically regulated system, has the characteristics of complex systems and is regarded as a complex system [4]. In general, system complexity has been used to characterize complex systems. The complexity of a physiological complex system reflects its adaptability to the environment [4]. A healthy physiological system would have proper adaptability, similar to a robust complex system that could finely tune itself to perturbations. In response to internal or external changes to the system, a healthy physiological system could reactively adjust its states to adapt stressors and form a relatively stable homeostatic state. By contrast, a pathologic or aging system, due to the disruption of the regulating loop, would have impaired adaptability to stimuli and could not adequately respond to the changes. The system would not be able to maintain a homeostatic state and would reveal a reduced system complexity.
The MSE analysis, a nonlinear signal analysis, has been used to quantify the complexity of complex systems [5]. It computes the sample entropy [24] of a set of signals generated after manipulating the original time sequence signal with the coarse graining technique [5]. Afterwards, MSE CI is obtained by summing all sample entropy over several defined scale factors [6]. It denotes the system complexity of the original time sequence. A signal presenting lesser irregularity over multiple time scales would have decreased MSE CI and thus indicates reduced system complexity. For a physiological complex system, a reduced system complexity reflects the impaired adaptability of the system.
Using the analysis of MSE, a reduced system complexity of heart rate dynamics has been noted in patients with heart failure [11], diabetes [27], chronic kidney disease [28], major depression [29,30], stroke [31], as well as in aging [5], etc. Moreover, previous MSE analysis studies showed that reduced system complexity of heart rate dynamics could predict mortality in patients with trauma [32], congestive heart failure [33], and chronic kidney disease receiving dialysis [34,35]. In addition, MSE analysis of heart rate dynamics could predict stroke-in-evolution in acute ischemic stroke patients [10].
With MSE analysis, we are the first to show that hyperthyroid patients compared with control subjects exhibited a decreased MSE CI in their heart rate dynamics. The decreased MSE CI signifies the increased repetitions of heart rate fluctuating patterns in the heart rate sequence and therefore indicates a reduced system complexity of heart rate dynamics in patients with hyperthyroidism. Furthermore, this implies that the adaptability of the heart rate dynamical system is impaired in the hyperthyroid patients. Our findings are in agreement with previous MSE analysis studies and support the viewpoint that reduced complexity is related to disease and aging.
This reduced system complexity of heart rate dynamics could be attributed to the sustained stimulation of the excessive thyroid hormones on the heart in the hyperthyroid patients. This continuing stimulation leads to the impairment of the reactivity of the heart, and makes the hyperthyroid heart not able to respond adequately to additional external stimuli. Due to the impaired adaptability of the heart rate dynamical system, the hyperthyroid patients could not tolerate the exercise intensity that fits for normal subjects. Therefore, they exhibit exercise intolerance. In addition, our results showed that the MSE CI computed from the MSE analysis of the heart rate dynamical system could differentiate hyperthyroid patients from the control subjects. Future studies could be designed to justify whether MSE CI could be utilized as an indicator for monitoring therapeutic effects in the hyperthyroid patients.
For the correlation study, the MSE CI revealed significant negative correlations with the serum concentrations of all the thyroid hormones T3, T4, FT3, and FT4 in patients with hyperthyroidism. This discloses that MSE CI could indirectly signify the degree of the hyperthyroid state in the hyperthyroid patients.
There are several limitations to the present study. First, the case number is small in this study. This might interfere with the statistical power of the results. Second, we enrolled only hyperthyroid Graves’ disease patients and excluded other etiologies of the hyperthyroid patients. The results of this study should be inferred cautiously with other hyperthyroid patients.
In conclusion, besides cardiac autonomic dysfunction, decreased MSE CI was noted in the hyperthyroid patients compared with the control subjects. Such a finding suggests that the system complexity of heart rate dynamics is reduced in hyperthyroidism. Moreover, it implies that the adaptability of heart rate regulating system is impaired in hyperthyroid patients. Additionally, it might explain the exercise intolerance experienced by hyperthyroid patients. In addition, hyperthyroid patients and control subjects could be distinguished by the MSE CI computed from MSE analysis of heart rate dynamics.
Author Contributions
Conceptualization, J.-L.C.; methodology, J.-L.C. and H.-S.S.; software, H.-M.W.; validation, J.-L.C., H.-S.S., S.-Y.P. and H.-M.W.; formal analysis, J.-L.C. and H.-M.W.; writing—original draft preparation, J.-L.C. and H.-S.S.; writing—review & editing, J.-L.C., H.-S.S., S.-Y.P. and H.-M.W. All authors have read and agreed to the published version of the manuscript.
Funding
This research received no external funding.
Institutional Review Board Statement
The study was conducted in accordance with the Declaration of Helsinki, and approved by the Institutional Review Board of China Medical University Hospital, Taiwan (2004).
Informed Consent Statement
Informed consent was obtained from all subjects involved in the study.
Data Availability Statement
The data presented in this study are available on reasonable request from the corresponding author. The data are not publicly available due to ethics and privacy.
Conflicts of Interest
The authors declare no conflict of interest.
References
- Cacciatori, V.; Bellavere, F.; Pezzarossa, A.; Dellera, A.; Gemma, M.L.; Thomaseth, K.; Castello, R.; Moghetti, P.; Muggeo, M. Power spectral analysis of heart rate in hyperthyroidism. J. Clin. Endocrinol. Metab. 1996, 81, 2828–2835. [Google Scholar]
- Burggraaf, J.; Tulen, J.H.; Lalezari, S.; Schoemaker, R.C.; De Meyer, P.H.; Meinders, A.E.; Cohen, A.F.; Pijl, H. Sympathovagal imbalance in hyperthyroidism. Am. J. Physiol. Endocrinol. Metab. 2001, 281, E190–E195. [Google Scholar] [CrossRef]
- Chen, J.-L.; Chiu, H.-W.; Tseng, Y.-J.; Chu, W.-C. Hyperthyroidism is characterized by both increased sympathetic and decreased vagal modulation of heart rate: Evidence from spectral analysis of heart rate variability. Clin. Endocrinol. 2006, 64, 611–616. [Google Scholar] [CrossRef]
- Peng, C.-K.; Costa, M.; Goldberger, A.L. Adaptive data analysis of complex fluctuations in physiologic time series. Adv. Adapt. Data Anal. 2009, 1, 61–70. [Google Scholar] [CrossRef] [PubMed]
- Costa, M.; Goldberger, A.L.; Peng, C.-K. Multiscale entropy analysis of biological signals. Phys. Rev. E Stat. Nonlin. Soft Matter Phys. 2005, 71, 021906. [Google Scholar] [CrossRef] [PubMed] [Green Version]
- Costa, M.; Priplata, A.A.; Lipsitz, L.A.; Wu, Z.; Huang, N.E.; Goldberger, A.L.; Peng, C.-K. Noise and poise: Enhancement of postural complexity in the elderly with a stochastic-resonance-based therapy. Europhys. Lett. 2007, 77, 68008. [Google Scholar] [CrossRef] [PubMed] [Green Version]
- Norris, P.R.; Stein, P.K.; Morris, J.A., Jr. Reduced heart rate multiscale entropy predicts death in critical illness: A study of physiologic complexity in 285 trauma patients. J. Crit. Care 2008, 23, 399–405. [Google Scholar] [CrossRef]
- Papaioannou, V.E.; Chouvarda, I.; Maglaveras, N.; Dragoumanis, C.; Pneumatikos, I. Changes of heart and respiratory rate dynamics during weaning from mechanical ventilation: A study of physiologic complexity in surgical critically ill patients. J. Crit. Care 2011, 26, 262–272. [Google Scholar] [CrossRef] [PubMed]
- Yang, A.C.; Tsai, S.-J.; Yang, C.-H.; Kuo, C.-H.; Chen, T.-J.; Hong, C.-J. Reduced physiologic complexity is associated with poor sleep in patients with major depression and primary insomnia. J. Affect. Disord. 2011, 131, 179–185. [Google Scholar] [CrossRef] [PubMed]
- Chen, C.-H.; Huang, P.-W.; Tang, S.-C.; Shieh, J.-S.; Lai, D.-M.; Wu, A.-Y.; Jeng, J.-S. Complexity of heart rate variability can predict stroke-in-evolution in acute ischemic stroke patients. Sci. Rep. 2015, 5, 17552. [Google Scholar] [CrossRef]
- Tsai, C.-H.; Ma, H.-P.; Lin, Y.-T.; Hung, C.-S.; Huang, S.-H.; Chuang, B.-L.; Lin, C.; Lo, M.-T.; Peng, C.-K.; Lin, Y.-H. Usefulness of heart rhythm complexity in heart failure detection and diagnosis. Sci. Rep. 2020, 10, 14916. [Google Scholar] [CrossRef]
- Zeiler, F.A.; Ercole, A.; Placek, M.M.; Hutchinson, P.J.; Stocchetti, N.; Czosnyka, M.; Smielewski, P. Association between physiological signal complexity and outcomes in moderate and severe traumatic brain injury: A CENTER-TBI exploratory analysis of multi-scale entropy. J. Neurotrauma 2021, 38, 272–282. [Google Scholar] [PubMed]
- Escudero, J.; Abasolo, D.; Hornero, R.; Espino, P.; Lopez, M. Analysis of electroencephalograms in Alzheimer’s disease patients with multiscale entropy. Physiol. Meas. 2006, 27, 1091–1106. [Google Scholar] [CrossRef] [PubMed] [Green Version]
- Takahashi, T.; Cho, R.Y.; Murata, T.; Mizuno, T.; Kikuchi, M.; Mizukami, K.; Kosaka, H.; Takahashi, K.; Wada, Y. Age-related variation in EEG complexity to photic stimulation: A multiscale entropy analysis. Clin. Neurophysiol. 2009, 120, 476–483. [Google Scholar] [CrossRef] [PubMed] [Green Version]
- Catarino, A.; Churches, O.; Baron-Cohen, S.; Andrade, A.; Ring, H. Atypical EEG complexity in autism spectrum conditions: A multiscale entropy analysis. Clin. Neurophysiol. 2011, 122, 2375–2383. [Google Scholar] [CrossRef] [PubMed]
- Weng, W.-C.; Chang, C.-F.; Wong, L.C.; Lin, J.-H.; Lee, W.-T.; Shieh, J.-S. Altered resting-state EEG complexity in children with Tourette syndrome: A preliminary study. Neuropsychology 2017, 31, 395–402. [Google Scholar] [CrossRef]
- Chu, Y.-J.; Chang, C.-F.; Weng, W.-C.; Fan, P.-C.; Shieh, J.-S.; Lee, W.-T. Electroencephalography complexity in infantile spasms and its association with treatment response. Clin. Neurophysiol. 2021, 132, 480–486. [Google Scholar] [CrossRef]
- Yu, W.-Y.; Low, I.; Chen, C.; Fuh, J.-L.; Chen, L.-F. Brain dynamics altered by photic stimulation in patients with Alzheimer’s disease and mild cognitive impairment. Entropy 2021, 23, 427. [Google Scholar] [CrossRef]
- Ahmadi, S.; Siragy, T.; Nantel, J. Regularity of kinematic data between single and dual-task treadmill walking in people with Parkinson’s disease. J. Neuroeng. Rehabil. 2021, 18, 20. [Google Scholar] [CrossRef]
- Busa, M.A.; Jones, S.L.; Hamill, J.; van Emmerik, R.E. Multiscale entropy identifies differences in complexity in postural control in women with multiple sclerosis. Gait Posture 2016, 45, 7–11. [Google Scholar] [CrossRef]
- O’Keeffe, C.; Taboada, L.P.; Feerick, N.; Gallagher, L.; Lynch, T.; Reilly, R.B. Complexity based measures of postural stability provide novel evidence of functional decline in fragile X premutation carriers. J. Neuroeng. Rehabil. 2019, 16, 87. [Google Scholar] [CrossRef] [Green Version]
- Chen, J.-L.; Chen, P.-F.; Wang, H.-M. Decreased complexity of glucose dynamics in diabetes: Evidence from multiscale entropy analysis of continuous glucose monitoring system data. Am. J. Physiol. Regul. Integr. Comp. Physiol. 2014, 307, R179–R183. [Google Scholar] [CrossRef] [PubMed] [Green Version]
- Task Force of the European Society of Cardiology and the North American Society of Pacing and Electrophysiology Heart rate variability: Standards of measurement, physiological interpretation and clinical use. Circulation 1996, 93, 1043–1065. [CrossRef] [Green Version]
- Richman, J.S.; Moorman, J.R. Physiological time-series analysis using approximate entropy and sample entropy. Am. J. Physiol. Heart Circ. Physiol. 2000, 278, H2039–H2049. [Google Scholar] [CrossRef] [PubMed] [Green Version]
- Akselrod, S.; Gordon, D.; Ubel, F.A.; Shannon, D.C.; Berger, A.C.; Cohen, R.J. Power spectrum analysis of heart rate fluctuation: A quantitative probe of beat-to-beat cardiovascular control. Science 1981, 213, 220–222. [Google Scholar] [CrossRef]
- Sassi, R.; Cerutti, S.; Lombardi, F.; Malik, M.; Huikuri, H.V.; Peng, C.K.; Schmidt, G.; Yamamoto, Y. Advances in heart rate variability signal analysis: Joint position statement by the e-Cardiology ESC Working Group and the European Heart Rhythm Association co-endorsed by the Asia Pacific Heart Rhythm Society. Europace 2015, 17, 1341–1353. [Google Scholar] [CrossRef]
- Javorka, M.; Trunkvalterova, Z.; Tonhajzerova, I.; Javorkova, J.; Javorka, K.; Baumert, M. Short-term heart rate complexity is reduced in patients with type 1 diabetes mellitus. Clin. Neurophysiol. 2008, 119, 1071–1081. [Google Scholar] [CrossRef]
- Liu, S.-H.; Lo, L.-W.; Tsai, T.-Y.; Cheng, W.-H.; Lin, Y.-J.; Chang, S.-L.; Hu, Y.-F.; Chung, F.-P.; Chao, T.-F.; Liao, J.-N.; et al. Circadian rhythm dynamics on multiscale entropy identifies autonomic dysfunction associated with risk of ventricular arrhythmias and near syncope in chronic kidney disease. J. Cardiol. 2020, 76, 542–548. [Google Scholar] [CrossRef]
- Schulz, S.; Koschke, M.; Bar, K.J.; Voss, A. The altered complexity of cardiovascular regulation in depressed patients. Physiol. Meas. 2010, 31, 303–321. [Google Scholar] [CrossRef]
- Leistedt, S.J.; Linkowski, P.; Lanquart, J.P.; Mietus, J.E.; Davis, R.B.; Goldberger, A.L.; Costa, M.D. Decreased neuroautonomic complexity in men during an acute major depressive episode: Analysis of heart rate dynamics. Transl. Psychiatry 2011, 1, e27. [Google Scholar] [CrossRef]
- Tang, S.-C.; Jen, H.-I.; Lin, Y.-H.; Hung, C.-S.; Jou, W.-J.; Huang, P.-W.; Shieh, J.-S.; Ho, Y.-L.; Lai, D.-M.; Wu, A.-Y.; et al. Complexity of heart rate variability predicts outcome in intensive care unit admitted patients with acute stroke. J. Neurol. Neurosurg. Psychiatry 2015, 86, 95–100. [Google Scholar] [CrossRef] [PubMed] [Green Version]
- Riordan, W.P., Jr.; Norris, P.R.; Jenkins, J.M.; Morris, J.A., Jr. Early loss of heart rate complexity predicts mortality regardless of mechanism, anatomic location, or severity of injury in 2178 trauma patients. J. Surg. Res. 2009, 156, 283–289. [Google Scholar] [CrossRef] [PubMed]
- Ho, Y.-L.; Lin, C.; Lin, Y.-H.; Lo, M.-T. The prognostic value of non-linear analysis of heart rate variability in patients with congestive heart failure—A pilot study of multiscale entropy. PLoS ONE 2011, 6, e18699. [Google Scholar] [CrossRef] [PubMed] [Green Version]
- Tsai, C.-H.; Huang, J.-W.; Lin, C.; Ma, H.-P.; Lo, M.-T.; Liu, L.D.; Lin, L.-Y.; Lin, C.-T.; Hung, C.-S.; Peng, C.-K.; et al. Heart rhythm complexity predicts long-term cardiovascular outcomes in peritoneal dialysis patients: A prospective cohort study. J. Am. Heart Assoc. 2020, 9, e013036. [Google Scholar] [CrossRef] [PubMed]
- Liu, H.; Zhan, P.; Shi, J.; Hu, M.; Wang, G.; Wang, W. Heart rhythm complexity as predictors for the prognosis of end-stage renal disease patients undergoing hemodialysis. BMC Nephrol. 2020, 21, 536. [Google Scholar] [CrossRef]
Publisher’s Note: MDPI stays neutral with regard to jurisdictional claims in published maps and institutional affiliations. |
© 2022 by the authors. Licensee MDPI, Basel, Switzerland. This article is an open access article distributed under the terms and conditions of the Creative Commons Attribution (CC BY) license (https://creativecommons.org/licenses/by/4.0/).