Abstract
This paper addresses the allocation of indirect or joint costs among farm enterprises, and elaborates two maximum entropy models, the basic CoreModel and the InequalityModel, which additionally includes inequality restrictions in order to incorporate knowledge from production technology. Representing the indirect costing approach, both models address the individual-farm level and use standard costs from farm-management literature as allocation bases. They provide a disproportionate allocation, with the distinctive feature that enterprises with large allocation bases face stronger adjustments than enterprises with small ones, approximating indirect costing with reality. Based on crop-farm observations from the Swiss Farm Accountancy Data Network (FADN), including up to 36 observations per enterprise, both models are compared with a proportional allocation as reference base. The mean differences of the enterprise’s allocated labour inputs and machinery costs are in a range of up to ±35% and ±20% for the CoreModel and InequalityModel, respectively. We conclude that the choice of allocation methods has a strong influence on the resulting indirect costs. Furthermore, the application of inequality restrictions is a precondition to make the merits of the maximum entropy principle accessible for the allocation of indirect costs.
1. Introduction
The total cost of production—also called full cost, unit cost, or average cost—is a key item of information for managers for several reasons. Firstly, profitability is determined by examining the difference between output price and the total cost of production. Secondly, information of a complete cost structure is of great importance where costs must be reduced. Finally, total cost of production is a useful base for the benchmarking of companies or farms, as is the case for dairy farms in the International Farm Comparison Network (IFCN [1]).
Total cost of production should be known at decision level—i.e., enterprise level, also called “production branches” or “activities”. Given that most Swiss farms have several enterprises (e.g., Wheat, Potatoes or Grassland), two components—direct and indirect costs—need to be distinguished. While direct or variable costs such as seeds or pesticides are available at an enterprise level for farms of the Swiss Farm Accountancy Data Network (FADN), indirect or joint costs such as labour or machinery costs are only available at a farm level. Accordingly, the allocation of indirect costs is necessary.
The literature provides an approach called indirect costing [2], which allocates indirect costs for all enterprises by means of allocation bases, also denoted as cost drivers (e.g., [3,4] or [5]). Drury [3] points out that volume-based allocation bases are frequently used, and distinguishes between physical measures (e.g., number of units) and measures indicating the ability to absorb indirect costs, such as market values of products. In the case of agriculture, the allocation bases used should reflect the marginal factor cost such as acreage, (working) hours, or number of (output) units [6]. For example, if available, Agri Benchmark prefers machine runtime-hours as an allocation base for machinery costs of crop enterprises [7].
As a specific form of indirect costing, activity-based costing (ABC) focuses on activities (e.g., machine services), rather than enterprises. In ABC, the cost-allocation base is a measure of the activity performed [4]. Drury [3] emphasises that ABC systems use both volume-based (e.g., units of output) and non-volume-based (e.g., number of set-ups or batches in the industrial manufacturing) cost drivers. For example, Carli et al. [8] apply ABC for arable crops, while Wouters and Stecher [9] provide an application for industrial manufacturing.
In indirect costing, the allocation itself is usually performed in a proportional manner. Although widely applied and sometimes not even mentioned, it implies a fairly strong assumption because all enterprises or activities are treated identically. In practice, the higher the allocation base, the greater are the opportunities to alter costs. Furthermore, when analysing several farms with the same allocation bases, proportional allocation implies that the ratio of a specific indirect cost item between enterprises is identical for all farms (e.g., the machinery costs of Sugar Beet will be 1.8 times the machinery costs of Wheat).
Basically, the challenge of indirect costing is to deal with the missing information that would be needed for the true cost allocation, meaning the exact documentation of all indirect cost items. For example, the working hours of all labour forces must be documented separately for all enterprises, which would require an excessive effort. To our knowledge, maximum entropy as a method to overcome data gaps has never been applied for this challenge at the individual-company or the individual-farm level. This paper contributes to the literature by elaborating two maximum entropy models grounded on allocation bases as alternatives to indirect costing. Furthermore, the results of both models are compared with a Proportional allocation as reference base.
It is important to mention that the literature provides numerous contributions for a topic related to cost allocation at the individual-farm level, namely the estimation of indirect costs of a composite of farm observations. Typically, these analyses are designed for agricultural policy modelling purposes, and do not address the single farm but rather the average farm. They interpret the deviation of an individual farm from the estimated indirect costs as an error term, while analyses at individual-farm level allocate all indirect costs completely among enterprises. From a methodological point of view, the analyses of a composite of farms can be divided into three approaches, with maximum entropy being the most prominent. Léony et al. [10], Peeters and Surry [11,12], as well as Fragoso and da Silva Carvalho [13,14] use generalised maximum entropy (GME) to derive input-output coefficients, also called cost-allocation coefficients or production coefficients, indicating the costs of inputs per unit of output value (e.g., seeds equals 7% of the output value of Wheat). Garvey and Britz [15] estimate more than twenty cost items per hectare or animal head (as enterprises’ activity levels) by means of GME. Lence and Miller [16] present a generalised cross-entropy approach to estimate enterprise-specific input allocations. Apart from the applications of maximum entropy, a second approach consists of regression techniques. Using the general cost of production model (GECOM [17]), Kleinhanss et al. [18] and Tiberti [19]) estimates input-output coefficients. Moxey and Tiffin [20], and Griffiths et al. [21] use constraint estimations for input-output coefficients and cost shares of inputs, respectively. Desbois et al. [22] apply quantile regressions to estimate the cost of plant protection per hectare and per Euro 1000.- of turnover for crop enterprises. Finally, as a third approach to address cost allocation, Arfini et al. [23] estimate the total variable costs per tonne of crop outputs by means of positive mathematical programming (PMP).
The paper is organised as follows: the Methods section starts with the usual Proportional indirect-cost allocation at the individual-farm level, which represents the widely used approach of indirect costing and builds the reference base for comparisons (Section 2.1). Furthermore, it outlines the maximum entropy CoreModel (Section 2.2), as well as an extension, including inequality restrictions (InequalityModel, Section 2.3). Finally, to assess the performance of both maximum entropy models, a specific comparison and an intermediate test are outlined (Section 2.4). Section 3 describes the data used for the illustrative application from the Swiss Farm Accountancy Data Networks (FADN). Section 4 presents the resultant indirect costs of both the maximum entropy models and the Proportional cost allocation, as well as the intermediate test results, and Section 5 sets out our discussion and conclusions.
2. Methods
For simplicity, this section focuses on one cost item (e.g., machinery costs) on one particular farm observation (one year’s accountancy). For the following empirical illustration (Section 3 and Section 4), the model needs to be solved for each cost item and every farm observation separately.
2.1. Proportional Allocation
Let us assume that the farm under consideration produces i arable crops (i = 1, 2,…, I). An arable crop is considered as an enterprise (e.g., Wheat). Each crop i is grown on an area xi, measured in hectares. From the accountancy figures (actual costs), we know the observed total indirect costs c, i.e., and the total machinery costs at a farm level in Swiss Francs (CHF). As a result of the indirect-cost allocation, we are looking for βi, the (machinery) cost in CHF per hectare of crop i. Accordingly, c can be formulated as the sum of all enterprises’ costs:
For the allocation of indirect costs, we use the standard costs μi as allocation bases. Standard costs indicate the costs of the usual production techniques applied in an efficient manner (e.g., machinery cost per hectare of Wheat) representing a normative perspective, and are normally supplied by the farm-management literature as planning data. We have opted for standard costs over other potential allocation bases such as acreage or machine runtime-hours because they represent indirect costs in a comprehensive manner. Physical allocation bases as an alternative bear the risk of an incomplete representation of indirect costs. For instance, for machinery costs, the machine runtime-hours as an allocation base do not differentiate between the sizes in terms of investment of the used machinery (e.g., harrow or potato harvester).
Based on the allocation bases μi and the areas xi, the farm-wide standard costs s can be calculated, representing the costs we would expect from a farm, which is perfectly in line with management literature.
The coefficient alpha (α) is defined as the relation between actual costs (c) and standard costs (s):
Because c and s are denoted in the same unit (e.g., CHF), α lacks a dimension. Furthermore, α can be used as an aggregated cost indicator. A value above/below 1 would indicate exaggerated/reduced costs. Accordingly, the difference between α and 1 indicates the deviation of a particular farm observation from the suggested standard costs in farm-management literature.
Under a Proportional indirect-cost allocation, α serves as adjustment factor, transforming all allocation bases μi equally:
The relation between βi and μi is equal to α for all enterprises (i), highlighting the uniform treatment of all enterprises under a Proportional allocation.
Figure 1 graphically illustrates a Proportional indirect-cost allocation and underscores the transformation of allocation bases. Specifically, the horizontal axis depicts the size of the allocation base per hectare. For two crops—Grassland (G) and Potatoes (P)—the cost allocation is depicted with Potatoes, representing a crop with a markedly higher allocation base. The resulting or allocated indirect costs per hectare are reported on the vertical axis. If we assume that the farm as a whole has lower costs than suggested by the farm-management literature (α < 1), the Proportional line, whose slope is equal to α, lies below the angle bisector (45°). According to Equation (4), the allocation bases μGrassland and μPotatoes are transformed to βG_Prop and βP_Prop, respectively.
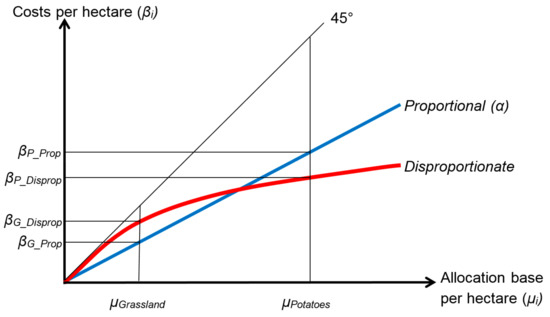
Figure 1.
Proportional and disproportionate indirect cost allocation. G = Grassland; P = Potatoes; Prop = Proportional; Disprop = disproportionate.
2.2. Core Maximum Entropy Model
For the formulation of the core maximum entropy model (CoreModel), we follow the basic maximum entropy principle outlined by Golan et al. [24] (Chapters 3 and 5). The CoreModel’s purpose is to derive the indirect cost of enterprise i (βi) for one cost item (i.e., machinery). Because allocation bases (μi) refer to the hectare level, the model focuses on the individual-hectare level. As a consequence, for the model specification, each individual hectare of crop i is treated as an independent activity. Accordingly, the number of hectares is crop specific and denoted as N(i), while j refers to the individual hectare’s number (j = 1, 2,…, N(i)). Assuming that N(i) is an integer, the individual hectares of crop i are denoted as xi,j:
βi, the resulting cost per hectare, is provisionally defined for each hectare individually as βi,j. Accordingly, Equation (1) for the farm-wide costs c needs to be reformulated:
We assume that βi,j lies in a range of μi ± μi, or in an interval between 0 and 2μi. Because costs must be positive, we restrict the range to positive values. As suggested by Golan et al. [24] (Chapter 8), five support points (zi,k; K = 5) are defined within the range [0, 0.5μi, μi, 1.5μi, 2μi]. Because we have no prior information about the probabilities of the support points, we apply this uniform distribution. In a cross-entropy application, the prior probabilities of support points may vary. As a consequence, the presented application belongs to maximum entropy, a special case of the cross-entropy formulation [24].
Because support points (zi,k) do not differ between the different hectares of crop i, the hectare-wise distinctions need not be considered. Each support point k of all hectares j of all enterprises i has a probability denoted as pi,j,k. Each βi,j is defined as a weighted sum of its support points times probabilities:
For each hectare j, the probabilities must add up to 1:
Maximising the Shannon Entropy measure H allows us to determine the probabilities pi,j,k:
Given that the support points within the different hectares of a specific crop are identical, the resultant probabilities must also be identical for all hectares j:
Consequently, Equation (8) can be reformulated, which facilitates the subsequent model formulation:
The fact that the resulting probabilities of all hectares of a particular crop are equal leads to a further simplification:
Thus, Equation (7) is reformulated as follows:
Equation (6) can also be formulated differently, using Equations (5) and (12), which leads again to Equation (1). Finally, the Shannon Entropy measure H (Equation (9)) is reformulated, making use of Equation (5):
The variable xi serves in Equation (14) as a weighting factor that takes account of the differing numbers of hectares of the farm’s enterprises.
In terms of support points, we must bear in mind that some farms may have actual costs far exceeding standard costs, as indicated by the farm-management literature. In other words, the above-mentioned interval may not be wide enough to allow for a feasible solution. Therefore, the expansion coefficient theta (θ) is defined, which depends on the coefficient alpha (α, Equation (3)):
If the actual costs are lower than, or equal to standard costs (α ≤ 1), the support points are in an interval between 0 and 2μi. For farms with higher costs, the range is extended to (1 + α)μi. Keeping the symmetrical structure, the support points are 0, 0.25θμi, 0.5θμi, 0.75θμi, and θμi, respectively. The case differentiation for θ allows for a feasible solution for all farms. Furthermore, it ensures a continuous treatment for farm observations with a value of α around 1.
Equations (1), (11) and (13)–(15) constitute the foundation of the maximum entropy cost-allocation model, even allowing the use of non-integer values for crop areas xi. Together they form the CoreModel and are summarised in the Appendix A.
Because the model is solved for all indirect cost items and all farms, all equations must be expanded by both dimensions—that is, cost items and farm observations. The CoreModel is formulated in the General Algebraic Modeling System (GAMS [25]) and relies on the model code of a cross-entropy application for input-output tables by Robinson and El-Said [26]. The sequential (farm observation-wise) solving procedure is organised by the loop command of GAMS.
Returning to the indirect-cost allocation issue, the question arises as to how the CoreModel differs from a Proportional cost allocation. The outcome of a maximum entropy model is the optimal solution in terms of the probability distribution. Accordingly, the Shannon Entropy measure H (Equation (14)) reaches its maximum value when the distribution of all probabilities pi,k is uniform. Thus, the maximum is attained when each of the support points of all crops is assigned the probability of 1/K, i.e., if βi is equal to the allocation base μi. In the case that α exceeds 1, βi would be equal to 0.5θμi. The approach therefore minimises the deviation from these values. For instance, if total costs c are smaller than what is suggested by the allocation bases (α < 1), the model must cause a reduction of the allocation bases. In absolute terms, a 1% probability shift has a stronger impact on a crop with a large allocation base (such as Potatoes) than on one with low costs (Grassland). In Figure 1, the adjustment by means of the CoreModel is roughly approximated by the line Disproportionate. Starting with the same allocation bases as used for the Proportional allocation, the results for Grassland and Potatoes are βG_Disprop and βP_Disprop, respectively. The resulting probability distribution leads to a disproportionate adjustment of allocation bases. Regarding the allocation of one cost item of one farm observation, all allocation bases are adjusted in either an increasing or diminishing direction according to the model specification. In other words, the line Disproportionate in Figure 1 never intersects the angle bisector (45°).
From a production technology perspective, a disproportionate adjustment addresses the allocation of indirect costs better than a Proportional adjustment for two reasons. Firstly, the higher the allocation base μi, the greater are the opportunities for altering costs in practice. Potatoes, for instance, incur much higher machinery costs than Grassland. If farm-wide machinery costs differ greatly from standard costs from farm-management literature, there are more possibilities on the field for adjusting machinery costs for Potatoes, because more operational steps are necessary (e.g., for plant protection and fertilisation). Secondly, there might be restrictions in terms of production technology, casting doubt on the reduction of small allocation bases in particular. For example, machinery cost of Fallow Land includes a once-a-year cutting or mulching. These minimal costs can hardly be undercut.
2.3. Inequality Restrictions
The disproportionate adjustment of the CoreModel can lead to a situation in which crops with large allocation bases (e.g., Potatoes) are so strongly reduced that they even undercut crops with small allocation bases (e.g., Grassland). In other words, the slope of the line Disproportionate in Figure 1 can become negative towards the far right. Such a result, which is only possible if the coefficient alpha has a low value, is useless from a production technology point of view. Generally speaking, there are fundamental relationships between crops, which should be reflected in the results at the farm level. The approach of imposing parameter inequality restrictions for maximum entropy models by Campbell and Hill [27] addresses such relationships and enables an extension of the CoreModel. For example, to ensure that the above mentioned inequality restriction βPotatoes > βGrassland is maintained, Equation (13) must be reformulated as follows:
Accordingly, βPotatoes consists of βGrassland and the sum of K support points, each multiplied by its probability. The support points y are related to the difference between allocation bases of the two crops (y(Potatoes-Grassland),k = zPotatoes,k − zGrassland,k), and must be greater than or equal to 0. To summarise, by introducing inequality restrictions, we basically break allocation bases down into several components.
Although it would be possible to define an inequality restriction for each crop, such a procedure would be inappropriate for two reasons. Firstly, the application would become very complex, because an inequality restriction would be required for each crop and each indirect cost item. Secondly, the rank order of crops is not necessarily identical for all farms. As an alternative to the single-crop treatment, we define groups of crops. The Campbell–Hill approach allows us to maintain the rank order between groups completely, while the rank order within groups may change. To form groups, we look for similar crops in terms of production technology and agronomical considerations (e.g., cereals or root crops). Consequently, group assignments are reflected in similar allocation bases. Generally speaking, differences within groups should be smaller than between groups. Within each group, one crop is singled out. The crop with the largest allocation base is termed the boundary of the group, and plays a crucial role in organising the allocation base components. All support points y refer to the boundary of the downward or lower group. All crops of the first group refer to 0, which is interpreted as the very first boundary. Accordingly, z and y are identical for the crops of the first group.
Linking the groups’ boundaries enables a clear upward/downward structure among groups, as depicted in Figure 2 for four groups. The first group comprises of Forest and Fallow Land, the crops with clearly smaller allocation bases (e.g., for machinery costs) than Oilseeds, Wheat, and Peas, which constitute Group 2. The latter is surpassed by the allocation bases of Grassland and Sugar Beet, which build Group 3. Finally, Group 4 includes Potatoes and Other Crops. However, the grouping might be different for other indirect cost items, such as labour.
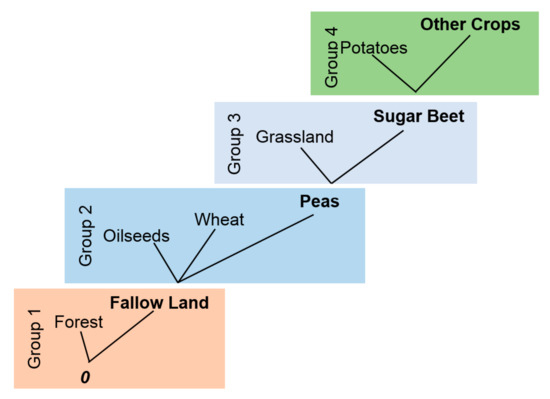
How does the upward/downward group structure contribute to our basic intention of calculating the indirect costs (βi) for crop i? βi consists of components coming from at least one group g (g = 1,…, G(i)). As an example, we focus on machinery costs of Sugar Beet, found in Group 3 (G = 3) of Figure 2. βSugar Beet will consist of three components: firstly, the indirect costs of the boundary of the first group (Fallow Land); secondly, the difference between the boundaries of Groups 2 and 1, i.e., Peas and Fallow Land, respectively; and finally, the difference between Sugar Beet and the boundary of Group 2, Peas. For Grassland, another crop of Group 3, the calculation is identical except the third component, which is related to the difference between Grassland and Peas. To summarise we are looking at all components g of crop i. Continuing our example, all three components of βSugar Beet (and similarly βGrassland) are based on five support points yi,g,k and their resulting probabilities pi,g,k. In total, we are looking for the probabilities of 15 support points for βSugar Beet. Generally speaking, we have to reformulate Equation (13) as follows:
At the same time, Equation (11) needs to be reformulated to hold for all crops and all groups:
Similarly to the reformulation of βi (Equation (17)), we have to consider all of the groups for the Shannon Entropy measure H:
The Campbell–Hill approach is represented by Equations (17)–(19). Together with Equations (1) and (15) from the CoreModel, they build the InequalityModel.
Although being complete, the model description is inconvenient for the data processing because the same calculations are carried out several times. For example, as illustrated in Figure 2, the probabilities of Fallow Land in Group 1 are relevant for all crops belonging to ‘upward’ groups, because Fallow Land is the boundary of the very first group. Similarly, the probabilities of Peas and Fallow Land (boundaries of Groups 2 and 1, respectively) are included in the β’s of all crops belonging to Groups 3 and 4. Generally speaking, the calculation of the boundaries’ probabilities can be summarised or pooled, taking into account that the same allocation base z, or difference of allocation bases y always comes up with the same result independent of the enterprise for which they are calculated.
As a consequence, we reformulate Equation (17) by distinguishing between the boundaries b of the downward groups (βb,G(i)−1), and the probabilities and support points of the last group G(i):
For example, the enterprise Peas in Figure 2 is involved in two groups (GPeas = 2). βPeas consists of the beta of the boundary of the downward group (GPeas − 1 = 1), e.g., βFallow Land. As a component of the second group, the probabilities and support points related to the difference of allocation bases between Peas and Fallow Land are considered. Please note that Peas is a boundary itself, the boundary of Group 2. Accordingly, βPeas equals βb,G(i)−1 for the enterprises Grassland and Sugar Beet in the equations for their βi’s.
Using the boundaries of downward groups as components of βi is also relevant for the Shannon Entropy measure. Instead of maximising all probabilities of all groups as it is the case in Equation (19), we can pool them by making two changes: Firstly, we concentrate on the probabilities of the last group G(i) for all enterprises. Secondly, we expand the weights or areas of the enterprises serving as boundaries. All boundaries incorporate the surfaces of themselves plus the surfaces of all enterprises that belong to “upward” groups. Accordingly, the weighting factor xi in Equation (19) is replaced by ui. For boundaries, ui also comprises all “upward” groups. For all non-boundary enterprises, ui equals xi. The necessary reformulation of Equation (19) is similar to the reformulation of Equation (9) to Equation (14) and results in:
The applied formulation of the InequalityModel consists of Equations (1), (15), (18), (20) and (21), and is summarised in the Appendix A. Because of the pooling process, Equation (18) needs to be considered only for the last group G(i) of enterprises.
2.4. Comparison of Applications
As the ‘true’ allocation of indirect costs is unknown, the results of the proposed maximum entropy applications CoreModel and InequalityModel are compared with the Proportional cost allocation, outlined in Equations (1)–(4) as a reference base. Furthermore, the performance of the two models is assessed by comparing just two crops, Potatoes and Grassland as illustrated in Figure 1. We check whether the results for machinery costs are greater for Potatoes than for Grassland, which would be in line with considerations based on the production technology. In addition, the ‘intermediate test’ systematically examines whether the rank order of crops according to their allocation bases is maintained during the indirect-cost allocation. In detail, the test compares the sizes of the resulting indirect costs (βi), as illustrated in Figure 3. The initial rank order given by the allocation bases (µi) is depicted on the horizontal axis, while the vertical axis indicates the resulting indirect costs (βi). Grassland—a crop with a relatively small (machinery) allocation base—is assigned the indirect costs βGrassland. Furthermore, βPotatoes is the resultant cost for Potatoes, a crop with a large allocation base. For every crop with an allocation base between Grassland and Potatoes, such as Sugar Beet (βSugar Beet), we expect an intermediate value between those for Grassland and Potatoes (βGrassland < βSugar Beet < βPotatoes). The intermediate test checks whether the βi’s are in a strict upward order for all triplet ratios fulfilling two preconditions: firstly, the farm must grow all three crops involved (xi > 0). Secondly, the allocation bases (μi) must be in a strict upward order (μ1 < μ2 < μ3). Given i crops, the number of analysed triplets per farm is i(i − 1)(i − 2)/(3!). After performing the test, we count the failed triplets. In addition, a case differentiation is necessary depending on whether knowledge from production technology is challenged. A failure due to the crops belonging to the same group, the first case, would not matter because the rank order within groups may change, as discussed in Section 2.3. The second case, a failure due to crops belonging to different groups, is a serious issue because results are contradicting production technology. By definition, the second case cannot appear in the InequalityModel while failures are expected in the CoreModel.
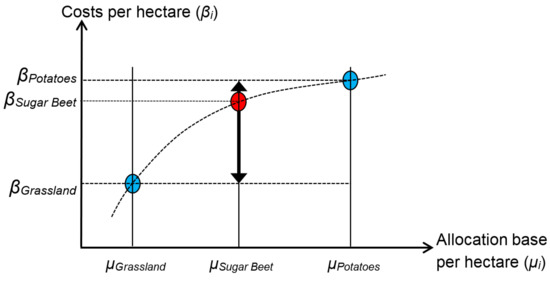
Figure 3.
Intermediate test.
3. Data
To compare the different indirect-cost allocations, we focus on the arable-crop farm type from the Swiss FADN [28]. Excluding farms with even a very limited level of animal husbandry, as well as farms markedly involved in agriculture-related activities such as direct sales, 36 farm observations from the accountancy years of 2007 and 2008 are available, while twelve farms contributed data for both years. We aggregate farm production activities into 12 enterprises, resulting in 235 available enterprise cases. There are between 7 and 36 cases available for each enterprise: Wheat, Barley, Maize (grain), Silage Maize, Potatoes, Sugar Beet, Oilseeds, Peas, Grassland, Fallow Land, Forest, and Other Crops including highly labour-intensive activities such as fruit production. Two indirect cost items are analysed:
- Labour input is reported in normal working days (NWD), including all work forces (family members and employed workers).
- Machinery costs include all costs in CHF related to farm-owned machines, as well as machinery services contracted from other farmers or companies.
For the allocation bases (μi), standard costs are taken from farm-management literature [29,30,31,32,33]. Table 1 presents the allocation bases of all enterprises and both indirect cost items. As is essential for the InequalityModel, crops are depicted in a strictly increasing order based on their allocation bases. Furthermore, the crops are assigned to four groups based on production technology considerations, taking account of the fact, that they differ markedly in costs of labour and machinery. For example, Forest and Fallow Land show relatively small costs for machinery, resulting in the same group assignment (Group 1). Conversely, Fallow Land needs over three times as much of the labour input as Forest, requiring an assignment to different groups. As a consequence, the upward/downward structure is implemented separately for each indirect cost item. The boundaries of the groups are shown in bold and italicised letters. Another column gives the differences of each crop to the boundary of the lower group.

Table 1.
Allocation bases for both indirect cost items.
4. Results
As a first result, farm-specific coefficients alpha (Equation (3)) are calculated for both indirect cost items on the basis of all 36 farm observations and allocation bases (Table 2). The mean value of labour input (measured in NWD) indicates that far more labour is used than suggested by the standard costs from the farm-management literature (α = 2.52). As regards machinery costs, the observed costs are 15% lower than the suggested. Looking at the extreme values, a marked variability can be observed. There are farms with very low machinery costs, while for labour the most extreme value for the coefficient alpha is beyond 9.
Table 2.
Coefficient alpha for both indirect cost items of 36 farm observations.
The results for the allocated indirect costs at the enterprise level are reported for each cost item separately, including the number of enterprise cases involved (Table 3). The table reports the resulting absolute mean values for all three allocation methods. In addition, the results of the two maximum entropy applications CoreModel and InequalityModel are also reported as deviations from a Proportional allocation in percent. Besides the mean deviation of all cases involved, the median, as well as the standard error of the deviations are indicated.
Table 3.
(a) Results for labour input measured in normal working days (NWD) per hectare; (b) Results for machinery costs in Swiss Francs (CHF) per hectare.
Considering that the farms in question use much more labour input (measured in NWD) than suggested by the farm-management literature, the allocated indirect costs (βi) exceed the allocation bases for all three allocation methods (Table 3a). For example, for Wheat the absolute mean result of the 33 farm observations involved for labour is 8.7 NWD for the Proportional allocation, which clearly exceeds the standard costs of 3.3 NWD (Table 1). The CoreModel shows an average of 8.2 NWD, with a mean deviation from the Proportional allocation of −7.1%. Generally speaking, the deviations from Proportional of CoreModel and InequalityModel are similar, although the deviations of the latter are typically smaller.
Looking at all of the deviations from the Proportional allocation, the resulting distinction between small and large allocation bases is obvious. For crops with small allocation bases such as Forest and Fallow Land, the mean deviations from Proportional are negative, indicating that the resulting labour inputs are smaller under the maximum entropy models. Conversely, Potatoes and Other Crops exhibit positive mean deviations, indicating larger resulting labour inputs than under the Proportional allocation. The mean deviations of enterprises’ labour inputs in the CoreModel allocation fall within a range of −18.9% (Forest) to +16.5% (Potatoes), and in the InequalityModel, within a range of −14.0% (Forest) to +14.3% (Other Crops). In respect of the mean differences in absolute numbers, the enterprises Potatoes and Other Crops are most strongly affected, with +6.9 NWD/hectare (44.4 NWD instead of 37.5 NWD) and +20.9 NWD/hectare (CoreModel) and +5.3 NWD/hectare and +20.5 NWD/hectare (InequalityModel), respectively.
Given an average coefficient alpha for machinery costs of 0.85 (Table 2), the allocated costs must be below the allocation bases, which correspond to the illustrated situation in Figure 1. For crops with small allocation bases (e.g., Forest, Fallow Land), both maximum entropy models lead to higher machinery costs than the Proportional allocation, expressed as positive deviations (Table 3b). Conversely, they show a more substantial reduction for Potatoes and Other Crops, the crops with the largest allocation bases, leading to negative deviations from the Proportional allocation. The mean deviations of CoreModel from the Proportional range between −34.8% (Other Crops) and +36.3% (Fallow Land), while those of InequalityModel range between −18.0% (Other Crops) and +20.5% (Forest). The largest absolute mean differences are presented again by the enterprises Potatoes and Other Crops, with CHF −734.-/hectare and CHF −990.-/hectare (CoreModel) and CHF −306.-/hectare and CHF −516.-/hectare (InequalityModel), respectively.
To examine the models’ performance, the comparison of machinery costs for Grassland and Potatoes is carried out for seven farm observations, growing both crops. The CoreModel allocation shows in two observations a failure, i.e., larger machinery costs for Grassland than Potatoes. Accordingly, the disproportionate adjustment leads to a severe reduction of the fairly large allocation bases for the machinery costs of Potatoes. Both farm observations that fail show low machinery costs for the entire farm; in fact, their corresponding coefficients alpha are less than or equal to 0.51. For the InequalityModel, Potatoes and Grassland are assigned to different groups for machinery costs (Table 1), ensuring that the rank order is respected. Hence, the comparison shows no failures at all.
The intermediate test is conducted for all 1189 triplet relationships, and examines whether the strict rank order as dictated by the allocation bases is guaranteed for the allocated indirect costs per hectare (βi). For the labour input, both models pass the test for all triplets. CoreModel fails for machinery costs for 149 triplets or 13%. Although there is no group assignment in CoreModel, we analyse how many of the failed triplets show a not-strict upward rank order between crops belonging to different groups according to the InequalityModel. This is the case for 127 triplets, or 11%. They also include all triplets that comprise Grassland and Potatoes from the above-mentioned comparison (e.g., the triplet Grassland-Sugar Beet-Potatoes; totally 13 triplets). The InequalityModel shows failures for 67 triplets (6%) for machinery costs. All of these triplets fail due to changes of the rank order of crops assigned to the same group, which is in line with the applied group-building concept.
5. Discussion and Conclusions
This paper elaborates on two maximum entropy applications—CoreModel and InequalityModel—for the allocation of indirect costs among enterprises at individual-farm level, using standard costs from farm-management literature as allocation bases.
Compared with the Proportional indirect-cost allocation, which is widely applied in the literature, the application of the maximum entropy principle leads to a disproportionate adjustment of allocation bases, reflecting a probability distribution in which large allocation bases face an over-proportional adjustment. The larger the allocation bases, the greater are the opportunities to adjust them on the field. As a result, the maximum entropy approach approximates indirect costing with reality.
We observe that the CoreModel tends to reduce large allocation bases excessively when indirect costs are appreciably lower than the standard costs from farm-management literature. According to the intermediate test, 11% of the analysed triplets call into question knowledge from production technology (e.g., higher machinery costs for Potatoes than for Grassland). As a consequence, the CoreModel cannot be considered for an empirical application. Adding inequality restrictions ensures that the rank order between groups of enterprises is maintained, and helps to overcome these shortcomings. The InequalityModel therefore allows the knowledge from production technology to be respected and enables the merits of the maximum entropy principle to be used for indirect costing at individual-farm level. Accordingly, the InequalityModel is recommended to provide indirect-cost at the enterprise level.
As indicated by the coefficient alpha, the data sample used represents a highly heterogeneous group of crop-farm observations from the Swiss FADN, and is ideal for test purposes. Both possibilities for the adjustment of allocation bases, i.e., to increase (for labour) and to reduce (for machinery cost) can be illustrated. Furthermore, the data sample used also enables us to show the different effects of a disproportionate cost allocation on crops with small (e.g., Forest) or large (e.g., Potatoes) allocation bases. Compared with the Proportional allocation, i.e., the reference base, the CoreModel and InequalityModel show deviations in a range of up to ±35% and ±20%, respectively. The standard errors and median values indicate that most enterprise cases are clearly influenced by the allocation method applied. In respect of absolute deviations measured in NWD/hectare or CHF/hectare, enterprises with large allocation bases are strongly affected (e.g., Potatoes and Other Crops). As a core conclusion, our results highlight that the choice of allocation method has a strong influence on the resulting indirect costs. Accordingly, the comparison of the InequalityModel as one potential alternative allocation method to the widely applied application of a Proportional allocation indicates that the latter constitutes an influential assumption. The proposed InequalityModel allows for it to be discarded and overcomes a uniform treatment of all enterprises in the indirect-cost allocation process. Based on the substantial differences between a Proportional allocation and the InequalityModel, we recommend using a disproportionate cost allocation for making (farm) management decisions and drawing policy conclusions.
By applying the same allocation bases to all farm observations in the presented analysis, the heterogeneity of farms and enterprises in terms of size and type of mechanisation is not addressed. Further work is needed to differentiate allocation bases of the individual enterprises. The presented analysis is restricted to crop enterprises. Given the relevance of animal production in Swiss agriculture, an expansion to enterprises of animal husbandry or agriculture-related activities such as direct sale is necessary. As a first application of the outlined method, full costs for all enterprises of Swiss dairy farms in the mountain region, including, among others, dairy-cow husbandry and sheep and goat farming, were derived [34]. Given that the FADN of some countries report direct costs such as plant protection costs on the farm level but not on the enterprise level, the allocation of direct cost items is a relevant topic (e.g., [18,19,22]). The InequalityModel could also be applied for these cost items because the standard costs of direct cost items are typically reported in gross margins calculations, and consequently widely available (e.g., [35,36]).
Compared with a Proportional allocation, the suggested approach is more costly and hence less suited to manual computing by farm managers. There are at least two ways to make the potential of the maximum entropy principle accessible for practice. Firstly, the InequalityModel could be incorporated into farm-management analyses based on FADN data carried out by research institutions. Secondly, the model could be a part of accounting software packages providing additional analytical tools besides the accounting for the tax declaration.
As far as we are aware, the presented work is the first analysis of different indirect-cost allocations methods at individual-farm or individual-company level. Given the importance of cost analysis in daily farm management or even general management, we expect the allocation of indirect costs to receive more attention in management research in future.
Acknowledgments
I would like to thank Daniel Hoop, Alexander Zorn, Pierrick Jan, Andreas Roesch, Swetlana Renner, Anke Schorr, Ali Ferjani, Frank Offermann, Werner Kleinhanss and four anonymous reviewers for their very helpful comments and suggestions; Dierk Schmid for data preparation; Robert Meier for multiple installations of GAMS; and IFPRI (Claudia Ringler) for hospitality during a research stay in Washington D.C. in 2011. The first application of the presented approach was published in 2014 [34] and was based on prior versions of the present paper, i.e., a conference paper from 2012 [37] and a working paper from 2014 [38].
Conflicts of Interest
The author declares no conflict of interest.
Appendix A
The following overview includes all equations with their numbers of both models, CoreModel and InequalityModel. The equations refer to one indirect-cost item (e.g., machinery costs) of one farm.
| CoreModel | InequalityModel |
| (1) (11) (13) (14) (15) | (1) (18) (20) (21) (15) |
Remark for the InequalityModel: Because of the pooling process, Equation (18) needs to be considered only for the last group G(i) of enterprise i.
| α | coefficient alpha (Equation (3)) |
| b | boundary |
| β | indirect cost item, e.g., machinery costs, in CHF per hectare |
| c | total indirect costs, e.g., machinery, in CHF |
| g | group of the upward/downward structure, (g = 1, ..., G(i)) |
| G(i) | the group of the last component of enterprise i |
| H | Shannon Entropy measure |
| i | arable crop, (i = 1, 2, ..., I) |
| k | support point, (k = 1, 2, ..., K) |
| p | probability of support point |
| u | area in hectares, corrected for boundaries, equal to x for all non-boundary enterprises |
| x | area in hectares |
| θ | expansion coefficient theta (Equation (15)) |
| y | support point (differences between z’s) |
| z | support point |
References
- Hemme, T. (Ed.) Dairy Report 2016 for a Better Understanding of the Dairy World; International Farm Comparison Network: Kiel, Germany, 2016. [Google Scholar]
- Ciaian, P.; Langrell, S.; y Paloma, S.G. (Eds.) Chapter 1. Introduction to Production Costs. In Sustainability and Production Costs in the Global Farming Sector: Comparative Analysis and Methodologies, Scientific and Policy Reports; Report EUR 25436EN; European Commission Joint Research Centre: Seville, Spain, 2012. [Google Scholar]
- Drury, C. Management and Cost Accounting, 6th ed.; Thomson: London, UK, 2004. [Google Scholar]
- Horngren, C.T.; Bhimani, A.; Datar, S.M.; Foster, G. Management and Cost Accounting, 3rd ed.; Prentice Hall: Harlow, UK, 2005. [Google Scholar]
- McLaney, E.; Atrill, P. Accounting an Introduction, 4th ed.; Prentice Hall: Harlow, UK, 2008. [Google Scholar]
- AAEA. Commodity Costs and Returns Estimation Handbook; A Report of the AAEA Task Force on Commodity Costs and Returns; American Agricultural Economics Association: Ames, IA, USA, 2000. [Google Scholar]
- Agri Benchmark. Cash Crop Report 2011; Agri Benchmark Cash Crop Network; Johann Heinrich von Thünen-Institute: Braunschweig, Germany, 2011. [Google Scholar]
- Carli, G.; Canavari, M.; Grandi, A. Introducing Activity-Based Costing in Farm Management: The Design of the FarmBO System. Int. J. Agric. Environ. Inf. Syst. 2014, 5, 69–84. [Google Scholar] [CrossRef]
- Wouters, M.; Stecher, J. Development of real-time product cost measurement: A case study in a medium-sized manufacturing company. Int. J. Prod. Econ. 2017, 183, 235–244. [Google Scholar] [CrossRef]
- Léony, Y.; Peeters, L.; Quinqu, M.; Surry, Y. The Use of Maximum Entropy to Estimate Input-Output Coefficients from Regional Farm Accounting Data. J. Agric. Econ. 1999, 50, 425–439. [Google Scholar] [CrossRef]
- Peeters, L.; Surry, Y.R. Farm Cost Allocation Based on the Maximum Entropy Methodology—The Case of Saskatchewan Crop Farms; Agriculture and Agri-Food Canada: Ottawa, ON, Canada, 2003. [Google Scholar]
- Peeters, L.; Surry, Y. Estimation d’un modèle à paramètres variables par la méthode d’entropie croisée généralisée et application à la répartition des coûts de production en agriculture. Insee—Actes des Journées de Méthodologie Statistique. 2005. Available online: http://jms.insee.fr/index.php?php_action=HISTO&id_histo=8&liste=histo (accessed on 29 August 2017).
- Fragoso, R.M.; da Silva Carvalho, M.L. Estimation of joint costs allocation coefficients using the maximum entropy: A case of Mediterranean farms. J. Quant. Econ. 2012, 10, 91–111. [Google Scholar]
- Fragoso, R.M.; da Silva Carvalho, M.L. Estimation of cost allocation coefficients at the farm level using an entropy approach. J. Appl. Stat. 2013, 40, 1893–1906. [Google Scholar] [CrossRef]
- Garvey, E.; Britz, W. Estimation of Input Allocation from EU Farm Accounting Data Using Generalized Maximum Entropy; Working Paper 02-01; University of Ireland: Dublin, Ireland; Universität Bonn: Bonn, Germany, 2002. [Google Scholar]
- Lence, S.H.; Miller, D.J. Recovering Output-Specific Inputs from Aggregate Input Data: A Generalized Cross-Entropy Approach. Am. J. Agric. Econ. 1998, 80, 852–867. [Google Scholar] [CrossRef]
- Butault, J.-P. Chapter 2, The GECOM model. In Implementation, Validation and Results of the Cost of Production Model Using the EU FADN, FACEPA Deliverable No. 3; Kleinhanss, W., Ed.; vTI: Braunschweig, Germany, 2011. [Google Scholar]
- Kleinhanss, W.; Offermann, F.; Butault, J.-P.; Surry, Y. Cost of Production Estimates for Wheat, Milk and Pigs in Selected EU Member States. Arbeitsberichte aus der vTI-Agrarökonomie; No. 07/2011. 2011. Available online: http://www.econstor.eu/handle/10419/53152 (accessed on 22 June 2017).
- Tiberti, M. Production costs of Soft Wheat in Italy. In Proceedings of the Second Conference of the Italian Association of Agricultural and Applied Economics, Parma, Italy, 6–7 June 2013. [Google Scholar]
- Moxey, A.; Tiffin, R. Estimating linear production coefficients from farm business survey data: A note. J. Agric. Econ. 1994, 45, 381–385. [Google Scholar] [CrossRef]
- Griffiths, W.E.; O’Donnell, C.J.; Tan Cruz, A. Imposing regularity conditions on a system of cost and factor share equations. Aust. J. Agric. Resour. Econ. 2000, 44, 107–127. [Google Scholar] [CrossRef]
- Desbois, D.; Butault, J.-P.; Surry, Y. Estimation des coûts de production en phytosanitaires pour les grandes cultures. Une approche par la régression quantile. Écon. Rural. 2013, 333, 27–49. [Google Scholar] [CrossRef]
- Arfini, F.; Donati, M.; Veneziani, M. Assessing farm production costs using PMP: Theoretical foundation and empirical validation. In Proceedings of the 29th International Conference of Agricultural Economists, Milan, Italy, 8–14 August 2015. [Google Scholar]
- Golan, A.; Judge, G.; Miller, D. Maximum Entropy Econometrics: Robust Estimation with Limited Data; John Wiley & Sons: Chichester, UK, 1996. [Google Scholar]
- Rosenthal, R. GAMS—A User’s Guide, Tutorial; GAMS Development Corporation: Washington, DC, USA, 2013. [Google Scholar]
- Robinson, S.; El-Said, M. Estimating a Social Accounting Matrix Using Entropy Difference Methods; TMD Discussion Paper No. 21; International Food Policy Research Institute: Washington, DC, USA, 1997. [Google Scholar]
- Campbell, R.C.; Hill, R.C. Imposing Parameter Inequality Restrictions using the Principle of Maximum Entropy. J. Stat. Comput. Simul. 2006, 76, 985–1000. [Google Scholar] [CrossRef]
- Roesch, A.; Hausheer Schnider, J. Grundlagenbericht 2008; Agroscope Reckenholz-Tänikon Research Station: Ettenhausen, Switzerland, 2009. [Google Scholar]
- Agridea; FiBL. Deckungsbeiträge Ausgabe 2008; Agridea and Forschungsinstitut für Biologischen Landbau (FiBL): Lindau, Switzerland, 2008. [Google Scholar]
- Albisser, G.; Gazzarin, C. Vollkostenkalkulationen für Betriebszweige; Agroscope Reckenholz-Tänikon Research Station: Ettenhausen, Switzerland, 2010. [Google Scholar]
- Lips, M.; Ammann, H. Vollkostenkalkulationen für Ackerkulturen. Agrarforschung 2006, 13, 210–214. [Google Scholar]
- Alder, T. Vollkostenkalkulation für die Mostobstproduktion, Vergleich der Produktionskosten von Mostobst zwischen der Ostschweiz und Baden-Württemberg; ART-Bericht No. 691; Agroscope Reckenholz-Tänikon Research Station: Tänikon, Switzerland, 2007. [Google Scholar]
- Bundesamt für Landwirtschaft. Agrarbericht 2009 des Bundesamtes für Landwirtschaft; Bundesamt für Landwirtschaft: Bern, Switzerland, 2009. [Google Scholar]
- Lips, M. Calculating full costs for Swiss dairy farms in the mountain region using a maximum entropy approach for joint-cost allocation. Int. J. Agric. Manag. 2014, 3, 145–153. [Google Scholar]
- Craig, K. (Ed.) The Farm Management Handbook 2016/17, 37th ed.; The UK Reference for Farm Business Management; SAC Consulting: Midlothian, UK, 2016. [Google Scholar]
- Redman, G. (Ed.) John Nix Farm Management Pocketbook for 2016, 46th ed.; The Pocketbook: Melton Mowbray, UK, 2015. [Google Scholar]
- Lips, M. Joint Cost Allocation by Means of Maximum Entropy. In Proceedings of the 28th International Conference of Agricultural Economists, Foz do Iguaçu, Brazil, 18–24 August 2012. [Google Scholar]
- Lips, M. Disproportionate Joint Cost Allocation at Individual-Farm Level Using Maximum Entropy; Working Paper; Institute for Sustainability Sciences: Ettenhausen, Switzerland, 2014. [Google Scholar]
© 2017 by the author. Licensee MDPI, Basel, Switzerland. This article is an open access article distributed under the terms and conditions of the Creative Commons Attribution (CC BY) license (http://creativecommons.org/licenses/by/4.0/).