Article

Photocatalytic Decolorization of Methyl Red on Nanoporous Anodic ZrO2 of Different Crystal Structures

1
Faculty of Chemistry, Jagiellonian University in Krakow, Gronostajowa 2, 30-387 Krakow, Poland
2
Institut für Chemie, Campus Adlershof, Humboldt-Universität zu Berlin, Brook-Taylor-Str. 2, 12489 Berlin, Germany
*
Authors to whom correspondence should be addressed.
Crystals 2021, 11(2), 215; https://doi.org/10.3390/cryst11020215
Submission received: 31 January 2021 / Revised: 18 February 2021 / Accepted: 18 February 2021 / Published: 21 February 2021
(This article belongs to the Special Issue Nanostructured Crystalline Materials)

Abstract

:
High surface area, self-organized nanoporous ZrO2 arrays with perfect adhesion to the Zr substrate were synthesized by anodization in an aqueous electrolyte containing (NH4)2SO4 and NH4F. The obtained semiconductor materials were tested as photocatalysts for decolorization of the methyl red (MR) as a model azo dye pollutant. It was demonstrated that as-synthesized anodic ZrO2 anodic layers are already crystalline and, therefore, do not require further thermal treatment to provide a high photocatalytic performance. However, photocatalytic efficiency could be improved by annealing at a relatively low-temperature of 350 °C. Higher annealing temperatures caused a gradual drop of photocatalytic activity. The photocatalytic behavior was correlated with the crystal phase transformation in anodic ZrO2. It was found that higher photocatalytic activity was observed for the tetragonal phase over the monoclinic phase (predominant at elevated temperatures). It results from the optimal and complex electronic structure of annealed ZrO2 with three different energy states having absorption edges at 2.0, 4.01 and 5.28 eV.

1. Introduction

Zirconium dioxide (ZrO2) is found to be a multipurpose material for special applications. Due to very high chemical stability, hardness and resistance to corrosion in aggressive environments, it is found to be suitable for nuclear reactors [1,2], solid-state electrolytes [3,4,5,6,7,8], sensors [9,10], membranes for nanofiltration [11], and fuel cells [12,13,14]. Since its high biocompatibility and low cytotoxicity, it is a promising material for biomedical implants [5,15,16,17]. Moreover, ZrO2 is an n–type semiconductor which makes it a potential candidate for photo- (PC) and photoelectrocatalytic (PEC) applications [18,19,20,21,22].
The properties of ZrO2 are often compared with TiO2 (benchmark photocatalyst) as they belong to the same IV-group transition metals oxides [23]. However, ZrO2 is characterized by a wider band gap (∼5 eV) as well as a conduction band shifted towards more-negative (−1.0 V vs. NHE) and valence band towards more-positive (4.0 V vs. NHE) potentials than for TiO2 [18,19]. Consequently, zirconia is capable of generating holes with very strong oxidation power. It was reported that the zirconia band gap strongly depends on a crystal polymorph form (e.g., 4.3 eV for c-ZrO2, 3.25 eV for m-ZrO2, and 3.58 eV for t-ZrO2) [24].
A particularly interesting form of zirconia is a nanoporous thin film obtained by self-organized anodization of Zr in a variety of fluoride-containing electrolytes [25,26,27,28,29]. Such a thin film has an extremely high total surface area, and each pore might work as a nano-vessel for reactions in the liquid environment. The anodic nanotube or nanopore arrays adhere well to the Zr substrate, and, thereby, such prepared electrodes are very convenient for PEC applications. Noteworthy, in contrast to TiO2, as-prepared anodic ZrO2 is crystalline [21,27,30], which ensures its functionality (e.g., efficient electron transport)—the prerequisite for efficient photo- and photoelectrocatalysts [22,31]. Commonly, an additional annealing of anodic ZrO2 as a post-treatment process is applied to improve its crystallinity and remove remaining fluoride ions incorporated in the oxide layer during the synthesis process [25].
Recently, a semiconductor assisted photocatalytic decolorization of pollutants has attracted pronounced attention due to its vital role in environmental remediation. Most dyes used in the pigmentation of textiles, paper, leather, ceramics, cosmetics, inks and food-processing products are derived from azo dyes (70–80%). Herein, we report the electrochemical synthesis of highly ordered nanoporous ZrO2 photocatalytic layers from an aqueous electrolyte and characterization of their photocatalytic activity towards a degradation of methyl red (MR)—a model azo dye contaminant. The influence of post-treatment annealing affecting the crystallinity degree and the presence of various ZrO2 polymorphs were considered as important factors contributing to enhanced photo-catalytic activity of ZrO2.

2. Materials and Methods

Zirconium foil (99.2%, 0.25 mm thick, GoodFellow) was cut into 1 × 1 cm2 specimens, degreased in acetone, ethanol, and dried. The samples were chemically polished by etching in a mixture of HF (40 wt.%, Chempur), HNO3 (65 wt.%, Chempur) and H2O (1:4:2 vol.), washed twice with deionized water, then with ethanol and dried. The polished samples were next anodized via a two-step procedure using a DC power supply (DF1730SL5A, NDN, Poland) and a home-made Teflon O-ring cell with a Pt grid cathode. The anodization was conducted at room temperature in a stirred 1 M (NH4)2SO4 (Chempur) and 0.08 M NH4F (Sigma-Aldrich) electrolyte. The process was carried out at 12 V for 30 min and 45 s in a first and second step, respectively. The current density was monitored and recorded during anodization processes. The oxide layer formed in the first anodization was removed from the Zr substrate using an adhesive tape. After all anodizations, the samples were sequentially rinsed with distilled water, ethanol and dried in a stream of warm air.
The morphologies of the resulting nanopore arrays were analyzed using a field-emission scanning electron microscope (SEM/EDS, Hitachi S-4700). The anodized ZrO2 layers on the Zr substrate were annealed in an air using a muffle furnace (FCF 5SHM Z, Czylok) for 1 h at the temperature in the 350–500 °C range, keeping the same heating rate of 10 °C min−1. The phase composition of formed oxide layers was determined using an X-ray diffractometer Rigaku MiniFlex 600 (2θ range of 10°–90°, scan rate of 5° min−1). XRD analyses were performed using Match3 software and COD database with XRD cards #96-151-2555, #96-153-4902, #96-900-8524, #96-900-8560 (Zr); #96-230-0297 (monoclinic ZrO2), #96-152-5707, #96-152-5706 (tetragonal ZrO2). UV-Vis diffuse reflectance spectra (DRS) were recorded in the range of 200–800 nm at room temperature using a Perkin Elmer Lambda 750S UV/Vis/NIR spectrophotometer.
Photocatalytic degradation of MR was conducted using a UV photoreactor (Instytut Fotonowy, Poland) equipped with monochromatic lamps (350 nm) having a total power of 160 W. The anodic ZrO2 samples on Zr substrate, annealed at different temperatures (350–500 °C) were immersed in 10 mL of 5 mg L−1 MR in a 0.01 M HCl solution in a quartz glass cuvette (reaction cuvette). The exposed working area of the sample was 0.875 cm2, and sample parts not covered with the anodic film were insulated with an acid-resistive paint. A blind photolysis test was conducted using the same solution, but without immersed the ZrO2 catalyst. All solutions were illuminated for 5 h at the wavelength of λ = 350 nm. Every hour, 1 mL sample was taken from illuminated solutions and MR concentration was determined by measuring absorbance spectra at the range of 200–600 nm using a UV-Vis spectrophotometer (UV/Vis, Thermo Scientific Evolution 220). The solution absorbance at λ = 524 nm (absorption maximum of MR) was used to calculate residual MR concentrations based on a calibration curve constructed from standard MR solutions within the concentrations range of 0–5 mg L−1. The degradation tests were performed in triplicate for each type of the sample.

3. Results and Discussion

3.1. Current Density vs. Time Characteristics of the Anodization Process

The voltage–time curves acquired during the first and second anodizing steps are presented in Figure 1.
Figure 1 shows current density–time curves for the first (30 min) and second (45 s) anodization steps carried out at 12 V in the electrolyte composed of 1 M (NH4)2SO4 and 0.08 M NH4F. As can be seen, the shape of current density curves observed during the first and second anodizations are similar to each other. The second anodizing step induces higher current densities than those observed for the first anodizing step. Such an increase in the current density is characteristic for two-step anodizations, since the growth of pores at the second step occurs much more easily on the pre-patterned Zr surface formed in the first anodizing step. For both anodization steps, the current–time curves demonstrate an exponential decay of current density with time, which is typically observed for hard anodization conditions and indicates a predominance of oxide formation over oxide dissolution [28,29,32]. However, initiation of the anodization process in the first step (just after switching on the power source) is indicated by a strong drop of current density, which corresponds to an initial rapid growth of the oxide layer at surface defects of the Zr substrate. These defect sites are favored locations for a predominant current flow during anodization (formation of pits that induces initiation of pore growth). Later on, the current density starts flatting out, which corresponds to a rapid oxide growth and thickening of the barrier oxide layer. As a consequence, a migration distance through the oxide layer (distance to be covered by ionic species) is extended and a non-steady-state anodizing conditions are observed. When the process is further continued, due to a fast oxide formation, F- ions are being progressively depleted in the electrolyte due to their incorporation in the formed oxide layer. An increased length of porous channels results in an increased diffusion distance for F- ions and, therefore, it is difficult to provide a sufficient concentration of F- ions at the pore bottoms. As F- ions are necessary for the chemical oxide dissolution at the metal/oxide interface [33], at this stage of the anodization process, the oxide formation and dissolution did not reach an equilibrium yet. Here, the oxide dissolution rate is still slower than the oxidation rate, and for this reason, the current density decay with time is continued. Nevertheless, after about 25–30 min of the anodization process, a quasi-steady-state conditions are achieved (Figure 1a).

3.2. Morphology and Composition of Nanoporous ZrO2 Arrays

The SEM micrographs (Figure 2) show the top, bottom, and cross-sectional views of the as-synthesized nanoporous ZrO2 layers before and after annealing at 350 °C and 500 °C for 1 h.
The synthesized anodic ZrO2 array consists of a network of well-ordered and parallel nanotubes, tightly adjacent to each other. The nanotubes’ diameter varies significantly over the sample surface as seen in the bottom view picture (Figure 2b). The top view microphotography shows a very thin, so-called initiation layer [34], with random nanopores (Figure 2a), differently organized from the nanotubes inside the inner oxide layer (Figure 2c,d). The post-treatment annealing does not destroy the morphology of the nonporous oxide layer, however, with increasing the annealing temperature, some gradual embrittlement can be seen in nanotubes lengths (Figure 2f,i) and some small fractures at the bottom side (Figure 2e,h).
In the next step, the effect of annealing temperature on the crystal structure transformation of nanoporous ZrO2 arrays was verified by XRD analyses. The XRD patterns of the as received and annealed (at 350, 400 and 500 °C) samples are shown in Figure 3. Interestingly, as-synthesized zirconia is already crystalline without post-treatment annealing, in line with previous literature findings [21,27,30]. Such a feature is very beneficial for photocatalytic applications, since it has been shown that as-synthesized amorphous semiconductor oxides like TiO2 and WO3 are photocatalytically inactive before crystallization [35,36]. The sample before annealing has both tetragonal and monoclinic crystal phases. Clearly, increasing the heat-treatment temperature causes a gradual increase in the monoclinic phase contribution, which is in line with a previously reported work [37].

3.3. Optical Absorption Properties of Zirconia Nanotubes

Because a crystal phase structure correlates significantly with optical properties of semiconductors, the UV-Vis DRS spectra were recorded to evaluate the annealing temperature effect on the sample optical band gap (Figure 4). As can be seen from the reflectance spectra (Figure 4a), it is evident that annealing at different temperatures has a strong influence on the optical properties of the zirconia samples and, thereby, for the electronic structure and photocatalytic activity of zirconia. Clearly, for the as-synthesized nanoporous zirconia, a completely different UV-Vis spectrum is observed than those for the samples annealed at 400 and 500 °C. On the other hand, the spectrum recorded for the sample annealed at 350 °C is a combination of both spectrum types. The complex electronic behavior of zirconia at different annealing temperatures is more evident from the Tauc plot of the Kubelka—Munk function calculated for a direct transition in ZrO2 (Figure 4b). The as-synthesized zirconia sample exhibits the highest absorption at arbout 235 nm, which corresponds to a typically reported ZrO2 band gap of 5.28 eV. As frequently discussed in the literature, zirconia is not considered to be able to absorb sunlight [18,19,38]; however, here, we can also see an additional band gap at 2 eV (absorption tail into the visible region). A similar observation was previously reported in the literature and attributed to the formation of new energy states from point defects (oxygen vacancies and Zr3+ sites) in a lattice, that acts as active co-catalyst centers for photocatalytic reactions [38]. The as-received samples show a broad absorption band between 5.28 eV and 2 eV, which transforms with increasing the annealing temperature. For the sample annealed at 350 °C, the contribution of the energy state with the energy gap edge at 2 eV decreases, and an additional state is revealed at about 4 eV.
Clearly, with increasing the annealing temperature the transformation process is continued, and, finally, for the sample annealed at 500 °C, the band gap state at 2 eV vanishes while the state at ~4 eV becomes evident much more clearly. A small shift in the energy value is observed, i.e., from 4.01 eV to 4.35 eV as the annealing temperate changes from 350 to 500 °C. These results suggest that probably two competitive processes, which change the electronic structure of anodic ZrO2 might occur during annealing: (i) the as-synthesized non-stoichiometric ZrO2 with point defects (oxygen vacancies and Zr3+ sites) turns into stoichiometric oxide and, therefore, energy state with the edge at 2 eV disappears; (ii) the contribution of monoclinic phase increases with increasing the annealing temperature, which can result in a small blue shift of the emerging state with the energy edge at c.a. 4 eV

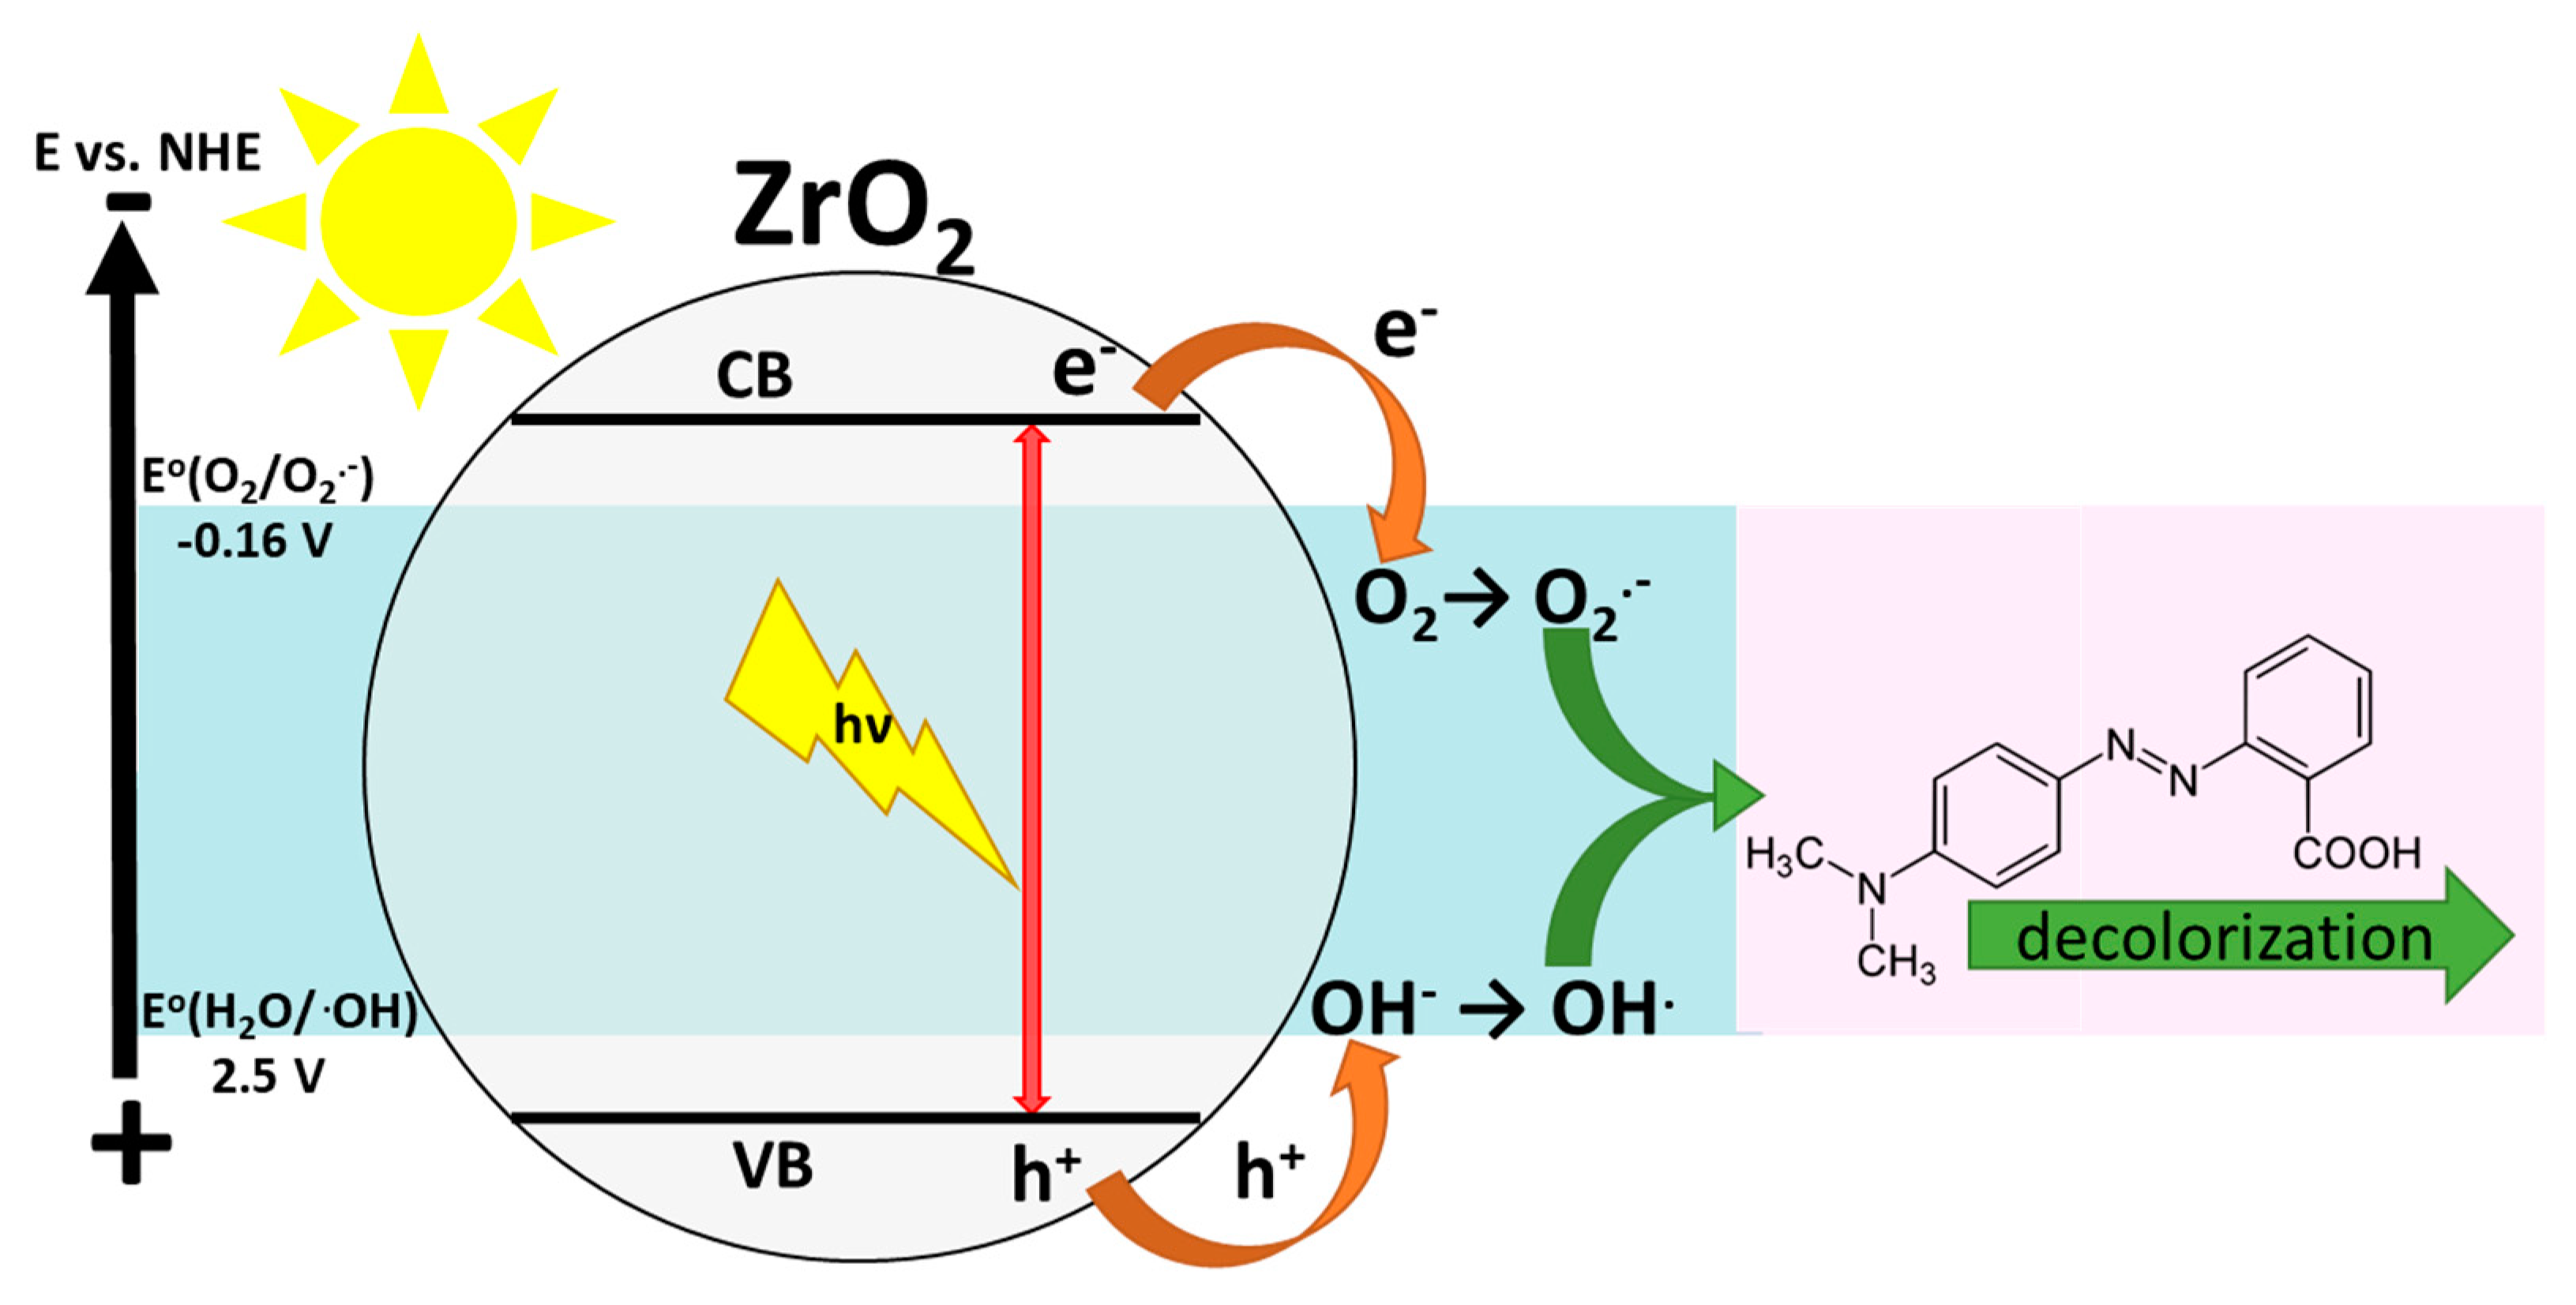
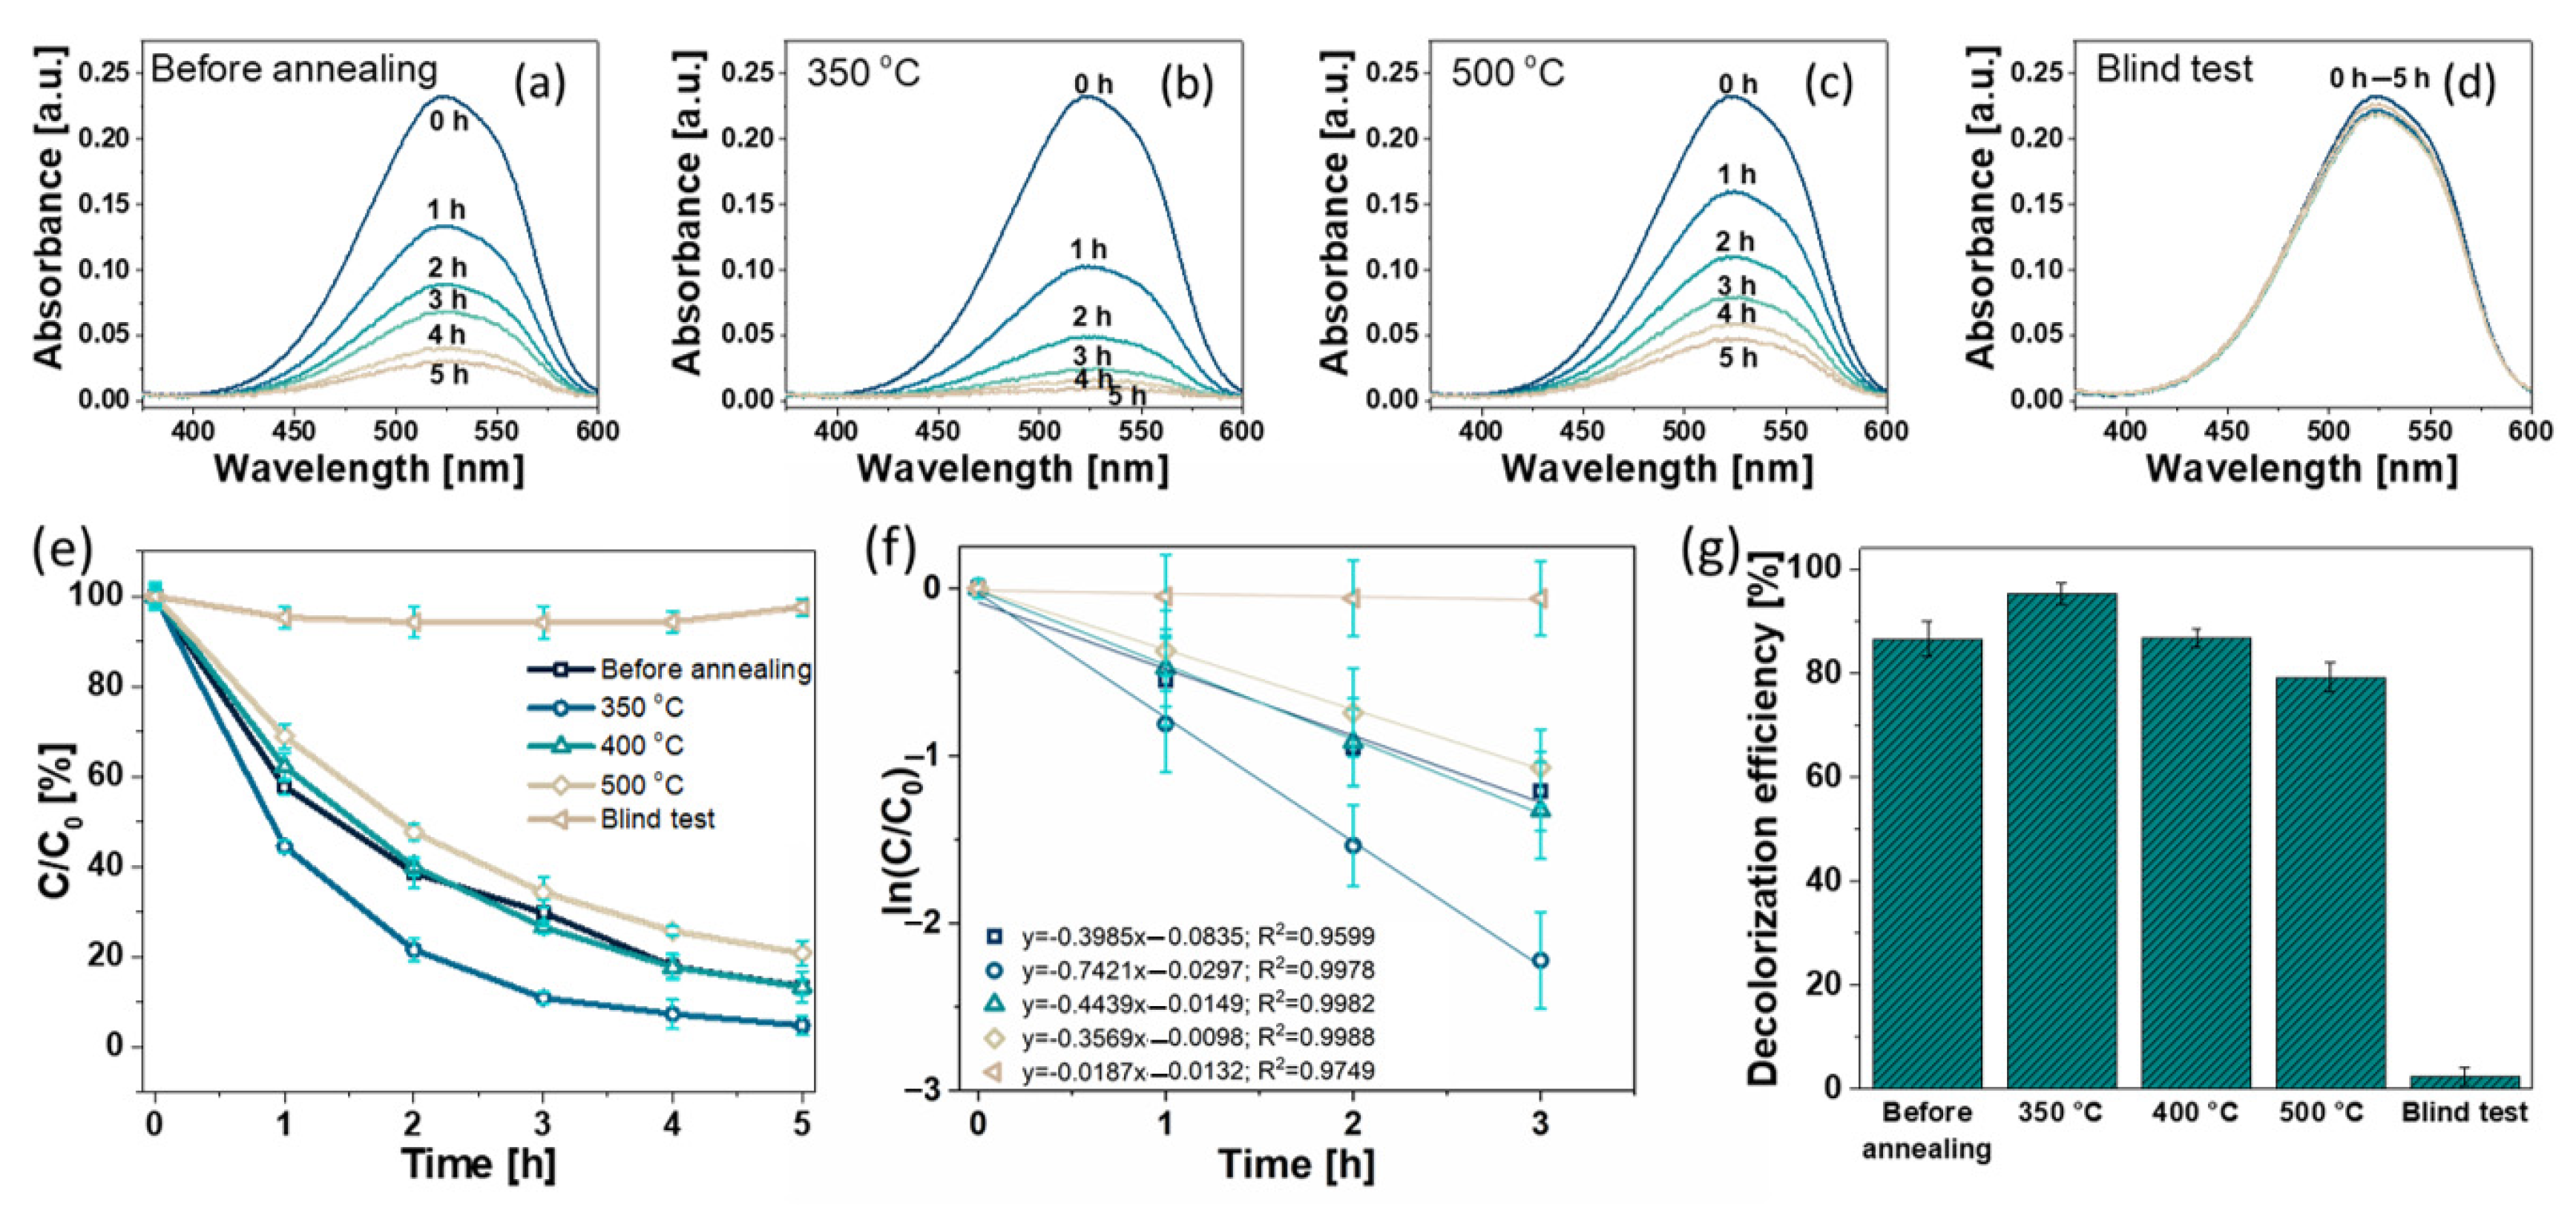
3.4. Photocatalytic Degradation of Methyl Red

The photocatalytic performance of nanoporous anodic ZrO2 layers annealed at different temperatures, was tested in photocatalytic decolorization of the MR solution. It should be pointed out that the process of photocatalytic degradation of MR over ZrO2 photocatalysts is driven by photogenerated hole and electron (eh+) pairs. The photogenerated electrons located in the conduction band of ZrO2 reduces oxygen molecules to superoxide anion radicals (O2·−), while the holes located in the valence band oxidize hydroxyl groups (or water molecules) to reactive hydroxyl radicals (OH) [24]. Both products are highly reactive and might induce photocatalytic decolorization of MR molecules, causing the bleaching of its solution [39] (schematic representation in Figure 5).
During the photocatalytic process, the concentration of MR in solutions was monitored spectrophotometrically. Based on a calibration curve constructed for a concentration range of 0–5 mg L−1 (Figure 6), the MR concentration in the solution of unknown concentration was determined using the following equation:
c = A b a
where: c is an unknown concentration of MR (mg L−1), A is absorbance of the solution at the wavelength of maximum absorbance, and a, b are, respectively, a slope and intercept of the linear regression equation fitted to the calibration curve.
In the next stage, 5 mg L−1 MR solutions without a photocatalyst (blind test) or containing zirconia samples (as-synthesized and annealed at different temperatures) were exposed to 5 h of continuous monochromatic light (λ = 350 nm). The illuminated solutions were probed with 1 h intervals to determine the solution absorbance (Figure 7a–d). The MR concentration changes calculated for aqueous solutions in the absence and presence of ZrO2 catalysts are shown in Figure 7e. The photocatalytic oxidation reaction is described by the pseudo-first-order kinetics with the respect to the azo dye concentration [38]:
l n ( C 0 C t ) = k t
where: k is the observed first-order rate constant, C0 is an initial dye concentration, and Ct is a dye concentration at time t. The first 3 h of irradiation was used to determine the kinetics of dye decolorization (Figure 7f). As can be seen, linear dependences between the logarithmic MR concentration and illumination time were observed. The decolorization reaction rate constants were also determined and equaled to 0.40 h−1, 0.74 h−1, 0.44 h−1, 0.36 h−1 for the samples before annealing, and annealed at 350, 400, 500 °C, respectively.
The photocatalytic decolorization efficiency of MR (Figure 7g) was calculated using the equation:
D e c o l o r i z a t i o n   e f f i c i e n c y = ( 1 C C 0 ) × 100 %
where C0 is the initial concentration of MR in the solution, and C is the final concentration of MR determined after 5 h of the photocatalytic experiment. Evidently, the nanoporous anodic ZrO2 layer annealed at 350 °C shows the highest photocatalytic performance with the highest decolorization rate constant (0.74 h−1), after 1 h illumination about 55% of MR has been already decomposed and after 5 h photocatalytic test the efficiency reached 95.3% (Figure 7e–g). Remarkably, the as-synthesized nanoporous ZrO2 layer shows a similar efficiency to the sample annealed at 400 °C, and significantly outperforms the sample annealed at 500 °C. The differences in photocatalytic activity of particular samples can be explained in terms of the crystal phase transformation and reduction of lattice defects caused by annealing. It has been shown before that tetragonal ZrO2, possesses the highest photocatalytic activity among other ZrO2 crystal phases, and this factor is even more important that point defects like oxygen vacancies an Zr3+ sites [40]. However, concurrently, an optimal concentration of these point defects was found to be also beneficial for zirconia photocatalytic activity [38].This effect was widely studied for TiO2 [41,42,43,44]. In our studies, the photocatalyst composition (sample annealed at 350 °C) seems to provide an optimal combination of the following features: (i) a relatively high ratio between the tetragonal phase and monoclinic phase (annealing probably improves the crystallinity of the as-synthesized sample, but still keeps the phase ratio optimal); (ii) a partial vanishing of the electronic states with the energy edge at 2 eV (most probably related with point defects providing the absorption tail into the visible range); (iii) compilation of both effects together, which results in the most complex band gap structure over the all tested samples, with a medium energy gap state of 4.01 eV (red shifted in comparison to 400 °C (4.11 eV) and 500 °C (4.34 eV)).

4. Conclusions

Anodization of zirconium in an aqueous electrolyte containing (NH4)2SO4 and NH4F was successfully applied to produce a high surface area, nanoporous ZrO2 layers adhering excellently to the Zr substrate. We showed that as-synthesized anodic layers are crystalline already and, therefore, do not require any further thermal treatment to provide efficient photocatalytic performance. However, the photocatalytic activity of anodic oxide layers could be further improved by a relatively low-temperature annealing at 350 °C. The enhanced photocatalytic activity of annealed zirconia was evidently proved in photocatalytic decolorization of MR (model azo dye pollutant) solutions. On the other hand, the annealing at higher temperatures (400 °C and 500 °C) caused a gradual decrease of photocatalytic activity. Such a photocatalytic performance was correlated with the crystal phase transformation of the material (higher activity of the tetragonal phase over the monoclinic phase) and formation of the optimal and very complex electronic structure of the semiconductor (three different energy states with the absorption edges at 2 eV, 4.01 eV, and 5.28 eV).

Author Contributions

Conceptualization: E.W., G.D.S.; methodology: E.W.; software: E.W., G.D.S..; validation: E.W., K.S., formal analysis: E.W., G.D.S.; investigation: E.W., K.S., K.M.; resources: E.W., G.D.S.; data curation: E.W., K.S., writing—original draft preparation: E.W., K.S., G.D.S.; writing—review and editing: E.W., K.S., G.D.S.; visualization: E.W.; supervision: E.W., G.D.S; project administration: E.W., G.D.S.; funding acquisition: E.W. All authors have read and agreed to the published version of the manuscript.

Funding

E. W. thanks the Alexander von Humboldt Foundation, Bonn, Germany, for funding the postdoctoral fellowship.

Institutional Review Board Statement

Not applicable.

Informed Consent Statement

Not applicable.

Data Availability Statement

Data is contained within the article.

Conflicts of Interest

The authors declare no conflict of interest.

References

  1. Kim, D.-J.; Rhee, Y.W.; Kim, J.H.; Oh, J.S.; Kim, K.S.; Yang, J.H. Thermal Conductivity measurement of Zr-ZrO2 simulated inert matrix nuclear fuel pellet. World J. Nucl. Sci. Technol. 2013, 3, 46–50. [Google Scholar] [CrossRef] [Green Version]
  2. Mistarihi, Q.; Umer, M.A.; Kim, J.H.; Hong, S.H.; Ryu, H.J. Fabrication of ZrO2-based nanocomposites for transuranic element-burning inert matrix fuel. Nucl. Eng. Technol. 2015, 47, 617–623. [Google Scholar] [CrossRef] [Green Version]
  3. Tsuchiya, H.; Macak, J.M.; Ghicov, A.; Taveira, L.; Schmuki, P. Self-organized porous TiO2 and ZrO2 produced by anodization. Corros. Sci. 2005, 47, 3324–3335. [Google Scholar] [CrossRef]
  4. Ahmed, W.; Iqbal, J.; Aisida, S.O.; Badshah, A.; Ahmad, I.; Alamgir, K.; Gul, I.H. Structural, magnetic and dielectric characteristics of optically tuned Fe doped ZrO2 nanoparticles with visible light driven photocatalytic activity. Mater. Chem. Phys. 2020, 251, 122999. [Google Scholar] [CrossRef]
  5. Wang, L.N.; Adams, A.; Luo, J.L. Enhancement of the capability of hydroxyapatite formation on Zr with anodic ZrO2 nanotubular arrays via an effective dipping pretreatment. J. Biomed. Mater. Res. Part B Appl. Biomater. 2011, 99, 291–301. [Google Scholar] [CrossRef] [PubMed]
  6. Liu, T.; Zhang, X.; Wang, X.; Yu, J.; Li, L. A review of zirconia-based solid electrolytes. Ionics (Kiel) 2016, 22, 2249–2262. [Google Scholar] [CrossRef]
  7. Badwal, S.P.S. Zirconia-based solid electrolytes: Microstructure, stability and ionic conductivity. Solid State Ion. 1992, 52, 23–32. [Google Scholar] [CrossRef]
  8. Chen, R.; Qu, W.; Qian, J.; Chen, N.; Dai, Y.; Guo, C.; Huang, Y.; Li, L.; Wu, F. Zirconia-supported solid-state electrolytes for high-safety lithium secondary batteries in a wide temperature range. J. Mater. Chem. A 2017, 5, 24677–24685. [Google Scholar] [CrossRef]
  9. Buica, G.O.; Stoian, A.B.; Manole, C.; Demetrescu, I.; Pirvu, C. Zr/ZrO2 nanotube electrode for detection of heavy metal ions. Electrochem. Commun. 2020, 110, 106614. [Google Scholar] [CrossRef]
  10. Pandit, N.A.; Shahazad, M.; Ahmad, T. Structural characterization and gas sensing applications of ultrafine ZrO2 nanospheres using low temperature solution route. Mater. Today Proc. 2020, 2–7. [Google Scholar] [CrossRef]
  11. Van Gestel, T.; Kruidhof, H.; Blank, D.H.A.; Bouwmeester, H.J.M. ZrO2 and TiO2 membranes for nanofiltration and pervaporation. Part 1. Preparation and characterization of a corrosion-resistant ZrO2 nanofiltration membrane with a MWCO <300. J. Memb. Sci. 2006, 284, 128–136. [Google Scholar] [CrossRef]
  12. Rahimi, N.F.M.; Thirugnana, S.T.; Ghoshal, S.K. Yttria stabilized zirconia thin film as solid oxide fuel cell electrolyte: Temperature dependent structures and morphology. J. Environ. Treat. Tech. 2020, 8, 604–609. [Google Scholar]
  13. Hao, S.J.; Wang, C.; Liu, T.-L.; Mao, Z.M.; Mao, Z.Q.; Wang, J.L. Fabrication of nanoscale yttria stabilized zirconia for solid oxide fuel cell. Int. J. Hydrog. Energy 2017, 42, 29949–29959. [Google Scholar] [CrossRef]
  14. Rambabu, K.; Bharath, G.; Arangadi, A.F.; Velu, S.; Banat, F.; Show, P.L. ZrO2 incorporated polysulfone anion exchange membranes for fuel cell applications. Int. J. Hydrog. Energy 2020, 45, 29668–29680. [Google Scholar] [CrossRef]
  15. Guo, L.; Zhao, J.; Wang, X.; Xu, R.; Lu, Z.; Li, Y. Bioactivity of zirconia nanotube arrays fabricated by electrochemical anodization. Mater. Sci. Eng. C 2009, 29, 1174–1177. [Google Scholar] [CrossRef]
  16. Zhang, L.; Han, Y. Enhanced bioactivity of self-organized ZrO2 nanotube layer by annealing and UV irradiation. Mater. Sci. Eng. C 2011, 31, 1104–1110. [Google Scholar] [CrossRef]
  17. Bauer, S.; Park, J.; Faltenbacher, J.; Berger, S.; Von Der Mark, K.; Schmuki, P. Size selective behavior of mesenchymal stem cells on ZrO2 and TiO2 nanotube arrays. Integr. Biol. 2009, 1, 525–532. [Google Scholar] [CrossRef]
  18. Karunakaran, C.; Senthilvelan, S. Photocatalysis with ZrO2: Oxidation of aniline. J. Mol. Catal. A Chem. 2005, 233, 1–8. [Google Scholar] [CrossRef]
  19. Emeline, A.V.; Panasuk, A.V.; Sheremetyeva, N.; Serpone, N. Mechanistic studies of the formation of different states of oxygen on irradiated ZrO2 and the photocatalytic nature of photoprocesses from determination of turnover numbers. J. Phys. Chem. B 2005, 109, 2785–2792. [Google Scholar] [CrossRef]
  20. Dawoud, T.M.S.; Pavitra, V.; Ahmad, P.; Syed, A.; Nagaraju, G. Photocatalytic degradation of an organic dye using Ag doped ZrO2 nanoparticles: Milk powder facilitated eco-friendly synthesis. J. King Saud Univ. Sci. 2020, 32, 1872–1878. [Google Scholar] [CrossRef]
  21. Ismail, S.; Ahmad, Z.A.; Berenov, A.; Lockman, Z. Effect of applied voltage and fluoride ion content on the formation of zirconia nanotube arrays by anodic oxidation of zirconium. Corros. Sci. 2011, 53, 1156–1164. [Google Scholar] [CrossRef]
  22. Jothibas, M.; Manoharan, C.; Johnson Jeyakumar, S.; Praveen, P.; Joseph Panneerdoss, I. Photocatalytic activity of spray deposited ZrO2 nano-thin films on methylene blue decolouration. J. Mater. Sci. Mater. Electron. 2016, 27, 5851–5859. [Google Scholar] [CrossRef]
  23. Pirzada, B.M.; Mir, N.A.; Qutub, N.; Mehraj, O.; Sabir, S.; Muneer, M. Synthesis, characterization and optimization of photocatalytic activity of TiO2/ZrO2 nanocomposite heterostructures. Mater. Sci. Eng. B Solid State Mater. Adv. Technol. 2015, 193, 137–145. [Google Scholar] [CrossRef]
  24. Basahel, S.N.; Ali, T.T.; Mokhtar, M.; Narasimharao, K. Influence of crystal structure of nanosized ZrO2 on photocatalytic degradation of methyl orange. Nanoscale Res. Lett. 2015, 10. [Google Scholar] [CrossRef] [Green Version]
  25. Stępień, M.; Handzlik, P.; Fitzner, K. Synthesis of ZrO2 nanotubes in inorganic and organic electrolytes by anodic oxidation of zirconium. J. Solid State Electrochem. 2014, 18, 3081–3090. [Google Scholar] [CrossRef] [Green Version]
  26. Tsuchiya, H.; Macak, J.M.; Sieber, I.; Schmuki, P. Anodic porous zirconium oxide prepared in sulfuric acid electrolytes. Mater. Sci. Forum 2006, 512, 205–210. [Google Scholar] [CrossRef]
  27. Tsuchiya, H.; Macak, J.M.; Sieber, I.; Schmuki, P. Self-organized high-aspect-ratio nanoporous zirconium oxides prepared by electrochemical anodization. Small 2005, 1, 722–725. [Google Scholar] [CrossRef] [PubMed]
  28. Wierzbicka, E.; Syrek, K.; Sulka, G.D.; Pisarek, M.; Janik-Czachor, M. The effect of foil purity on morphology of anodized nanoporous ZrO2. Appl. Surf. Sci. 2016, 388, 799–804. [Google Scholar] [CrossRef]
  29. Pisarek, M.; Krajczewski, J.; Wierzbicka, E.; Hołdyński, M.; Sulka, G.D.; Nowakowski, R.; Kudelski, A.; Janik-Czachor, M. Influence of the silver deposition method on the activity of platforms for chemometric surface-enhanced Raman scattering measurements: Silver films on ZrO2 nanopore arrays. Spectrochim. Acta Part A Mol. Biomol. Spectrosc. 2017, 182, 124–129. [Google Scholar] [CrossRef] [PubMed]
  30. Zhao, J.; Xu, R.; Wang, X.; Li, Y. In situ synthesis of zirconia nanotube crystallines by direct anodization. Corros. Sci. 2008, 50, 1593–1597. [Google Scholar] [CrossRef]
  31. Sun, Y.; Yan, K.; Wang, G.; Guo, W.; Ma, T. Effect of annealing temperature on the hydrogen production of TiO2 nanotube arrays in a two-compartment photoelectrochemical cell. J. Phys. Chem. C 2011, 115, 12844–12849. [Google Scholar] [CrossRef]
  32. Lee, W.; Ji, R.; Gösele, U.; Nielsch, K. Fast fabrication of long-range ordered porous alumina membranes by hard anodization. Nat. Mater. 2006, 5, 741–747. [Google Scholar] [CrossRef]
  33. Berger, S.; Faltenbacher, J.; Bauer, S.; Schmuki, P. Enhanced self-ordering of anodic ZrO2 nanotubes in inorganic and organic electrolytes using two-step anodization. Phys. Status Solidi Rapid Res. Lett. 2008, 2, 102–104. [Google Scholar] [CrossRef]
  34. Berger, S.; Jakubka, F.; Schmuki, P. Formation of hexagonally ordered nanoporous anodic zirconia. Electrochem. Commun. 2008, 10, 1916–1919. [Google Scholar] [CrossRef]
  35. Syrek, K.; Zych, M.; Zaraska, L.; Sulka, G.D. Influence of annealing conditions on anodic tungsten oxide layers and their photoelectrochemical activity. Electrochim. Acta 2017, 231, 61–68. [Google Scholar] [CrossRef]
  36. Ohtani, B.; Ogawa, Y.; Nishimoto, S.I. Photocatalytic activity of amorphous-anatase mixture of titanium (IV) oxide particles suspended in aqueous solutions. J. Phys. Chem. B 1997, 101, 3746–3752. [Google Scholar] [CrossRef] [Green Version]
  37. Fang, D.; Liu, S.; Luo, Z.; Xiong, C.; Xu, W. Facile fabrication of freestanding through-hole ZrO2 nanotube membranes via two-step anodization methods. Appl. Surf. Sci. 2012, 258, 6217–6223. [Google Scholar] [CrossRef]
  38. Sinhamahapatra, A.; Jeon, J.P.; Kang, J.; Han, B.; Yu, J.S. Oxygen-deficient zirconia (ZrO2-x): A new material for solar light absorption. Sci. Rep. 2016, 6, 1–8. [Google Scholar] [CrossRef] [PubMed]
  39. Syrek, K.; Sennik-Kubiec, A.; Rodríguez-López, J.; Rutkowska, M.; Żmudzki, P.; Hnida-Gut, K.E.; Grudzień, J.; Chmielarz, L.; Sulka, G.D. Reactive and morphological trends on porous anodic TiO2 substrates obtained at different annealing temperatures. Int. J. Hydrog. Energy 2020, 45, 4376–4389. [Google Scholar] [CrossRef]
  40. Teeparthi, S.R.; Awin, E.W.; Kumar, R. Dominating role of crystal structure over defect chemistry in black and white zirconia on visible light photocatalytic activity. Sci. Rep. 2018, 8, 1–11. [Google Scholar] [CrossRef] [Green Version]
  41. Zhou, X.; Wierzbicka, E.; Liu, N.; Schmuki, P. Black and white anatase, rutile and mixed forms: Band-edges and photocatalytic activity. Chem. Commun. 2019, 55, 533–536. [Google Scholar] [CrossRef] [PubMed]
  42. Wierzbicka, E.; Zhou, X.; Denisov, N.; Yoo, J.E.; Fehn, D.; Liu, N.; Meyer, K.; Schmuki, P. Self-enhancing H2 evolution from TiO2 nanostructures under illumination. ChemSusChem 2019, 12, 1900–1905. [Google Scholar] [CrossRef] [Green Version]
  43. Wierzbicka, E.; Altomare, M.; Wu, M.; Liu, N.; Yokosawa, T.; Fehn, D.; Qin, S.; Meyer, K.; Unruh, T.; Spiecker, E.; et al. Reduced grey brookite for noble metal free photocatalytic H2 evolution. J. Mater. Chem. A 2021. [Google Scholar] [CrossRef]
  44. Wierzbicka, E.; Domaschke, M.; Denisov, N.; Fehn, D.; Hwang, I.; Kaufmann, M.; Kunstmann, B.; Schmidt, J.; Meyer, K.; Peukert, W.; et al. Magnéli phases doped with Pt for photocatalytic hydrogen evolution. ACS Appl. Energy Mater. 2019, 2, 8399–8404. [Google Scholar] [CrossRef]
Figure 1. Current density vs. time curves recorded during 30 min of 1st anodization step (a) and 45 s of 1st and 2nd anodization steps (b). Anodizations of Zr foil were carried out at 12 V in the electrolyte composed of 1 M (NH4)2SO4 and 0.08 M NH4F.
Crystals 11 00215 g001
Figure 2. SEM top view (a,d,g), bottom view (b,e,h) and cross-sectional view (c,f,i) images of nanoporous ZrO2 layers before (ac) and after annealing at 350 °C (df) and 500 °C (gi).
Crystals 11 00215 g002
Figure 3. X-ray diffraction (XRD) patterns of Zr substrate and anodic nanoporous ZrO2 layers before and after annealing at 350 °C, 400 °C and 500 °C.
Crystals 11 00215 g003
Figure 4. UV-Vis diffuse reflectance spectra of nanoporous zirconia arrays before and after annealing at different temperatures (a). Tauc plot of the Kubelka – Munk function for direct transitions (b).
Crystals 11 00215 g004
Figure 5. Proposed reaction mechanism of the heterogeneous photocatalytic decolorization of MR at illuminated ZrO2.
Crystals 11 00215 g005
Figure 6. UV-Vis absorption spectra of standard aqueous MR solutions in a concentration range of 0–5 mg L−1. Inset: the corresponding calibration curve of MR measured at λ = 524 nm.
Crystals 11 00215 g006
Figure 7. Time-dependent UV-Vis absorption spectra of MR solutions illuminated in the presence of as-synthesized (a), annealed at 350 °C (b) and 500 °C (c) ZrO2 samples or in the absence of the photocatalyst (d). The corresponding C/C0 vs. time curves for the wavelength of maximum absorbance of 524 nm for all tested samples (e). Corresponding pseudo first-order kinetic reaction plots (f). Photocatalytic decolorization efficiency of MR solutions (g).
Crystals 11 00215 g007
Publisher’s Note: MDPI stays neutral with regard to jurisdictional claims in published maps and institutional affiliations.

