Highlights
What are the main findings?
- Delaying PBMC isolation post blood draw significantly alters the transcriptome profiles of major PBMC cell types.
- Consistent upregulation of NF-κB-regulated genes and significant changes in AP-1 signaling pathways were observed across multiple cell types.
What is the implication of the main finding?
- Given the powerful and sensitive nature of scRNA-seq, the findings highlight the importance of establishing standardized protocols for blood storage and PBMC isolation in research studies.
- Implementing such standards is crucial to minimize experimental variability, ensure consistency in case–control study designs, and facilitate data sharing.
Abstract
Background: Peripheral blood mononuclear cells (PBMCs) are widely used as a model in the study of different human diseases. There is often a time delay from blood collection to PBMC isolation during the sampling process, which can result in an experimental bias, particularly when performing single cell RNA-seq (scRNAseq) studies. Methods: This study examined the impact of different time periods from blood draw to PBMC isolation on the subsequent transcriptome profiling of different cell types in PBMCs by scRNAseq using the 10X Chromium Single Cell Gene Expression assay. Results: Examining the five major cell types constituting the PBMC cell population, i.e., CD4+ T cells, CD8+ T cells, NK cells, monocytes, and B cells, both common changes and cell-type-specific changes were observed in the single cell transcriptome profiling over time. In particular, the upregulation of genes regulated by NF-kB in response to TNF was observed in all five cell types. Significant changes in key genes involved in AP-1 signaling were also observed. RBC contamination was a major issue in stored blood, whereas RBC adherence had no direct impact on the cell transcriptome. Conclusions: Significant transcriptome changes were observed across different PBMC cell types as a factor of time from blood draw to PBMC isolation and as a consequence of blood storage. This should be kept in mind when interpreting experimental results.
1. Introduction
Peripheral blood mononuclear cells (PBMCs) are readily acquired from patients’ blood samples, and have been widely used in the study of different human diseases [1], e.g., for addressing immunological issues in autoimmune or infectious diseases. However, there is often a time delay from blood collection to PBMC isolation during the sampling process, which is particularly a concern in large-scale multi-institutional consortium studies. The time delay prior to PBMC isolation may lead to significant changes in the transcriptome profiles of PBMCs, and confound the research results [1]. Single cell RNA-seq (scRNAseq) is an experimentally sensitive albeit powerful research tool enabling us to clarify the transcriptomes of specific cell types in different physiological situations and pathological processes [2]. The potential experimental bias related to the time delay prior to PBMC isolation may necessitate particular caution for the scRNAseq approach.
This study aims to examine the impact of the time delay prior to PBMC isolation on the transcriptome profiles of PBMCs in a scRNAseq study. Five major cell types in PBMCs with critical roles in innate, cellular, and humoral immunity were examined in this study, including CD4+ T cells, CD8+ T cells, natural killer (NK) cells, monocytes, and B cells. CD4+ T cells are the major components of PBMCs (25–60%) [3] and the major regulators of adaptive immune responses [4]. CD8+ T cells account for 5–25% of PBMCs [5], and develop into effector cells involving adaptive immune responses [6]. NK cells account for 10–15% of PBMCs [7], which are effector cells of the innate immune system, with critical roles in anti-viral infection and the regulation of autoimmunity [8]. Monocytes account for 10–20% of PBMCs [9], which are effector cells of the innate immune system and differentiate into macrophages and inflammatory dendritic cells (DCs) during inflammation responses [10,11]. B cells are in the range of 5–10% of PBMCs [9], and are the major regulators of humoral immunity of the adaptive immune system by producing antibodies [12]. Given their broad regulatory role in innate immunity and autoimmune/inflammatory diseases, transcriptome changes at different times of PBMC isolation and storage were assessed for each of these cell types, respectively.
2. Materials and Methods
2.1. Samples
Blood samples of 2 healthy adults (1 male and 1 female) were collected in EDTA-coated tubes. To assess the impact of prolonged storage of whole blood prior to PBMC isolation, one aliquot was processed immediately to isolate PBMCs by Ficoll density gradient centrifugation at the biorepository laboratory at the Center for Applied Genomics (CAG), the Children’s Hospital of Philadelphia (CHOP), while another aliquot was stored for 72 h at 4 °C prior to PBMC isolation following the same PBMC protocol. All isolated PBMCs were resuspended in freezing media and stored in liquid nitrogen.
2.2. Single Cell RNA-seq (scRNAseq)
scRNAseq in this study was done using 10X Chromium Single Cell 3′ Gene Expression Solution (10X Genomics, v3 chemistry) [13]. At the time of the experiment, cell suspensions were thawed, and cell aliquots were taken immediately for scRNAseq. Single-cell isolation and library preparation were performed at CAG, CHOP. Sequencing was performed using the Illumina Hiseq2500 SBS v4. The Chromium scRNAseq output data were processed using the Cell Ranger 7.1.0 analytical pipeline (10X Genomics), with reads aligned to the GRCh38 reference genome (Table 1). Low-quality cells with unique molecular identifiers (UMI) < 500 were removed from further analysis. Each cell type was filtered by log2-transformed value > 1 with the attribute parameter of Feature Max. With 10X Chromium being a highly sensitive genomic technology and where mRNAs with low expression levels create greater levels of noise [14], this study focused on the genes with relatively high expression levels, i.e., average occurrence greater than 1 count per cell across the entire dataset.

Table 1.
Cell number and read depth of each sample.
2.3. Data Analysis
Cell subtypes and differential expression (DE) were analyzed with Cell Ranger 7.1.0 (10X Genomics) and the Loupe Browser 6.2.0 (10X Genomics). Libraries were normalized for sequencing depth across all libraries during aggregation for DE analysis. Benjamini–Hochberg-corrected p-values were used to adjust for multiple testing and control the false discovery rate (FDR). FDR-corrected p-values < 0.1 were considered statistically significant. The DE comparison was done by comparing prior to and post blood storage within each individual, and then we combined the data by taking the average of the normalized counts of each gene in both subjects for Gene Set Enrichment Analysis (GSEA). The GSEA analysis was performed by the GSEA v4.3.2 software (Broad Institute of MIT and Harvard, Cambridge, MA, USA) based on the Molecular Signatures Database (MSigDB) [15] hallmark gene set collection [16]. The GSEA was based on all genes with an average occurrence greater than 1 count per cell across the entire dataset in fresh blood samples and blood samples stored for 72 h from both individuals.
3. Results
Despite following the same PBMC isolation protocol for both fresh blood samples and samples stored for 72 h, yield rates of different cell types of PBMCs were significantly lower in the stored blood samples (Table 2). Compared to the fresh blood samples (Figure 1), contamination of red blood cells (RBC) in the isolated PBMCs was observed in the stored blood based on the hemoglobin subunit alpha 1 gene (HBA1) in both individuals (Figure 2). As shown, all five major subtypes of PBMCs, CD4+ T cells, CD8+ T cells, NK cells, monocytes, and B cells, demonstrated both common changes and cell-type-specific changes in the single cell transcriptome profiling.
Table 2.
Single cell transcriptome analysis in five types of white blood cells.
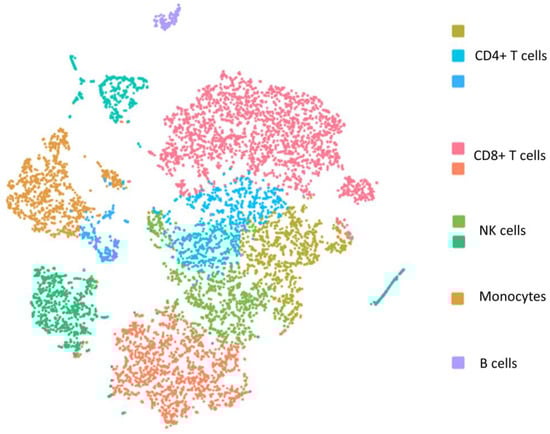
Figure 1.
The t-distributed stochastic neighbor embedding (t-SNE) plot of single cell transcriptome of PBMCs isolated from fresh blood sample.

Figure 2.
The t-distributed stochastic neighbor embedding (t-SNE) plot of single cell transcriptome of PBMCs isolated from fresh blood sample and stored blood sample. The color represents the expression of the hemoglobin subunit alpha 1 gene (HBA1).
3.1. GSEA Analysis
GSEA analysis highlighted that a number of MSigDB Hallmark gene sets [16] were significantly impacted in stored blood (FDR < 0.1, Table 3). In particular, the HALLMARK_TNFA_SIGNALING_VIA_NFKB gene set was upregulated in all five cell types; the HALLMARK_APOPTOSIS gene set was upregulated in CD4+ T cells and monocytes. In contrast, expression changes of the gene sets HALLMARK_MYC_TARGETS_V1 and HALLMARK_OXIDATIVE_PHOSPHORYLATION showed heterogeneity across different cell types. HALLMARK_MYC_TARGETS_V1 and HALLMARK_OXIDATIVE_PHOSPHORYLATION were downregulated with statistical significance in CD4+ T cells, while HALLMARK_MYC_TARGETS_V1 had positive ES scores in CD8+ T cells and B cells, and HALLMARK_OXIDATIVE_PHOSPHORYLATION had a positive ES in monocytes.
Table 3.
GSEA analysis of single cell transcriptome of five types of white blood cells.
3.2. Specific DE Genes by Blood Storage
Individual DE genes with at least 1.5 fold change were examined. Table 4 shows the numbers of DE genes in each cell type. Among 24,800 genes in the scRNAseq assay, the DE genes in stored blood are significantly replicable in the two individuals, for both upregulated genes and downregulated genes in each cell type (with high statistical significance by Chi-square test, Table 4). The significant replicability demonstrated the validity of the observed effects of blood storage on mRNA levels. The expression levels and statistics of individual genes in each cell type are shown in the Supplementary Data S1–S5. As a powerful tool for transcriptome profiling at a single cell level, the scRNAseq assay demonstrated statistical power to identify DE genes by comparing multiple cells from each cell type in each sample. The statistical significances of the DE genes were adjusted for multiple comparisons. Genes with both fold change ≥1.5 and significantly corrected p-values are shown in Table 5.
Table 4.
Numbers of genes with at least 1.5 fold change by blood storage.
Table 5.
Genes with at least 1.5 fold change and significant p-values by blood storage.
3.3. CD4+ T Cells and RBC Adherence
With the contamination of RBCs as an issue in stored blood (Figure 2), it is important to investigate whether the above observed changes in transcriptome in PBMCs were related to the effects of RBC adherence on PBMCs. For this purpose, we investigated the effects of RBC adherence in CD4+ T cells by comparing the transcriptomes of CD4+ T cells with (log2 value of CD4 > 1 and log2 value of HBA1 > 1) vs. without (log2 value of CD4 > 1 and log2 value of HBA1 ≤ 1) the HBA1 feature (Supplementary Data S6). GSEA analysis showed no significant Hallmark gene sets. Interestingly, the two upregulated gene sets, HALLMARK_TNFA_SIGNALING_VIA_NFKB and HALLMARK_APOPTOSIS, in PBMCs from stored blood have negative ES scores (i.e., no up-regulation) in CD4+ T cells with positive HBA1 (Table 6), implying that the upregulation of these gene sets in stored blood was not due to RBC contamination. Except for the three hemoglobin genes, including HBA1, hemoglobin subunit alpha 2 (HBA2), and hemoglobin subunit beta (HBB), no other gene showed statistical significance when comparing the transcriptomes of CD4+ T cells with vs. without HBA1 features.
Table 6.
GSEA analysis of single cell transcriptome in CD4+ T cells with vs. without HBA1 feature.
4. Discussion
Both cell degeneration [17] and RBC contamination [18] in stored blood may explain the decreased yield rates of different cell types in both the female and the male samples. In addition, both common changes and cell-type-specific changes in the single cell transcriptome profiling over time were observed consistently in both samples.
4.1. Gene Sets in Different Cell Types
According to previous studies, both granulocyte activation [19,20] and RBC contamination [18] due to blood storage might cause upregulation of the HALLMARK_TNFA_SIGNALING_VIA_NFKB gene set, i.e., genes regulated by nuclear factor kappa B (NF-κB) in response to tumor necrosis factor (TNF). Granulocytes in stored blood are activated [20]. Granulocyte activation is correlated with activated TNFα signaling in different cell types [21], while all five cell types in our study included only monocytes that had upregulated HALLMARK_TNFA_SIGNALING_VIA_NFKB. Although a previous study suggested that RBC contamination might increase TNF expression by PBMCs [18], our study showed no direct effects of RBC adherence on the transcriptomes of CD4+ T cells.
The HALLMARK_MYC_TARGETS_V1 gene set includes a group of genes regulated by MYC [16], involved in cell cycle progression and cell proliferation [22]. The downregulation of this gene set shows statistical significance only in CD4+ T cells, but it has positive ES scores in the two types of effectors of the adaptive immune system, CD8+ T cells and B cells. CD4+ and CD8+ T Cells are differently programmed for proliferative responses [23]. Instead, proliferation of CD8+ T Cells and B cells relies on antigenic stimulation [23,24]. RBC contamination may suppress the proliferation of CD4+ cells [25], which is consistent with our observation of downregulated MYC target genes, while the inhibitive effect does not require direct adherence, as shown by the lack of difference in the comparison of the transcriptomes of CD4+ T cells with vs. without HBA1 features. In contrast, as shown by our scRNAseq results, this gene set is not downregulated in CD8+ T cells and B cells in stored blood.
HALLMARK_OXIDATIVE_PHOSPHORYLATION includes a group of genes encoding proteins involved in oxidative phosphorylation and the citric acid cycle [16]. The downregulation of this gene set shows statistical significance only in CD4+ T cells, suggesting downregulated energy metabolism, which may be related to decreased glucose in stored blood [26]. Downregulation of energy metabolism may also be related to downregulated cell proliferation, implied by the downregulated HALLMARK_MYC_TARGETS_V1. However, the gene set HALLMARK_OXIDATIVE_PHOSPHORYLATION has a positive ES in monocytes, suggesting maintained energy metabolism.
4.2. Significant DE Genes
Hemoglobin genes, including HBA1, HBA2, and HBB, are commonly detected and shown to have upregulated expression in conjunction with different cell types, i.e., CD4+ T cells, CD8+ T cells, natural killer (NK) cells, and monocytes, which can be explained by the adherence of RBCs with these white blood cells (WBCs) in stored blood [27], though RBC ambient RNA may also contribute to these signals. However, upregulated HBA1, HBA2, and HBB were less significant with B cells, suggesting less RBC adherence. This inference is also consistent with the higher yield rates of B cells in stored blood than other cell types, as shown in Table 2.
Upregulated expression of Jun proto-oncogene AP-1 transcription factor subunit (JUN) is also commonly seen in different cell types. NF-κB controls the activation of activating protein 1 (AP-1) [28,29]. JUN encodes the AP-1 transcription factor c-JUN, which activates gene transcription in response to stimulation [30]. In addition to being a gene in the HALLMARK_TNFA_SIGNALING_VIA_NFKB gene set, JUN is also in the HALLMARK_APOPTOSIS gene set, with its demonstrated roles in the induction of apoptosis of T cells [31] and monocytes [32].
In addition to JUN, a number of genes showed significant DEs in CD4+ cells, e.g., the FosB proto-oncogene, AP-1 transcription factor subunit (FOSB), activating transcription factor 3 (ATF3), interleukin 1 beta (IL-1β, encoded by IL1B), and tribbles pseudokinase 1 (TRIB1). FosB dimerizes with c-JUN and forms the AP-1 complex [33]. ATF3 upregulated the expression of genes related to inflammation (e.g., the expression of TNFα) and apoptosis [34] by binding to the cyclic AMP response element (CRE) in promoters [35], or interacting with other transcription factors, e.g., AP-1 [36]. IL-1β may activate the AP-1 pathway [37], whereas the AP-1 signaling pathway also promotes IL1B transcription [38]. As a scaffold protein, tribbles pseudokinase 1 (TRIB1) increases NF-κB and AP-1 promoter activity through protein–protein interactions [39].
In B cells, significantly upregulated genes in the HALLMARK_TNFA_SIGNALING_VIA_NFKB gene set included early growth response 1 (EGR1), immediate early response 2 (IER2), dual specificity phosphatase 2 (DUSP2), and the CD83 molecule (CD83), in addition to JUN. The EGR1 promoter is a target of JUN [40], while EGR1 has critical roles in both cell proliferation [41] and apoptosis [42] by transcriptional regulation. IER2 is also a component of the AP-1 transcription factor [43], and is involved in cell proliferation and apoptosis as an adaptor protein [44]. Transcription of DUSP2 is regulated by AP-1, dephosphorylates mitogen-activated protein (MAP) kinases, and regulates cell proliferation and differentiation [45]. CD83 transcription is regulated by NF-κB [46], with higher expression on activated B cells [47], regulating the maturation and activation of B cells [48]. In contrast to the upregulated genes, two genes were significantly downregulated in B cells in stored blood, i.e., lysozyme (LYZ), encoding an antimicrobial agent [49], and S100 calcium binding protein A9 (S100A9), encoding a small calcium-binding protein as a potent stimulator of neutrophils [50]. Downregulation of these two genes suggested the inhibited effector function of B cells, in spite of the upregulated HALLMARK_TNFA_SIGNALING_VIA_NFKB genes.
In conclusion, compared to immediate isolation, we observed significant changes in the transcriptome profiles of multiple different cell types within the PBMC cell population upon 72 h blood storage prior to PBMC isolation. In particular, two well-pursued gene sets in PBMC studies, HALLMARK_TNFA_SIGNALING_VIA_NFKB and HALLMARK_APOPTOSIS, were upregulated in PBMCs extracted from blood stored for 72 h. Significant changes in key genes involved in AP-1 signaling were highlighted in CD4+ T cells and B cells. Considering the important roles of NF-κB and AP-1 signaling in the proliferation, function, and apoptosis of immune cells, as highlighted in numerous studies on human diseases in the literature, changes in the expression of these genes in stored blood warrants caution regarding experimental bias related to granulocyte activation and RBC contamination. With the scRNAseq technology as a highly sensitive and powerful tool, PBMCs extracted from fresh blood are needed for performing transcriptome studies, especially studies with a case–control design. With RBC contamination as a major issue in stored blood, as shown in this study, RBC adherence has no direct impact on cell transcriptome, as shown by our comparison of the transcriptomes of CD4+ T cells with vs. without the HBA1 feature.
Supplementary Materials
The following supporting information can be downloaded at: https://www.mdpi.com/article/10.3390/genes14010142/s1, Supplementary Data S1: List of genes in CD4+ T cells. Supplementary Data S2: List of genes in CD8+ T cells. Supplementary Data S3: List of genes in NK cells. Supplementary Data S4: List of genes in monocytes. Supplementary Data S5: List of genes in B cells. Supplementary Data S6: List of genes affected by HBA1 in CD4+ T cells at Day 3.
Author Contributions
Conceptualization, H.H., C.K. and H.-Q.Q.; methodology, H.-Q.Q. and C.K.; formal analysis, H.-Q.Q.; investigation, H.-Q.Q., C.K., J.G. and J.T.G.; resources, J.G., F.W., J.S., D.J.S., C.H., M.M., J.J.C. and J.T.G.; data curation, H.-Q.Q. and J.G.; writing—original draft preparation, H.-Q.Q. and H.H.; writing—review and editing, H.-Q.Q. and H.H.; supervision, H.H.; project administration, H.H. and C.K. All authors have read and agreed to the published version of the manuscript.
Funding
The study was supported by Institutional Development Funds from the Children’s Hospital of Philadelphia to the Center for Applied Genomics, the Neff Family Foundation, and the Children’s Hospital of Philadelphia Endowed Chair in Genomic Research (HH).
Institutional Review Board Statement
This study was exempted by the Institutional Review Board (IRB) of the Children’s Hospital of Philadelphia. Human participants and personal information were inaccessible to the research group.
Informed Consent Statement
All human subjects or their proxies provided written informed consent.
Data Availability Statement
Supporting data from this study can be obtained by emailing the corresponding author, Dr. Hakon Hakonarson.
Acknowledgments
We thank the volunteers who donated blood samples for this study. We also thank the research staff at the CAG for their valuable contributions.
Conflicts of Interest
The authors declare no potential conflict of interest with respect to the research, authorship, and/or publication of this article.
References
- Betsou, F.; Gaignaux, A.; Ammerlaan, W.; Norris, P.J.; Stone, M. Biospecimen science of blood for peripheral blood mononuclear cell (PBMC) functional applications. Curr. Pathobiol. Rep. 2019, 7, 17–27. [Google Scholar] [CrossRef]
- Saliba, A.-E.; Westermann, A.J.; Gorski, S.A.; Vogel, J. Single-cell RNA-seq: Advances and future challenges. Nucleic Acids Res. 2014, 42, 8845–8860. [Google Scholar] [CrossRef] [PubMed]
- Munshi, S.U.; Panda, H.; Holla, P.; Rewari, B.B.; Jameel, S. MicroRNA-150 is a potential biomarker of HIV/AIDS disease progression and therapy. PLoS ONE 2014, 9, e95920. [Google Scholar] [CrossRef] [PubMed]
- Luckheeram, R.V.; Zhou, R.; Verma, A.D.; Xia, B. CD4+ T cells: Differentiation and functions. Clin. Dev. Immunol. 2012, 2012, 925135. [Google Scholar] [CrossRef] [PubMed]
- Patel, T.; Cunningham, A.; Holland, M.; Daley, J.; Lazo, S.; Hodi, F.S.; Severgnini, M. Development of an 8-color antibody panel for functional phenotyping of human CD8+ cytotoxic T cells from peripheral blood mononuclear cells. Cytotechnology 2018, 70, 1–11. [Google Scholar] [CrossRef]
- Zhang, N.; Bevan, M.J. CD8(+) T cells: Foot soldiers of the immune system. Immunity 2011, 35, 161–168. [Google Scholar] [CrossRef]
- Srivastava, R.; Aggarwal, R.; Bhagat, M.; Chowdhury, A.; Naik, S. Alterations in natural killer cells and natural killer T cells during acute viral hepatitis E. J. Viral Hepat. 2008, 15, 910–916. [Google Scholar] [CrossRef]
- Seaman, W.E. Natural killer cells and natural killer T cells. Arthritis Rheum. 2000, 43, 1204–1217. [Google Scholar] [CrossRef]
- Kleiveland, C.R. Peripheral blood mononuclear cells. In The Impact of Food Bioactives on Health: In Vitro and Ex Vivo Models; Springer: Cham, Switzerland, 2015; pp. 161–167. [Google Scholar]
- Geissmann, F.; Manz, M.G.; Jung, S.; Sieweke, M.H.; Merad, M.; Ley, K. Development of monocytes, macrophages, and dendritic cells. Science 2010, 327, 656–661. [Google Scholar] [CrossRef]
- Ma, W.T.; Gao, F.; Gu, K.; Chen, D.K. The Role of Monocytes and Macrophages in Autoimmune Diseases: A Comprehensive Review. Front. Immunol. 2019, 10, 1140. [Google Scholar] [CrossRef]
- Tan, T.-T.; Coussens, L.M. Humoral immunity, inflammation and cancer. Curr. Opin. Immunol. 2007, 19, 209–216. [Google Scholar] [CrossRef]
- Gao, C.; Zhang, M.; Chen, L. The comparison of two single-cell sequencing platforms: BD rhapsody and 10× genomics chromium. Curr. Genom. 2020, 21, 602–609. [Google Scholar] [CrossRef] [PubMed]
- Wang, X.; He, Y.; Zhang, Q.; Ren, X.; Zhang, Z. Direct Comparative Analyses of 10X Genomics Chromium and Smart-seq2. Genom. Proteom. Bioinform. 2021, 19, 253–266. [Google Scholar] [CrossRef] [PubMed]
- Subramanian, A.; Tamayo, P.; Mootha, V.K.; Mukherjee, S.; Ebert, B.L.; Gillette, M.A.; Paulovich, A.; Pomeroy, S.L.; Golub, T.R.; Lander, E.S.; et al. Gene set enrichment analysis: A knowledge-based approach for interpreting genome-wide expression profiles. Proc. Natl. Acad. Sci. USA 2005, 102, 15545–15550. [Google Scholar] [CrossRef]
- Liberzon, A.; Birger, C.; Thorvaldsdóttir, H.; Ghandi, M.; Mesirov, J.P.; Tamayo, P. The Molecular Signatures Database (MSigDB) hallmark gene set collection. Cell Syst. 2015, 1, 417–425. [Google Scholar] [CrossRef] [PubMed]
- Naoum, F.A.; Martin, F.H.d.O.; Valejo, M.R.; Oliveira, M.G.d.L. Assessment of time-dependent white blood cells degeneration induced by blood storage on automated parameters and morphology examination. Int. J. Lab. Hematol. 2020, 42, e185–e188. [Google Scholar] [CrossRef]
- Song, S.; Goodwin, J.; Zhang, J.; Babbitt, B.; Lathey, J.L. Effect of contaminating red blood cells on OKT3-mediated polyclonal activation of peripheral blood mononuclear cells. Clin. Vaccine Immunol. 2002, 9, 708–712. [Google Scholar] [CrossRef][Green Version]
- Kataranovski, M.; Kataranovski, D.; Savic, D.; Jovcic, G.; Bogdanovic, Z.; Jovanovic, T. Granulocyte and plasma cytokine activity in acute cadmium intoxication in rats. Physiol. Res. 1998, 47, 453–461. [Google Scholar]
- McKenna, K.C.; Beatty, K.M.; Vicetti Miguel, R.; Bilonick, R.A. Delayed processing of blood increases the frequency of activated CD11b+ CD15+ granulocytes which inhibit T cell function. J. Immunol. Methods 2009, 341, 68–75. [Google Scholar] [CrossRef]
- Presicce, P.; Cappelletti, M.; Senthamaraikannan, P.; Ma, F.; Morselli, M.; Jackson, C.M.; Mukherjee, S.; Miller, L.A.; Pellegrini, M.; Jobe, A.H. TNF-signaling modulates neutrophil-mediated immunity at the feto-maternal interface during LPS-induced intrauterine inflammation. Front. Immunol. 2020, 11, 558. [Google Scholar] [CrossRef]
- García-Gutiérrez, L.; Delgado, M.D.; León, J. MYC Oncogene Contributions to Release of Cell Cycle Brakes. Genes 2019, 10, 244. [Google Scholar] [CrossRef] [PubMed]
- Foulds, K.E.; Zenewicz, L.A.; Shedlock, D.J.; Jiang, J.; Troy, A.E.; Shen, H. Cutting edge: CD4 and CD8 T cells are intrinsically different in their proliferative responses. J. Immunol. (Baltim. Md. 1950) 2002, 168, 1528–1532. [Google Scholar] [CrossRef] [PubMed]
- Doherty, D.G.; Melo, A.M.; Moreno-Olivera, A.; Solomos, A.C. Activation and Regulation of B Cell Responses by Invariant Natural Killer T Cells. Front. Immunol. 2018, 9, 1360. [Google Scholar] [CrossRef] [PubMed]
- Long, K.; Meier, C.; Ward, M.; Williams, D.; Woodward, J.; Bernard, A. Immunologic profiles of red blood cells using in vitro models of transfusion. J. Surg. Res. 2013, 184, 567–571. [Google Scholar] [CrossRef] [PubMed]
- Lane, T.A.; Lamkin, G.E. Defective energy metabolism in stored granulocytes. Transfusion 1982, 22, 368–373. [Google Scholar] [CrossRef]
- Khavkin, T.; Kuchler, M.; Carl, M.; Murphy, J.R.; Baqar, S.; Triemer, R.E.; Liao, M.J.; Testa, D. Activation and enhanced contact of human T-lymphocytes with autologous red blood cells are required for their stable adherence at 37 degrees. Virchows Archiv. B Cell Pathol. Incl. Mol. Pathol. 1993, 64, 351–359. [Google Scholar] [CrossRef]
- Krappmann, D.; Wegener, E.; Sunami, Y.; Esen, M.; Thiel, A.; Mordmuller, B.; Scheidereit, C. The IkappaB kinase complex and NF-kappaB act as master regulators of lipopolysaccharide-induced gene expression and control subordinate activation of AP-1. Mol. Cell. Biol. 2004, 24, 6488–6500. [Google Scholar] [CrossRef]
- Fujioka, S.; Niu, J.; Schmidt, C.; Sclabas, G.M.; Peng, B.; Uwagawa, T.; Li, Z.; Evans, D.B.; Abbruzzese, J.L.; Chiao, P.J. NF-kappaB and AP-1 connection: Mechanism of NF-kappaB-dependent regulation of AP-1 activity. Mol. Cell. Biol. 2004, 24, 7806–7819. [Google Scholar] [CrossRef]
- Marx, J.L. jun Is bustin′ out all over. Science 1988, 242, 1377–1378. [Google Scholar] [CrossRef]
- Baumann, S.; Hess, J.; Eichhorst, S.T.; Krueger, A.; Angel, P.; Krammer, P.H.; Kirchhoff, S. An unexpected role for FosB in activation-induced cell death of T cells. Oncogene 2003, 22, 1333–1339. [Google Scholar] [CrossRef]
- Liu, B.; Hou, Q.; Ma, Y.; Han, X. HIPK3 Mediates Inflammatory Cytokines and Oxidative Stress Markers in Monocytes in a Rat Model of Sepsis Through the JNK/c-Jun Signaling Pathway. Inflammation 2020, 43, 1127–1142. [Google Scholar] [CrossRef] [PubMed]
- Nakabeppu, Y.; Nathans, D. A naturally occurring truncated form of FosB that inhibits Fos/Jun transcriptional activity. Cell 1991, 64, 751–759. [Google Scholar] [CrossRef] [PubMed]
- Ku, H.C.; Cheng, C.F. Master Regulator Activating Transcription Factor 3 (ATF3) in Metabolic Homeostasis and Cancer. Front. Endocrinol. 2020, 11, 556. [Google Scholar] [CrossRef] [PubMed]
- Montminy, M.R.; Bilezikjian, L.M. Binding of a nuclear protein to the cyclic-AMP response element of the somatostatin gene. Nature 1987, 328, 175–178. [Google Scholar] [CrossRef] [PubMed]
- Hai, T. The ATF transcription factors in cellular adaptive responses. In Gene Expression and Regulation; Springer: New York, NY, USA, 2006; pp. 329–340. [Google Scholar]
- Lee, J.G.; Heur, M. Interleukin-1β enhances cell migration through AP-1 and NF-κB pathway-dependent FGF2 expression in human corneal endothelial cells. Biol. Cell 2013, 105, 175–189. [Google Scholar] [CrossRef]
- Wan, P.; Zhang, S.; Ruan, Z.; Liu, X.; Yang, G.; Jia, Y.; Li, Y.; Pan, P.; Wang, W.; Li, G.; et al. AP-1 signaling pathway promotes pro-IL-1β transcription to facilitate NLRP3 inflammasome activation upon influenza A virus infection. Virulence 2022, 13, 502–513. [Google Scholar] [CrossRef]
- Gendelman, R.; Xing, H.; Mirzoeva, O.K.; Sarde, P.; Curtis, C.; Feiler, H.S.; McDonagh, P.; Gray, J.W.; Khalil, I.; Korn, W.M. Bayesian Network Inference Modeling Identifies TRIB1 as a Novel Regulator of Cell-Cycle Progression and Survival in Cancer Cells. Cancer Res. 2017, 77, 1575–1585. [Google Scholar] [CrossRef]
- Chen, L.; Wang, S.; Zhou, Y.; Wu, X.; Entin, I.; Epstein, J.; Yaccoby, S.; Xiong, W.; Barlogie, B.; Shaughnessy, J.D., Jr.; et al. Identification of early growth response protein 1 (EGR-1) as a novel target for JUN-induced apoptosis in multiple myeloma. Blood 2010, 115, 61–70. [Google Scholar] [CrossRef]
- Kaufmann, K.; Thiel, G. Epidermal growth factor and thrombin induced proliferation of immortalized human keratinocytes is coupled to the synthesis of Egr-1, a zinc finger transcriptional regulator. J. Cell. Biochem. 2002, 85, 381–391. [Google Scholar] [CrossRef]
- Liu, C.; Rangnekar, V.M.; Adamson, E.; Mercola, D. Suppression of growth and transformation and induction of apoptosis by EGR-1. Cancer Gene Ther. 1998, 5, 3–28. [Google Scholar]
- Canzoneri, R.; Naipauer, J.; Stedile, M.; Rodriguez Peña, A.; Lacunza, E.; Gandini, N.A.; Curino, A.C.; Facchinetti, M.M.; Coso, O.A.; Kordon, E.; et al. Identification of an AP1-ZFP36 Regulatory Network Associated with Breast Cancer Prognosis. J. Mammary Gland Biol. Neoplasia 2020, 25, 163–172. [Google Scholar] [CrossRef] [PubMed]
- Doi, K.; Takeuchi, H.; Sakurai, H. PP2A-B55 and its adapter proteins IER2 and IER5 regulate the activity of RB family proteins and the expression of cell cycle-related genes. FEBS J. 2022. [Google Scholar] [CrossRef]
- Patterson, K.I.; Brummer, T.; O′Brien, P.M.; Daly, R.J. Dual-specificity phosphatases: Critical regulators with diverse cellular targets. Biochem. J. 2009, 418, 475–489. [Google Scholar] [CrossRef] [PubMed]
- McKinsey, T.A.; Chu, Z.-L.; Tedder, T.F.; Ballard, D.W. Transcription factor NF-κB regulates inducible CD83 gene expression in activated T lymphocytes. Mol. Immunol. 2000, 37, 783–788. [Google Scholar] [CrossRef]
- Krzyzak, L.; Seitz, C.; Urbat, A.; Hutzler, S.; Ostalecki, C.; Gläsner, J.; Hiergeist, A.; Gessner, A.; Winkler, T.H.; Steinkasserer, A.; et al. CD83 Modulates B Cell Activation and Germinal Center Responses. J. Immunol. (Baltim. Md. 1950) 2016, 196, 3581–3594. [Google Scholar] [CrossRef] [PubMed]
- Breloer, M.; Fleischer, B. CD83 regulates lymphocyte maturation, activation and homeostasis. Trends Immunol. 2008, 29, 186–194. [Google Scholar] [CrossRef] [PubMed]
- Taniyama, Y.; Kuroki, R.; Omura, F.; Seko, C.; Kikuchi, M. Evidence for intramolecular disulfide bond shuffling in the folding of mutant human lysozyme. J. Biol. Chem. 1991, 266, 6456–6461. [Google Scholar] [CrossRef] [PubMed]
- Ryckman, C.; Vandal, K.; Rouleau, P.; Talbot, M.; Tessier, P.A. Proinflammatory activities of S100: Proteins S100A8, S100A9, and S100A8/A9 induce neutrophil chemotaxis and adhesion. J. Immunol. (Baltim. Md. 1950) 2003, 170, 3233–3242. [Google Scholar] [CrossRef]
Disclaimer/Publisher’s Note: The statements, opinions and data contained in all publications are solely those of the individual author(s) and contributor(s) and not of MDPI and/or the editor(s). MDPI and/or the editor(s) disclaim responsibility for any injury to people or property resulting from any ideas, methods, instructions or products referred to in the content. |
© 2023 by the authors. Licensee MDPI, Basel, Switzerland. This article is an open access article distributed under the terms and conditions of the Creative Commons Attribution (CC BY) license (https://creativecommons.org/licenses/by/4.0/).