Abstract
In this paper, we describe how researchers and weather forecasters work together to make satellite sounding data sets more useful in severe weather forecasting applications through participation in National Oceanic and Atmospheric Administration (NOAA)’s Hazardous Weather Testbed (HWT) and JPSS Proving Ground and Risk Reduction (PGRR) program. The HWT provides a forum for collaboration to improve products ahead of widespread operational deployment. We found that the utilization of the NOAA-Unique Combined Atmospheric Processing System (NUCAPS) soundings was improved when the product developer and forecaster directly communicated to overcome misunderstandings and to refine user requirements. Here we share our adaptive strategy for (1) assessing when and where NUCAPS soundings improved operational forecasts by using real, convective case studies and (2) working to increase NUCAPS utilization by improving existing products through direct, face-to-face interaction. Our goal is to discuss the lessons we learned and to share both our successes and challenges working with the weather forecasting community in designing, refining, and promoting novel products. We foresee that our experience in the NUCAPS product development life cycle may be relevant to other communities who can then build on these strategies to transition their products from research to operations (and operations back to research) within the satellite meteorological community.
1. Introduction
National Weather Service (NWS) forecasters have access to over 300 satellite data sets within the Advanced Weather Interactive Processing System (AWIPS), their data visualization and decision support platform. For robust hazard prediction, it is paramount that these satellite data sets give forecasters information that is easily accessible, timely, and relevant. To transition satellite data from research into useful weather forecasting and decision-making, the National Oceanic and Atmospheric Administration (NOAA) administers several annual testbeds (https://www.testbeds.noaa.gov/) that each focus on scenarios encountered in areas such as aviation, hydrometeorology, space weather, hurricanes, and severe storms. Of the testbeds, the Hazardous Weather Testbed (HWT) fosters an environment where researchers and forecasters collaboratively assess new technology for issuing warnings and forecasting severe weather [1]. Three goals of the HWT are to (1) train forecasters in new technology (2) allow forecasters to evaluate new technology ahead of their release into operations and (3) refine and improve data according to forecaster feedback. Forecasters participating in the HWT provide feedback through surveys, written descriptions and screenshots of scenarios they encountered (e.g., blog.nssl.noaa.gov/ewp), and through direct communication with the researchers who are present during testing. Since the experiment simulates the forecaster work environment, this feedback guides researchers to make improvements that are relevant to operational forecasting [2,3,4]. The phrase “operational forecasting,” or more colloquially, operations, refers to the active and non-stop data collection and weather prediction needed to protect human life and property.
In this paper, we focus on how the satellite sounding datasets generated by the NOAA Unique Combined Atmospheric Processing System (NUCAPS) [5,6,7,8] were transitioned from a technology primarily used by scientific researchers to one that could also be used for severe weather forecasting. These activities were conducted as part of the Satellite Sounding Initiative within the Joint Polar Satellite System (JPSS) Proving Ground and Risk Reduction Program (https://www.jpss.noaa.gov/proving_ground.html) and represent a multi-organizational and agency partnership. We refer to NUCAPS and NUCAPS-derived datasets as satellite data products, a general term that describes observational data acquired by satellite instruments which are calibrated and geolocated prior to being processed with a retrieval algorithm and before distribution to the users. Like many products, NUCAPS was repeatedly tested to evaluate incremental improvements and to adjust to changing forecaster needs. From the 2014 to 2019 HWTs, forecasters provided feedback and identified case studies that led to refinements of NUCAPS accuracy through retrieval algorithm improvements. Additionally, forecaster–researcher interactions improved how NUCAPS was displayed to the forecaster and how quickly the data were delivered following a satellite overpass. For example, in the first HWT, NUCAPS developers participated by answering questions via email. The following year, developers were physically present during the HWT, developers improved the usefulness of NUCAPS by displaying it as a Skew-T, the primary way forecasters inspect data from radiosondes. This back-and-forth communication and resulting product improvement are referred to as “operations to research” and “research to operations” [2]. Without this partnership, we could not have successfully implemented NUCAPS for severe weather prediction.
When NUCAPS was configured for AWIPS, it was the first time that forecasters could visualize satellite soundings in real-time. From written survey responses in the testbed, forecasters communicated that satellite soundings were valuable for interrogating uncertainty in Numerical Weather Prediction (NWP) models. Secondly, satellite soundings provide forecasters with data between radiosondes launch times. Radiosondes are launched around 00 and 12 UTC from 70 locations across the United States, making them sparse in time and space [9]. For comparison, radiosondes provide a total of 140 profiles each day, whereas NUCAPS can produce 120 profiles in 30 seconds across a swath that is 2200 km wide. Globally, 324,000 profiles are produced daily, during both day and night. Moreover, forecasters have communicated that these wide swaths improve situational awareness before hazards develop. From forecaster feedback, we learned that increasing the temporal frequency of sounding observations is critical to nowcasting severe weather [10,11]; one satellite is not enough. Now in the HWT, NUCAPS profiles are available from all NOAA operational satellite platforms (Suomi National-Polar-orbiting Partnership (Suomi NPP), NOAA-20, MetOp-A, and MetOp-B). We utilized over 300 scenarios since 2014 to determine how and when forecasters use NUCAPS soundings in their decision making during severe weather outbreaks [11]. More recently, forecasters communicated the novel combinations of NUCAPS soundings and other satellite, model, and in-situ data sources that helped them to predict severe weather. Upon introduction into AWIPS and by participating in the HWT, we were able to respond to make improvements based on forecaster needs, understand NUCAPS strengths and weaknesses through specific examples provided by forecasters, and discover how to pair NUCAPS with the latest observation and model datasets in operations.
As developers, we have learned a few valuable lessons about product design and development for operational use. For example, in feedback from 2015 and 2016 HWTs, forecasters favored models and observations that are produced independently of each other [12]. However, since then, the quantity of model data and satellite products available to forecasters has only increased over time. In 2019, AWIPS contained over 35 numerical models, gridded data, and point data sources; each of the data sources contain a variety of variables and can be displayed in multiple projections (http://unidata.github.io/awips2/cave/d2d-gridded-models). For nowcasting thunderstorms and tornadoes, forecasters are highly time-limited and must focus their attention only on the most relevant products [11]. Data that blends both models and observations allow forecasters to inspect two critical datasets simultaneously. This is contrary to some of our earlier findings that valued clear separation. So, one “lesson learned” is that improvements do not necessarily evolve incrementally but more like a random walk process.
This paper describes how we refined NUCAPS soundings and derived products within a NOAA testbed environment to more readily meet forecaster needs for severe weather prediction. Each year our approach has evolved and our experience in the HWT is unique. As we introduce new NUCAPS-derived data sets, we have an opportunity to apply our lessons learned and tailor NUCAPS for the specific applications. We will describe how our efforts improved NUCAPS utility for severe weather forecasting and provide guidance on how to transition satellite retrievals from research to operations, both in a testbed and real forecast environment. By doing so, we hope to prevent other valuable products from becoming “skeletons in the valley of death” [13].
2. Materials and Methods
2.1. Datasets
NOAA’s Office of Satellite and Product Operations (OSPO) runs NUCAPS operationally to retrieve atmospheric profiles, referred to as “soundings,” from measurements made by the Cross-track Infrared Sounder (CrIS) and Advanced Technology Microwave Sounder (ATMS) instruments onboard Suomi NPP and NOAA-20 polar orbiting satellites. NUCAPS sounding variables within AWIPS include profiles of temperature, moisture, and Ozone (O3) in clear and partly cloudy scenes (Figure 1). NUCAPS begins by running a microwave (MW)-only retrieval (Step A) that employs an Optimal-Estimation method [14] using the 22 ATMS channels to generate profiles of temperature, water vapor, and liquid water for all non-precipitating scenes. NUCAPS then derives a first guess estimate of temperature and moisture (respectively labelled T and q, in Figure 1) using a statistical linear regression with static coefficients trained off-line from an ensemble of historical radiance measurements from CrIS and ATMS that are collocated with modelled profiles from the European Centre for Medium-Range Weather Forecasts (ECMWF). This combined MW and infrared (IR) regression is called the cloudy regression (Step B). The cloudy regression state is used to derive the cloud cleared radiances for CrIS (Step C) within a field of regard (FOR), which is a 3 x 3 array of collocated CrIS and ATMS footprints. Cloud clearing is described in detail elsewhere [6,15,16,17], but a few things are worth noting here. Cloud clearing derives a clear-sky estimate of the IR measurements in a FOR by removing the radiative effects of clouds. By doing so, NUCAPS can retrieve soundings of the atmosphere past clouds, not through them. Cloud clearing fails when a FOR is uniformly cloudy and there is no radiative pathway past the clouds to the Earth surface. We then utilize another “cloud cleared regression” (Step D) that was trained on historical cloud cleared CrIS radiances, ATMS, and co-located ECMWF to derive a first guess for temperature and moisture profiles from the cloud cleared radiances for this specific scene. NUCAPS then retrieves temperature and moisture profiles (Step E) from a combination of the 22 ATMS and a subset of cloud-cleared CrIS channels, with the cloud cleared regression retrieval as first guess. We also retrieve a number of trace gas profiles (ozone, carbon monoxide, etc.) from subsets of cloud cleared CrIS channels. This step is known as the IR + MW retrieval and it employs an optimal-estimation approach that maximizes the information content of the hyper-spectral infrared radiances [6]. The MW-only retrieval is used where the cloud clearing failed due to uniform clouds or difficult surface conditions. The NUCAPS sounding product contains an IR + MW retrieved sounding at each FOR with some of them flagged as failed. The retrieval can fail for various reasons (uniform clouds, lack of convergence, etc.) but NUCAPS creates a simple “stop-light” approach using green, yellow, and red flags to describe the profile quality in AWIPS. We will discuss this approach in greater detail in Section 2.1.
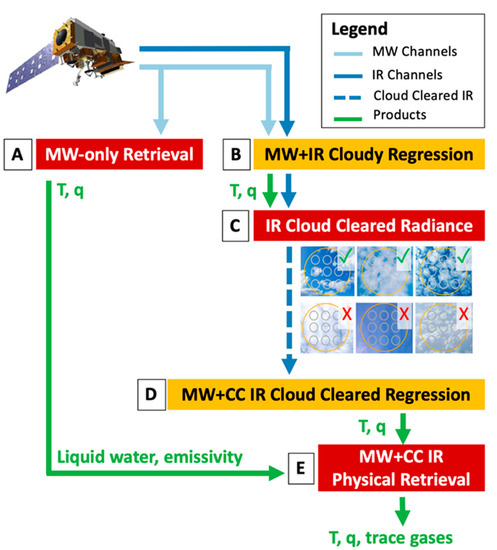
Figure 1.
High-level flow chart of the step-wise NOAA-Unique Combined Atmospheric Processing System (NUCAPS) retrieval algorithm that outputs temperature (T), moisture (q) and trace gases. In Advanced Weather Interactive Processing Systems (AWIPS), NUCAPS retrievals of T, q and ozone (O3) are color-coded as red, yellow and green to indicate if and when they failed quality control checks. Steps B and D, which are yellow black text, are regression steps, and if they fail they will be flagged as yellow in AWIPS; these retrievals should be used with caution. Steps A, C, and E, which are red with white text, are cloud clearing or retrieval stages of the algorithm. If any of these fails, the retrieval is unlikely to yield meaningful results, and they will be flagged red in AWIPS. The entire algorithm runs regardless if any one step passes or fails.
NOAA continually validates NUCAPS with in-situ measurements from field campaigns [18,19]. In AWIPS, forecasters have access to all NUCAPS retrievals, whether they are flagged successful or not. The reason being that while retrievals may have significant errors below clouds, they can be useful in examining the middle to upper atmosphere above cloud tops. In general, the accuracy of NUCAPS temperature and moisture retrievals is well established and meet NOAA requirements (1K for temperature and 10% for water vapor). However, the accuracy of individual retrievals varies from scene to scene, depending on the amount and types of clouds. Forecasters query NUCAPS soundings one by one within and around storm systems and therefore need to understand how to interpret them correctly, given the prevailing conditions. This is where we distinguish the value between quantitative (statistical validation) versus qualitative (meaning in applications) evaluation. Our participation in the HWT addresses the latter.
2.1.1. Baseline NUCAPS Soundings
In 2019, four NUCAPS-derived products were tested in the HWT: baseline, modified, gridded, and forecast. Baseline NUCAPS is the NOAA operational product, which is currently available at all NWS forecast offices through AWIPS.
When baseline NUCAPS was first demonstrated in the 2015 HWT, all retrievals were displayed without any indication of whether they passed quality control or not. This meant that forecaster had no way of knowing whether a retrieval accurately characterized the atmospheric structure or not. One of the first requests forecasters made, therefore, was that information on retrieval quality be readily available and visually communicated [20]. Now we see baseline NUCAPS in AWIPS displayed as three colors corresponding to different stages of success (Figure 2a). A green flag indicates a retrieval that successfully passed all quality control flags. It signals to forecasters that they can have confidence in the NUCAPS sounding. Yellow indicates MW-only was successful but one or both of the IR + MW regressions failed (Figure 1, steps B and D, respectively). Red signals that the MW-only retrievals, cloud clearing, and/or the IR + MW physical retrievals failed (Figure 1, steps A, C, and/or E, respectively). Retrievals that are flagged yellow or red may still be useful to the forecaster but should be interpreted with caution as they will contain greater uncertainty due to clouds.
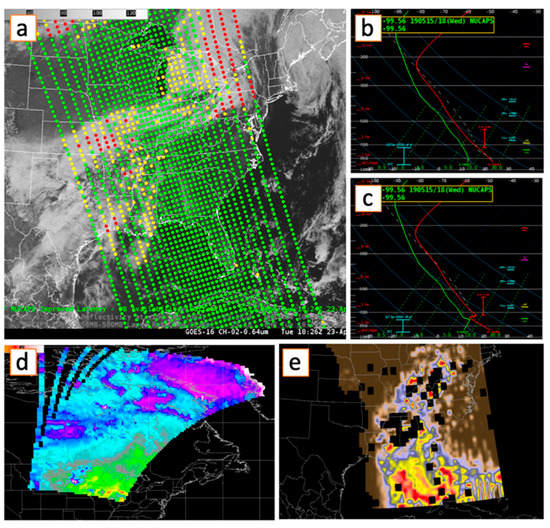
Figure 2.
The four NUCAPS products demonstrated in the 2019 Hazardous Weather Testbed Experimental Forecast Program: Baseline NUCAPS soundings in (a) plan view with quality flags. The NSHARP display of (b) baseline NUCAPS soundings and (c) modified soundings northeast of Bismarck, ND on May 15, 2019 ahead of a low-level moisture gradient; (d) gridded NUCAPS showing 2FHAG Temperature on June 3, 2019; and (e) NUCAPS-Forecast on May 10, 2019 showing CAPE gradients five hours past initialization.
When displayed in AWIPS, baseline NUCAPS appears in the separate display as a Skew-T, which is the same tool that displays radiosondes (Figure 2b). While the profiles look very similar, some differences between NUCAPS and radiosonde Skew-T’s were noticeable to forecasters. These differences occur because (1) sounder moisture measurements are layers and whereas radiosondes take point observations at a specific pressure levels, (2) sounders typically have a 2.7 km vertical resolution, which is much lower than the radiosonde resolution of 20 m, and (3) NUCAPS utilizes smoothing operators within the retrieval itself [21]. In the HWT, these differences are typically explained in training prior to the beginning of the experiment, or with face-to-face conversation while forecasters evaluate the product.
2.1.2. Modified NUCAPS Soundings
Modified NUCAPS (Figure 2c) was introduced to the HWT in 2017 to test the usefulness of boundary layer adjustments for predicting severe weather; this was developed as a result of feedback from the first time NUCAPS was demonstrated at HWT [22]. The NUCAPS boundary layer representation remains an ongoing challenge because there is high horizontal variation at the surface that NUCAPS represents for an FOR that has a diameter between 50 km at nadir to 150 km at the scan edge [23]. Although horizontal variation inhibits a representative profile, steep vertical thermal gradients improve the vertical structure and isothermal vertical profiles are more difficult to retrieve [21]. So, the ability to well-characterize the boundary layer varies depending on atmospheric conditions.
To address these challenges, the modified NUCAPS product replaces the surface layer temperature and dew point temperature with values from the Real-Time Mesoscale Analysis (RTMA) [24]. The remainder of the boundary layer is assumed to be well mixed in potential temperature and water vapor mixing ratio. The height of the boundary layer is measured using both RTMA and Geostationary Operational Environmental Satellite (GOES) Advanced Baseline Imager (ABI) observations. Since the boundary layer is adjusted with in situ and satellite observations, the modified NUCAPS profiles are model independent.
2.1.3. Gridded NUCAPS
Gridded NUCAPS [3,25] displays horizontal “slices” through a swath of NUCAPS soundings at specific pressure levels, which includes humidity and temperature as well as additional derived fields, such as lapse rate and stability indices for severe weather potential (Figure 2d). The horizontal display enables quick visualization of hotspots or areas of interest with convective potential. As such, they provide the context, or situational awareness, prior for the interrogation of individual Skew-T diagrams. Additionally, gridded NUCAPS can be overlaid on other imagery, such as GOES ABI data and can be compared to model fields.
When initially introduced to the 2017 HWT, gridded NUCAPS was filtered so that all retrievals colored either yellow or red were removed from the display to avoid introducing spurious features. This, however, introduced gaps which the forecasters strongly disliked. They are used to evaluating model fields with smooth, uninterrupted spatial gradients and indicated that they prefer the ability to mentally filter unrealistic values [26]. So, in later HWT demonstrations gridded NUCAPS was not filtered based on quality control thresholds and forecasters were encouraged to overlay the color-coded sounding data to see retrieval quality and examine unbroken gradients in stability indices, temperature and moisture. This feedback-training cycle improved the usability of gridded NUCPAS prior to operational implementation in AWIPS version 19.2.1.
2.1.4. NUCAPS-Forecast
In 2019, NUCAPS-Forecast was introduced (Figure 2e). Soundings are advected forward in time assuming adiabatic parcel theory [27] throughout the NUCAPS swath using HYbrid Single-Particle Lagrangian Integrated Trajectory (HYSPLIT) [28] trajectories driven by numerical weather prediction (NWP) model forecast wind fields. The NWP winds are obtained from the Global Forecast System (GFS) or the High-Resolution Rapid Refresh (HRRR) forecast fields; the former was used for the first version of NUCAPS-Forecast within AWIPS, while the latter is currently being tested for future operations. The data are quality controlled, and only observations with good retrievals are advected. The rebuilt soundings are generated in one-hour increments for up to 6 h in the future and are regridded to a 0.25 degree spatial resolution. Stability indices (e.g., Convective Available Potential Energy (CAPE), Convective Inhibition, Equilibrium Level, Lifted Condensation Level, and Level of Free Convection) were calculated with SHARPpy and made available at one-hour increments for a total of 6 h following the 1:30 a.m. and 1:30 p.m. overpasses.
While gridded NUCAPS was developed in response to forecasters requests to see horizontal gradients in moisture, temperature and stability indices, NUCAPS-Forecast was created in response to their desire to have increased temporal coverage. The “first look” of this product at HWT allowed us to gather feedback on a blended model-observation hybrid product, and several cases of interest were documented by forecasters.
2.2. Methods
2.2.1. Hazardous Weather Testbed Design
The HWT takes place between April and June of each year. During this period, there is often significant convective activity over portions of the continental United States (CONUS), giving HWT forecasters daily opportunities to evaluate products in real time. The HWT consists of two coordinated programs, one that focuses on improving prediction (Experimental Forecast Program (EFP)) and another on the warning systems (Experimental Warning Program (EWP)). While NUCAPS was evaluated in the EWP, we describe both because the programs are coordinated. In the morning, the EFP produces convective-centric forecasts, which provide spatial and temporal focus regions and strategy for the EWP to utilize later in the day. The EWP typically consists of six forecasters, who apply to the HWT and are selected by the facilitators, most from the NWS but often includes military and broadcast meteorologists. To get up to speed quickly, forecasters in the EWP receive digital training videos for each product demonstrated in the HWT, and on arrival, “quick guides” to reference during forecast and warning exercises. Four days of the week included live forecasting for eight hours, and the last day was used as a debrief session and presentations (Tales from the Testbed, https://hwt.nssl.noaa.gov/tales/).
The forecasters in the EWP begin start their day with a morning briefing. During this briefing discussion, forecasters can give verbal product feedback and ask questions that they had from the day before. Forecasters were paired into groups and assigned a region based on the EFP forecast discussion and the Storm Prediction Center (SPC) convective outlook. The forecaster can issue warnings on potential severe storms using the AWIPS workstation, which were internal to the HWT. If the hazard risk dissipates early in the shift, a backup region is used.
To document feedback, we use three methods to collect data from participating forecasters during the HWT, (1) written descriptions and screenshots, (2) survey responses, and (3) a debrief at the end of the week. Aside from the in-person meetings and debriefs, the responses are anonymous. As developers, we are present in the room but do not interfere with forecasts as our primary goal is to observe, respond to questions, engage in discussion, and to resolve technical glitches if they occur.
2.2.2. Methods for Product Delivery
During the 2019 HWT, gridded NUCAPS, modified NUCAPS, and NUCAPS-Forecast, were not available through the Satellite Broadcast Network (SBN), which is the operational data stream for NOAA NWS and external users. Instead, data were delivered online through a Local Data Manager (LDM) [29] from both the NASA Short-term Prediction Research and Transition (SPoRT) and Cooperative Institute for Research in the Atmosphere (CIRA).
2.2.3. Questionnaire Design
Surveys were administered at the end of each day and again at the end of each week. To prevent response fatigue on the part of the forecasters, each product being tested was limited to five questions.
While all NUCAPS products were derived from the baseline soundings, they were at different stages of their development cycle and the evaluation strategy differed. During the 2019 HWT, the baseline soundings were already operational in AWIPS and gridded NUCAPS release was planned for AWIPS version 19.2.1 (operational in September 2019); these were considered “mature” products. Modified NUCAPS and NUCAPS-Forecast were experimental products and not available outside of the HWT. For mature products, our objectives were to focus on how soundings can enhance forecasts of complex scenarios. Modified NUCAPS and NUCAPS-Forecast were both experimental products, so we focused on when and where these derived products were valuable to forecasters and listened for features that needed improvement. We were able to gather the most information during the questionnaires and the debrief sessions before the beginning of each day and at the end of each week.
In past HWTs, many of the case studies in written descriptions performed side-by-side comparisons of NUCAPS to model and/or radiosondes, which demonstrate real-world strengths and limitations to supplement quantitative validation studies on NUCAPS [18]. We provided additional training materials in the quick guides and addressed the limitations during the training. This helped get forecasters up to speed on the strengths and weaknesses that are known from past HWTs.
Survey questions were a mixture of open-ended verbal descriptions and multiple choice, where forecasters selected from a list of provided categories or a ranking of a product’s utility. During past HWT demonstrations, questions were primarily open-ended to gather qualitative information; the advantage of this is to gather as much information as a forecaster is willing to give. However, multiple choice questions collect quantitative information, which is helpful for direct year-to-year comparisons of numerical rankings of product value. So, the mixture was useful for achieving both verbal descriptions and numerical rankings.
3. Results
At the end of the 2019 HWT, we analyzed over 61 written descriptions, 138 daily survey responses, and 36 weekly survey responses. Through this process, we sought to identify case studies to discover how the data were used and where they succeeded or failed. Additionally, we used the survey results to gain a more general understanding of the utility of NUCAPS products in severe weather forecasting and identify areas of improvement, both in product design and its application.
3.1. Utility of NUCAPS for Predicting Severe Storms
Figure 3 shows how useful forecasters found the four NUCAPS products at the end of each day. The regular and modified profiles were the highest rated. Generally, most forecasters said both regular (57%) and modified soundings (69%) were helpful (e.g., ‘Somewhat’ and ‘Very’ helpful) rather than not helpful (e.g., ‘Not’ and ‘Not so’ helpful), although few ranked it as ‘extremely’ helpful. Unlike geostationary data which has frequent observations, low-earth orbit satellites only have two overpasses a day over midlatitudes and there are coverage gaps between swaths over regions of CONUS that are south of 33 °N. The strength of NUCAPS is the availability of environmental soundings during the crucial early afternoon period, just before deep convection often develops, and in between routine radiosonde launches. Given that only a single, 1:30 PM local time overpass was available to the forecasters in the HWT, the moderate evaluations are promising. This outcome was expected, because forecasters synthesize a variety of datasets (e.g., model, satellite, radar, observations) to analyze the environment and make decisions on warnings. In addition, past HWT experiments revealed NUCAPS was used as a component of forecaster analysis to diagnose the environment and assess situational awareness (i.e., are thunderstorms likely or not likely to develop) rather than an independent tool to interrogate.
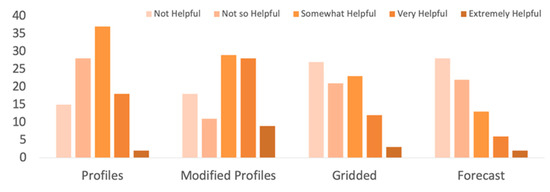
Figure 3.
Responses to “How helpful were the following NUCAPS products to making your forecast(s)?”.
In Figure 4a, we found that one out of 10 forecasters answered yes when asked “Did you use NUCAPS products as a component in your decision to issue a warning or Special Weather Statement?” Since the baseline NUCAPS soundings are already operational, we were interested in knowing how NUCAPS was integrated with more sophisticated analysis. In total, 90% of forecasters used NUCAPS with other datasets, primarily radiosondes (Figure 4b). However, NUCAPS was also extensively used with models and radar. In their written survey responses, forecasters stated that they used the RAP and HRRR the most, while 16 percent used other satellite products from GOES, which consisted of the AllSky LAP (an experimental blended model-geo satellite observation product), visible and IR, as well as TPW and RGB imagery to distinguish moisture and clouds. Note that since the testbed involved live forecasting, there was significant variability in the number of severe storms tracked.
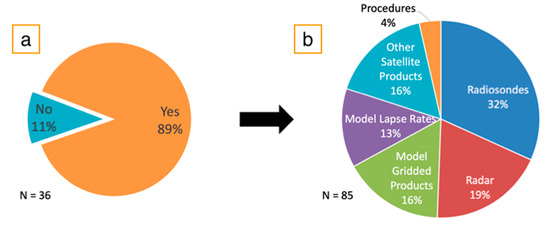
Figure 4.
Reponses to the question (a) “Did you use NUCAPS products as a component in your decision to issue a warning or Special Weather Statement?” and the question (b) “Which product(s) factored into your decision process?”.
When comparing the sounding products (Figure 5), more forecasters used the Modified NUCAPS (36%) over the baseline NUCAPS (25%). Recall from the data section, a limitation of baseline NUCAPS is the boundary layer representation; the Modified NUCAP adjusts the boundary layer with surface observations. Below 850mb, baseline NUCAPS retrievals can have an RMS error of 2 K and 20%, for temperature and water vapor mixing ratio, respectively, while still meeting product requirements [30]. More typically, validation studies have identified a bias of −1.5 K and 15% in moisture over land during the daytime [19,23]. The greater utilization of Modified NUCAPS in Figure 5 is consistent with qualitative survey questions and written descriptions, where forecasters corroborated mid-level and higher retrievals with radiosondes but found the baseline boundary layer inadequate at times. These results show that the boundary layer needs further improvement to increase value to a forecaster.
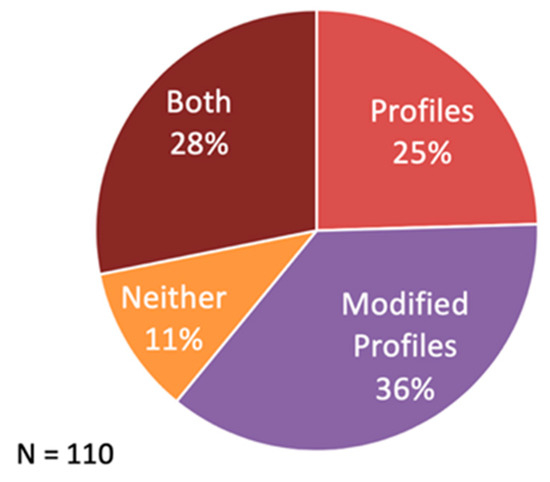
Figure 5.
Reponses to the question “Which of the following NUCAPS profiles did you use?”.
NUCAPS-Forecast made its first appearance in the 2019 HWT and showed skill in predicting convective initiation and evolution for 19 out of 28 forecasters (Figure 6). In written survey responses, forecasters stated that NUCAPS-Forecast could characterize unstable air movement, linear storm modes, and severe convection development well. In written descriptions, forecasters also favorably reviewed another blended dataset, the GOES AllSky product, which combines GFS and GOES observations into the same plan view [31,32]. Visually, NUCAPS-Forecast was blocky, noisy, and had missing data. The forecasters would have preferred the information filled in and data smoothed. To fill the gaps, forecasters expressed interest in combining NUCAPS with model results where retrievals are low quality, like the AllSky product [33].
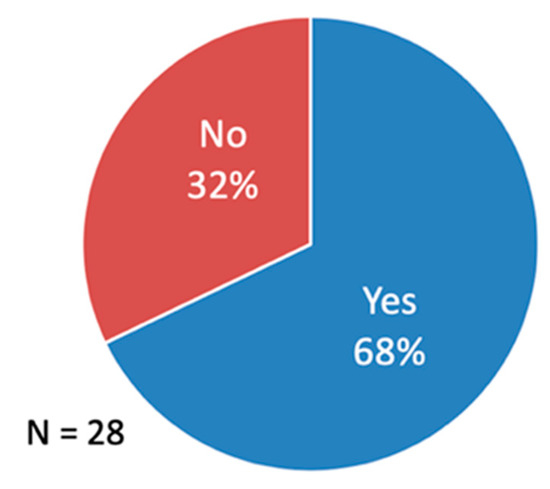
Figure 6.
Reponses to the question “If convection initiated, did NUCAPS-Forecast provide skill in determining the eventual convective intensity, convective mode, and type of severe weather produced?”.
3.2. Assessing Limitations for Storm Prediction
Figure 7 shows a breakdown of situations that impede utilization of NUCAPS. This list of possible limitations was compiled from written responses to qualitive survey questions from previous HWTs. In the following discussion, we will examine each category.
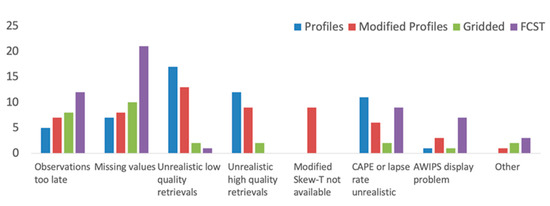
Figure 7.
Reponses to the question “Did any of the following prevent you from using NUCAPS products in your analysis?”.
In previous HWTs, data latency was a barrier to applying NUCAPS to severe weather forecasting [10,34]. Figure 7 shows that “observations too late” was less of a limitation for profiles than the other data sets. This is due to the way the data were fed into the HWT. NOAA-20 was not yet operational in AWIPS during the HWT, so it was provided via LDM by NASA SPoRT by pulling from the NESDIS Production Distribution and Access (PDA). Other datasets are derived from baseline NUCAPS, and modified soundings must wait until RTMA and GOES observations are available before processing the data and delivery. Gridded NUCAPS was also pushed after processing from the regular NUCAPS soundings, and the gridding process took 10–15 min. Additionally, NUCAPS-Forecast required parallel-processing to derive the product with HYSPLIT and deliver them with minimal latency. Thus, not all products were available at the same time. Fewer forecasters are limited by the baseline profile availability than the other products; modified NUCAPS, gridded NUCAPS, and NUCAPS-Forecast products were often only delayed by 10 min. This data staggering is an artifact of being in an experimental environment and the additional latency inherent in downloading, processing, and delivery of pre-processed products. While this was not a planned means of evaluating the impact of latency on nowcasting, result indicates how time sensitive the data are to forecasters. It is encouraging to see that for the regular sounding products, the latency was not particularly prohibitive. NOAA-20 replaced Suomi NPP in AWIPS as the operational satellite in July 2019, and the data transfer latency was reduced from 90–240 min to 40–60 min, due to the fact NOAA-20 is downlinked every half orbit.
Soundings, gridded, and modified datasets have no missing values within the swath, but have gaps in overpasses from the same satellite, which are large over the southern United States, where significant convective activity takes place. By utilizing both Suomi NPP and NOAA-20, all orbit-related gaps are filled within a 12-h period. NUCAPS-Forecast ranked less favorable because projections were made using only those profiles that passed the microwave and infrared physical retrieval step. This is where the needs of the operational community strongly differ from the research community. Researchers often want to see the “best quality” data, which are as close to the original observation, not data that has been interpolated [35]. However, generating the best quality data requires strict quality controls in the processing methodology, which may take too much time for the data to be operationally viable. Weather forecasters prefer good, high-quality data. However, the shorter time constraints necessary to make decisions in the operational environment requires them to use potentially lower-quality, quickly-deliverable data. To assess quality, they will rely on training and other datasets.
For severe weather applications, three categories of limitations in Figure 7 stem from boundary layer depictions: the unrealistic low quality, unrealistic high quality, and unrealistic CAPE or lapse rates. Forecasters wrote that CAPE values, which typically range from 2500–3500 J kg−1 for a highly unstable atmosphere, derived from NUCAPS had a difference of ±500 J kg−1 compared to models and radiosondes. NUCAPS is highly correlated with radiosondes for other stability parameters, such as total precipitable water (88%), lifted index (64%), total-totals index (69%), the K-Index (79%), and the Galvez–Davison Index (78%) [28]. However, for severe weather forecasting, a bias of a few degrees at the surface can significantly alter CAPE, which in turn can affect a forecasters assessment of severe weather potential. NUCAPS lapse rate measurements are more reliable and particularly useful for mid-level convection above 850 mb, above the surface layer. Promisingly, recent work explored improving NUCAPS-based CAPE by combining retrievals with model-based surface observations [36]. There are current research efforts to improve the boundary layer depiction (and thereby CAPE estimation) for operational forecasting.
Display problems were not ranked as a significant issue, but this contrasted with conversations we had with forecasters. Many vocally disliked the National Center Sounding and Hodograph Analysis and Research Program (NSHARP) sounding display in AWIPS, saying it was difficult to remember which profile they were inspecting or had previously inspected. It was also difficult to display side-by-side comparisons with Skew-Ts from other sources, such as models and radiosondes. Some were satisfied with the pop-up menu, but others found those displays to be not useful. However, this feedback would not have been received based on the survey alone, emphasizing the value of direct communication with the forecasters.
3.3. Forecasters Feedback to NUCAPS Developers
The weekly questionnaire allows forecasters to make more general statements about the utility of NUCAPS. Figure 8 shows that most forecasters would use NUCAPS in the future, particularly the modified product. This again reinforces the need to accurately represent the boundary layer to increase usability for severe weather forecasting. Most forecasters said they would ‘usually’ access the gridded NUCAPS product, which was introduced to enhance situational awareness. Interestingly, forecasters said they would ‘sometimes’ or ‘usually’ use the NUCAPS-Forecast product. In past HWTs, forecasters wanted model independence. However, their willingness to use a hybrid model-satellite product (albeit with significant revision to the product) shows a promising new area for continued development in the context of operations.
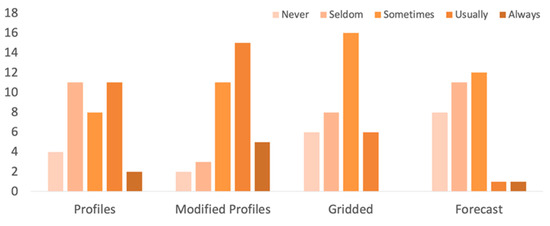
Figure 8.
Reponses to the question “How often would you use NUCAPS in the future?”.
At the end of week, we asked if forecasters had any suggestions for future improvement. Sixty percent of respondents requested more data. Geostationary datasets have the advantage over CONUS, where forecasters can make observations continuously. While it is not possible to increase the temporal sampling from a single polar-orbiting satellite, sounders are currently available on six JPSS, NASA, and European partner satellites. Full utilization of these resources would increase spatial and temporal availability of soundings. Presently, NWS has requirements to use a single satellite source, which as of July 2019 was switched from Suomi NPP to NOAA-20. A challenge on the part of the NWS is a saturation of data through their available channels. However, the files are distributed from the operational Environmental Data Record (EDR) which has extra data that are not used by AWIPS or the NWS. It is possible that a thinned file that contains multiple satellite swaths could be developed without increasing (and perhaps reducing) the file size. While this feedback is consistent with qualitative survey responses from past HWTs, the message was particularly strong in the 2019 questionnaire.
However, we also received new feedback. In personal correspondence, forecasters requested a blended model-observation dataset. This could lead to the boundary layer being replaced or convolved with model analysis, where models are stronger than satellites, and then observations used at the mid to upper levels, which is where they excel. An opportunity arises here where the forecast and modified soundings could be blended into a single product, with more aggressive boundary layer correction.
Forecasters verbally expressed dissatisfaction with the AWIPS visualization of soundings, for NUCAPS, model, and radiosondes. Many access sounding data through web-based visualizations or other software tools, such as BUFKIT (https://training.weather.gov/wdtd/tools/BUFKIT/) and SHARPpy (http://sharp.weather.ou.edu/dev/). Providing multiple avenues to access NUCAPS would give forecasters more options to display the data and can lead to feedback for updates to the baseline AWIPS.
A unique challenge of working with polar-orbiting data over geostationary is the intermittent nature of data availability. While researchers are familiar with the orbital dynamics of low-earth orbit satellites, forecasters need to make quick decisions and do not have time to consider when and where data will be in the future. One forecaster suggested tools to provide an alert when an overpass is available in their forecast area of responsibility. Products within AWIPS that bring attention to potential hazards, such as ProbSevere [37,38] (which was also tested in the HWT), were very useful to forecasters who must analyze significant amounts of data [11]. Thus, NUCAPS could also benefit from alerting forecasters to regions of high CAPE or large gradients in the lapse rate.
4. Discussion
Realistically, forecasters have limited time and will typically incorporate only the most reliable and relevant products into their decision making. For developers, the only way to accurately assess if a product is both reliable and relevant is by participating in a realistic operational environment, such as the NOAA testbeds. Below we provide suggestions for product evaluation in an operational environment:
- Develop a clear understanding of user needs, express realistic possibilities from the research community and be prepared to provide alternative products, tools or data delivery methods where possible. As product developers, we often focus our efforts on meeting statistical requirements (e.g., producing data within a target error threshold) to increase product utilization in the research community. Through the HWT, we found that product latency was also of primary importance to forecasters. Improving product delivery into AWIPS and reducing the NUCAPS latency to 30 min drastically increased the utility for severe weather forecasting. This is example also illustrates how developers, who are aware of what changes are feasible, can help forecasters make achievable requests for improvements. Additionally, providing alternative visualization tools, which for NUCAPS include BUFKIT and SHARPpy, gives forecasters flexibility to view low-latency data in whatever way is most effective for their decision making.
- Developers should document and communicate the limitations of their product(s) for the scenario being tested. Each testbed focuses on a specific scenario; in the case of the HWT EWP, the focus is on issuing warnings on time scales of approximately 0–2 h. If forecasters repeatedly do not find utility in the product for certain situations, this should be documented in HWT training materials such as quick guides and communicated in pre-testbed training. As part of the operations to research process, developers should incorporate these limitations in general user guides for the product.
- For mature products, foster more sophisticated analysis using training. As a product matures, the assessment should focus on how a product is used and with what other datasets. From HWT case studies, we suggest developing a screen capture of a live demonstration of the product. In addition to scenarios where the product works well, product limitations should be clearly described in the training.
- Surveys should contain a mixture of quantitative and qualitative questions. Quantitative results permit easier comparison between HWT demonstrations and are faster for forecasters to fill out. We recommend repeating a core set of 2–3 quantitative questions every year. The remaining questions can be in qualitative, written narrative form. Written responses to questions give forecasters the opportunity to describe their experiences in detail. Qualitative questions should be broad and include the what, when, where, and how to encourage a more detailed response.
- Products should meet quality requirements and be usable in AWIPS. No product development should occur in isolation; if possible, have a developer be physically present in the room. Screen captures show developers how the fixed product looks, but watching forecasters interact with the AWIPS system also provides insight. For instance, menu design enables quick data access and comparison. Accessing gridded NUCAPS was a challenge the first year, but menus were improved following feedback. NUCAPS has 100 different pressure levels and not every combination is used by forecasters; we found that a well-curated list of options is better than an exhaustive one. Not all changes can be easily made, however. Updates to AWIPS visualizations often take time to develop or update; for NUCAPS, forecasters did not like how they could not open and compare multiple soundings in the display or see which profile they were observing. These changes require updates to the baseline code and will take longer to push into operations.
5. Conclusions
The HWT and other operational forecasting testbeds provide a forum for researchers and forecasters to exchange ideas which can set the agenda for future research. However, for useful information to be exchanged, researchers need to develop a clear understanding of the role their work plays in operations. NWP models have been refined for 30 years to address forecaster needs. In most cases, satellite data will not have the same spatio-temporal resolution as a model. However, satellite datasets are valuable as a supporting data source to corroborate model output. In places where in-situ observations are sparse and models are not available or unreliable, satellite data will have a more primary role.
Regardless of where one works in the research product development, it is critical to clearly understand the needs of the forecasters. This requires direct communication and collaboration with forecasters and a flexible research strategy to address their feedback. NOAA testbeds are a useful means for evaluations in an operational setting, showing researchers the daily realities of operational weather forecasting. For products outside of operations, this may mean informally surveying forecasters, providing online tutorials and training, and initiating direct communication. Another informal means of bridging the research-user gap is making sure data are accessible and providing tools to visualize them. This can lead to the rapid development of a product beyond continued algorithm refinement.
Author Contributions
Conceptualization, M.G. and C.D.B.; software, E.B.B., J.F.D., and B.H.K.; investigation, R.B.E. and N.S.; resources, E.B.B.; writing, R.B.E. and N.S.; visualization, R.B.E.; supervision, M.G., C.D.B., W.S., and K.W.; project administration, W.S.; funding acquisition, M.G. All authors have read and agreed to the published version of the manuscript.
Funding
This research received no external funding.
Acknowledgments
Most aspects of this research were supported by the JPSS PGRR program. The portion of the research carried out at Marshall Space Flight Center was also supported by Tsengdar Lee of the Earth Science Division at NASA HQ as part of the NASA Short-term Prediction Research and Transition Center. The portion of the research carried out at Jet Propulsion Laboratory (JPL), California Institute of Technology, was also supported under a contract with the National Aeronautics and Space Administration.
Conflicts of Interest
The authors declare no conflict of interest.
References
- Ralph, F.M.; Intrieri, J.; Andra, D.; Atlas, R.; Boukabara, S.; Bright, D.; Davidson, P.; Entwistle, B.; Gaynor, J.; Goodman, S.; et al. The Emergence of Weather-Related Test Beds Linking Research and Forecasting Operations. Bull. Am. Meteorol. Soc. 2013, 94, 1187–1211. [Google Scholar] [CrossRef]
- Jedlovec, G. Transitioning research satellite data to the operational weather community: The SPoRT Paradigm [Organization Profiles]. IEEE Geosci. Remote Sens. Mag. 2013, 1, 62–66. [Google Scholar] [CrossRef]
- Weaver, G.M.; Smith, N.; Berndt, E.B.; White, K.D.; Dostalek, J.F.; Zavodsky, B.T. Addressing the Cold Air Aloft Aviation Challenge with Satellite Sounding Observations. J. Operational Meteorol. 2019, 138–152. [Google Scholar] [CrossRef]
- Smith, N.; Shontz, K.; Barnet, C.D. What Is a Satellite Measurement? Communicating Abstract Satellite Science Concepts to the World. In Proceedings of the 98th American Meteorological Society Annual Meeting, Austin, TX, USA, 8–11 January 2018. [Google Scholar]
- Smith, N.; White, K.D.; Berndt, E.B.; Zavodsky, B.T.; Wheeler, A.; Bowlan, M.A.; Barnet, C.D. NUCAPS in AWIPS: Rethinking Information Compression and Distribution for Fast Decision Making. In Proceedings of the 98th American Meteorological Society Annual Meeting, Austin, TX, USA, 8–11 January 2018. [Google Scholar]
- Susskind, J.; Barnet, C.D.; Blaisdell, J.M. Retrieval of atmospheric and surface parameters from AIRS/AMSU/HSB data in the presence of clouds. IEEE Trans. Geosci. Remote Sens. 2003, 41, 390–409. [Google Scholar] [CrossRef]
- Gambacorta, A.; Barnet, C.D. Methodology and Information Content of the NOAA NESDIS Operational Channel Selection for the Cross-Track Infrared Sounder (CrIS). IEEE Trans. Geosci. Remote Sens. 2013, 51, 3207–3216. [Google Scholar] [CrossRef]
- Gambacorta, A.; Nalli, N.R.; Barnet, C.D.; Tan, C.; Iturbide-Sanchez, F.; Zhang, K. The NOAA Unique Combined Atmospheric Processing System (NUCAPS) Algorithm Theoretical Basis Document. NOAA 2017. Available online: https://www.star.nesdis.noaa.gov/jpss/documents/ATBD/ATBD_NUCAPS_v2.0.pdf (accessed on 6 December 2019).
- Ackerman, S.A.; Platnick, S.; Bhartia, P.K.; Duncan, B.; L’Ecuyer, T.; Heidinger, A.; Skofronick-Jackson, G.; Loeb, N.; Schmit, T.; Smith, N. Satellites See the World’s Atmosphere. Meteorol. Monogr. 2018, 59, 4.1–4.53. [Google Scholar] [CrossRef]
- HWT Blog. 18Z NUCAPS (Op vs Experiment), Viewing, and Latency. The Satellite Proving Ground at the Hazardous Weather Testbed. 2017. Available online: https://goesrhwt.blogspot.com/2017/06/18z-nucaps-op-vs-experiment-viewing-and.html (accessed on 6 December 2019).
- Nietfield, D. NUCAPS Applications 2015. In Proceedings of the 2015 Satellite Proving Ground/User-Readiness Meeting, Kansas City, MO, USA, 15–19 June 2015. [Google Scholar]
- Smith, N.; Barnet, C.D.; Berndt, E.; Goldberg, M. Why Operational Meteorologists Need More Satellite Soundings. In Proceedings of the 99th American Meteorological Society Annual Meeting, Phoenix, AZ, USA, 6–10 January 2019. [Google Scholar]
- National Research Council. From Research to Operations in Weather Satellites and Numerical Weather Prediction: Crossing the Valley of Death; National Research Council: Washington, DC, USA, 2000; ISBN 978-0-309-06941-0. [Google Scholar]
- Rodgers, C.D. Inverse Methods for Atmospheric Sounding: Theory and Practice; Series on Atmospheric, Oceanic and Planetary Physics; World Scientific: Singapore, 2000; Volume 2, ISBN 978-981-02-2740-1. [Google Scholar]
- Smith, W.L. An improved method for calculating tropospheric temperature and moisture from satellite radiometer measurements. Mon. Weather Rev. 1968, 96, 387–396. [Google Scholar] [CrossRef]
- Chahine, M.T. Remote Sounding of Cloudy Atmospheres. I. The Single Cloud Layer. J. Atmos. Sci. 1974, 31, 233–243. [Google Scholar] [CrossRef]
- Chahine, M.T. Remote Sounding of Cloudy Atmospheres. II. Multiple Cloud Formations. J. Atmos. Sci. 1977, 34, 744–757. [Google Scholar] [CrossRef]
- Nalli, N.R.; Gambacorta, A.; Liu, Q.; Barnet, C.D.; Tan, C.; Iturbide-Sanchez, F.; Reale, T.; Sun, B.; Wilson, M.; Borg, L.; et al. Validation of Atmospheric Profile Retrievals From the SNPP NOAA-Unique Combined Atmospheric Processing System. Part 1: Temperature and Moisture. IEEE Trans. Geosci. Remote Sens. 2018, 56, 180–190. [Google Scholar] [CrossRef]
- Sun, B.; Reale, A.; Tilley, F.H.; Pettey, M.E.; Nalli, N.R.; Barnet, C.D. Assessment of NUCAPS S-NPP CrIS/ATMS Sounding Products Using Reference and Conventional Radiosonde Observations. IEEE J. Sel. Top. Appl. Earth Obs. Remote Sens. 2017, 10, 2499–2509. [Google Scholar] [CrossRef]
- HWT Blog. NUCAPS Accuracy. The Satellite Proving Ground at the Hazardous Weather Testbed 2015. Available online: https://goesrhwt.blogspot.com/2015/05/nucaps-accuracy.html (accessed on 9 December 2019).
- Maddy, E.S.; Barnet, C.D. Vertical Resolution Estimates in Version 5 of AIRS Operational Retrievals. IEEE Trans. Geosci. Remote Sens. 2008, 46, 2375–2384. [Google Scholar] [CrossRef]
- HWT Blog. Hwt Daily Summary: Week 2, Day 1 (May 11, 2015). The Satellite Proving Ground at the Hazardous Weather Testbed 2015. Available online: https://goesrhwt.blogspot.com/2015/05/daily-summary-week-2-day-1.html (accessed on 9 December 2019).
- Iturbide-Sanchez, F.; da Silva, S.R.S.; Liu, Q.; Pryor, K.L.; Pettey, M.E.; Nalli, N.R. Toward the Operational Weather Forecasting Application of Atmospheric Stability Products Derived from NUCAPS CrIS/ATMS Soundings. IEEE Trans. Geosci. Remote Sens. 2018, 56, 4522–4545. [Google Scholar] [CrossRef]
- De Pondeca, M.S.F.V.; Manikin, G.S.; DiMego, G.; Benjamin, S.G.; Parrish, D.F.; Purser, R.J.; Wu, W.-S.; Horel, J.D.; Myrick, D.T.; Lin, Y.; et al. The Real-Time Mesoscale Analysis at NOAA’s National Centers for Environmental Prediction: Current Status and Development. Weather Forecast. 2011, 26, 593–612. [Google Scholar] [CrossRef]
- NASA SPoRT Training Gridded NUCAPS: Analysis of Pre-Convective Environment 2019. Available online: https://nasasporttraining.wordpress.com/2019/11/21/gridded-nucaps-analysis-of-pre-convective-environment/ (accessed on 6 December 2019).
- HWT Blog. NUCAPS Soundings and Imagery. The Satellite Proving Ground at the Hazardous Weather Testbed 2018. Available online: https://goesrhwt.blogspot.com/2018/05/nucaps-soundings-and-imagery.html (accessed on 6 December 2019).
- Kalmus, P.; Kahn, B.H.; Freeman, S.W.; van den Heever, S.C. Trajectory-Enhanced AIRS Observations of Environmental Factors Driving Severe Convective Storms. Mon. Weather Rev. 2019, 147, 1633–1653. [Google Scholar] [CrossRef]
- Stein, A.F.; Draxler, R.R.; Rolph, G.D.; Stunder, B.J.B.; Cohen, M.D.; Ngan, F. NOAA’s HYSPLIT Atmospheric Transport and Dispersion Modeling System. Bull. Am. Meteorol. Soc. 2015, 96, 2059–2077. [Google Scholar] [CrossRef]
- Unidata | Local Data Manager (LDM). Available online: https://www.unidata.ucar.edu/software/ldm/ (accessed on 6 February 2020).
- Zhou, D.K.; Liu, X.; Larar, A.M.; Tian, J.; Smith, W.L.; Kizer, S.H.; Wu, W.; Liu, Q.; Goldberg, M.D. First Suomi NPP Cal/Val Campaign: Intercomparison of Satellite and Aircraft Sounding Retrievals. IEEE J. Sel. Top. Appl. Earth Obs. Remote Sens. 2016, 9, 4037–4046. [Google Scholar] [CrossRef]
- HWT Blog. NEW NUCAPS. The Satellite Proving Ground at the Hazardous Weather Testbed 2019. Available online: http://goesrhwt.blogspot.com/2019/05/new-nucaps.html (accessed on 6 December 2019).
- HWT Blog. Precipitable Water Comparisons. The Satellite Proving Ground at the Hazardous Weather Testbed 2019. Available online: https://goesrhwt.blogspot.com/2019/05/precipitable-water-comparisons.html (accessed on 6 December 2019).
- HWT Blog. The Satellite Proving Ground at the Hazardous Weather Testbed: Springfield Illinois Storms. The Satellite Proving Ground at the Hazardous Weather Testbed. 2019. Available online: https://goesrhwt.blogspot.com/2019/06/springfield-illinois-storms.html (accessed on 6 December 2019).
- HWT Blog. NUCAPS Sounding Plan View Examined. The Satellite Proving Ground at the Hazardous Weather Testbed 2017. Available online: https://goesrhwt.blogspot.com/2017/07/nucaps-sounding-plan-view-examined.html (accessed on 6 December 2019).
- Recommendations from the Data Quality Working Group | Earthdata. Available online: https://earthdata.nasa.gov/esdis/eso/standards-and-references/recommendations-from-the-data-quality-working-group (accessed on 9 December 2019).
- Bloch, C.; Knuteson, R.O.; Gambacorta, A.; Nalli, N.R.; Gartzke, J.; Zhou, L. Near-Real-Time Surface-Based CAPE from Merged Hyperspectral IR Satellite Sounder and Surface Meteorological Station Data. J. Appl. Meteor. Clim. 2019, 58, 1613–1632. [Google Scholar] [CrossRef]
- Cintineo, J.L.; Pavolonis, M.J.; Sieglaff, J.M.; Lindsey, D.T. An Empirical Model for Assessing the Severe Weather Potential of Developing Convection. Weather Forecast. 2014, 29, 639–653. [Google Scholar] [CrossRef]
- Cintineo, J.L.; Pavolonis, M.J.; Sieglaff, J.M.; Lindsey, D.T.; Cronce, L.; Gerth, J.; Rodenkirch, B.; Brunner, J.; Gravelle, C. The NOAA/CIMSS ProbSevere Model: Incorporation of Total Lightning and Validation. Weather Forecast. 2018, 33, 331–345. [Google Scholar] [CrossRef]


© 2020 by the authors. Licensee MDPI, Basel, Switzerland. This article is an open access article distributed under the terms and conditions of the Creative Commons Attribution (CC BY) license (http://creativecommons.org/licenses/by/4.0/).