Abstract
Quality assessment of Cortex Periplocae remains a challenge, due to its complex chemical profile. This study aims to investigate the chemical components of Cortex Periplocae, including its non-volatile and volatile constituents, via liquid chromatograph–mass spectrometry (LC-MS/MS) and gas chromatography–mass spectrometry (GC-MS) assays. The established strategy manifested that Cortex Periplocae from different producing areas was determined by identifying 27 chemical markers with ultra-high-performance liquid chromatography, coupled with quadrupole tandem time-of-flight mass spectrometry (UPLC-Q-TOF-MS/MS), including four main groups of cardiac glycosides, organic acids, aldehydes, and oligosaccharides. These groups’ variable importance in the projection (VIP) were greater than 1. Simultaneously, the samples were divided into four categories, combined with multivariate statistical analysis. In addition, in order to further understand the difference in the content of samples from different producing areas, nine chemical markers of Cortex Periplocae from 14 different producing areas were determined by high performance liquid chromatography coupled with mass spectrometry (HPLC-MS/MS), and results indicated that the main effective constituents of Cortex Periplocae varied with places of origin. Furthermore, in GC-MS analysis, samples were divided into three groups with multivariate statistical analysis; in addition, 22 differential components whose VIP were greater than 1 were identified, which were principally volatile oils and fatty acids. Finally, the relative contents of seven main volatile constituents were obtained, which varied extremely with the producing areas. The results showed that the LC-MS/MS and GC-MS assays, combined with multivariate statistical analysis for Cortex Periplocae, provided a comprehensive and effective means for its quality evaluation.
1. Introduction
Cortex Periplocae, the dried root bark of Periploca sepium Bunge, is a perennial liana plant from the Asclepiadaceae family, and it was first recorded in the Sheng Nong’s herbal classic. Cortex Periplocae has the effect of diminishing water, swelling, and rheumatism, as well as supporting strong bones, as recorded in the Chinese pharmacopoeia, and it has been widely used for edema, rheumatism, tumor, immunoregulation, and palpitations [1,2,3]. It contains numerous chemical components, such as steroids, cardiac glycosides, terpenoids, and volatile constituents [4,5,6], which confer multiple pharmacological activities. Periplocin, the main bioactive cardiac glycoside in the Cortex Periplocae, confers cardiac function effectively, but it can produce gastrointestinal reactions, heart poisoning, liver and kidney toxicity, and even death when one takes it inappropriately [7]. The quality assessment of Cortex Periplocae is necessary for medical safety.
A growing number of studies have demonstrated that geographical sources could significantly affect the quality of these herbs, since climate and environment influence biosynthesis and the accumulation of secondary metabolites in organisms [8,9,10]. Cortex Periplocae is widespread in Shanxi, Henan, Hebei, and Shandong provinces in China [11,12], and there are no standard planting grounds for it [13]. However, whether or how the quality of Cortex Periplocae differs according to its harvested location have not yet been investigated. Such a correlation, if present, would be significant for both a quality assessment and efficient utilization of Cortex Periplocae; it could also impact artificial cultivation of Cortex Periplocae. Although Cortex Periplocae materials from different regions have been chemically analyzed in some studies [14,15], that research aimed to test the feasibility of newly developed analytical assays for Cortex Periplocae, and investigations about the correlation between geographical origins and quality were rare. In addition, there was only a single study about the determination of 4-methoxysalicylaldehyde with the HPLC method in Chinese pharmacopoeia in 2015 [1]; past research on quality standards for Cortex Periplocae have been mostly about the analysis of periplocin, isovanillin, and 4-methoxysalicylaldehyde. Other compounds have not yet been studied [16,17,18,19,20,21]. As known to all, multi-components in an herb indicate its comprehensive efficacy, and quality assessment based on a few markers has been proven to be insufficient. Therefore, a more systematic and comprehensive method for multicomponent analysis was needed, due to Cortex Periplocae’s chemical complexity.
In our study, ultra-high-performance liquid chromatography coupled with quadrupole tandem time-of-flight mass spectrometry (UPLC–Q-TOF-MS/MS) and (HPLC-MS/MS) methods were used for the qualitative analysis and content determination of Cortex Periplocae, respectively, as well as gas chromatography–mass spectrometry (GC-MS) for determining volatile constituents, which proved a sensitive and effective method for its quality evaluation. Furthermore, multiple pattern recognition models, including hierarchical cluster analysis (HCA), principal component analysis (PCA), and partial-least-squares discriminate analysis (PLS-DA), were carried out to evaluate the differences in quality of the Cortex Periplocae samples. The chemical markers were obtained by the PLS-DA model, which confirmed the reliability of the results. Finally, in order to better understand the differences between geographical sources and quality in terms of content, marker compounds were determined by quantitative analysis. The proposed strategy of LC-MS/MS and GC–MS combined with multivariate statistical analysis can be used to evaluate the quality of Cortex Periplocae comprehensively and effectively.
2. Results
2.1. UPLC-Q-TOF-MS/MS Analysis
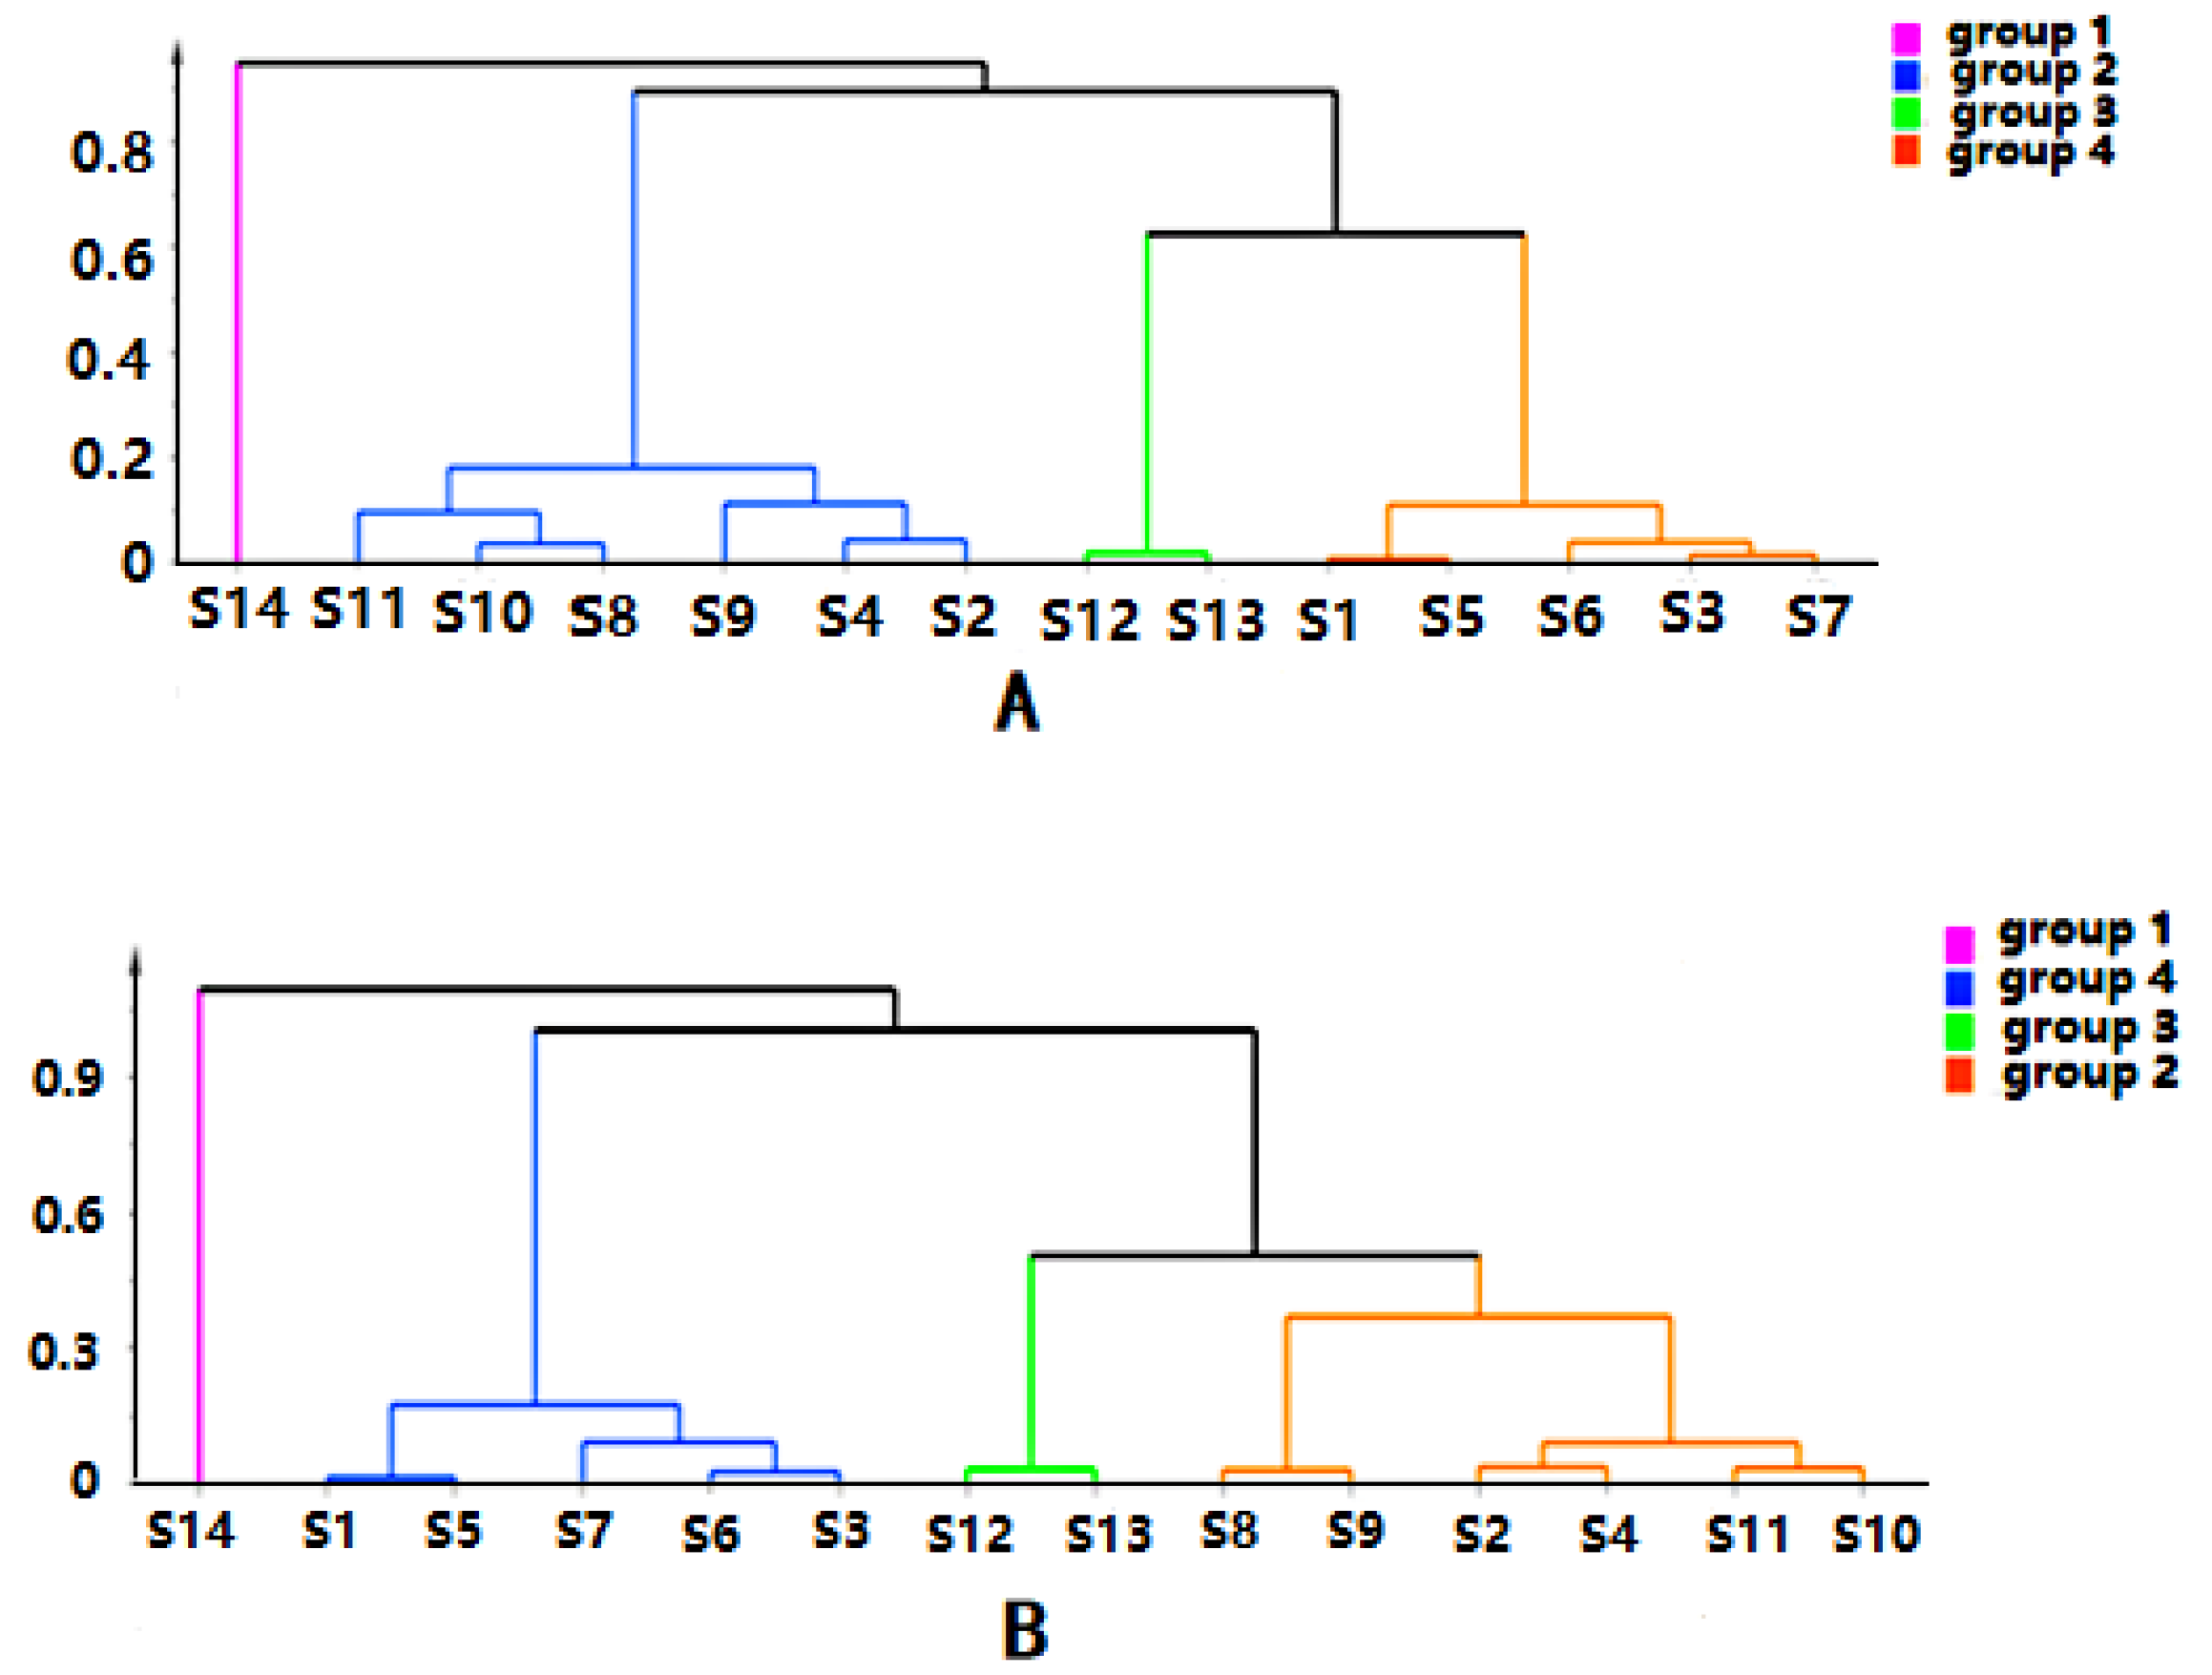
Chromatographic data from 14 batches, collected from UPLC-Q-TOF-MS/MS, were imported into R software and Simca-P 14.1 for multivariate statistical analysis. HCA is mainly used for groups of samples that have not yet been clearly classified [22]. The samples can be categorized intuitively based on the characteristics of their variables. It is an unsupervised pattern recognition method [23]. The HCA diagrams of Cortex Periplocae from 14 areas are shown in Figure 1, which indicates that the samples were divided into four categories: S14 (JiXian, Tianjin) was the first category; S2 (FanZhi, Shanxi), S4 (NingWu, Shanxi), S8 (FeiCheng, Shandong), S9 (TaiAn, Shandong), S10 (NanYang, Henan), and S11 (JiaoZuo, Henan) belonged to the second category; S12 (YuXian, Hebei) and S13 (XuanHua, Hebei) belonged to the third category; and the fourth category included S1 (LuCheng, Shanxi), S3 (YuanPing, Shanxi), S5 (YuCi, Shanxi), S6 (LingQiu, Shanxi) and S7 (YangQuan, Shanxi). The model, to some extent, demonstrated a significant relationship between the chemical composition and the source of the samples.
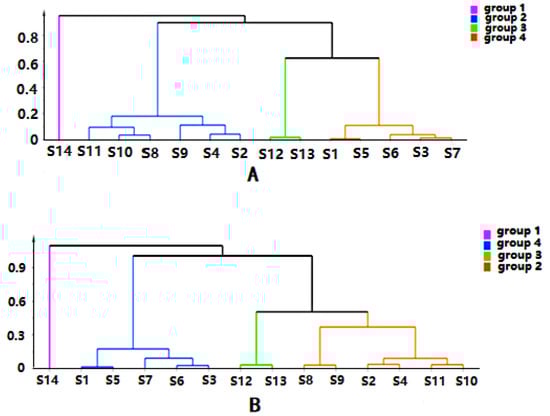
Figure 1.
Hierarchical cluster analysis (HCA) of Cortex Periplocae from different producing areas, under the mode of positive (A) and negative (B) ions.
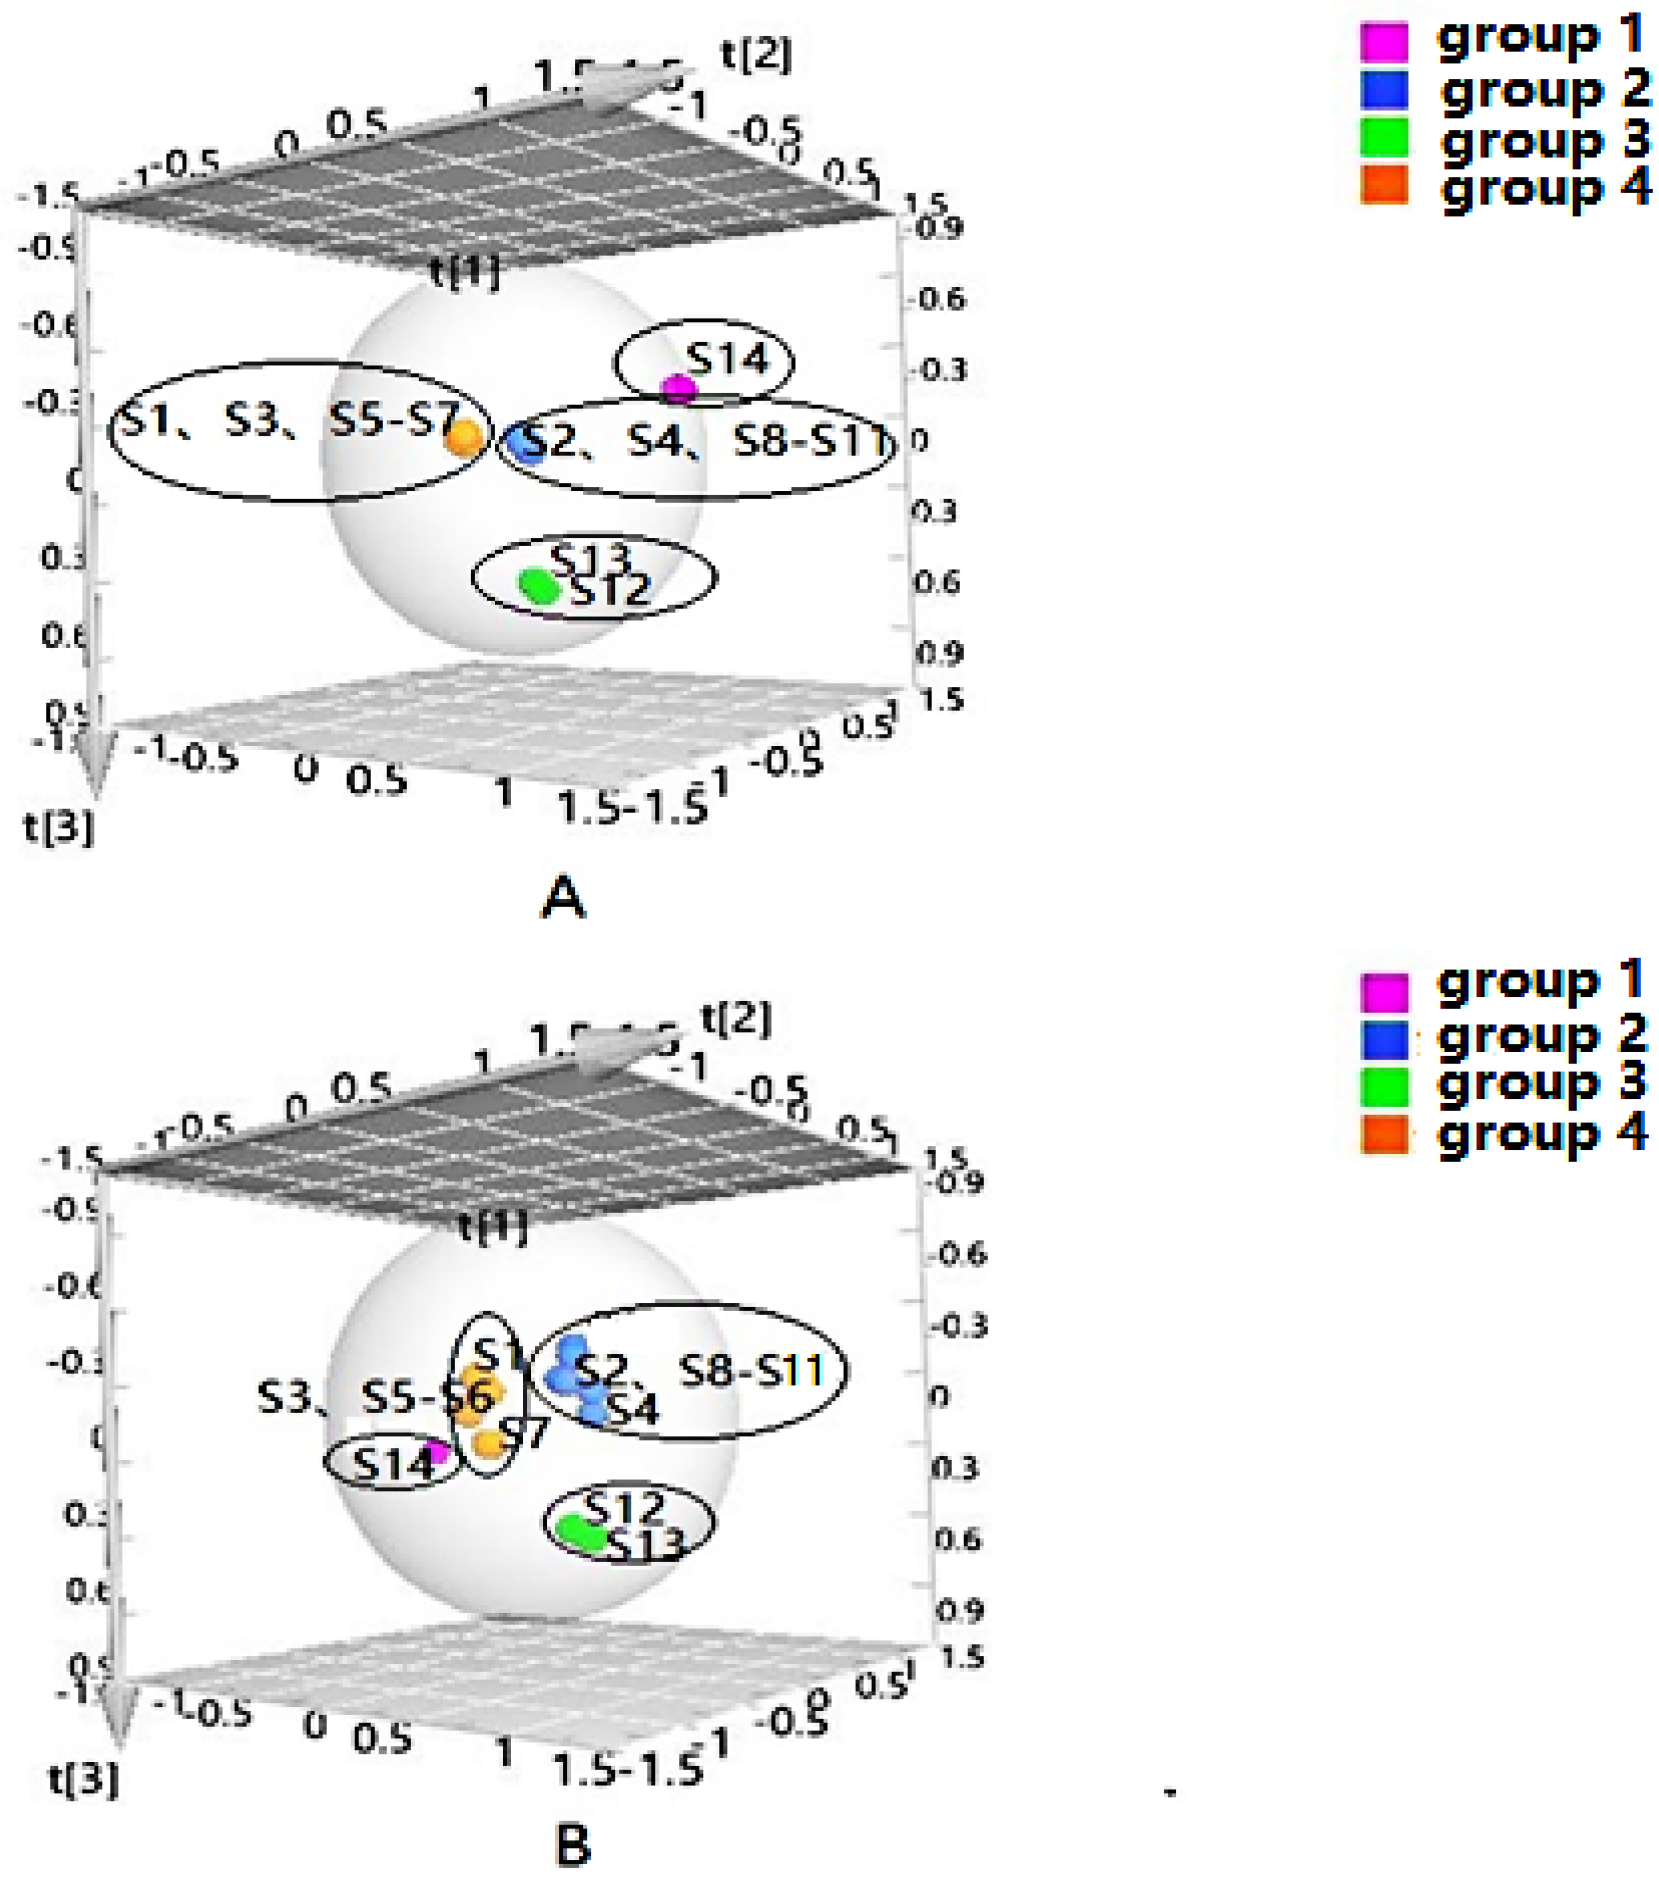
PLS-DA can filter out some random noise, distinguish differences between groups better, and improve the effectiveness and analytical capability of the model. Firstly, PLS-DA analysis was performed on the samples according to the clustering results, as shown in Figure 2. The results displayed that four groups of samples from different habitats were effectively distinguished, and the clustering effect was slightly better than that of HCA. In addition, to screen the chemical markers that contributed more to the differentiation, based on the above HCA and PLS-DA models, the differential components in four groups were analyzed to obtain the variable importance in projection (VIP) values, and compounds with VIP > 1 were used as potential differential components for subsequent qualitative analysis.
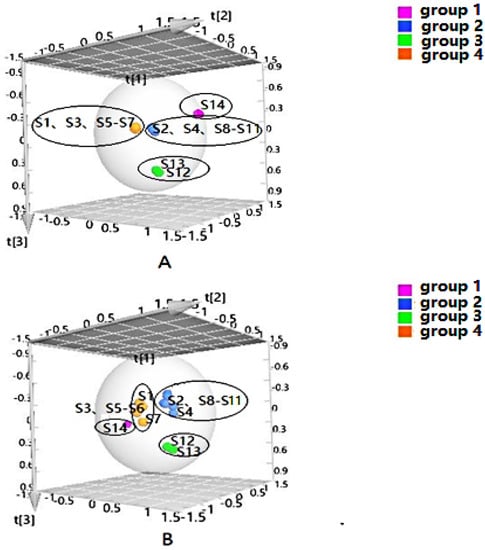
Figure 2.
Partial-least-squares discriminate analysis (PLS-DA) of Cortex Periplocae from different producing areas, under the mode of positive (A) and negative (B) ions.
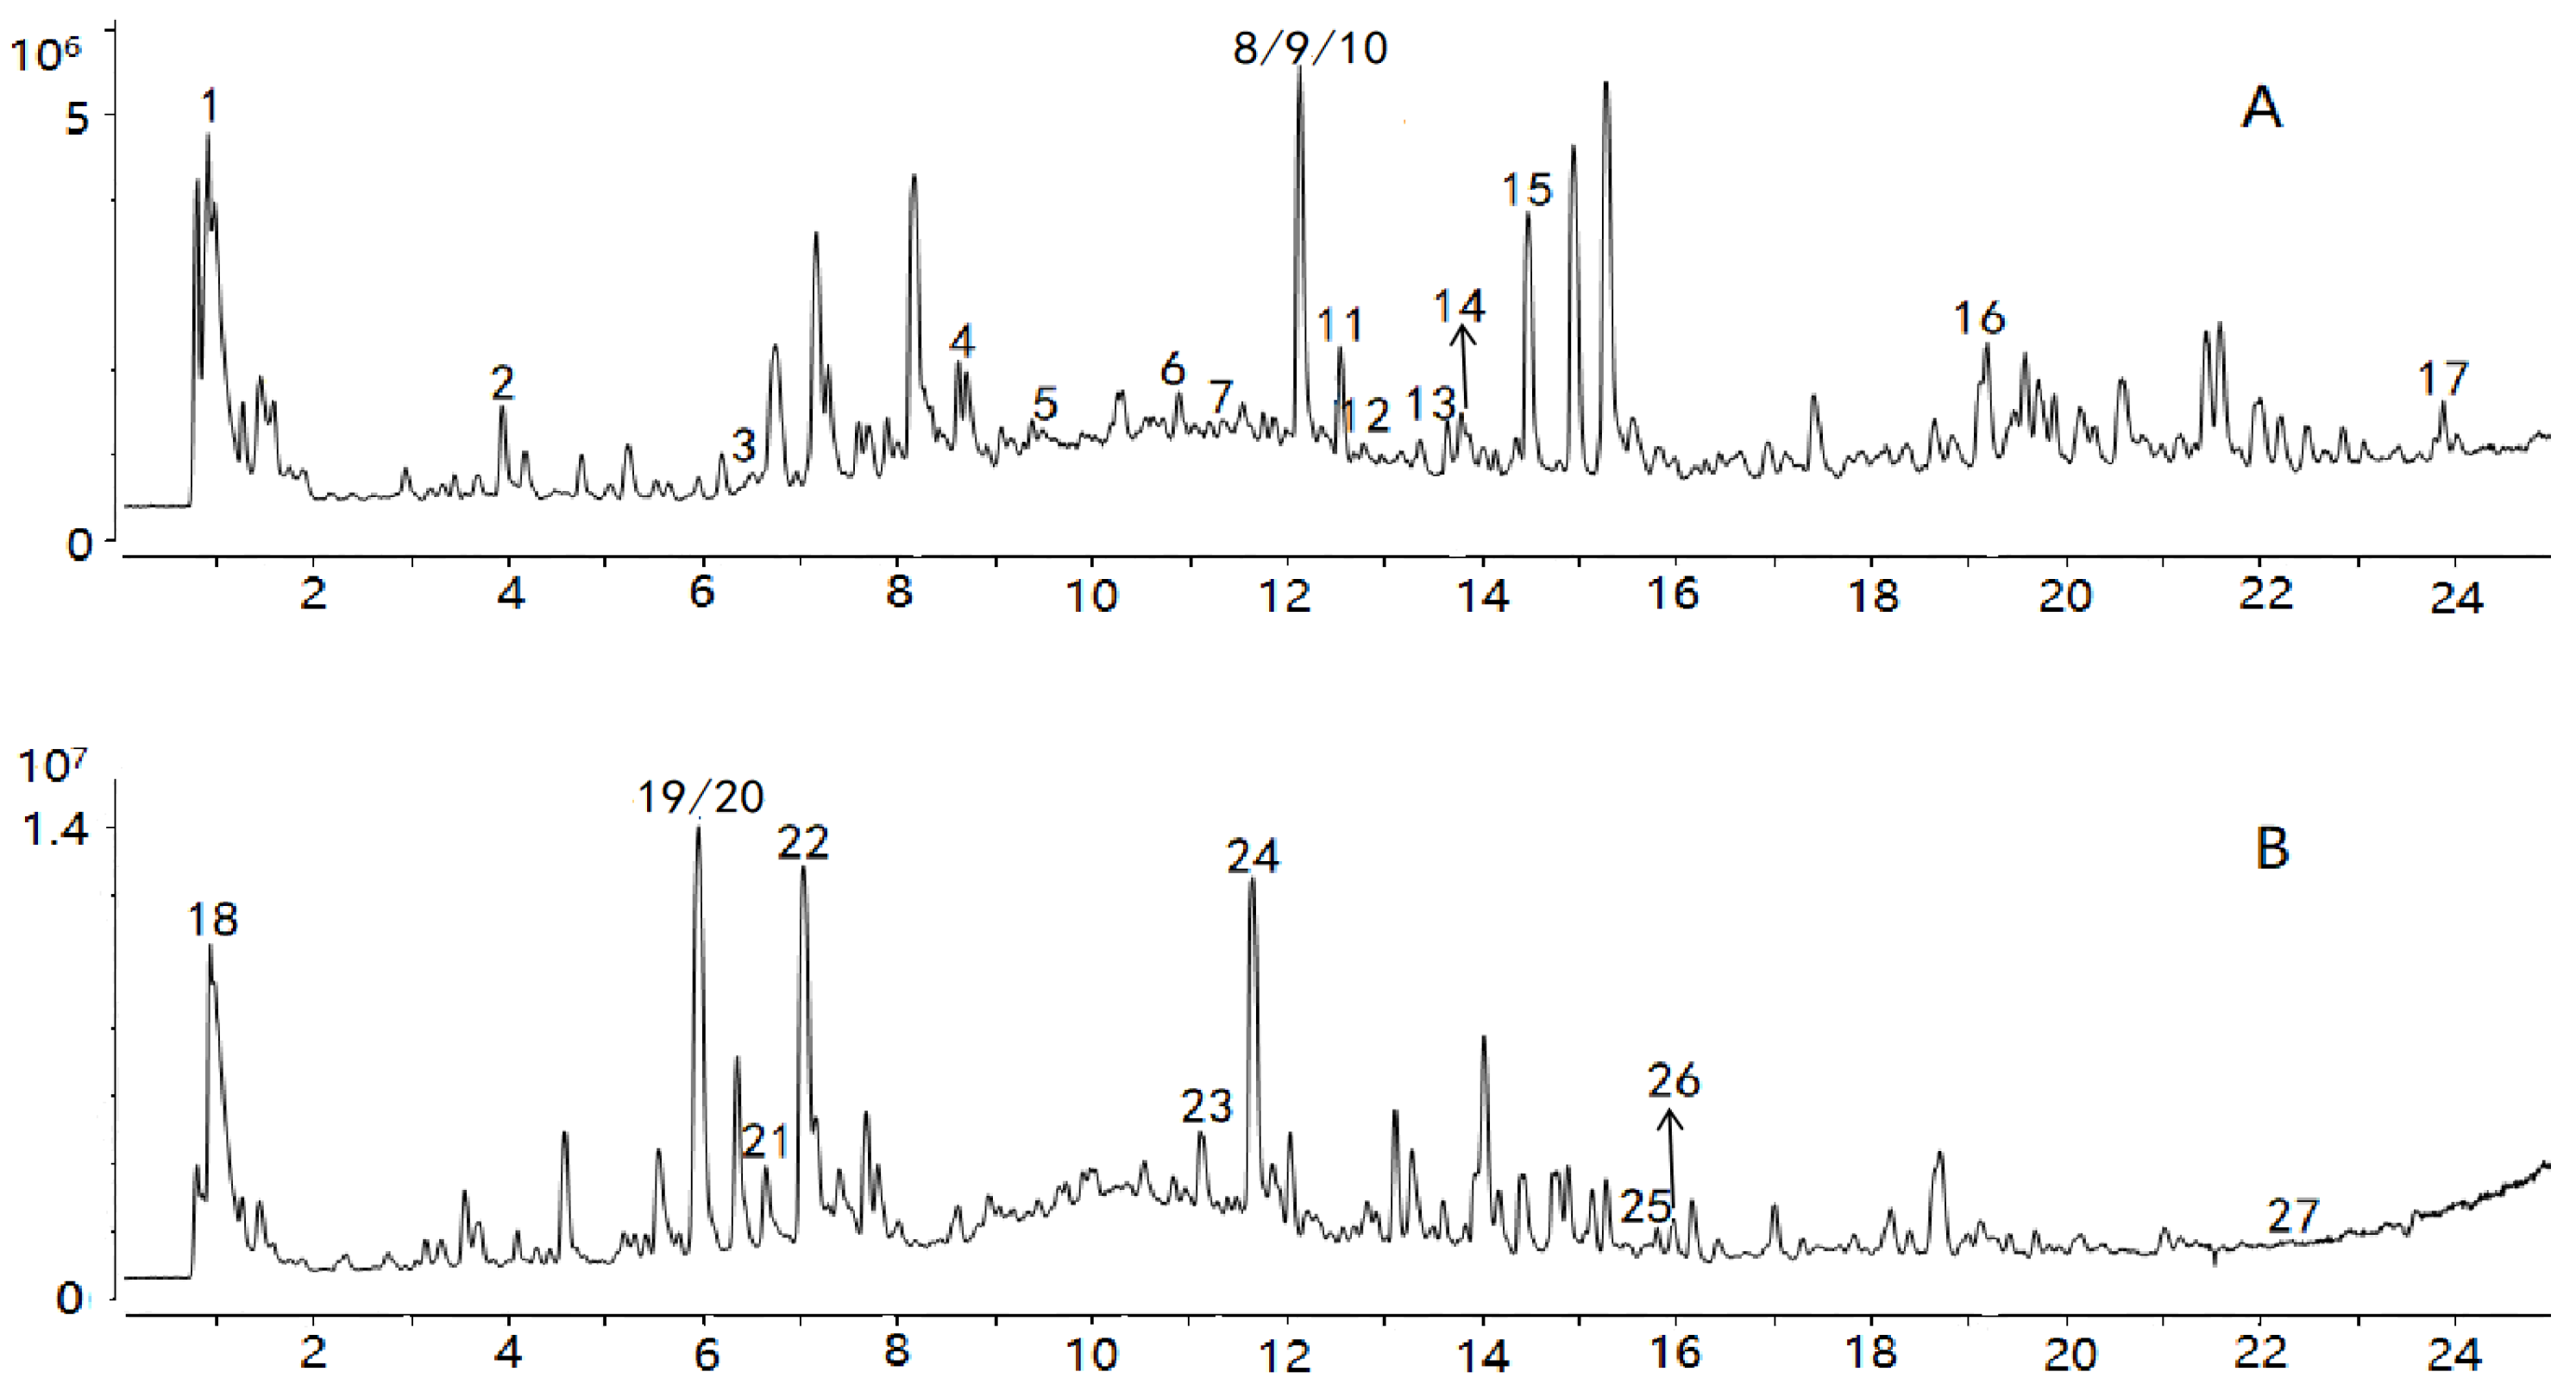
Comparisons with reference standards and data in previous reports [24,25,26,27,28,29,30,31,32,33,34,35] enabled tentative identification of 27 constituents whose VIPs were greater than 1, as summarized in Table 1. The spectra of the chemical markers are exhibited in the Supplementary Materials. The 27 constituents are classified into four main groups, including cardiac glycosides, organic acids, aldehydes, and oligosaccharides; they played an important role in differentiation, and were identified as potential chemical markers for quality evaluation of Cortex Periplocae. Chlorogenic acid, with VIP = 7.72, differentiated the samples to the biggest extent. Total ion chromatograms (TIC) in positive and negative ions are generated in Figure 3.

Table 1.
Chemical markers identified, based on UPLC-Q-TOF-MS/MS.
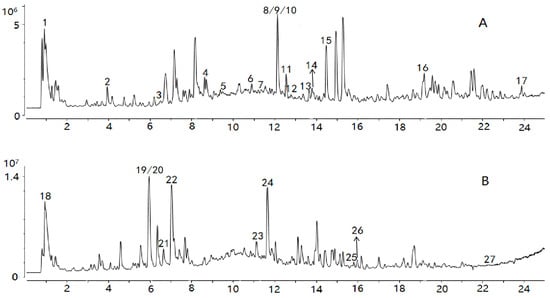
Figure 3.
TIC of the sample in positive (A) and negative ions (B).
2.2. HPLC-MS/MS Analysis
2.2.1. Method Validation
Quantitative method validation for the established HPLC-MS/MS analysis was performed for linearity, lower limits of detection (LLODs), lower limits of quantification (LLOQs), intra- and inter-day precision, repeatability, stability, and recovery. The results are shown in Table 2 and Table 3. All correlation coefficient values (r ≥ 0.9990) demonstrated a good linear relationship between the analyte concentrations and their peak areas within the relatively wide test ranges. The LLOD and LLOQ were determined at a signal-to-noise (S/N) ratio of approximately 3 and 10, respectively, and the results showed that the LLODs and LLOQs of the analytes were in the range of 0.1–5.0 ng/mL and 0.3–10.0 ng/mL, respectively. The intra- and inter-day precisions of nine analytes (Rlative Sandard Deviation—RSDs) were within 0.4%–2.7% and 0.3%–5.3%, respectively. The RSDs for repeatability were less than 4.2%. As for stability, the RSDs were lower than 4.9%. The developed method also had acceptable accuracy, with spike recovery of 89.4%–105.9% for all analytes. The results revealed that the established method was precise enough for simultaneous quantitative determination of the nine components.
Table 2.
Standard curve regression equation, lower limit of detection (LLOD), and lower limit of quantification (LLOQ) of nine components.
Table 3.
Precision, repeatability, stability, and recovery of nine analytes.
2.2.2. Determination of Nine Components
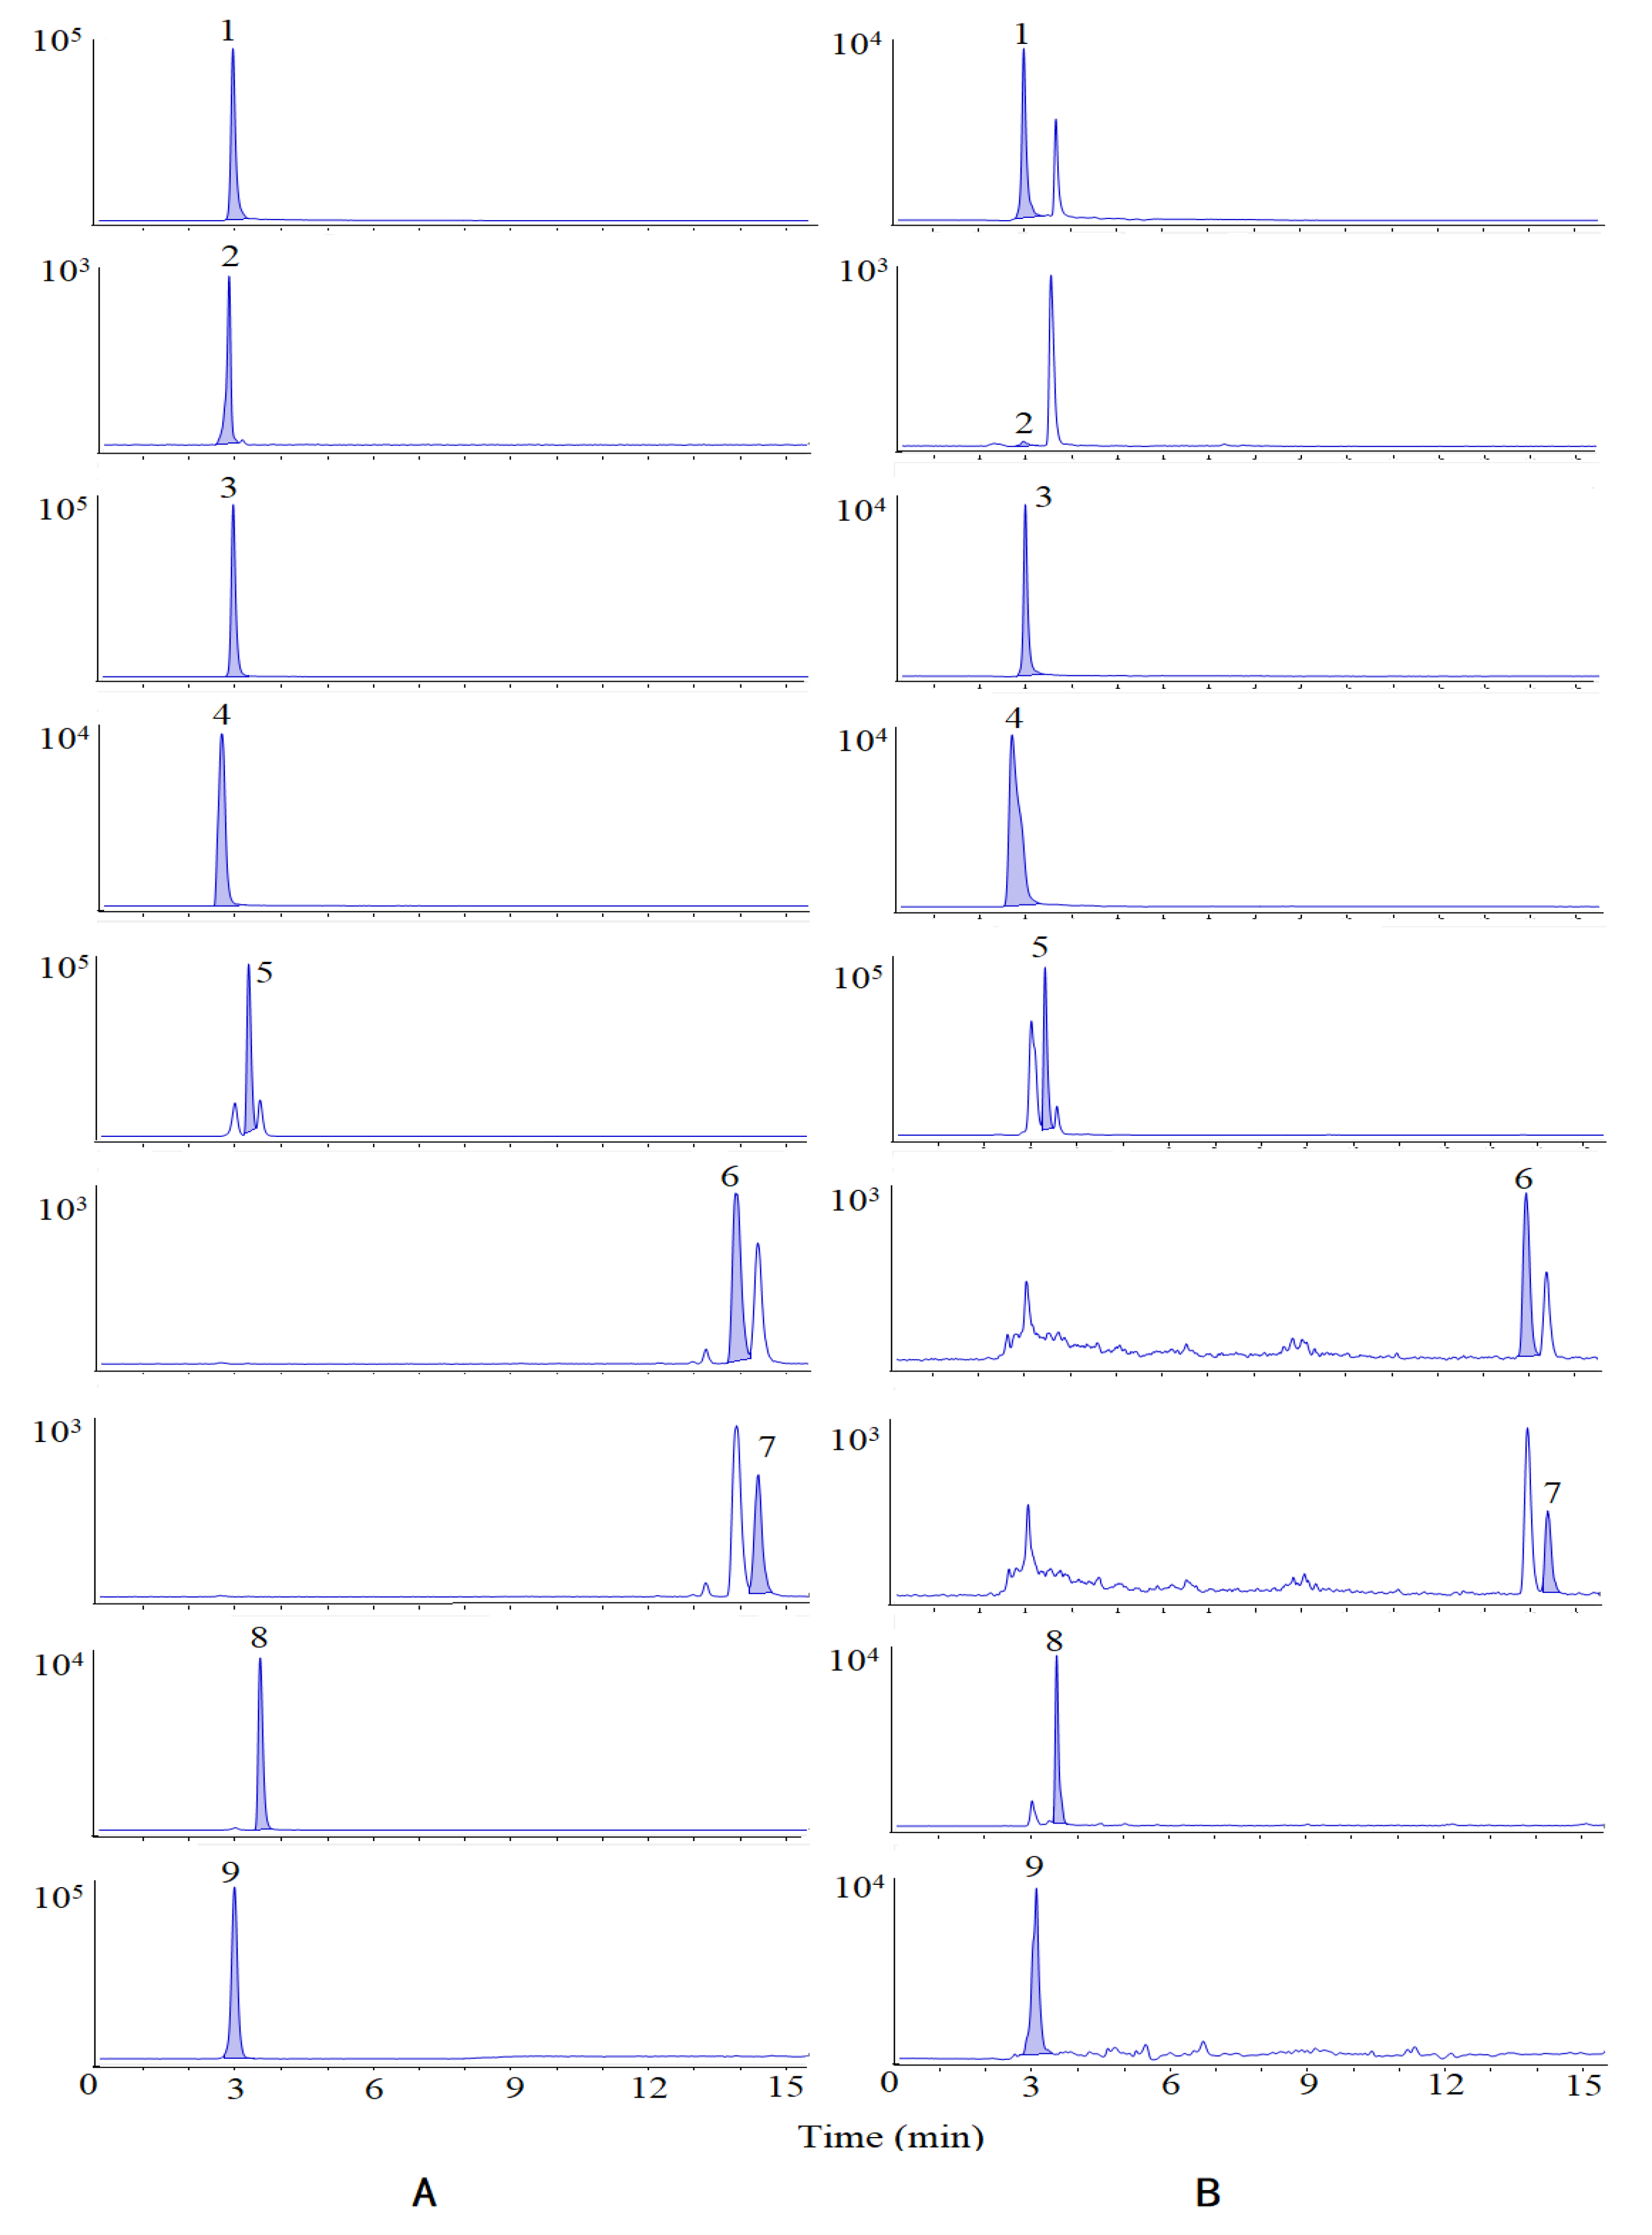
Based on the UPLC-Q-TOF-MS/MS analysis, 27 compounds whose VIP were greater than 1 were identified as the chemical markers. In order to further understand the variations of the samples from different content levels, nine bioactive chemical markers were determined by HPLC-MS/MS. The Multiple Reaction Monitoring (MRM) diagram is shown in Figure 4.
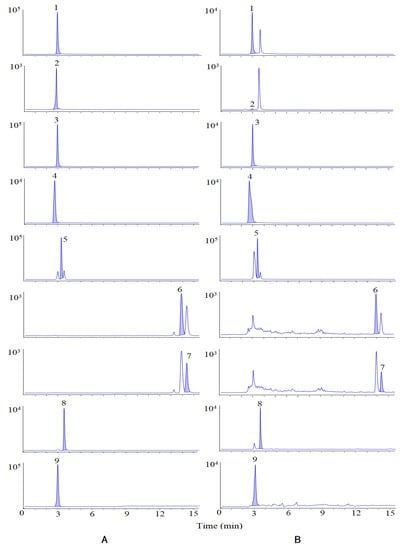
Figure 4.
MRM of standards (A) and samples (B). Peaks are as follows: (1) isovanillin, (2) isovanillic acid, (3) scopoletin, (4) chlorogenic acid, (5) periplogenin, (6) oleanolic acid, (7) ursolic acid, (8) periplocymarin, and (9) periplocin.
The concentrations of nine compounds were recorded and the contents were calculated. The results (Table 4) reveal that the contents of the nine constituents varied with their origins. These quantitative results of nine bioactive chemical markers provide a valuable reference for differentiating samples collected from different geographical regions.
Table 4.
The contents of nine components in Cortex Periplocae from different areas (μg·g−1).
2.3. Qualitative Analysis Based on GC-MS
2.3.1. Optimization of GC-MS Conditions
The DB-5 and DB-17 columns were both used for chromatographic separation. Results of the DB-17 column showed better peak shape and had much greater peaks, as compared to the DB-5 column. In addition, the shunt ratio was mainly used for macroanalysis or analysis of non-dilutable samples. In this experiment, shunt ratios of 10, 20, 30, and 50 were selected for analysis, and it was observed that shunt ratio of 30 provided better peak shapes compared to the rest.
2.3.2. Sample Analysis
At present, there are few studies on the volatile components of Cortex Periplocae, and reports on the quantitative analysis of such active ingredients are rare. Therefore, the GC-MS method was established for further understanding of the diversities of the samples from different origins.
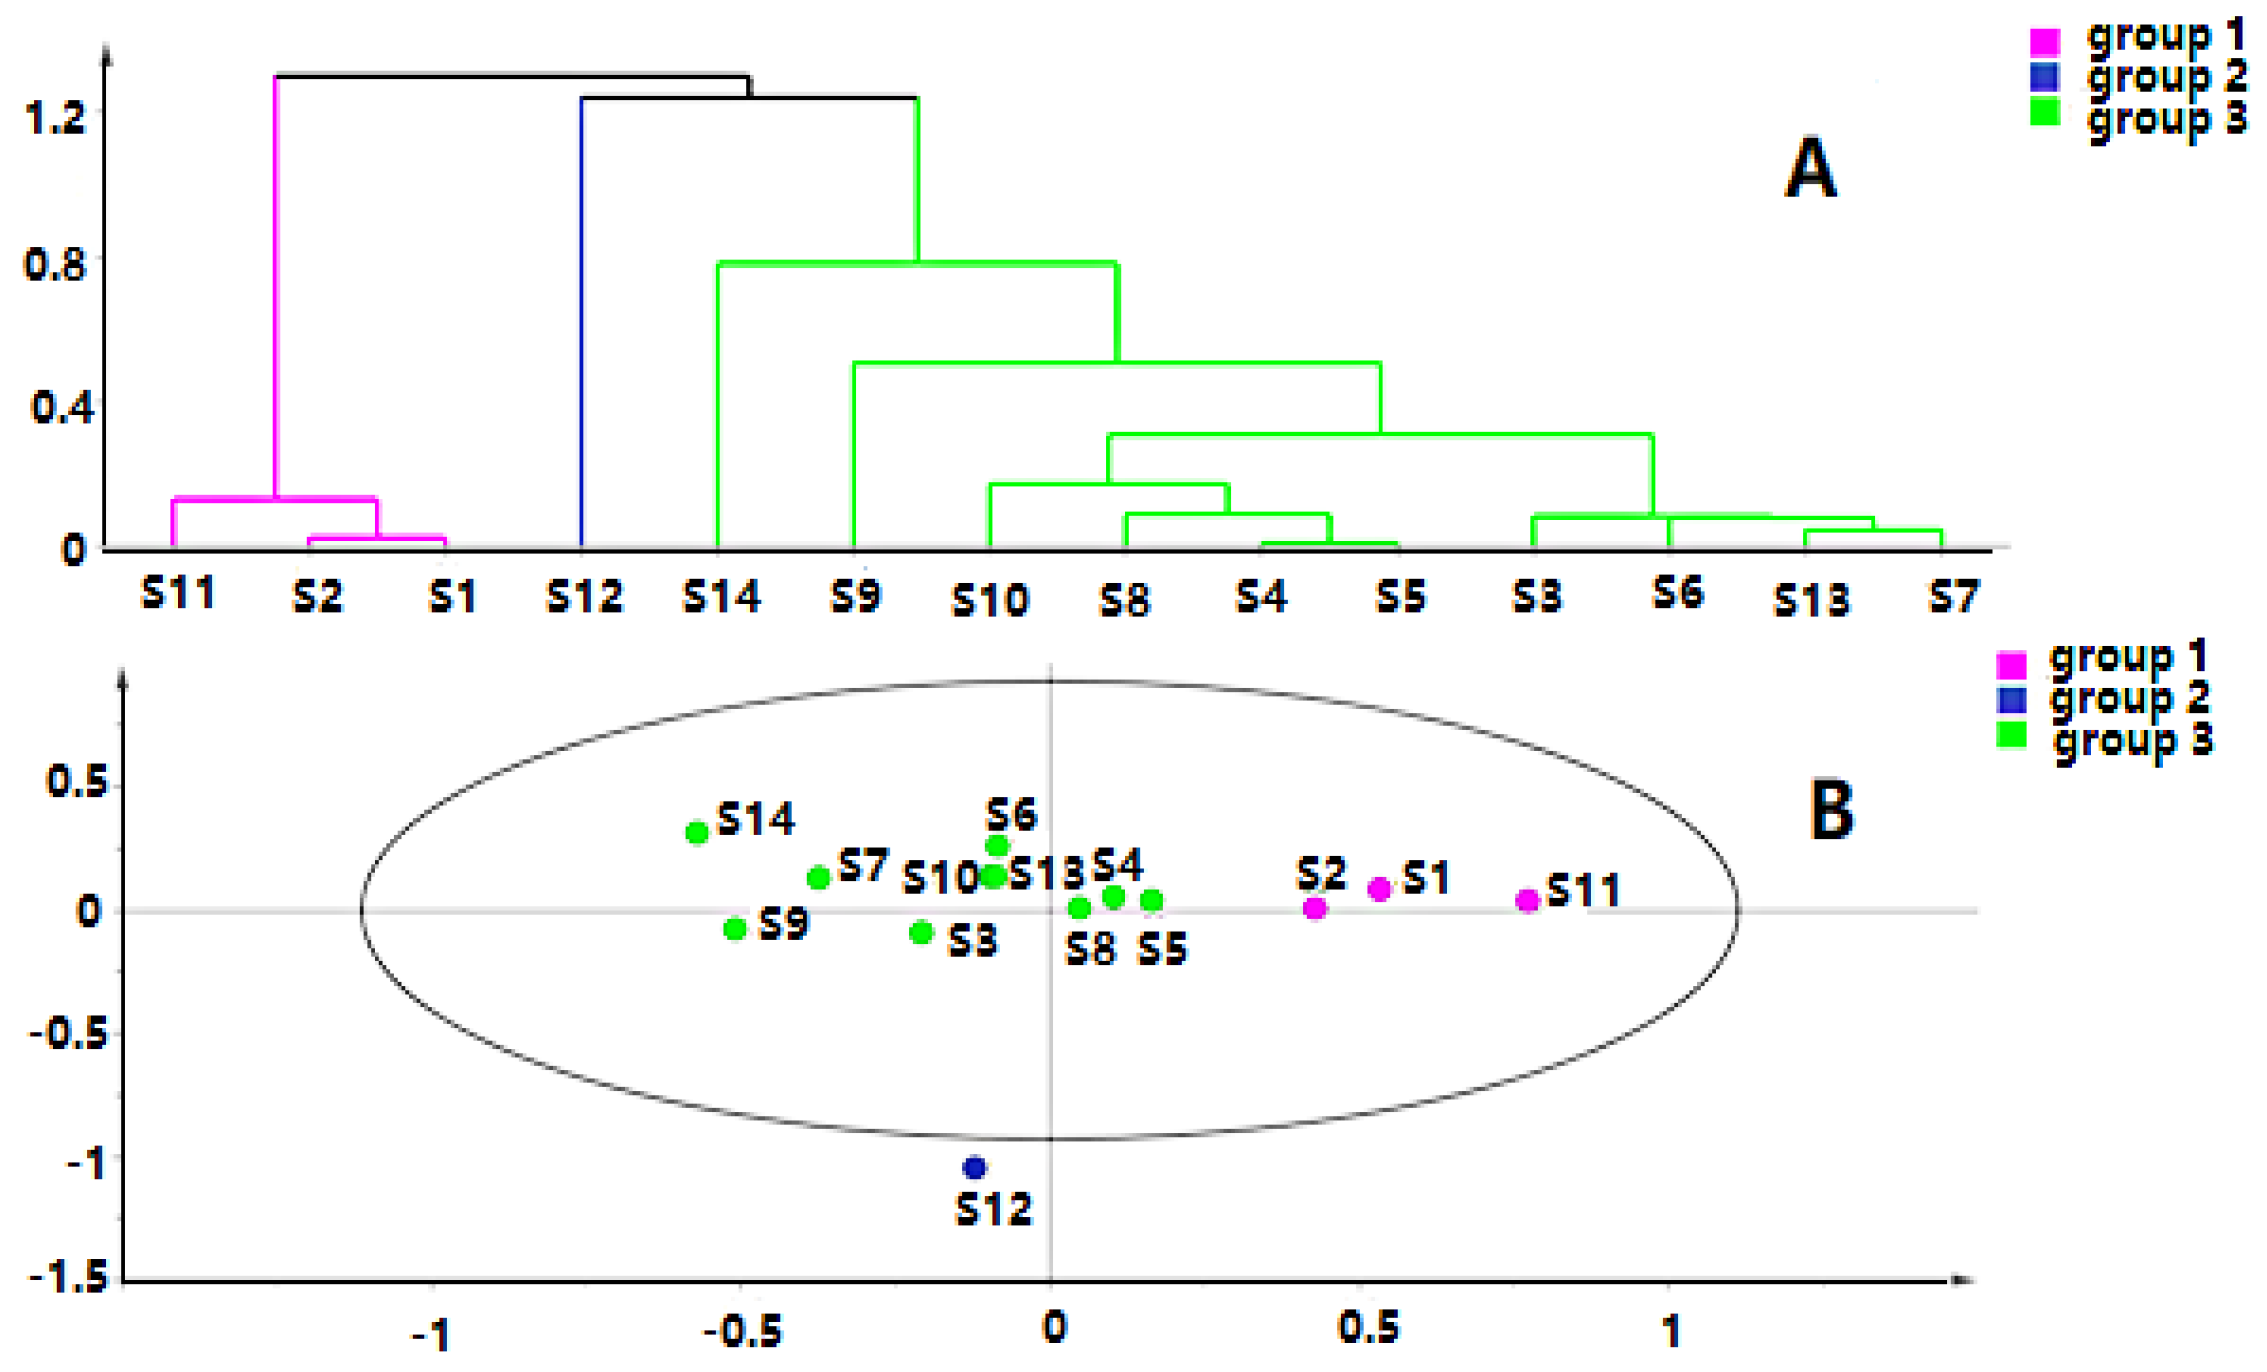
The quality data collected from GC-MS were converted into the MZ DATA format, and were then imported into R software and Simca-P 14.1 for multivariate statistical analysis. The HCA and PCA diagrams of Cortex Periplocae from 14 areas are shown in Figure 5. It shows that the samples were divided into three categories: S1 (LuCheng), S2 (FanZhi), and S11 (JiaoZuo) are in the first category; S12 (YuXian) belongs to the second category; and S3–S10 (YuanPing, NingWu, YuCi, LingQiu, YangQuan, FeiCheng, TaiAn, NanYang, respectively), as well as S13 (XuanHua) and S14 (JiXian) belong to the third cateogry. The results of the two models verified each other. Furthermore, PLS-DA was also performed for better improvement of model effectiveness, as shown in Figure 6. The samples were also divided into three groups, like the HCA and PCA model. The results proved that the volatile constituents varied greatly with herbal origins. In addition, based on the above models, the differential volatile components in the three groups were analyzed to obtain the table of VIP values, and compounds with VIP > 1 were used as potential volatile chemical markers for subsequent qualitative analysis. The TIC diagrams of the Cortex Periplocae sample was exhibited in Figure 7.
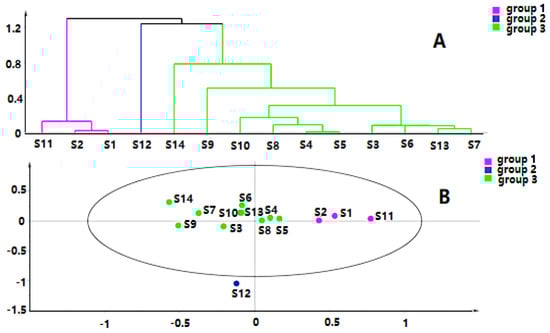
Figure 5.
HCA (A) and principal component analysis (PCA) (B) of Cortex Periplocae from different producing areas.
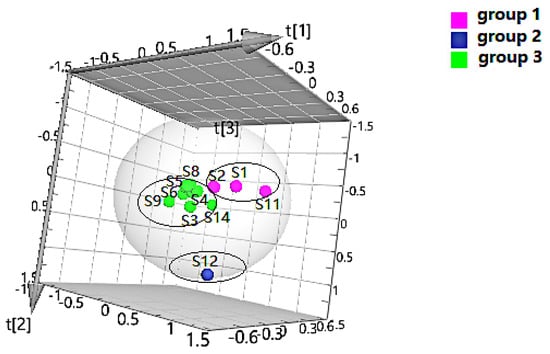
Figure 6.
PLS-DA of Cortex Periplocae from different producing areas.
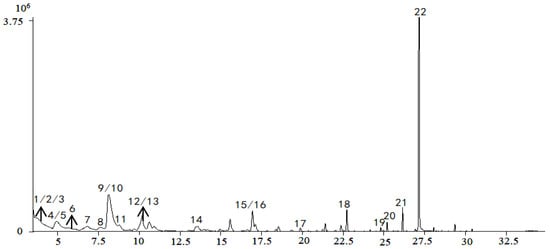
Figure 7.
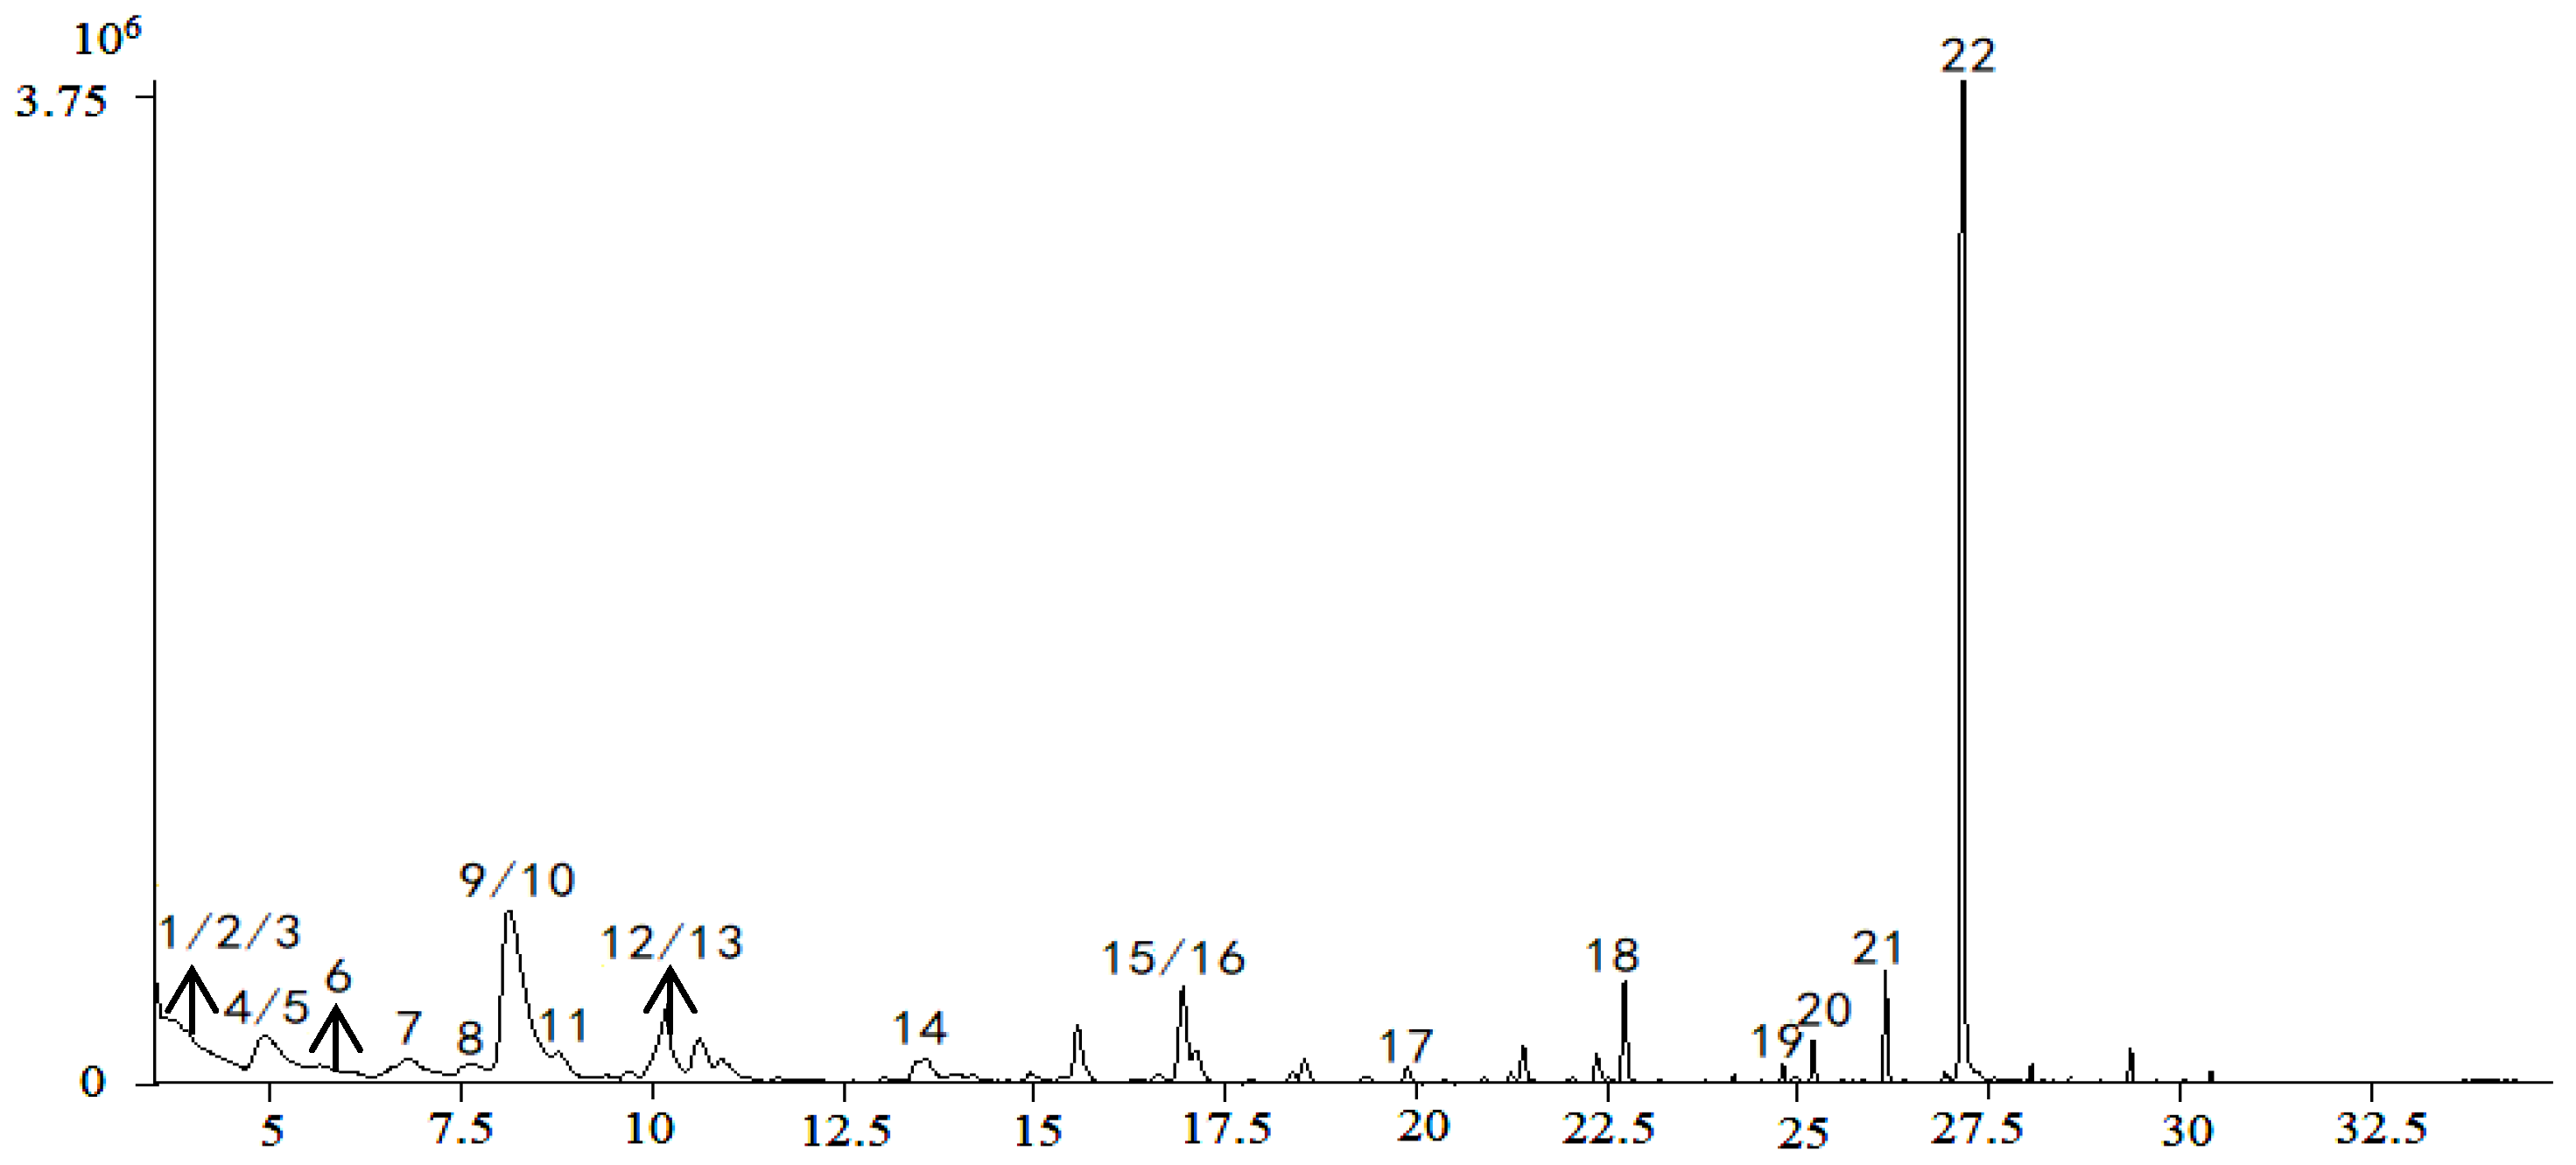
TIC of the sample, based on gas chromatography–mass spectrometry (GC-MS).
Twenty-two total volatile compounds with VIP > 1 were tentatively identified from different origins, based on the accurate relative molecular mass and the National Institute of Standards and Technology (NIST) 08 mass spectral library. The 22 volatile constituents, as listed in Table 5, were principally volatile oils and fatty acids, and they were identified as potential volatile chemical markers for the quality assessment of Cortex Periplocae.
Table 5.
Chemical markers identified, based on GC-MS.
2.4. Relative Content Analysis Based on GC-MS
The volatile oil, one of the active components of Cortex Periplocae, confers insecticidal activity effectively [36]. Among the 22 volatile chemical markers, seven constituents presented a higher concentration compared to the others, which were determined so as to further understand the differences in volatile components at the content level. A quantitative analysis in percent was determined by peak area normalization. The results were calculated by GC-MS Postrun Analysis software, and summarized in Table 6. The results revealed that the content of volatile constituents did vary greatly with the geographical locations.
Table 6.
The relative content of volatile components in Cortex Periplocae from different habitats (%).
3. Materials and Methods
3.1. Sample Collection
Fourteen batches of Cortex Periplocae excavated in the spring were collected from five different provinces (Shanxi, Shandong, Hebei, Henan, and Tianjin) of China. They were identified as the dried bark of Cortex Periplocae by Professor Li Tianxiang and stored in Tianjin University of Traditional Chinese Medicine; the sample information is shown in Table 7.
Table 7.
Sample information of Cortex Periplocae.
3.2. UPLC-Q-TOF-MS/MS Analysis
3.2.1. Chemicals and Apparatus
Periplocin (≥98%), periplocymarin (≥98%), periplogenin (≥98%), and scopoletin (≥98%) were purchased from Chengdu Durst Biotechnology Co., Ltd. (Chengdu, China). Isovanillin (≥98%), isovanillic acid (≥98%), chlorogenic acid (≥98%), ursolic acid (≥98%), and oleanolic acid (≥98%) were obtained from Shanghai Yuanye biotechnology Co., Ltd. (Shanghai, China). Chromatographic grade methanol and acetonitrile were purchased from Fisher company (Thermo Fisher Scientific (China) Co. Ltd., Shanghai, China). Anhydrous ethanol (chromatographically pure) was obtained from Concord technologies Ltd. (Tianjin, China). Water was obtained from a Milli-Q purification system (Millipore, Bedford, MA, USA). Nylon membranes were purchased from Tianjin Bojin Technology Co., Ltd. (Tianjin, China).
The UPLC-Q-TOF-MS/MS system is comprised of an Agilent 1290 Infinity UPLC (Agilent Technologies Inc., Palo Alto, CA, USA) and an Agilent 6520 QTOF. The UPLC system includes an Agilent 4220 binary pump combined with a degasser, an Agilent 4212 diode array detector, an Agilent 4226 well plate sampler, and an Agilent 1316 thermostatic column compartment. Chromatographic separation was performed on a Waters UPLC®BEH C18 column (2.1 × 100 mm, 1.7 µm, Waters, Milford, MA, USA).
3.2.2. Sample Preparation and Measurement
All the samples were dried for 4 h at 60 °C, grounded, and passed through a 50-mesh sieve. Samples of 0.5 g were immersed in 5 mL of 60% methanol and then ultrasonicated for 30 min. The solution was centrifuged for 10 min at 14000 r∙min−1, and the resulting supernatant was filtered with 0.22 µm nylon membranes for analysis. Primary stock solutions of nine reference compounds were a mixture of different concentration of standards in methanol.
The mobile phase consisted of 0.1% formic acid (solvent A) and acetonitrile (solvent B), with a gradient elution program of 3%–10% B at 0–5 min, 10%–30% B at 5–10 min, 30%–60% B at 10–16 min, and 60%–99% B at 16–25 min, in a positive ion pattern; and 3%–18% B at 0–7 min, 18%–62% B at 7–16 min, and 62%–99% B at 16–25 min in a negative ion pattern. The flow rate was 0.3 mL/min and the injection volume was 1 µL. The optimized conditions were as follows: dry gas temperature at 350 °C, dry gas flow rate at 9 L/min, nebulizer pressure at 30 psi, skimmer at 65 V, capillary voltage at 3500 V, sheath gas temperature at 300 °C, collision energy at 35 V, and fragmentor voltage at 175 V. Mass spectra were recorded across the range of m/z 50–1500.
3.2.3. Data Pre-Processing
Firstly, the collected data were converted into MZ Data format by Agilent Masshunter analysis software, and then peak extraction, peak alignment, and peak matching were carried out by R software to obtain the retention time (Rt), mass-to-charge ratio (m/z), and peak strength of each compound. Then the missing values were removed, according to the 80% modified principle. Finally, the obtained data were imported into Simca-P 14.1 for multivariate statistical analysis to screen for VIP > 1 compounds as potential chemical markers.
3.3. HPLC-MS/MS Analysis
3.3.1. Chemicals and Apparatus
Chromatographic analysis was performed on an Agilent 1200 HPLC system (Agilent Technologies Inc., Palo Alto, CA, USA) equipped with an Agilent 6430 Triple quadrupole tandem mass spectrometer. A CORTECS C18 column (4.6 × 150 mm, 2.7 µm; Waters, Milford, MA, USA) was used for the chromatographic separation, and the temperature of 15 °C was maintained. The chemicals were the same as those used for the UPLC-Q-TOF-MS/MS analysis.
3.3.2. Sample Preparation and Measurement
The mobile phase consisted of 0.1% formic acid (solvent A) and methanol (solvent B), and the gradient elution for HPLC-MS/MS analysis was performed as follows: 82%–82% B at 0.0–3.6 min, 82.0%–92.5% B at 3.6–3.7 min, and 92.5%–92.5% B at 3.7–15.5 min. The flow rate was 0.5 mL/min, and the injection volume was 5 µL. The mass spectrometry was acquired in positive ion and negative ion modes. The instrumental parameters were as follows: gas temperature at 300 °C, gas flow rate at 11 L/min, nebulizer pressure at 15 psi, and delta Electron multiplier voltage (EMV) (±) at 500 V. Mass spectral parameters and ion patterns are shown in Table 8. The sample preparation was the same as described in Section 3.2.2.
Table 8.
Mass spectrometry parameters of nine target compounds.
3.4. GC-MS Analysis
3.4.1. Apparatus
The volatile components were analyzed by a Shimadzu QP 2010 GC-MS, equipped with a DANI Hss 86.50 headspace sampler and AOC-20i Autosampler. Chromatographic separation was performed on a DB-17 column (0.25 mm × 30 m × 0.25 µm).
3.4.2. Sample Preparation and Measurement
All the samples were dried for 4 h, ground, passed through a 50-mesh sieve, and sealed in a headspace bottle for analysis.
The temperature conditions used were as follows: 50 °C for 0 min, 50–110 °C at 3 °C/min, 110–200 °C at 8 °C/min, and held constant for 6 min. Ionization was performed in the electron impact mode at 70 eV. The ion source temperature and the interface temperature were 230 °C and 250 °C, respectively. Electron Impact (EI) spectra were recorded in full scan mode at m/z 33–500.
3.4.3. Data Pre-Processing
The collected qualitative data were converted into MZ Data format by GC-MS Postrun Analysis software first, then R software and Simca-P 14.1 software were used for further analysis in the processing of UPLC-Q-TOF-MS/MS data.
4. Conclusions
In this experiment, UPLC-Q-TOF-MS/MS and HS-GC-MS methods combined with multivariate statistical analysis technology were applied to screen differential chemical compositions of Cortex Periplocae from different origins. According to the multivariate statistical analysis for both volatile and nonvolatile components, the samples were clearly classified, suggesting that these categories should be addressed in the preparation of products. Based on PLS-DA model, 49 chemical markers with VIP > 1 were identified, which was of great significance to distinguish the samples from different origins. Furthermore, HPLC-MS/MS was used for quantitative analysis of nine effective chemical components of Cortex Periplocae from 14 places of origin. The relative contents of seven volatile chemical markers with higher concentrations were determined by GC-MS. The results indicated that the content of active ingredients varied greatly from place to place. In conclusion, the established strategy based on LC-MS/MS and GC-MS, combined with multivariate statistical analysis, was carried out to in order to clarify the relationship between the quality and geographical origin of Cortex Periplocae, and it would be an efficient and applicable tool for the quality assessment of Cortex Periplocae.
Supplementary Materials
The supplementary materials are available online.
Author Contributions
J.H. and T.L. designed the research; M.G. and X.J. wrote the manuscript and performed the experimental work; W.W. and G.Y. analyzed the data; X.H., H.O., and Y.C. perfected the language. All authors discussed, edited, and approved the final version.
Funding
This study was supported by National Natural Science Foundation of China (81673824).
Conflicts of Interest
The authors declare no conflict of interest.
References
- State Pharmacopoeia Commission. Pharmacopoeia of People’s Republic of China; China Medical Science and Technology Press: Beijing, China, 2015; p. 257. [Google Scholar]
- Li, L.; Zhao, L.M.; Dai, S.L.; Cui, W.X.; Lv, H.L.; Chen, L.; Shan, B.E. Periplocin Extracted from Cortex Periplocae Induced Apoptosis of Gastric Cancer Cells via the ERK1/2-EGR1 Pathway. Cell Physiol Biochem. 2016, 38, 1939–1951. [Google Scholar] [CrossRef] [PubMed]
- Li, J.X.; Jiang, Y.H.; Shan, B.E. The immunoregulatory activity of Cortex Periplocae extract on the mice lymphocyts. Carcinogenesis Teratogenesis Mutagenesis 2010, 22, 292–294. [Google Scholar]
- Itokawa, H.; Xu, J.; Takeya, K. Studies on chemical constituents of antitumor fraction from Periploca sepium BGE. I. Chem. Pharm. Bull. 1987, 35, 4524–4529. [Google Scholar] [CrossRef] [PubMed]
- Itokawa, H.; Junping, X.U.; Takeya, K. Studies on Chemical Constituents of Antitumor Fraction from Periploca sepium. V. Structures of New Pregnane Glycosides, Periplocosides J, K, F and O. Chem. Pharm. Bull. 1988, 36, 4441–4446. [Google Scholar] [CrossRef] [PubMed]
- Sakuma, S.; Kawanishi, S.; Shoji, J.; Shibata, S. Constituents of Chinese crude drug "Wujiapi". I. Studies on the aglycones of steroidal glycosides of pei-wujiapi. Chem. Pharm. Bull. 1968, 16, 326. [Google Scholar] [CrossRef] [PubMed]
- Lin, J.; Denmeade, S.; Carducci, M.A. HIF-1alpha and calcium signaling as targets for treatment of prostate cancer by cardiac glycosides. Curr. Cancer Drug Targets. 2009, 9, 881–887. [Google Scholar] [CrossRef]
- Zhu, L.X.; Xu, J.; Wang, R.J.; Li, H.X.; Tan, Y.Z.; Chen, H.B.; Dong, X.P.; Zhao, Z.Z. Correlation between Quality and Geographical Origins of Poria cocos Revealed by Qualitative Fingerprint Profiling and Quantitative Determination of Triterpenoid Acids. Molecules. 2018, 23, 2200. [Google Scholar] [CrossRef]
- Ianni, F.; Lisanti, A.; Marinozzi, M.; Camaioni, E.; Pucciarini, L.; Massoli, A.; Sardella, R.; Concezzi, L.; Natalini, B. Hydrophobic Amino Acid Content in Onions as Potential Fingerprints of Geographical Origin: The Case of Rossa da Inverno sel. Rojo Duro. Molecules 2018, 23, 1259. [Google Scholar] [CrossRef]
- Koch, W.; Kukula, K.W.; Komsta, Ł. Black Tea Samples Origin Discrimination Using Analytical Investigations of Secondary Metabolites, Antiradical Scavenging Activity and Chemometric Approach. Molecules. 2018, 23, 513. [Google Scholar] [CrossRef]
- Jiangsu New Medical College. Dictionary of Medicinal Plant; Shanghai Scientific and Technical: Shanghai, China, 1986; p. 1683. [Google Scholar]
- Wang, Q.; Xu, G.J. Atlas of Genuine Herbs: Three Northern Volumes; Fujian Science and Technology Press: Fuzhou, China, 2003; p. 122. [Google Scholar]
- LI, L.; E, X.H.; HE, Y.; Li, P.; Zhou, S.P. Quality assessment of Cortex Periplocae from different habitats by UPLC fingerprint and quantitative analysis. China J. Chin. Mater. Med. 2015, 40, 1529–1534. [Google Scholar]
- Li, D.Y.; Wang, T.T.; Chen, X.H.; Bi, K.S. Establishment of RP-HPLC fingerprint for quality assessment of Cortex Periplocae. J. Chin. Med. Mater. 2006, 29, 715–717. [Google Scholar]
- LI, R.X.; WU, F.; Zhang, J.Q.; Zhao, P.; Feng, Y. Quality assessment of Cortex Periplocae by HPLC fingerprint and UV quantitative analysis. China Med. Her. 2017, 14, 33–36. [Google Scholar] [CrossRef] [PubMed]
- Wang, L.; Yin, Z.Q.; Zhang, L.H.; Ye, W.C.; Zhang, X.Q. Chemical constituents from root barks of Periploca sepium. China J. Chin. Mater. Med. 2007, 32, 1300. [Google Scholar]
- Liu, H.; Yang, H.; Sun, W.; Wang, M.; Guo, J.H.; Pan, G.X. Simultaneous determination of Periplocin and 4-methoxysalicylic aldehyde in Cortex Periplocae with HPLC. Tianjin J. Tradit. Chin. Med. 2006, 1, 64–66. [Google Scholar]
- Ren, X.L.; Liu, H.; Qi, A.D.; Wang, Y. Improving of simultaneous determination of periplocin and 4-methoxy salicylic aldehyde in Cortex Periplocae with HPLC method. Tianjin J. Tradit. Chin. Med. 2007, 24, 252. [Google Scholar]
- Tong, L.; Tan, X.J.; Lin, J.R.; Chen, X.H.; Bi, K.S. RP-HPLC determination of isovanillin, periplocin and 4-methoxy salicylaldehyde in root bark of Cortex Periplocae. Chin. J. Pharm. Anal. 2009, 29, 961. [Google Scholar]
- Guan, Y.L.; Cai, L.M.; Yang, R.Y. Study on the content change of the chlorogenic acid in water extract of Cortex Periplocae at the different times. Nor Horticul. 2011, 154, 177–178. [Google Scholar]
- Xu, S.; Jin, P.F.; Xu, W.F.; Wu, X.J.; Jiang, W.Q.; Kuang, Y.M.; Ma, J. Advances on Chinese herbal medicine Cortex Periplocae. Northwest. Pharm. J. 2017, 32, 118–121. [Google Scholar]
- Cao, X.X.; You, G.J.; Li, H.H.; Li, D.; Wang, M.; Ren, X.L. Comparative Investigation for Rotten Xylem (kuqin) and Strip Types (tiaoqin) of Scutellaria baicalensis Georgi Based on Fingerprinting and Chemical Pattern Recognition. Molecules 2019, 24, 2431. [Google Scholar] [CrossRef]
- Gong, D.D.; Hong, Y.L.; Sun, G.X.; Zhang, J. Novel strategy for quality consistency evaluation of Chinese medicine “YIQING” tablet that combines the simultaneous quantification and screening of ten bioactive constituents. J. Sep. Sci. 2017, 40, 3064–3073. [Google Scholar] [CrossRef]
- Yu, H.H.; Giao, X.Y. Identification of chemical components in capillary wormwood herb by UPLC-Q-TOF/MS. Cent. South. Pharm. 2019, 17, 656–661. [Google Scholar]
- Ramon, D.; Oscar, J.P.; Juan, V.S.; Félix, H. Metabolomic approaches for orange origin discrimination by ultra-high performance liquid chromatography coupled to quadrupole time-of-flight mass spectrometry. Food Chem. 2014, 157, 84–93. [Google Scholar]
- Zsuzsanna, H.; Judit, H.; Peter, F.; Imre, M.; Judit, M.; István, Z. Antiproliferative Activity of Artemisia asiatica Extract and Its Constituents on HumanTumor Cell Lines. Planta Med. 2014, 80, 1692–1697. [Google Scholar]
- Wang, X.J.; Deng, Y.H.; Zhang, L.P.; Zheng, G.H.; Chen, L.L.; Fang, Y. Identification and determination of phenolic acids and flavonoids in Artemisiae Argyi Folium by UPLC-DAD-MS. China J. Chin. Mater. Med. 2019, 44, 983–989. [Google Scholar]
- Chen, Y.J.; Yu, Y.; Gao, Y.; Bi, X.Y.; Kuang, H.X. Separation and Structural Identification of Phenolic Acids from Hydrangea Macrophylla Leaves. Chin. J. Inf. Tradit. Chin. Med. 2017, 34, 10–13. [Google Scholar] [CrossRef]
- Cheng, X.Y. Qualitative Analysis and in ivo Metabolic Profiling of Farfarae Flos by UHPLC-Q-TOF-MS Technologies and Study on Characteristic Fingerprints of Flos Genkwa and Wikstroemia Chamaedaphne. Master’s Thesis, Hebei Medical University, Shijiazhuang, China, 2018. [Google Scholar]
- Sun, N.N.; Zhang, K.J.; Geng, W.L.; Er, X.H.; Gao, W.; He, Y.; Li, P. Analysis of chemical constituents of 33 Jiashen Tablet extract by UPLC-Q-TOF-MS. Chin. Tradit. Herb. Drugs 2018, 49, 293–304. [Google Scholar]
- Qin, W.H.; Hua, L.; Guo, Y.L.; Wang, Y.H.; Ran, J.C.; Yang, Y. Differentiation of Different Parts of Cordyceps sinensis Based on UPLC-Q-TOF-MS Combined with Metabolomics Methods. Chin. J. Exp. Tradit. Med. Formulae. 2018, 24, 69–76. [Google Scholar]
- Janet, A.; Patrick, N.; Eugenie, K. Assessment of nutritional and phytochemical quality of Dawadawa (an African fermented condiment) produced from Bambara groundnut (Vigna subterranea). Microchem. J. 2019, 149, 104034. [Google Scholar]
- Luo, J.; Zhao, L.J.; Bao, J.P.; Zhu, D.; Tan, J.H.; Yu, J.; Yin, S.W. Analysis of Chemical Compositions in Gentiana rhodantha by UPLC-Q-TOF-MS. Chin. J. Exp. Tradit. Med. Formulae. 2018, 24, 89–94. [Google Scholar]
- Chen, W.L. Based on Chromatography-Mass Spectrometry Technology Research Chemical Constituents of Cyclocarya Paliurus Leaf. Master’s Thesis, Nanchang University, Nanchang, China, 2017. [Google Scholar]
- Zou, Y.T.; Xu, J.D.; Long, F.; Zhang, Y.Q.; Li, S.L. Evaluation of chemical consistency of triterpene acids in ethanol extracts of Poria and acetic ether extracts thereof by UPLC-QTOF-MS/MS with full scan and mimic MRM mode. Acta Pharm Sin. 2019, 54, 130–137. [Google Scholar]
- Tong, L. Study on Chemical Components and Method of Quality Assessment of XiangJiaPi. Master’s Thesis, Shenyang Pharmaceutical University, Shenyang, China, 2007. [Google Scholar]
Sample Availability: The Cortex Periplocae samples are available from the authors. |

© 2019 by the authors. Licensee MDPI, Basel, Switzerland. This article is an open access article distributed under the terms and conditions of the Creative Commons Attribution (CC BY) license (http://creativecommons.org/licenses/by/4.0/).