Abstract
The demand for chemical-free beverages is posing a challenge to the wine industry to provide safe and healthy products with low concentrations of chemical preservatives. The development of new technologies, such as Atmospheric Pressure Cold Plasma (APCP), offers the wine industry the opportunity to contribute to this continuous improvement. The purpose of this research is to evaluate the effect of Argon APCP treatment, applied in both batch and flow systems, on Tempranillo red wine quality. Batch treatments of 100 mL were applied with two powers (60 and 90 W) at four periods (1, 3, 5, and 10 min). For flowing devices, 750 mL of wine with a flow of 1.2 and 2.4 L/min were treated at 60 and 90 W for 25 min and was sampled every 5 min. Treatments in batch resulted in wines with greater color intensity, lower tonality, and higher content in total phenolic compounds and anthocyanins, so that they were favorable for wine quality. Among the batch treatments, the one with the lowest power was the most favorable. Flow continuous treatments, despite being more appropriate to implement in wineries, neither led to significant improvements in the chromatic and phenolic wine properties nor caused wine spoilage.
1. Introduction
Current consumers are looking for natural, safe, and healthy beverages with low concentrations of chemical preservatives, thereby maintaining their healthy properties [1,2]. The cutting-edge technologies for food processing offers the wine industry the opportunity to contribute to this improvement. Thus, technology based on the application of Atmospheric Pressure Cold Plasma (APCP) is a very attractive innovation tool for the food industry.
Plasma is a state of matter, similar to gas, in which some particles are ionized. The APCP uses different gases such as air, nitrogen, argon, helium, etc., that are applied directly or indirectly (through a liquid medium) to process and disinfect materials. In the application of the APCP, a large number and diversity of highly energetic reactive species are generated. This activates physical and chemical processes difficult to achieve in ordinary chemical environments. In fact, plasma is a source of UV photons, charged particles (positive and negative ions), free radicals, atoms, and molecules excited or not, etc., with a high antimicrobial capacity [3].
To date, among the various physical and chemical food decontamination techniques evaluated, APCP has demonstrated a high efficiency in the reduction of microbial contaminants in different foods and beverages [4,5,6]. In contrast, there are few studies evaluating how APCP affects the quality of the treated foods and beverages, despite being determinant to the consumer election.
The color is one of the most important sensory attributes as it is normally the first feature perceived by the wine consumer, consequently having a great influence on the final wine quality perception [7]. Wine color does not only depend on the initial grape composition, but also on the different techniques applied in the cellar and the numerous biochemical reactions that occurred during the winemaking process [8,9,10]. Phenolic compounds are responsible for the organoleptic characteristics of wine, such as color and flavor. Moreover, some of these compounds have been related to antioxidant and free radical-scavenging properties [3,11] that may play a role in human health, including a highly probable protection against cardiovascular diseases and cancer [12,13,14].
Some results have shown a decrease in total phenolics and total flavonoids in grape juice and an increase in total flavonols after high voltage atmospheric cold plasma treatments [15]. Other authors have studied the stability of phenolic compounds in several fruit juices, and even in wines [16,17], concluding that plasma treatments have an impact that is mainly dependent on the equipment and processing parameters.
Moreover, most of the plasma experiments have been conducted in static conditions. This circumstance makes it even more difficult to implement in real wineries, so that APCP application in continuous flow might be a great advance for winemakers. The main goal of this study was to examine the influence of continuous flow APCP in chromatic characteristics and the phenolic compounds content of red wines, compared to batch APCP treatments.
2. Materials and Methods
2.1. Wine and APCP Treatments
This study was conducted with a young Tempranillo red wine from the ICVV experimental winery, sampled just after the spontaneous MLF of the harvest 2017, with 12% alcoholic strength and a pH of 3.65.
Six different treatments were carried out by a non-thermal atmospheric pressure plasma jet system (PlasmaSpot®, VITO, Boeretang, Belgium). This system consists of a plasma torch that operates at atmospheric pressure, with two cylindrical electrodes in coaxial arrangement that are separated by a dielectric barrier of Al2O3. A flow of Argon gas (40 slm) was supplied in all cases. Any excess gas in the system was evacuated through an exhaust by a fan. The frequency of the generator was fixed at 68 kHz for the entire process.
The plasma was applied in two ways: In batch and continuous flow systems (Figure 1). Thus, 100 mL of wine was treated in batch with plasma running at the combination of the following processing parameters: Power at 60 and 90 W and treatment time of 1, 3, 5, and 10 min. Moreover, 750 mL of wine was treated in continuous flow for 1.2 and 2.4 L/min at powers of 60 and 90 W, and treatment time of 25 min, sampling every 5 min. The treatments in batch were named with B (batch) and with LF (low flow) or HF (high flow), and the power (60 or 90) (Table 1). The six different treatments (B60, B90, LF60, HF60, LF90, and HF90) were carried out independently with biological triplicates (n = 3) and the application was conducted during six days over two weeks. Before treatments, all samples were at room temperature.
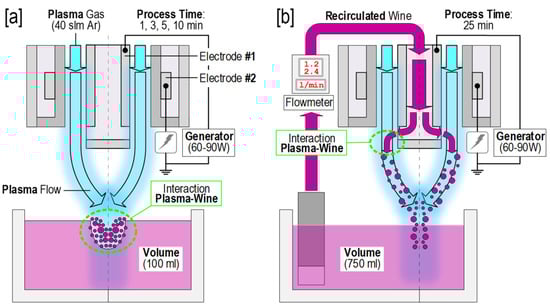
Figure 1.
Schematic representation of (a) batch Atmospheric Pressure Cold Plasma (APCP) treatments and of (b) continuous APCP treatments.

Table 1.
Argon APCP treatments in batch (B) and low flow (LF) and high flow (HF) systems (F) characteristics.
2.2. Analysis of Physical and Color Parameters
Before and after each treatment, every sample was analyzed regarding the physical parameters of temperature, pH, and conductivity with a multi-meter of temperature, pH, and conductivity (multisensor 5048, HACH, Madrid, Spain). Color intensity (CI) and hue were measured according to the European Community Official Methods protocols [18]. Total phenolic compounds in mg/L of gallic acid (TP) were determined by the Folin-Ciocalteau method by the Miura-One enzymatic auto analyzer (TDI S.L., Barcelona, Spain).
2.3. Analysis of Anthocyanins and Vitisins by HPLC
In addition, the samples were analyzed in terms of individual anthocyanins and vitisins by HPLC. Non-acylated and acylated anthocyanins and vitisins were analysed using an Agilent 1260 Infinity chromatograph, equipped with a diode array detector (DAD, Agilent, Santa Clara, CA, USA). The procedure followed was described by Portu et al. [19]. They used a Licrospher® 100 RP-18 reversed-phase column (250 × 4.0 mm; 5 μm packing; Agilent, Santa Clara, CA, USA) with pre-column Licrospher® 100 RP-18 (4 × 4 mm; 5 μm packing; Agilent, Santa Clara, CA, USA). The column temperature was set at 40 °C, the flow rate was established at 0.630 mL/min, and the injection volume was 10 µL. Eluents were (A) acetonitrile/water/formic acid (3:88.5:8.5, v/v/v), and (B) acetonitrile/water/formic acid (50:41.5:8.5, v/v/v). The linear solvent gradient was: 0 min, 6% B; 15 min, 30% B; 30 min, 50% B; 35 min, 60% B; 38 min, 60% B; 46 min, and 6% B.
Anthocyanins were identified according to the retention times of the available pure compounds and the UV–Vis data obtained from authentic standards and/or published in previous studies on β-glucosidase activity. Anthocyanins were quantified at 520 nm as malvidin-3-O-glucoside (Extrasynthèse, Genay, France). Concentrations were expressed as milligrams per litter of wine (mg/L). The data corresponds to the average of the analyses of three samples (n = 3). The total anthocyanins consisted of the sum of the individualized anthocyanins.
2.4. Statistical Analysis
The analytical parameters measured for each of the samples were statistically analyzed with the SPSS software (IBM® SPSS Statistic version 23, Armonk, NY, USA). Analyses of the variance (ANOVA) were assessed. The significant differences between mean values were determined by Tukey’s HSD test and differences were considered as significant when the p value was below 0.05.
3. Results and Discussion
This study analyzed the effects of Argon APCP batch and flow systems applied to a red wine and it was focused on its color and phenolic properties. For that purpose, the treatments were applied with two different powers, in batch and flowing, and during several minutes. Variability between starting wines was mainly due to the fact that treatments were performed in six days of two consecutive weeks. The initial wine suffered some type of evolution during those days, which made it that times zero or control samples had different physicochemical parameters like the pH. This made us consider each treatment as totally independent.
3.1. Impact of APCP Treatments on Physical and Color Parameters
Results of the average physical parameters measured in wines before and after the six Argon APCP treatments are shown in Table 2. The temperature of the control and treated samples hardly varied during the application of most of the treatments. In batch systems, the temperature did not change significantly after 10 min of treatment, the same result was observed in low flow systems after 25 min. The temperature was only significantly increased with time in the treatments linked to high flow systems, although it varied only from 19.7 °C to 20.4 °C when applying 60 W and from 20.7 °C to 21.8 °C when applying 90 W. This result demonstrated the cold character of APCP treatments despite the applied energy [20]. The pH parameter measures the hydrogen ion concentration of a solution. A decrease of water pH after APCP treatments was demonstrated [21]. In contrast, inconclusive results about pH variation after APCP have been observed with other products [22]. In our study, only after the batch treatment of low power (B60) applied to wine from 1 to 5 min did the pH significantly increase to reach around 4 units, which might trigger the microbial spoilage of wine. On another point, the conductivity means that the facility of a liquid media might flow an electric discharge. It has been observed that plasma activated water conductivity is higher than the conductivity found in non-treated water [21]. In this research, wine conductivity was significantly higher than the control after 3 or 5 min of batch APCP treatments. In contrast, conductivity was reduced after flowing treatments, although this reduction was only significant after 20 min of treatment HF90. This reduction was also observed by Pankaj et al. [15] after APCP treatment of 80 kV for 4 min in grape juice. In general, a drop in the conductivity of wines is related to a loss in their tartaric stability [23].
Table 2.
Average physical parameters assessed for wine with different Argon APCP treatments and the standard deviation of data (n = 3).
The color intensity (CI) is an index of the amount of color of a wine. It significantly increased after batch treatments (Table 3). This increase was of approximately two units for both 60 and 90 W, which is, overall, positive for red wine quality [16]. However, the CI increase after flow systems was lower (between 0.2 and 0.6 units after 25 min of treatment) and had statistical significance only for LF60, HF90, and LF90 treatments (Table 3). The lowest hue of a wine means a positive wine evolution, which was observed after 10 min of batch treatments. Flow APCP treatments also resulted in a tonality reduction, although it was only significant in the treatment of the greatest flow and power.
Table 3.
Average color parameters assessed for wine with different Argon APCP treatment and the standard deviation of data (n = 3).
The average total phenolic (TP) compounds, determined by the reaction with the Folin reagent, was significantly higher after batch APCP treatments, varying from 1067 to 1170 with 60 W and from 1067 to 1194 with 90 W (Table 3). In this way, Herceg et al. [24] reported an increase in TP in pomegranate juice after Argon plasma treatment. This index is based on the capacity of the phenolics to react with oxidant agents so that it is a total determination of phenolic compounds, but it also expresses the contribution of these compounds to the antioxidant activity of the sample, so its increase is positive for wine quality. However, flowing APCP treatments did not result in a significant modification of TP. Even in the bibliography, contradictory results are found, for instance Lukić et al. [25] observed a reduction of TP in a Cabernet Sauvignon red wine, which could be due to the possible degradation of these compounds by the plasma mechanism.
3.2. Impact of APCP Treatments on Anthocyanin and Vitisins Contents
The anthocyanins free monomers are the main responsible for the color of young red wines. They were analyzed individually for every sample. The HPLC analyses identified five non-acylated anthocyanins (Table 4), including 3-o-glucosides (3-glc) of delphinidin, cyanidin, petunidin, peonidin, and malvidin and 11 acylated anthocyanins (Table 5), including acetyl glucosides (3-acglc) of delphinidin, petunidin, peonidin, and malvidin; trans-p-coumaroyl glucosides (3-cmglc) of delphinidin, cyanidin, petunidin, peonidin, and cis and trans malvidin and caffeoyl glucoside (cfglc) of malvidin.
Table 4.
Average non-acylated anthocyanins (mg/L) wine with different Argon APCP treatments and the standard deviation of data (n = 3).
Table 5.
Average acylated anthocyanin content (mg/L) (acetylated, coumarylated and caffeoylated) in wine with different Argon APCP treatments.
Non-acylated anthocyanins represented around 70%, with malvidin-3-o-glucoside being the majority. Between non-acylated anthocyanins, malvidin derivatives were also found to be the predominant anthocyanin type, while coumaroylated anthocyanins were the major acylated form, which is in accordance with previous studies with the Tempranillo grape variety [25]. Cyanidin -3- acetylglucoside was not detected in any case. The most important variations for non-acylated anthocyanins were obtained for batch treatments (Table 4). Thus, APCP static treatment, applied with a power of 60 W, led to a significant increase of delphinidin, petunidin, and malvidin-3-glucosides; the same treatment applied with a power of 90 W enhanced delphinidin and petunidin-3 glucosides. In both cases, the positive increase for the wine quality of these compounds occurred from the first minute of treatment and remained practically constant. This increase could be related to the observed increase in CI exposed previously. As Table 4 shows, there were hardly any variations for the flowing APCP treatments. Only peonidin and malvidin-3-glc decreased significantly after 25 min of the treatment with the lowest flow and power.
Similar to anthocyanins non-acylated, the most important variations for the acylated ones were obtained for batch treatments (Table 5). Thus, for B60, a significant increase was observed for petunidin and malvidin-3-acglc, for five of the six coumaroylated glucosides, and for malvidin-3-cfglc. The treatment time from which the concentration of these compounds increased varied according to each of them (between 1 min and 10 min). For B90, a lower number of anthocyanins increased their concentration significantly, including petunidin and malvidin-3-acglc, and delphinidin and malvidin-3-trans-cmglc. In this case, as happened with non-acylated anthocyanins, the increase only occurred after one minute of treatment and remained practically constant. As can be observed in Table 5, dynamic treatments did not produce variations in these compounds, with the exception of petudine-3-acglc, which decreased significantly after 25 min of low flow treatment and 60 watts of power. Elez et al. [26] applied plasma to sour cherry Marasca and they found a higher concentration of anthocyanins compared to untreated juice for short treatments (3 min). However, results obtained by Lukić [16] indicated a decrease in the composition of free anthocyanins in a Cabernet Sauvignon red wine. This decrease became more sever with the treatment duration and the frequency of the batch treatment. This could be explained by the degradation of these compounds by the plasma mechanisms.
Due to the difficulty to evaluate every individual compound in the samples, their total contents were studied (Figure 2). It was demonstrated that treatment of B60 led to an increase of the total acylated, non-acylated, and the total anthocyanins. Applying the highest power of APCP in the batch did not cause this impact. This was because the total anthocyanins content only increased after 1 min of treatment with statistical significance, but this effect disappeared with longer treatments. Being anthocyanins, which are the compounds mainly responsible for red wine color, the batch treatment with the lowest power was the most favorable for the color of the wine. On the other hand, none of the dynamic treatments did not significantly modify the total content of acylated anthocyanins, nor non-acylated, and nor the total anthocyanins content.
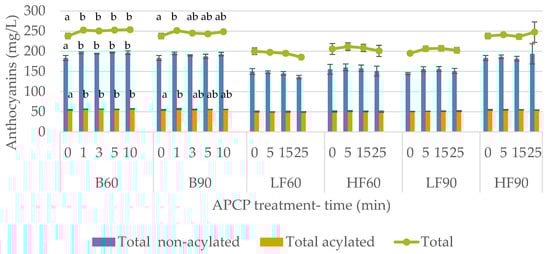
Figure 2.
Total anthocyanins content (mg/l) of non-acetylated and acetylated anthocyanins in wine after different Argon-APCP treatments applied different times (0, 5, 15, and 25 min). Error bars represent the standard deviation (n = 3). Different letters mean significant differences between samples (p ≤ 0.01). No letters mean no significant differences.
In Figure 3, results of vitisins A and B of every sample are shown. Some anthocyanin derived pigments from malvidin-3-glucoside, such as vitisins A and B are of interest because of their stability in the conditions common in red wines [27]. Treatment of B60 was the only one that caused a significant increase in vitisin A content after 10 min of treatment, but the lowest content was described 3 min after APCP treatments. However, this effect was not observed in vitisin B content with this same treatment. In this case, flow treatment HF90 caused a significant increase of vitisin B 25 min after treatment. The rest of the treatments did not modify the concentration of these compounds.
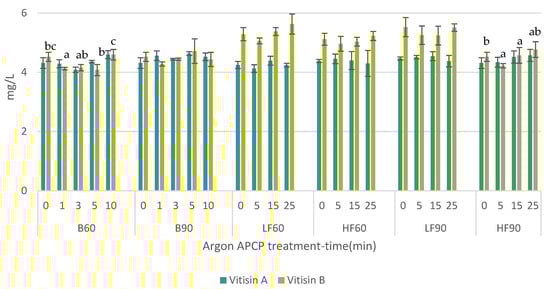
Figure 3.
Vitisin A and B content (mg/L) in wine after different Argon–APCP treatments applied different times (0, 1, 3, 5, 10, 15, and 25 min). Error bars represent the standard deviation (n = 3). Different letters mean significant differences between samples (p ≤ 0.01). No letters mean no significant differences.
4. Conclusions
Important variations were not observed in the physical parameters of Tempranillo young wine after Argon APCP treatments, except in the pH increase after 5 min of low power batch treatment. Nevertheless, chromatic properties and phenolic compounds content depended on the treatment conditions. Overall, treatments in batch caused a more favorable impact on wine quality, since they provided greater color intensity, lower tonality, and higher content in total phenolic compounds and anthocyanins of wine. Among the batch treatments, the one with lower power was the most positive, which could mean that the highest energies are not necessarily linked to better effects of the technique under the color properties of red wine. The utilization of flowing argon APCP treatments in wines, in spite of being the most appropriate system to be implemented in wineries, did not lead to significant improvements in the chromatic properties and phenolic compounds content in the wine, but they were not unfavorable. Further research and investigations should be carried out to improve the results of APCP flowing systems.
Author Contributions
F.A.-E. and I.L.-A. designed the experiment. E.S.-G. and R.M.-V. were in charge of PLASMA equipment and application of treatments. R.E.-V., J.P., L.G.-A. and I.L.-A. carried out the analytical assessments. R.L., I.L.-A. and L.G.-A. wrote and reviewed the manuscript. L.G.-A. submitted the manuscript and acted as correspondence author.
Funding
This work was funded by the Government of La Rioja project R-11-18 that could be co-financed by the European Regional Development Fund, granted to the Autonomous Community of La Rioja, within the ERDF Operational Program.
Conflicts of Interest
The authors declare no conflict of interest.
References
- Costanigro, M.; Appleby, C.; Menke, S.D. The Wine Headache: Consumer Perceptions of Sulfites and Willingness to Pay for Non-Sulfited Wines. Food Qual. Prefer. 2014, 31, 81–89. [Google Scholar] [CrossRef]
- D’Amico, M.; Di Vita, G.; Monaco, L. Exploring Environmental Consciousness and Consumer Preferences for Organic Wines without Sulfites. J. Clean. Prod. 2016, 120, 64–71. [Google Scholar] [CrossRef]
- Arnous, A.; Makris, D.P.; Kefalas, P. Effect of Principal Polyphenolic Components in Relation to Antioxidant Characteristics of Aged Red Wines. J. Agric. Food Chem. 2001, 49, 5736–5742. [Google Scholar] [CrossRef] [PubMed]
- Ziuzina, D.; Boehm, D.; Patil, S.; Cullen, P.J.; Bourke, P. Cold Plasma Inactivation of Bacterial Biofilms and Reduction of Quorum Sensing Regulated Virulence Factors. PLoS ONE 2015, 10, e0138209. [Google Scholar] [CrossRef]
- Misra, N.; Schlüter, O.; Cullen, P. Cold Plasma in Food and Agriculture: Fundamentals and Applications; Academic Press Elsevier: Amsterdam, The Nederland, 2016. [Google Scholar]
- Kim, H.-J.; Yong, H.I.; Park, S.; Kim, K.; Choe, W.; Jo, C. Microbial Safety and Quality Attributes of Milk Following Treatment with Atmospheric Pressure Encapsulated Dielectric Barrier Discharge Plasma. Food Control 2015, 47, 451–456. [Google Scholar] [CrossRef]
- Parpinello, G.P.; Versari, A.; Chinnici, F.; Galassi, S. Relationship among Sensory Descriptors, Consumer Preference and Color Parameters of Italian Novello Red Wines. Food Res. Int. 2009, 42, 1389–1395. [Google Scholar] [CrossRef]
- Barsotti, L.; Dumay, E.; Mu, T.H.; Fernandez Diaz, M.D.; Cheftel, J.C. Effects of High Voltage Electric Pulses on Protein-Based Food Constituents and Structures. Trends Food Sci. Technol. 2001, 12, 136–144. [Google Scholar] [CrossRef]
- García-Beneytez, E.; Revilla, E.; Cabello, F. Anthocyanin Pattern of Several Red Grape Cultivars and Wines Made from Them. Eur. Food Res. Technol. 2002, 215, 32–37. [Google Scholar] [CrossRef]
- Sacchi, K.L.; Bisson, L.F.; Adams, D.O. A Review of the Effect of Winemaking Techniques on Phenolic Extraction in Red Wines. Am. J. Enol. Vitic. 2005, 56, 197–206. [Google Scholar]
- Minussi, R.C.; Rossi, M.; Bologna, L.; Cordi, L.; Rotilio, D.; Pastore, G.M.; Durán, N. Phenolic Compounds and Total Antioxidant Potential of Commercial Wines. Food Chem. 2003, 82, 409–416. [Google Scholar] [CrossRef]
- Briviba, K.; Abrahamse, S.L.; Pool-Zobel, B.L.; Rechkemmer, G. Neurotensin-and EGF-Induced Metabolic Activation of Colon Carcinoma Cells Is Diminished by Dietary Flavonoid Cyanidin but Not by Its Glycosides. Nutr. Cancer 2001, 41, 172–179. [Google Scholar] [CrossRef]
- Negro, C.; Tommasi, L.; Miceli, A. Phenolic Compounds and Antioxidant Activity from Red Grape Marc Extracts. Bioresour. Technol. 2003, 87, 41–44. [Google Scholar] [CrossRef]
- Pérez-Magariño, S.; González-San José, M.L. Polyphenols and Colour Variability of Red Wines Made from Grapes Harvested at Different Ripeness Grade. Food Chem. 2006, 96, 197–208. [Google Scholar] [CrossRef]
- Pankaj, S.K.; Wan, Z.; Colonna, W.; Keener, K.M. Effect of High Voltage Atmospheric Cold Plasma on White Grape Juice Quality. J. Sci. Food Agric. 2017, 97, 4016–4021. [Google Scholar] [CrossRef] [PubMed]
- Lukić, K.; Vukušić, T.; Tomašević, M.; Ćurko, N.; Gracin, L.; Kovačević Ganić, K. The Impact of High Voltage Electrical Discharge Plasma on the Chromatic Characteristics and Phenolic Composition of Red and White Wines. Innov. Food Sci. Emerg. Technol. 2017, 53, 70–77. [Google Scholar] [CrossRef]
- Bursać Kovačević, D.; Putnik, P.; Dragović-Uzelac, V.; Pedisić, S.; Režek Jambrak, A.; Herceg, Z. Effects of Cold Atmospheric Gas Phase Plasma on Anthocyanins and Color in Pomegranate Juice. Food Chem. 2016, 190, 317–323. [Google Scholar] [CrossRef] [PubMed]
- Commission Regulation. Commission Regulation (EC) No 606/2009 of 10 July 2009 Laying down Certain Detailed Rules for Implementing Council Regulation (EC) No 479/2008 as Regards the Categories of Grapevine Products, Oenological Practices and the Applicable Restrictions. Off. J. Eur. Union L 2009, 193, 1–59. [Google Scholar]
- Portu, J.; López, R.; Baroja, E.; Santamaría, P.; Garde-Cerdán, T. Improvement of Grape and Wine Phenolic Content by Foliar Application to Grapevine of Three Different Elicitors: Methyl Jasmonate, Chitosan, and Yeast Extract. Food Chem. 2016, 201, 213–221. [Google Scholar] [CrossRef]
- Mandal, R.; Singh, A.; Singh, A.P. Recent Developments in Cold Plasma Decontamination Technology in the Food Industry. Trends Food Sci. Technol. 2018, 80, 93–103. [Google Scholar] [CrossRef]
- Thirumdas, R.; Kothakota, A.; Annapure, U.; Siliveru, K.; Blundell, R.; Gatt, R.; Valdramidis, V.P. Plasma Activated Water (PAW): Chemistry, Physico-Chemical Properties, Applications in Food and Agriculture. Trends Food Sci. Technol. 2018, 77, 21–31. [Google Scholar] [CrossRef]
- Coutinho, N.M.; Silveira, M.R.; Rocha, R.S.; Moraes, J.; Ferreira, M.V.S.; Pimentel, T.C.; Freitas, M.Q.; Silva, M.C.; Raices, R.S.L.; Ranadheera, C.S.; et al. Cold Plasma Processing of Milk and Dairy Products. Trends Food Sci. Technol. 2018, 74, 56–68. [Google Scholar] [CrossRef]
- Bosso, A.; Motta, S.; Petrozziello, M.; Guaita, M.; Asproudi, A.; Panero, L. Validation of a Rapid Conductimetric Test for the Measurement of Wine Tartaric Stability. Food Chem. 2016, 212, 821–827. [Google Scholar] [CrossRef]
- Herceg, Z.; Kovačević, D.B.; Kljusurić, J.G.; Jambrak, A.R.; Zorić, Z.; Dragović-Uzelac, V. Gas Phase Plasma Impact on Phenolic Compounds in Pomegranate Juice. Food Chem. 2016, 190, 665–672. [Google Scholar] [CrossRef]
- Portu, J.; López-Alfaro, I.; Gómez-Alonso, S.; López, R.; Garde-Cerdán, T. Changes on Grape Phenolic Composition Induced by Grapevine Foliar Applications of Phenylalanine and Urea. Food Chem. 2015, 180, 171–180. [Google Scholar] [CrossRef]
- Elez Garofulić, I.; Režek Jambrak, A.; Milošević, S.; Dragović-Uzelac, V.; Zorić, Z.; Herceg, Z. The Effect of Gas Phase Plasma Treatment on the Anthocyanin and Phenolic Acid Content of Sour Cherry Marasca (Prunus Cerasus Var. Marasca) Juice. LWT-Food Sci. Technol. 2015, 62, 894–900. [Google Scholar] [CrossRef]
- Morata, A.; Calderón, F.; González, M.C.; Gómez-Cordovés, M.C.; Suárez, J.A. Formation of the Highly Stable Pyranoanthocyanins (Vitisins A and B) in Red Wines by the Addition of Pyruvic Acid and Acetaldehyde. Food Chem. 2007, 100, 1144–1152. [Google Scholar] [CrossRef]
© 2019 by the authors. Licensee MDPI, Basel, Switzerland. This article is an open access article distributed under the terms and conditions of the Creative Commons Attribution (CC BY) license (http://creativecommons.org/licenses/by/4.0/).