Simple Summary
Assessing seasonal patterns in mammal diversity and distribution is crucial for effective conservation strategies, although species responses to seasonal changes are not always consistent with ecological expectations. Using camera trapping combined with spatial analyses, we found that although species richness typically peaked during the rainy season, gallery forests showed significantly lower diversity, likely due to flooding that restricted resource access. Contrary to our hypothesis, spatial analysis revealed dispersion rather than clustering across both small and large mammals. These findings suggest that resource dynamics and habitat constraints, rather than body size alone, drive the seasonal distribution patterns of species, underscoring the need to integrate seasonal and habitat-specific variables into wildlife management.
Abstract
Understanding seasonal patterns in mammals’ diversity and spatial distribution is vital for effective biodiversity conservation. This study examines seasonal variations in mammal diversity and distribution in the Pénéssoulou Classified Forest (northwest Benin). We hypothesized that (i) species richness and abundance are highest during the rainy season due to greater water and food availability; and (ii) small mammals exhibit spatial clustering, whereas large mammals are more spatially dispersed. We carried out negative binomial regression to analyze the effects of season, vegetation type, and proximity to waterholes on species richness. Spatial patterns were analyzed using Moran’s I index across size categories. We found lower species richness in the dry season (β = −0.812 ± 0.375, p = 0.030), which supports our hypothesis and is likely driven by increased resource availability. Contrary to our expectation, small mammals tended to be more dispersed during the rainy season, while larger mammals showed greater dispersion in the dry season. Significantly lower species richness was observed in gallery forests (β = −2.794 ± 1.144, p = 0.015), probably due to seasonal flooding, which limits access to resources. Our findings underscore the importance of incorporating seasonal and habitat-specific variables into wildlife monitoring and management.
1. Introduction
One of the greatest challenges in animal ecology is understanding how environmental factors influence the diversity, density, and distribution of terrestrial mammals. This knowledge is critical for developing effective management strategies and guiding conservation actions aimed at protecting terrestrial mammals and biodiversity [1].
Environmental factors, including the climate and water, biological factors, such as competition, predator–prey interactions, vegetation distribution, and the availability of food resources [2], as well as anthropogenic pressures [3], have been identified as key drivers of mammal ecology. The distribution of terrestrial mammals is generally thought to be strongly influenced by temperature and rainfall [4]. According to ecological population regulation theory [5], seasonal fluctuations, predation pressure, human activities, and food availability affect mammal population dynamics. In addition, altitude, forest fragmentation, and the presence of ecological corridors affect species diversity, while biogeographical and behavioral factors shape spatial distribution [6]. Many species adopt distinct spatial strategies depending on resource availability and their dietary requirements. For instance, large herbivores often range over extensive areas in response to seasonal variations in food availability, whereas carnivores tend to maintain more defined territories, with prey density largely determining the extent of their home range [6]. In this context, herbivores’ body size is considered an important determinant of habitat selection, and mammals’ spatial distribution is often linked to body mass [7,8]. However, seasonal variations may also play a significant role in shaping these distribution patterns [8].
According to the seasonal variation hypothesis, mammal distribution patterns are influenced by seasonal variations in climate, resource availability, and habitat suitability [9]. In regions with distinct dry and rainy seasons, such as tropical ecosystems, variations in temperature and precipitation affect ecosystem dynamics, making seasonal effects on species distribution particularly pronounced. Seasonal fluctuations can substantially alter habitat conditions, influencing the suitability of specific areas for different mammal species [10,11]. For example, in savanna ecosystems, the dry season is characterized by decreases in foliage cover, higher temperatures, and limited water availability. These conditions render the habitat less suitable for species that depend on dense, moist forests, forcing them to move to more suitable environments [12]. Consequently, local species richness may vary as a result of temporary range expansions or contractions driven by seasonal changes in habitat suitability. Understanding the complex interactions that govern seasonal variations in mammal diversity, abundance, and spatial distribution at smaller scales remains a major ecological challenge worldwide.
While previous studies in West African forests and protected areas have yielded valuable insights into mammal species composition, abundance, and seasonal dynamics, studies focusing specifically on small, human-impacted forest systems, such as the Pénéssoulou Classified Forest in Benin, remain scarce. Most existing studies have relied primarily on indirect evidence, often lacking the integration of fine-scale spatial and seasonal analyses. This study uses a systematic camera trapping design across multiple habitats within the Pénéssoulou Classified Forest coupled with robust spatial and statistical analyses to assess seasonal variations in mammal species richness, abundance, and diversity indices. Furthermore, the influences of vegetation type and proximity to water on mammal abundance and distribution are explored, as well as spatial distribution patterns across mammal body sizes. By generating a comprehensive dataset within a forest ecosystem undergoing restoration efforts and subject to anthropogenic pressures, this research addresses critical gaps and provides novel insights relevant to regional wildlife conservation and management.
In this study, we test the following two hypotheses: (i) mammal species richness and abundance are higher during the rainy season, when food and water resources are more abundant; and (ii) smaller mammal species exhibit more aggregated spatial distributions than larger mammals, although this pattern may shift seasonally in response to resource dynamics and habitat constraints.
2. Materials and Methods
2.1. Study Area
The study was carried out in the Pénéssoulou Classified Forest (5470 ha), located between latitudes 9°14′ and 9°19′ N and longitudes 1°30′ and 1°38′ E (Figure 1).
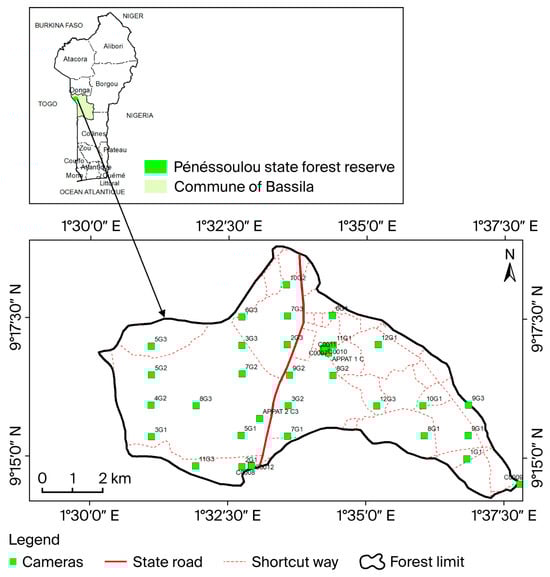
Figure 1.
Map of the Pénéssoulou Classified Forest showing the locations of camera traps. There are three cameras between C0007 and C0011: C0002, C0003, and C0004. The first image above shows a map of Benin surrounded by its bordering countries. The labels such as Alibori, Atacora, Borgou, Donga, etc., within this map refer to Benin’s twelve departments. The labels near the camera icons are the names assigned to each camera.
The forest is located within the municipality of Bassila, which is part of the Donga administrative department, and it falls within the Bassila phytogeographical district of the Guineo-Sudanian transition zone. This zone is primarily characterized by woodland savannas, riparian forests, and dense semi-deciduous forests [13]. In terms of climate and vegetation, it is comparable to the humid parts of southern Benin and rainier (1100 mm to 1300 mm) than neighboring areas [14]. This rainfall range reflects differences between neighboring zones rather than a precise local measurement.
The forest harbors a mosaic of habitats, including croplands (farmlands and fallows), shrub and tree savannas, gallery forests, woodlands, and both dense and dry forests (Table A1). The region experiences a bimodal seasonal pattern, with a dry season extending from mid-October to mid-April and a rainy season from mid-April to mid-October. The dominant soil types are tropical ferruginous soils, although hydromorphic and ferrallitic soils are also present in some areas. To enhance the forest’s conservation status, reforestation efforts have introduced fast-growing species, such as Tectona grandis and Gmelina arborea, through management initiatives aimed at rehabilitating over 22,000 hectares of degraded state forests. These actions support participatory restoration strategies and carbon sequestration. Due to unsustainable year-round agriculture and illegal hunting, most large mammal species have been extirpated from the forest. However, conservation efforts led by the National Wood Office of Benin (ONAB) have contributed to a gradual ecological recovery since 2014 [14].
The region is home to several ethnic groups, including the Anii, Nagot, Kotokoli, Fulani, Otammari, and Lokpa. The economy is primarily based on traditional agriculture, particularly the cultivation of cotton and yams—activities that remain key drivers of forest loss [14]. Between 2005 and 2015, approximately 1006.5 hectares of forest area were lost, corresponding to an average annual degradation rate that rose from 0.25% to 3.79% [14]. Bushmeat and traditional medicine markets continue to undermine the regulatory, structural, and productive functions of forests by targeting mammal species with the largest body sizes, longest generation times, and smallest litter sizes, including large herbivores and keystone predators [15].
2.2. Sampling and Data Collection
To assess the effects of seasonal variations on mammal diversity, abundance, and distribution, we deployed 39 camera traps that were monitored monthly during both the dry and rainy seasons. Only two cameras were placed in gallery forests, as large portions of this habitat type were inaccessible due to flooding during the rainy season. Prior to camera deployment, a reconnaissance survey was conducted with local foresters and hunters to identify and geo-reference trails frequently used by mammals. Based on the information gathered, GardePro A3S automatic camera traps—new-generation digital surveillance devices—were installed at 1.5 km intervals along the trails in grasslands, savannas, woodlands, dry woodlands, and gallery forests, following the recommendations of the ENETWILD-Consortium et al. [16].
This spacing is also consistent with the average inter-camera distance of 1.3 km reported by Burton et al. [17] based on a meta-analysis of 266 studies. However, some cameras were strategically positioned in key zones to maximize the likelihood of mammal detection, resulting in shorter distances between certain camera stations. The GardePro A3S camera traps used in this study feature a 20 MP resolution, no-glow infrared flash, a 0.3 s trigger speed, a 25 m detection range, and weather-resistant housing. They can also capture high-resolution images and videos, and their rapid triggering response and extended detection range enhance species detection and identification accuracy. The no-glow infrared technology minimizes wildlife disturbance while providing extended battery life, ample storage capacity, and robust performance in harsh field conditions, making the units highly suitable for long-term ecological monitoring. Moreover, the cameras are cost-effective and easy to install and they operate silently, ensuring both reliability and practicality for field-based research. Each camera was placed at the center of a 50 m radius sampling unit to maintain a standardized detection probability in open vegetation habitats [18]. Installation was carried out by a team comprising a forester, a wildlife specialist, and a junior wildlife researcher.
We installed the camera traps along forest trails, as these paths are frequently used by mammals and thus increase the likelihood of detections [18,19]. This approach is widely adopted in tropical forest studies to enhance the detection probability of medium and large-sized mammals [18,19]. Along each trail, cameras were mounted on tree trunks at a height of 30 to 50 cm above the ground, an optimal range for recording terrestrial species in tropical ecosystems. Each camera was configured to capture up to three consecutive images per detection event and operated continuously throughout the dry (April–June) and rainy (July–September) seasons. They covered an effective detection radius of approximately 30 m.
To ensure proper orientation, a member of the field team walked through the detection zone (2–3 m in front of the camera) to verify adequate coverage of wildlife trails. Adjustments were made as needed to optimize the detection of fast-moving species. To improve the detection of small mammals, such as mongooses and rodents, cameras were installed less than 3 m from the trails. For consistency, all cameras were aligned parallel to the ground. When installed on sloping trees or uneven terrain, appropriate adjustments were made to maintain a constant field of view and ensure uniform detection efficiency. Cameras were deployed only once per season and checked monthly with minimal disturbance. All installations and verifications were performed outside of peak animal activity periods to minimize behavioral interference.
All camera traps were inspected monthly to ensure proper functioning, and batteries were replaced as needed to prevent operational failures.
2.3. Statistical Analysis
2.3.1. Estimating Mammal Abundance and Diversity
After each sampling period, memory cards were removed from the camera and images were processed using DeskTEAM GPLv3 [20]. Mammal species were identified using the nomenclature from [21], with the assistance of wildlife experts from the University of Abomey-Calavi.
We used the R4.2.2 package camtrapR [22] to quantify mammal community descriptors by filtering image records of each species and determining the number of independent detection events per hour. This ensured that multiple images of the same individual remaining in front of the camera were not treated as separate events [5]. All recordings were sorted and annotated by three trained researchers. Each capture was reviewed using camtrapR, and the corresponding metadata (date, time, camera location) were extracted to construct species detection histories. The number of independent detections per camera station and sampling interval was then recorded. To avoid pseudo-replication, two detections of the same species at the same station were considered independent only when separated by at least 30 min.
The relative abundance (RA) of each species across all cameras was calculated as the ratio of the number of detections of that species to the total number of detections for all species [18,23]. An abundance matrix was then constructed to estimate diversity indices (species richness, Shannon diversity, Pielou’s equitability, and Simpson’s diversity index) using the vegan package [24] in R version 4.3.3. Because species richness is strongly influenced by sampling area and may be biased, we used Chao 1 first-order to account for unseen rare species, computed for both pooled data and per camera trap location:
where is the observed number of species, is the number of singletons, is the number of doubletons, and is the total number of individuals, is the first-order Chao estimator.
The Shannon diversity index (H′) [25] was calculated as
where is the relative frequency (probability of occurrence) of species j given by the ratio , is the number of individuals of species , and is the total number of individuals. varies between 0 and , which is maximum diversity. was calculated for the pooled data and for each camera location.
Pielou’s equitability [26] is given by the ratio of the Shannon–Weaver diversity index () to its maximum possible value (H′max). It measures the regularity of species over a given area. For a sampling unit with a diversity index H′ and species richness S, equitability () is computed using the formula
This index ranges from 0 to 1. Values approaching 0 indicate strong dominance by a single species within the habitat, while a value of 1 reflects perfect evenness, where all species are equally abundant.
Simpson’s Diversity index, originally introduced by Simpson in 1949, remains a widely used metric in ecology for quantifying community diversity. In this study, we adopted the unbiased estimator of Simpson’s index [27], calculated using the following formula:
where Dominance is calculated using the following formula:
where represents the number of individuals of species i and represents the total number of individuals across all S species in the sample, which follows a multinomial distribution. S is the total number of species. The value of the index ranges from 0 and 1, with values approaching 1 indicating high diversity.
To better understand the spatial variations in species diversity and abundance, we estimated several environmental covariates using ArcGIS 10.5 software. These covariates included the distance from each camera to the forest edge, the distance to the nearest water point, and the type of vegetation formation. Vegetation was classified into distinct land-cover categories: crop–fallow mosaics, dense forests, gallery forests, open forest and wood savanna, tree and shrub savanna, water bodies, plantations, bare ground, rocky surfaces, and residential areas. Habitat types were identified through supervised classification using Landsat Thematic Mapper ™ and Enhanced Thematic Mapper Plus (ETM+) satellite images at a resolution of 30 m. The habitat class corresponding to each camera trap location was then extracted using ArcGIS 10.5 on 3 June 2025.
2.3.2. Estimating the Spatial Distribution of Mammal Species in the Forest
Spatial distribution maps were generated in ArcGIS for the four most abundant mammal species and overlaid on land-cover units of the forest. To quantify spatial autocorrelation (aggregation), we computed Moran’s I index [28] using the following equation:
where represents the number of 1 m2 grid cells; is the number of traces recorded in cell; is the value of at another cell ; is the overall mean of (in this case, the absolute density); and corresponds to the inverse of the Euclidean distance between two locations and , weighting the correlation between them such that more distant locations exert less influence. The Moran’s I index ranges from −1 to + 1, where a value close to −1 indicates strong spatial dispersion and a value near +1 reflects high aggregation or clustering. This index was computed using the ape package in R [28]. Given the limited sample size, it was estimated through a Monte Carlo simulation approach.
We calculated the Moran’s I Index separately for each body size class (small, medium, and large) for both seasons and the pooled dataset. Mammal species weighing less than 5 kg were classified as small, those between 5 and 50 kg as medium-sized, and those exceeding 50 kg as large. This size-based classification, which is widely used in African wildlife ecology and supported by Sinsin et al. [29], is commonly applied to examine patterns in species composition, ecological guilds, hunting pressure, and behavioral responses to human disturbance.
2.3.3. Seasonal Variations in Diversity and Abundance of Mammal Species in the Forest
To test the hypothesis that mammal diversity (species richness and abundance) is highest during the rainy season—driven by increased availability of water and food resources—we fitted a Generalized Linear Model (GLM) with a negative binomial distribution, including all two-way interactions. This model was progressively simplified by sequentially removing non-insignificant interaction terms based on the Akaike Information Criterion (AIC), retaining the model with the lowest AIC [30]. The response variables were predicted species richness (Chao1 estimator) and abundance per camera station.
Explanatory variables included the distance from each camera to the nearest waterholes, vegetation formation type, and season. We tested for multicollinearity among explanatory variables using the check_collinearity function in the performance package [31]. Variables with a Variance Inflation Factor (VIF) value below 5 were considered uncorrelated [31]. To evaluate whether the spatial distribution of mammals varied by body size, we compared Moran’s I index among size categories (small, medium, and large). As spatial distribution may also vary seasonally, the Moran’s I values were compared across size classes within each season.
3. Results
3.1. Recorded Observations and Diversity of Mammal Species
A total of 3772 mammal detections were recorded across all camera traps during the study period. Of these, 2376 detections (63%) occurred during the rainy season and 1396 detections (37%) occurred during the dry season, indicating greater overall mammal activity in the rainy season. However, detection frequencies varied considerably among camera stations (Table S1). The mean number of detections per camera was estimated at 35.79 ± 122.74 in the dry season and 60.92 ± 104.65 in the rainy season.
As hypothesized, mammal species richness was higher in the rainy season, with 16 species recorded compared to 10 species in the dry season (Table 1). The Shannon diversity index (H′) was estimated at 1.78 bits, compared with the theoretical maximum log2(S) at 4 bits, yielding an equitability value of 0.44, which reflects moderate diversity and low evenness among species. Simpson’s diversity index was estimated at 0.22, suggesting a moderate probability that two randomly selected mammals belong to different species. The most frequently detected species were Erythrocebus patas (Patas Monkey, 33.29%) and Syncerus caffer (African buffalo, 24.20%) (Figure 2).

Table 1.
Variation in diversity indices across seasons.
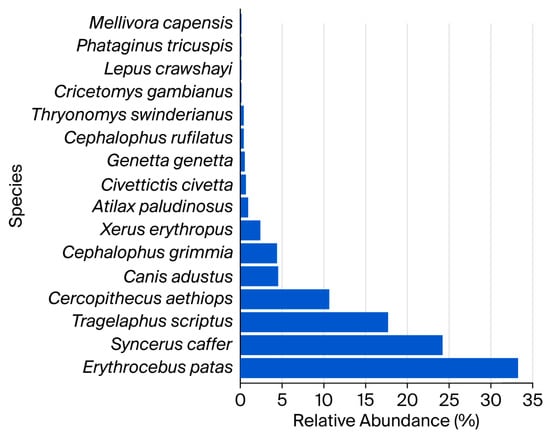
Figure 2.
Relative abundance of identified terrestrial mammal species.
Several species were rarely detected, with each representing less than 1% of total records. These included Phataginus tricuspis (white-bellied pangolin), Mellivora capensis (honey badger), Cricetomys gambianus (savanna giant pouched rat), Lepus crawshayi (African savanna hare), Thryonomys swinderianus (greater cane rat), Cephalophus rufilatus (gray or bush duiker), Genetta genetta (common genet), Civettictis civetta (common civet), and Atilax paludinosus (marsh mongoose).
The identified species were distributed across 11 families (Figure 3a) belonging to six distinct orders (Figure 3b). The Bovidae family was most represented, accounting for 25% of all species (4 out of 16), followed by Viverridae and Cercopithecidae, each comprising 12.5%. Families with the lowest representation (each contributing 6.25% of the total species) included Canidae, Herpestidae, Leporidae, Manidae, Mustelidae, Cricetomyidae, Sciuridae, and Thryonomyidae (Figure 3a).
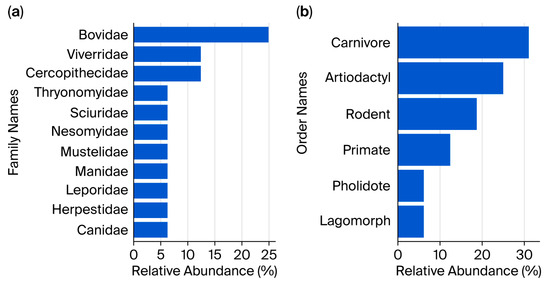
Figure 3.
Relative abundance of (a) families and (b) orders of terrestrial mammals identified.
At the order level, Carnivora was the most represented group (31.25%), followed by Artiodactyla (25%) and Rodentia (18.75%). Within Carnivora, five species were identified, distributed across four different families. Rodentia was represented by three species, each belonging to a distinct family (Table S2). All four species within the order Artiodactyla belonged to a single family. The least represented orders were Primates (two species), Lagomorpha, and Pholidota, each with only a single species (Table S2).
3.2. Seasonal Variation in Diversity, Abundance, and Species Distribution
A total of 10 mammal species were recorded during the dry season and 15 during the rainy season (Table 1). The species richness observed in the dry season was markedly lower than the predicted value (17.5), suggesting reduced diversity during this period. In contrast, both equitability and Shannon diversity indices were higher in the rainy season, indicating greater species evenness and overall diversity. Specifically, equitability values were 0.48 in the rainy season and 0.31 in the dry season, while the Shannon index measured 1.89 bits and 1.03 bits, respectively. These results indicate moderate overall seasonal diversity, with higher richness and evenness observed during the dry season, as expected.
Nine species (species common to both seasons) were detected during the dry and rainy seasons (Syncerus caffer, Tragelaphus scriptus, Erythrocebus patas, Cercopithecus aethiops, Canis adustus, Thryonomys swinderianus, Lepus crawshayi, Cephalophus grimmia, and Genetta genatta; Table 2).
Table 2.
Occurrence of mammalian species recorded by season.
Six additional species were detected exclusively in the rainy season: Civettictis civetta, Xerus erythropus, Atilax paludinosus, Cricetomys gambianus, Phataginus tricuspis, and Cephalophus rufitalus. The ratel was detected only during the dry season (Mellivora capensis).
In contrast to diversity, overall mammal abundance was slightly higher in the dry season. Camera traps recorded a total of 2454 individuals in the dry season (50.81% of all detections, 2454 out of 4830) compared to 2376 individuals (49.19%) during the rainy season (Figure 4a). Erythrocebus patas (48.17%) and Syncerus caffer (43.81%) were the most abundant in the dry season (Figure 4b). In contrast, during the rainy season, Tragelaphus scriptus (32.84%), Cercopithecus aethiops (20.50%), and Erythrocebus patas (17.92%) were the most frequently detected species. Low-abundance species in the dry season included Genetta genetta (0.12%), Lepus crawshayi (0.12%), Mellivora capensis (0.12%), Sylvicapra grimmia (0.61%), and Thryonomys swinderianus (0.04%). During the rainy season, the least abundant were Lepus crawshayi (0.13%), Phataginus tricuspis (0.13%), Cricetomys gambianus (0.25%), Thryonomys swinderianus (0.59%), Cephalophus rufilatus (0.80%), Genetta genetta (0.84%), and Civettictis civetta (1.14%).
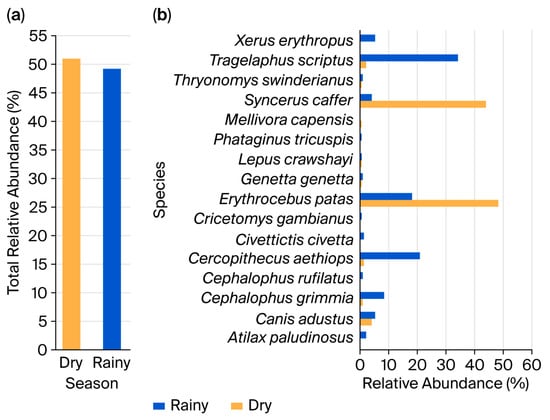
Figure 4.
Seasonal variations in the relative abundance of terrestrial mammals. (a) Both seasons combined. (b) By identified species.
A marked decline in the abundance of Syncerus caffer was observed during the rainy season (3.96% compared with 43.81% in the dry season). Conversely, Tragelaphus scriptus exhibited a substantial increase in abundance during the rainy season (33.84% compared with only 1.96% in the dry season). Other species, such as Erythrocebus patas, remained relatively well-represented in both seasons, suggesting a high degree of adaptability to varying climatic and ecological conditions.
3.3. Environmental Variables Influencing Species Richness and Abundance
The analyses revealed that season and vegetation type significantly influenced mammal diversity at the 5% threshold (Table 3). The Generalized Linear Model (GLM) showed a good fit to the data, with an AIC value ranging from 191.96 to 486.29. Variance Inflation Factor (VIF) values ranged from 2.57 to 3.46, indicating an absence of or very low multicollinearity.
Table 3.
Results of GLM testing of the effect of season and environmental variables on diversity and abundance.
Species richness was significantly influenced by the season, with lower richness observed during the dry season compared to the rainy season (β = −0.812 ± 0.375, p = 0.030, Table 3 and Figure 5a). The mean predicted number of species per camera trap was 2.56 ± 0.12 in the dry season and 3.85 ± 0.15 in the rainy season.
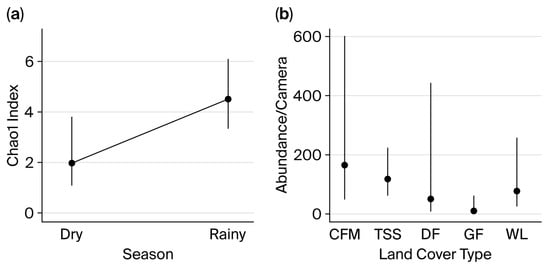
Figure 5.
Relationship between (a) species richness and season type; (b) abundance and land-use type. Legend: WL = woodlands, DF = dense forest, GF = gallery forest, CFM = crop–field mosaic, TSS = tree and shrub savanna. Points represent mean values, with vertical lines indicating 95% confidence intervals.
Similarly, mammal abundance was significantly affected by vegetation type, with lower values recorded in gallery forests (β = −2.794 ± 1.144, p = 0.015, Figure 5b). However, no significant correlation was found between the distance between camera traps and waterholes and either species richness or abundance. The model predicted an average of 11.25 ± 1.98 species per camera trap, which is substantially lower than the values observed in dry woodland (49.89 ± 8.89 49.89 ± 8.89 individuals/camera), woodland (55.25 ± 7.48 55.25 ± 7.48 individuals/camera), tree and shrub savanna (109.01 ± 5.14 109.01 ± 5.14 species/camera), and farmland (185.46 ± 2.72 185.46 ± 2.72 individuals/camera).
3.4. Seasonal Variations in the Spatial Distribution of Mammal Species
3.4.1. Body Size Distribution of Mammal Species According to the Season
Moran’s I values were all negative, ranging from −0.01 to −0.09, indicating a general tendency towards spatial dispersion irrespective of body size and season (Table 4). However, the associated p-values were high (>0.05), suggesting that this pattern of dispersion was not statistically significant. Dispersion appeared slightly more pronounced among small mammals during the rainy season (I = −0.09) compared to medium-sized (I = −0.01) and large mammals (I = −0.02). In contrast, during the dry season, dispersion was greater among medium-sized (I = −0.07) and large mammals (I = −0.08) than small mammals (I = −0.03). When data from both seasons were combined, dispersion was most pronounced among medium-sized mammals (I = −0.06), followed by small (I = −0.02) and large mammals (I = −0.004).
Table 4.
Results of the spatial autocorrelation test of mammals’ abundance as a function of their size.
3.4.2. Mammal Species Abundance Distribution Across Vegetation Types
A clear spatial variation was observed in the relative abundance of the four most frequently detected mammal species during the rainy season (Figure 6a). T. scriptus (30 detections per camera) was the most widespread and abundant species across a range of habitats. S. caffer (3 detections per camera) and C. aethiops (18 detections per camera) were more closely associated with dense forests, whereas E. patas (16 detections/camera) was less common and exhibited a scattered distribution. In contrast, during the dry season, a central hotspot of mammal activity was identified where E. patas (74 detections per camera) was the most frequently detected species, followed by S. caffer (67 detections per camera) (Figure 6b). T. scriptus (three detections per camera) and C. aethiops (two detections per camera) were present but less dominant, as shown on the first map. Overall, the spatial patterns of relative abundance indicate that tree and shrub savannas, along with woodlands, play a particularly important role in sustaining diverse mammal communities within the study area.
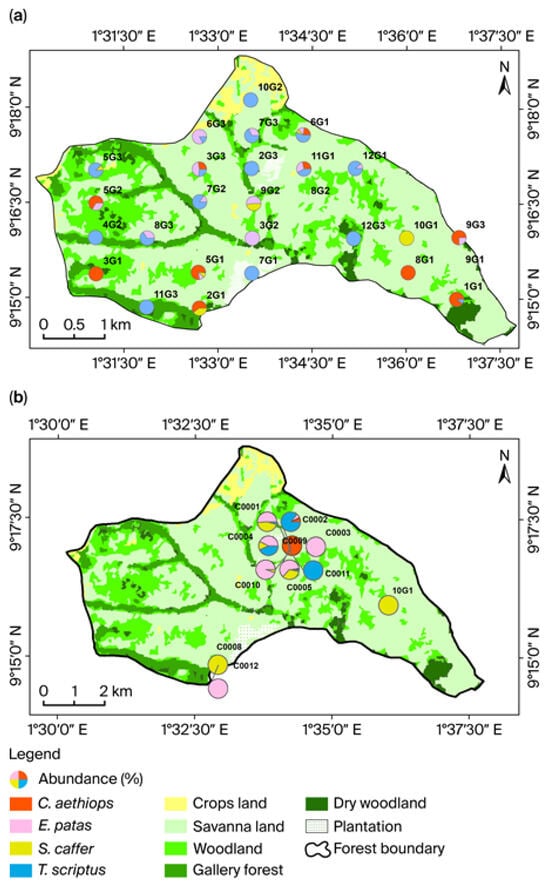
Figure 6.
Mammals’ abundance distribution across vegetation types for (a) the rainy season and (b) the dry season. Only the four most frequently identified species in the forest were considered. S = Syncerus, T = Tragelaphus, C = Cercopithecus, E = Erythrocebus patas. Only cameras that detected mammals were mapped.
4. Discussion
This study used camera trapping to assess the diversity of terrestrial mammals in the Pénéssoulou Classified Forest as part of a gradual process of gathering information on the spatial distribution of terrestrial mammals in this forest ecosystem in northwest Benin. The research was conducted to estimate species richness and abundance and assess species’ distribution within the forest.
We hypothesized that mammal diversity and abundance are greater during the rainy season as a result of the availability of resources (water and food). This hypothesis proved valid for species richness. We identified 10 unique terrestrial mammals during the dry season compared to 15 in the rainy season. This difference was tested for significance with camera data. Seasonal variations suggest that during the rainy season, the increased availability of food resources and better habitat coverage enable the detection of additional species. Our results support the seasonal variation hypothesis that climatic variability, resource availability, and habitat suitability shape mammal distribution patterns, particularly in regions where rainy and dry seasons are present [9]. Zhao et al. [32] suggest that this seasonal variation in richness is due to the spatiotemporal coexistence of certain mammal species. Our findings are consistent with previous research [33,34] indicating that seasonality has a strong influence on species detection and dynamics. Species richness estimated in this study differs from that reported in [10], while it aligns more closely with the values documented by [35].
The greater species richness in the rainy season correlates fairly well with [36], who demonstrated the positive impact of resource abundance on faunal inventory, as well as the effect of seasonality. The lower richness in the dry season points to the likelihood of undersampling, as the expected richness (17.5) was much higher than that observed (10 species). This underscores the need for more intensive sampling or the use of additional methods to obtain a complete inventory [37]. Although camera traps have revealed many previously unrecorded small mammal species in other studies [38], our survey did not detect such species, likely due to methodological limitations rather than their true absence in the area. Unlike species richness, the relative abundance of all species identified did not differ enough between seasons to validate our hypothesis. However, notable seasonal variations were observed between species. For example, in the dry season, some species, such as Syncerus caffer, were highly abundant, while others remained rare. On the other hand, the abundance of this species fell drastically during the rainy season. Erythrocebus patas, however, remained abundant in both seasons.
This drop might reflect seasonal migrations or variations in habitat use. Furthermore, seasonal variations suggest that environmental conditions are favorable for certain species’ survival. Several authors have demonstrated that the variability in abundance between seasons is linked to factors such as resource availability, interactions between species, and migratory behavior [39,40]. Syncerus caffer, for instance, gather around permanent water points (wetlands, marshes) in areas where the grass remains green and nutritious despite drought. These areas offer significant plant biomass, which is crucial to their survival. In the rainy season, they disperse into habitats, reducing their apparent density in specific areas [41]. This is because the rainy season favors a better distribution of resources, allowing for a more balanced distribution of individuals between species, as shown by the high Shannon diversity values and Pielou equitability in the rainy season. One possible explanation is the reduced pressure of environmental constraints, such as drought, and the reduction in suitable habitats, which can decrease some populations in times of drought [34]. The abundance of patas (Erythrocebus patas) in both seasons can be explained by the fact that patas feed on a variety of resources, such as fruit and young shoots, during the rainy season [42,43]. This dietary diversity enables them to adapt to seasonal fluctuations.
In addition to seasonal variations, our results showed a reduced abundance of terrestrial mammals in gallery forests. This trend can be attributed to the specific ecology of these ecosystems, which harbor mainly forest species adapted to humid and stable environments [44,45]. In contrast, savannas were populated by generalist species that are capable of thriving in diverse environmental conditions and utilizing a wide range of resources, making them more resilient to changes in their environment and increasing their relative abundance [46]. Another possible explanation is seasonal flooding, which disrupts access to food resources and shelters, particularly in small-sized mammals [47]. However, it is important to note that our findings are based on a limited number of cameras installed in gallery forests (only 2 out of a total of 36).
Our results show no correlation between distance to water and richness or abundance. This likely reflects the mobility and generalist behavior of the recorded species, the widespread availability of temporary water sources during the rainy season, and the placement of cameras along established animal trails. In addition, flooding in gallery forests and possible human activity near permanent water points may have reduced the anticipated attraction to these areas. Overall, water was probably not a limiting resource at the spatial scale considered, which weakened its influence on richness and abundance.
We found a clear seasonal variation in the spatial distribution of mammal species across different habitat types. In the dry season, a centralized distribution pattern was observed, with Erythrocebus patas emerging as the dominant species. In contrast, the rainy season exhibited a more widespread distribution, with Tragelaphus scriptus being the most abundant species. This seasonal shift in species distribution could be driven by the spatial dynamics of resource availability. In the dry season, the concentration of limited resources, particularly water, creates localized hotspots that attract wildlife [48,49]. The predominance of E. patas during this period may be attributed to its behavioral adaptations, including an expanded daily movement range that enhances its ability to track and exploit scattered resources. Conversely, the rainy season provides more uniformly distributed resources across habitat types, facilitating broader species dispersal.
We hypothesized that the Moran index would decrease with mammal body size, supporting the idea that spatial distribution is more aggregative in smaller mammals than in large ones. Contrary to our expectations, our results showed that the tendency for dispersion varied according to size and season. Small mammals tended to be more dispersed than medium-sized and large ones in the rainy season, whereas medium-sized and large mammals exhibited greater dispersion during the dry season. This finding may be related to small mammals’ adoption of opportunistic feeding behavior, which enables them to be more widely distributed during the rainy season [50]. On the other hand, the greater dispersion observed in the dry season among medium-sized and large mammals could be related to the scarcity of resources, which forces dispersion over larger areas, while smaller mammals concentrate in residual microhabitats [49,51].
The findings must be interpreted in light of the study’s limitations. First, the limited number of camera traps, including the deployment of only two cameras in the gallery forests, likely reduced detections in this habitat type. This constraint was due to accessibility issues and flooding, which affected the spatial coverage and representativeness of gallery forest data. Second, cameras were placed along trails frequently used by mammals, which, while practical and supported by field surveys, may have introduced bias by reducing randomness and preferentially capturing medium and large-bodied species that use these trails more regularly. Consequently, smaller or less trail-associated species may have been underrepresented. This bias could be reduced in future surveys by diversifying camera placement. For example, additional cameras could be placed at ground level, along microhabitats used by small mammals, and in areas with dense vegetation or lower visibility. These limitations highlight the need for more extensive and randomized sampling in future research to better capture the full diversity and spatial distribution of terrestrial mammals across all habitat types in the Pénéssoulou Classified Forest.
The results of this study have important implications for wildlife management and conservation in the Pénéssoulou Classified Forest. Seasonal variations in species richness and abundance highlight the need for targeted conservation efforts that account for seasonal resource availability, especially during the rainy season, when mammal diversity peaks. Managers can optimize the timing of surveys and monitoring programs accordingly to capture a more complete picture. The lower species richness and abundance detected in gallery forests, along with the limited number of cameras placed there, underline the importance of improving sampling efforts in this habitat to inform habitat-specific management. The strong influence of vegetation types on mammal abundance suggests that conserving and restoring diverse habitat mosaics, such as woodlands, dense forests, and savannas, are critical for maintaining wildlife diversity. Additionally, acknowledging that trail-based camera placement biases detection toward medium- and large-bodied species can guide managers to complement trail surveys with off-trail or randomized camera placement to monitor smaller and less-detected species. The spatial distribution patterns of key species can be used to identify critical habitat types and corridors for protection or restoration. Lastly, these data provide a baseline for future monitoring and offer insights that are valuable for evaluating the impacts of human activities and environmental changes on mammal populations, supporting adaptive management practices. These findings contribute a scientifically robust foundation for informing conservation policies and management interventions that enhance biodiversity conservation success in this important forest ecosystem.
5. Conclusions
This study advances our understanding of the local dynamics of terrestrial mammal diversity, abundance, and spatial distribution. It confirms the strong influence of seasonality on species diversity, with the rainy season exhibiting higher diversity driven by more favorable environmental conditions, such as abundant food, water, and vegetation cover. While overall mammal abundance shows marginal seasonal variation, pronounced differences among species likely reflect resource availability, shaping their activity patterns. The lack of significant spatial distribution differences by body mass, coupled with observed seasonal shifts in dispersal, suggests that environmental constraints and food resource availability primarily influence spatial patterns. The findings highlight the necessity of incorporating seasonal and habitat-specific factors into wildlife management and conservation strategies. Spot sampling—especially during the dry season—risks underestimating species presence, highlighting the need for increased monitoring efforts and complementary methods for comprehensive inventories. Management should prioritize habitat mosaics, including woodlands, dense forests, and savannas, and safeguard critical water points to support species during resource-scarce periods. Establishing long-term monitoring programs that integrate seasonal variation and habitat diversity is essential to ensure sustainable conservation of terrestrial mammals and overall biodiversity in the Pénéssoulou Classified Forest. This evidence-based approach supports adaptive strategies that reflect ecological realities, ultimately fostering improved biodiversity preservation and ecosystem resilience.
Supplementary Materials
The following supporting information can be downloaded at https://www.mdpi.com/article/10.3390/wild3010002/s1, Table S1: Recorded observations (detections by camera and species richness) by season; Table S2: List of recorded mammal species with their corresponding families and orders.
Author Contributions
Conceptualization, D.T.D.A., C.A.M.S.D., G.N., F.A. and M.H.; methodology, C.A.M.S.D., G.N., F.A. and M.H.; software, D.T.D.A.; validation, D.T.D.A., C.A.M.S.D. and M.H.; formal analysis, D.T.D.A.; investigation, D.T.D.A.; resources, D.T.D.A.; data curation, D.T.D.A.; writing—original draft preparation, D.T.D.A.; writing—review and editing, C.A.M.S.D., G.N., F.A. and M.H.; visualization, D.T.D.A.; supervision, C.A.M.S.D.; project administration, C.A.M.S.D.; funding acquisition, D.T.D.A. All authors have read and agreed to the published version of the manuscript.
Funding
This research received no external funding.
Institutional Review Board Statement
Not applicable.
Informed Consent Statement
Not applicable.
Data Availability Statement
The data presented in this study are available upon request from the corresponding author.
Acknowledgments
The authors gratefully acknowledge the local forest administration for facilitating field data collection. We also thank Stanislas OUSSOUKPEVI for his valuable assistance with field data collection and Rodrigue BALAGUEMAN for his help with data analysis. During the preparation of this study, camera traps were used to monitor mammal populations, observe natural behavior, and estimate population size. The authors reviewed and edited all outputs and take full responsibility for the content of this publication.
Conflicts of Interest
The authors declare no conflicts of interest.
Abbreviations
The following abbreviations are used in this manuscript:
| Dr | Doctor |
| VIF | Variance Inflation Factor |
| GLM | Generalized Linear Model |
| WL | Woodland |
| DF | Dense forest (dry woodland) |
| GF | Gallery forest |
| CFM | Crop–field mosaic |
| TSS | Tree and shrub savanna |
| DFWP | Distance from water points |
| β | Model coefficient |
| se | Standard error |
| z | Statistic |
| p | Likelihood of significance |
| OR | Observed richness |
| E | Equitability |
| H′ | Shannon diversity index |
| H′max | Maximum value of H′ |
| D | Simpson’s unbiased diversity index |
| AIC | Akaike Information Criterion |
Appendix A
Table A1.
Overview of habitat types.
Table A1.
Overview of habitat types.
| Types of Habitat | Description |
|---|---|
| Tree and Shrub Savanna | This habitat is largely associated with the Sudanian vegetation zone. It comprises savanna woodland and tree and shrub savanna dominated by Isoberlinia species. The tree layer in savanna woodland is 8–15 m tall with 40–80% cover. Common species in savanna land include Isoberlinia doka, Isoberlinia tomentosa, Anogeissus leiocarpa, Pterocarpus erinaceus, Vitellaria paradoxa, Burkea africana, Prosopis africana, Pericopsis laxiflora, and Afzelia africana. Shrub savannas (undifferentiated Sudanian woodland) have sparse tree cover (<20%) or no tree cover, with species like Anogeissus leiocarpa, Vitellaria paradoxa, Pterocarpus erinaceus, Lannea acida, Burkea africana, Combretum species, Balanites aegyptiaca, and Acacia species. Soils are mostly ferruginous. |
| Gallery Forest | Gallery forests are riparian forests along rivers. Species commonly found in gallery forests include Berlinia grandiflora, Cola laurifolia, Parinari congensis, Cynometra megalophylla, and Uapaca togoensis. They occur as belts along watercourses within the Sudanian plains and transition zones. These forest types are influenced by soil moisture and climate and harbor species linked to both Guineo-Congolian and Sudanian chorological affinities. |
| Woodland | Woodlands are part of the Sudanian zone in central and northern Benin. They are dominated by Isoberlinia species and associated hardwoods. Organic structure includes a tree layer 8–15 m high. Important species include Isoberlinia doka, Isoberlinia tomentosa, Pterocarpus erinaceus, Burkea africana, and Afzelia africana. Soils tend to be ferruginous, with a unimodal rainfall regime. |
| Dry Woodland or Dense Forest | A drier type of semi-deciduous forest found mainly in central–western Benin (Bassila district). Characterized by the absence of Triplochiton scleroxylon and the presence of Khaya grandifoliola and Aubrevillea kerstingii. Soils are ferrallitic with concretions. Rainfall is unimodal (1200–1300 mm). Species composition demonstrates a transition from humid Guineo-Congolian towards drier Sudanian elements. |
| Farms and Fallows | Agricultural land dominates large portions of the Dahomey Gap, where original vegetation has been heavily reduced. The lowland vegetation of the Gap is a mosaic with farms, fallows, and grasslands intermixed with small forest islands. Natural vegetation patches include semi-deciduous and swamp forests. Farming and shifting agriculture have replaced much of the original forest and savanna habitats. Farms and fallows are dominated by two species: Vitellaria paradoxa and Parkia biglobosa. |
References
- Manyangadze, T.; Chimbari, M.J.; Rubaba, O.; Soko, W.; Mukaratirwa, S. Spatial and seasonal distribution of Bulinus globosus and Biomphalaria pfeifferi in Ingwavuma, uMkhanyakude district, KwaZulu-Natal, South Africa: Implications for schistosomiasis transmission at micro-geographical scale. Parasites Vectors 2021, 14, 222. [Google Scholar] [CrossRef]
- Selier, J.; Slotow, R.; Di Minin, E. Large mammal distribution in a Transfrontier Landscape: Trade-offs between resource availability and human disturbance. Biotropica 2015, 47, 389–397. [Google Scholar] [CrossRef]
- Loiseau, N.; Mouquet, N.; Casajus, N.; Grenié, M.; Guéguen, M.; Maitner, B.; Mouillot, D.; Ostling, A.; Renaud, J.; Tucker, C. Global distribution and conservation status of ecologically rare mammal and bird species. Nat. Commun. 2020, 11, 5071. [Google Scholar] [CrossRef] [PubMed]
- Pacifici, M.; Rondinini, C.; Rhodes, J.R.; Burbidge, A.A.; Cristiano, A.; Watson, J.E.M.; Woinarski, J.C.Z.; Di Marco, M. Global correlates of range contractions and expansions in terrestrial mammals. Nat. Commun. 2020, 11, 2840. [Google Scholar] [CrossRef] [PubMed]
- Rovero, F.; Kays, R. Camera trapping for conservation. In Conservation Technology; Wich, S.A., Piel, A.K., Eds.; Oxford University Press: Oxford, UK, 2021; pp. 79–101. [Google Scholar]
- Minton, G.; Collins, T.; Findlay, K.; Ersts, P.; Rosenbaum, H.; Berggren, P.; Baldwin, R. Seasonal distribution, abundance, habitat use and population identity of humpback whales in Oman. J. Cetacean Res. Manag. 2020, 22, 185–198. [Google Scholar] [CrossRef]
- Fisher, J.T.; Anholt, B.; Volpe, J.P. Body mass explains characteristic scales of habitat selection in terrestrial mammals. Ecol. Evol. 2011, 1, 517–528. [Google Scholar] [CrossRef]
- Hopcraft, J.G.C.; Anderson, T.M.; Pérez-Vila, S.; Mayemba, E.; Olff, H. Body size and the division of niche space: Food and predation differentially shape the distribution of Serengeti grazers. J. Anim. Ecol. 2012, 81, 201–213. [Google Scholar] [CrossRef]
- Yaworsky, P.M.; Hussain, S.T.; Riede, F. Climate-driven habitat shifts of high-ranked prey species structure Late Upper Paleolithic hunting. Sci. Rep. 2023, 13, 4238. [Google Scholar] [CrossRef]
- Bergstrom, B.J.; Scruggs, S.B.; Vieira, E.M. Tropical savanna small mammals respond to loss of cover following disturbance: A global review of field studies. Front. Ecol. Evol. 2023, 11, 1017361. [Google Scholar] [CrossRef]
- Bergstrom, B.J.; Dickman, C.R.; Monadjem, A.; Vieira, E.M. Drivers of small-mammal community structure in tropical savannas. Front. Ecol. Evol. 2023, 11, 1173638. [Google Scholar] [CrossRef]
- Raven, P.H.; Gereau, R.E.; Phillipson, P.B.; Chatelain, C.; Jenkins, C.N. The distribution of biodiversity richness in the tropics. Sci. Adv. 2020, 6, eabc6228. [Google Scholar] [CrossRef]
- Adomou, A.C. Vegetation Patterns and Environmental Gradients in Benin: Implications for Biogeography and Conservation. Ph.D. Thesis, Wageningen University, Wageningen, The Netherlands, 2005. [Google Scholar]
- Dossa, L.O.S.N.; Dassou, G.H.; Adomou, A.C.; Ahononga, F.C.; Biaou, S. Dynamique spatio-temporelle et vulnérabilité des unités d’occupation du sol de la Forêt Classée de Pénéssoulou de 1995 à 2015 (Bénin, Afrique de l’Ouest). Sci. Vie Terre Agron. 2021, 9, 55–63. [Google Scholar]
- Djagoun, C.A.; Zanvo, S.; Azihou, F.; Nago, G.; Djagoun, J.; Vodouhê, F.; Djossa, B.; Assogbadjo, A.E.; Leprieur, F.; Sinsin, B.; et al. Assessing the impact of the wildlife trade in West Africa (Benin): Functional diversity matters too. Glob. Ecol. Conserv. 2023, 47, e02630. [Google Scholar] [CrossRef]
- ENETWILD-Consortium; Guerrasio, T.; Blanco-Aguiar, J.A.; Casaer, J.; Palencia, P.; Acevedo, P.; Jansen, P.; Rowcliffe, M.; Guerrasio, T.; Scandura, M.; et al. Report of the ENETWILD training “Second online course on the use of camera trapping for monitoring wildlife and density estimation in the framework of the European Observatory of Wildlife-EOW”. EFSA Support. Publ. 2022, 19, 7708E. [Google Scholar] [CrossRef]
- Burton, A.C.; Neilson, E.; Moreira, D.; Ladle, A.; Steenweg, R.; Fisher, J.T.; Bayne, E.; Boutin, S. Wildlife camera trapping: A review and recommendations for linking surveys to ecological processes. J. Appl. Ecol. 2015, 52, 675–685. [Google Scholar] [CrossRef]
- Bernard, H.; Baking, E.L.; Giordano, A.J.; Wearn, O.R.; Ahmad, A.H. Terrestrial mammal species richness and composition in three small forest patches within an oil palm landscape in Sabah, Malaysian Borneo. Mammal Study 2014, 39, 141–154. [Google Scholar] [CrossRef]
- Mohamed, A.; Sollmann, R.; Bernard, H.; Ambu, L.N.; Lagan, P.; Mannan, S.; Hofer, H.; Wilting, A. Density and habitat use of the leopard cat (Prionailurus bengalensis) in three commercial forest reserves in Sabah, Malaysian Borneo. J. Mammal. 2013, 94, 82–89. [Google Scholar] [CrossRef]
- Fegraus, E.H.; Lin, K.; Ahumada, J.A.; Baru, C.; Chandra, S.; Youn, C. Data acquisition and management software for camera trap data: A case study from the TEAM Network. Ecol. Inform. 2011, 6, 345–353. [Google Scholar] [CrossRef]
- Wilson, D.E.; Reeder, D.M. Mammal Species of the World: A Taxonomic and Geographic Reference; JHU Press: Baltimore, MD, USA, 2005; Volume 20, pp. 41–42. [Google Scholar] [CrossRef]
- Niedballa, J.; Sollmann, R.; Courtiol, A.; Wilting, A. camtrapR: An R package for efficient camera trap data management. Methods Ecol. Evol. 2016, 7, 1457–1462. [Google Scholar] [CrossRef]
- Jenks, K.E.; Chanteap, P.; Kanda, D.; Peter, C.; Redford, T.; Antony, J.L.; Howard, J.; Leimgruber, P. Using relative abundance indices from camera-trapping to test wildlife conservation hypotheses—An example from Khao Yai National Park, Thailand. Trop. Conserv. Sci. 2011, 4, 113–131. [Google Scholar] [CrossRef]
- Oksanen, J.; Simpson, G.; Blanchet, F.; Kindt, R.; Legendre, P.; Minchin, P.; O’Hara, R.; Solymos, P.; Stevens, M.; Szoecs, E.; et al. Vegan: Community Ecology Package, R package version 2.6-4; The Comprehensive R Archive Network: Vienna, Austria, 2022. Available online: https://CRAN.R-project.org/package=vegan (accessed on 22 August 2025).
- Shannon, C.E. A Mathematical Theory of Communication. Bell Syst. Tech. J. 1948, 27, 79–423. [Google Scholar] [CrossRef]
- Pielou, E.C. Shannon’s formula as a measure of specific diversity: Its use and misuse. Am. Nat. 1966, 100, 463–465. [Google Scholar] [CrossRef]
- Tiffeau-Mayer, A. Unbiased estimation of sampling variance for Simpson’s diversity index. Phys. Rev. E 2024, 109, 064411. [Google Scholar] [CrossRef] [PubMed]
- Paradis, E.; Schliep, K. ape 5.0: An environment for modern phylogenetics and evolutionary analyses in R. Bioinformatics 2019, 35, 526–528. [Google Scholar] [CrossRef]
- Sinsin, B.; Tehou, A.C.; Daouda, I.; Saidou, A. Abundance and species richness of larger mammals in Pendjari National Park in Benin. Mammalia 2002, 66, 369–380. [Google Scholar] [CrossRef]
- Burnham, K.P.; Anderson, D.R. Multimodel inference: Understanding AIC and BIC in model selection. Sociol. Methods Res. 2004, 33, 261–304. [Google Scholar] [CrossRef]
- Lüdecke, D.; Ben-Shachar, M.S.; Patil, I.; Waggoner, P.; Makowski, D. performance: An R package for assessment, comparison and testing of statistical models. J. Open Source Softw. 2021, 6, 3139. [Google Scholar] [CrossRef]
- Zhao, G.; Yang, H.; Xie, B.; Gong, Y.; Ge, J.; Feng, L. Spatio-temporal coexistence of sympatric mesocarnivores with a single apex carnivore in a fine-scale landscape. Glob. Ecol. Conserv. 2020, 21, e00897. [Google Scholar] [CrossRef]
- Gotelli, N.J.; Colwell, R.K. Quantifying biodiversity: Procedures and pitfalls in the measurement and comparison of species richness. Ecol. Lett. 2001, 4, 379–391. [Google Scholar] [CrossRef]
- McCarthy, B.C. Measuring biological diversity. J. Torrey Bot. Soc. 2004, 131, 277–285. [Google Scholar] [CrossRef]
- Nago, S.G.A.; Tchegnonsi, J.L.M.; Ahononga, C.F.; Sagbo, R.R.S.; Kake, G.; Ganso, R. Recolonisation de la forêt classée de Pénéssoulou par la faune mammalienne. Rev. Ivoir. Sci. Technol. 2024, 43, 260–280. [Google Scholar]
- Chao, A.; Gotelli, J.N.; Hsieh, T.C.; Shen, E.L.; Ma, K.H.; Colwell, R.K.; Ellison, A.M. Rarefaction and extrapolation with Hill numbers: A framework for sampling and estimation in species diversity studies. Ecol. Monogr. 2014, 84, 45–67. [Google Scholar] [CrossRef]
- Cardoso, P.; Rigal, F.; Carvalho, J.C. BAT—Biodiversity Assessment Tools, an R Package for the Measurement and Estimation of Alpha and Beta Taxon, Phylogenetic and Functional Diversity. Methods Ecol. Evol. 2015, 6, 232–236. [Google Scholar] [CrossRef]
- Heinen, J.T.; Dahal, S. Research priorities for the conservation of Nepal’s lesser terrestrial vertebrates. Asian J. Conserv. Biol. 2023, 12, 90–99. [Google Scholar]
- Chazdon, R.L.; Chao, A.; Colwell, R.K.; Lin, S.; Norden, N.; Letcher, S.G.; Clark, D.B.; Finegan, B.; Arroyo, J.P. A novel statistical method for classifying habitat generalists and specialists. Ecology 2011, 92, 1332–1343. [Google Scholar] [CrossRef] [PubMed]
- Wright, S.J. The future of tropical forests. Ann. N. Y. Acad. Sci. 2010, 1195, 1–27. [Google Scholar] [CrossRef]
- Bennitt, E.; Bonyongo, M.C.; Harris, S. Habitat selection by African buffalo (Syncerus caffer) in response to landscape-level fluctuations in water availability on two temporal scales. PLoS ONE 2014, 9, e101346. [Google Scholar] [CrossRef]
- Halidu, S.K.; Adebayo, O.A.; Chikezie, J.; Ibrahim, A.O.; Adedeji, O.E. Ecology of Patas Monkey (Erythrocebus patas) in buffer zone ranges, Old Oyo National Park, Nigeria. J. Bioresour. Manag. 2021, 8, 29–37. [Google Scholar] [CrossRef]
- López-Ortiz, R. Erythrocebus Patas; CAB International: Wallingford, UK, 2024. [Google Scholar] [CrossRef]
- Redford, K.H.; Gustavo, A.B.; da Fonseca, G.A. The role of gallery forests in the zoogeography of the cerrado’s non-volant mammalian fauna. Biotropica 1986, 18, 126–135. [Google Scholar] [CrossRef]
- Shilereyo, M.T.; Magige, F.J.; Ogutu, J.O.; Røskaft, E. Small-mammal abundance and species diversity: Land use and seasonal influences in the Serengeti Ecosystem, Tanzania. Front. Conserv. Sci. 2023, 4, 981424. [Google Scholar] [CrossRef]
- Teixeira-Santos, J.; Ribeiro, A.C.D.C.; Wiig, Ø.; Pinto, N.S.; Cantanhede, L.G.; Sena, L.; Mendes-Oliveira, A.C. Environmental factors influencing the abundance of four species of threatened mammals in degraded habitats in the eastern Brazilian Amazon. PLoS ONE 2020, 15, e0229459. [Google Scholar] [CrossRef]
- Palmeirim, A.F.; Santos-Filho, M.; Peres, C.A. Marked decline in forest-dependent small mammals following habitat loss and fragmentation in an Amazonian deforestation frontier. PLoS ONE 2020, 15, e0230209. [Google Scholar] [CrossRef]
- Dorigo, L.; Boscutti, F.; Sigura, M. Landscape and microhabitat features determine small mammal abundance in forest patches in agricultural landscapes. PeerJ 2021, 9, e12306. [Google Scholar] [CrossRef]
- Pineda-Cendales, S.; Hernández-Rolong, E.; Carvajal-Cogollo, J.E. Medium and large-sized mammals in dry forests of the Colombian Caribbean. Univ. Sci. 2020, 25, 435–461. [Google Scholar] [CrossRef]
- Tsegaye, E.; Mengesha, G. Diversity, relative abundance and distribution of medium and large-sized mammals in Mago National Park, southern Ethiopia. J. Sci. Incl. Dev. 2023, 2023, 68–90. [Google Scholar] [CrossRef]
- De-la-Cruz, I.M.; Castro-Campillo, A.; Zavala-Hurtado, A.; Salame-Méndez, A.; Ramírez-Pulido, J. Spatiotemporal micro-habitat heterogeneity and dispersion patterns of two small mammals in a temperate forest. BioRxiv 2018, 278390, 1–44. [Google Scholar] [CrossRef]
Disclaimer/Publisher’s Note: The statements, opinions and data contained in all publications are solely those of the individual author(s) and contributor(s) and not of MDPI and/or the editor(s). MDPI and/or the editor(s) disclaim responsibility for any injury to people or property resulting from any ideas, methods, instructions or products referred to in the content. |
© 2025 by the authors. Licensee MDPI, Basel, Switzerland. This article is an open access article distributed under the terms and conditions of the Creative Commons Attribution (CC BY) license.