Abstract
This paper introduces an innovative open-source hardware platform designed for multi-sensor environmental monitoring, rooted in the outcomes of the “Smart Water” project. The primary objective of this platform is to facilitate advanced PCB design education by offering students a modular, expandable, and feature-rich embedded hardware environment. The platform serves as a practical training ground, enabling students to experiment with diverse sensing techniques and refine their skills in the intricacies of PCB design. The “Smart Water” project, which forms the foundation of this educational platform, has yielded invaluable insights into environmental monitoring technologies. Leveraging these findings, our hardware platform integrates a variety of sensors capable of measuring crucial environmental parameters such as water quality, temperature, and atmospheric conditions. The modular design allows students to explore various sensor combinations and experiment with custom configurations, fostering a deeper understanding of sensor integration and optimization. Key features of the platform include its expandability, encouraging students to develop add-on modules for specific applications or to enhance existing functionalities. This approach not only promotes creativity but also instills a sense of ownership and collaboration among students, as they contribute to the continual evolution of the hardware platform. The feature-rich nature of the embedded system enables comprehensive experimentation in sensor data acquisition, processing, and communication, providing a holistic learning experience.
1. Introduction
In the pursuit of advancing both environmental monitoring technologies and pedagogical approaches in hardware design education, this paper introduces an open-source hardware platform specifically tailored for multi-sensor environmental monitoring applications. Rooted in the outcomes of the “Smart Water” project [1], our platform stands as a testament to the symbiotic relationship between cutting-edge research and educational innovation.
Environmental monitoring plays a pivotal role in our collective efforts to understand and address pressing ecological challenges. The need for sophisticated, yet accessible, hardware solutions is paramount to empower the next generation of engineers and scientists. The “Smart Water” project, a pioneering initiative in this domain, has provided invaluable insights into the intricacies of environmental monitoring technologies and sustainable electronic design. The “Smart Water” project leverages low-cost, open-source hardware to implement a real-time, low-power, autonomous and cost-effective platform that addresses the limitations and the shortcomings of the most common techniques used to monitor and assess water quality. For example, traditional stationary monitoring, common in hydroponics and aquaculture, lacks immediacy in action. A case in point is a Taiwanese shrimp farm utilizing oxygen measurements to trigger aeration and alarms for increased shrimp survival [2,3]. Conversely, stationary systems relying on riverbank hyperspectral imaging [4] are impractical for large aquatic bodies due to cost, energy consumption, and processing requirements.
Moving monitoring devices, like drones or autonomous surface vehicles, address some of the above limitations. However, their deployment constraints, limited operational duration, and dependence on periodic recharging or battery replacement restrict their universal applicability [5,6]. Satellite-based systems offer wide coverage but are weather-dependent and may involve significant processing challenges [7].
Underwater measurements through robotic analysis or underwater drones present alternatives for deep water monitoring [8]. However, they come with their own set of limitations, such as operational duration, power consumption, and challenges associated with real-time imaging. Motivated by the success of the “Smart Water” project, our hardware platform is designed with a dual purpose: to serve as a practical training ground for students and to contribute to the ongoing evolution of environmental monitoring capabilities. The primary focus is on creating a modular, expandable, and feature-rich embedded hardware environment that facilitates advanced PCB design education.
Open-source hardware plays a pivotal role in advancing STEM (Science, Technology, Engineering, and Mathematics) education by fostering a collaborative and accessible learning environment. Unlike proprietary hardware, open-source hardware allows students and educators to access the underlying design, modify it, and share improvements freely. This not only cultivates a culture of innovation but also democratizes access to cutting-edge technologies, making them more affordable and adaptable for educational purposes [9].
So far, most of the efforts to build open-source hardware for education either target specific applications [10], rely on off-the-shelf embedded computing boards such as Arduino or Raspberry Pi [11,12,13,14], or target 3D-printing technologies to build supporting infrastructure [15,16,17,18]. Finally, it is also worth mentioning some of the efforts to develop educational modules that target PCB design [19]. However, all of the works reported make little or no emphasis on modularity and expandability. Conversely, our platform not only addresses the educational gap in providing hands-on experience in PCB design but also pushes the boundaries of multi-sensor environmental monitoring explicitly addressing design modularity and platform expandability. By integrating a variety of sensors capable of measuring critical environmental parameters, such as water quality, temperature, and atmospheric conditions, our hardware platform serves as a versatile tool for exploration and experimentation.
The modular and open-source design of the platform is a key element: on the one hand, this approach fosters the creation of a supporting community to maintain, expand and improve the platform [20]; on the other hand, it allows students to delve into diverse sensor combinations and experiment with custom configurations. This flexibility not only fosters a deeper understanding of sensor integration and optimization but also encourages students to actively contribute to the growth of the hardware platform. This collaborative and participatory approach ensures that the platform remains relevant and adaptable to emerging technological needs.
In the subsequent sections of this paper, we delve into the technical aspects of our open-source hardware platform, detailing its key features, expandability, and the comprehensive learning experiences it provides. By intertwining the realms of education and research, we aim to present a paradigm shift in both hardware design education and environmental monitoring capabilities.
2. Design
The development of our open-source hardware platform for multi-sensor environmental monitoring is grounded in a systematic and iterative design process. The materials and methods employed in crafting this innovative educational tool are detailed below, encompassing the hardware architecture, sensor integration, and educational modules. The hardware platform is accompanied by a set of educational modules designed to guide students through the intricacies of PCB design and sensor integration. These modules cover fundamental concepts such as circuit design, signal processing, and communication protocols. Additionally, advanced modules delve into optimization techniques for sensor data acquisition and processing. Hands-on exercises are integrated into the educational modules, encouraging students to apply theoretical knowledge to practical scenarios. These exercises range from basic PCB layout and soldering techniques to advanced tasks such as firmware development and real-time data processing. The educational content is structured to cater to both novice learners and those seeking more advanced challenges.
2.1. Educational Objectives
The main goal of the open-source hardware sensing platform described in this work consists of providing students with advanced PCB layout techniques and the practical skills needed to integrate a variety of sensors for environmental and water quality monitoring. This goal can be broken into the following educational objectives:
- To develop sophisticated PCB design methodologies, encompassing optimal component placement, signal routing, and impedance matching. Through practical exercises, learners gain proficiency in high-performance layout techniques, minimizing noise and interference for accurate sensor data acquisition.
- To introduce students to a range of sensors crucial for environmental and water quality monitoring. Sensor types include those measuring water parameters such as pH, dissolved oxygen (DO), turbidity, and conductivity. Students learn the intricacies of integrating diverse sensor technologies, ensuring effective communication and data accuracy in a unified hardware environment.
- To introduce students to multi-source and eco-friendly power management techniques, encompassing both batteries and harvested energy sources. Students learn to design systems that efficiently manage power from various sources, ensuring continuous operation and optimal energy utilization for extended deployment in remote environments.
- To develop good design practices by tackling complexity through modularity. The platform’s modular architecture allows students to experiment with various sensor combinations, promoting adaptability in designing sensor nodes for specific environmental applications. The expandability feature encourages students to develop custom add-on software and hardware modules, fostering creativity and providing practical insights into the challenges of integrating diverse sensors on a single PCB.
- To develop analytical skills by simulating real-world environmental monitoring scenarios, including the effects of water quality fluctuations. This simulation aspect facilitates a deeper understanding of the challenges associated with sensor integration, layout optimization, and the impact of environmental factors on data accuracy.
- To develop social abilities and collaborative design skills. Emphasizing collaboration, the platform encourages students to contribute to its continuous improvement. The open-source nature facilitates knowledge sharing and innovation, creating a community-driven learning environment where students actively participate in refining both hardware and software components.
2.2. Hardware Architecture
The foundation of our hardware platform lies in a modular architecture, designed to be both flexible and expandable. The central processing unit is based on a microcontroller that forms the core of the embedded system. In our implementation, we utilized a low-cost ESP32-WROOM-32E microcontroller unit (Espressif Systems, Shanghai, China).
Figure 1 depicts the hardware architecture of the sensor board. The system comprises four main modules: a power management subsystem, the main microcontroller unit (MCU), the wireless communication unit, and the sensor hub.
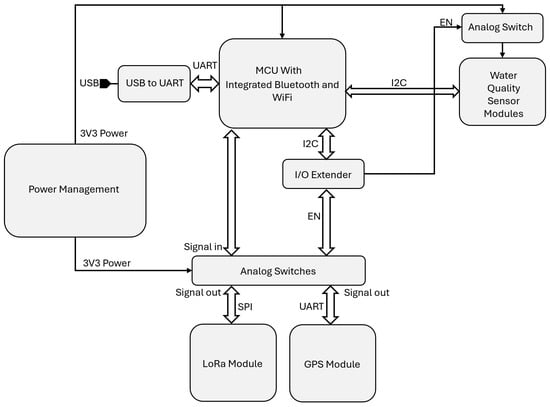
Figure 1.
Hardware architecture of the sensor board.
The architecture of the power management subsystem is depicted in Figure 2. This module relies on the MCP 73871 battery charger.
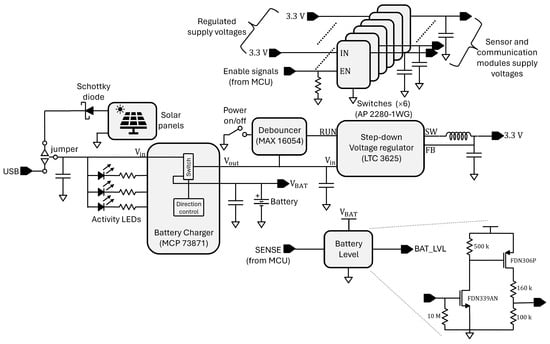
Figure 2.
Architecture of the power management subsystem.
MCP 73871 (Microchip Technology Inc., Chandler, AZ, USA) allows load sharing and battery charge management simultaneously. This means that the battery can be charged when the system is powered up; however, load has priority over battery charge. This chip is particularly appealing for those applications where multiple power sources must be managed. The system has the capability to harvest photovoltaic energy through an array of small solar panels. Nonetheless, the output voltage and current of the solar panels vary constantly, depending on the available sunlight. This may cause instability of the battery charger unit if the current drawn from the panel is not enough to keep a stable output voltage. This situation can be managed by using the Voltage Proportional Charge Control (VPCC) feature of the MCP 73871. If the voltage on the Vin pin drops to a preset value determined by the threshold established at the VPCC input due to a limited amount of input current or input source impedance, the battery charging current is reduced. If possible, further demand from the system is supported by the battery.
To enable this feature, the VPCC input of the battery charger must be set at least to 1.23 V. The input voltage VVPCC at the VPCC pin is generated with a simple voltage divider, as depicted in Figure 3.
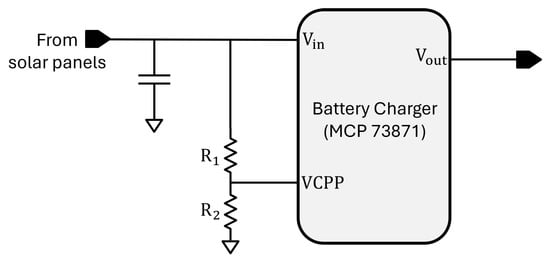
Figure 3.
Configuration of the VPCC input of the battery charger.
The MCP 73871 chip is configured so that the system will draw its supply from the solar panels if they provide enough current; otherwise, the battery is responsible for powering up the entire system. The nominal battery charge voltage is 4.2 V, and the input supply threshold Vin that must activate the VPCC pin was set to 4.5 V; namely, slightly above the battery charge voltage. Hence, setting R2 = 100 kΩ in Equation (1), leads to R1 = 370 kΩ.
In addition, as depicted in Figure 2, a Schottky diode ensures further protection from voltage drops at the output of the solar panels by preventing the capacitor at the input of the battery charger from draining back into the panels, and ensuring a very low voltage drop when operating in forward bias.
MCP 73871 does not provide voltage regulation; this is accomplished by using an LTC 3625 step-down regulator that supplies a stable output at 3.3 V and an output current up to 2 A. The power supplied by the regulator is delivered to the sensor and communication modules through an array of switches (AP 2280-1WG by Diodes Incorporated, Plano, AZ, USA) that can be controlled by the embedded software running on the MCU. This allows to selectively switch on each one of the supported modules only when it is required by the application enabling low-power operation.
Finally, the power management system also provides a simple battery level detector circuit powered by the voltage VBAT output by the battery. The sensing operation is triggered by the MCU unit. The PMOS pull-up transistor (FDN306P by onsemi, Scottsdale, AZ, USA) acts as a switch to connect a voltage divider across the battery. When activated, the voltage divider provides an analog output voltage proportional to the battery level, ranging from approximately 1.7 V (fully charged) to 1.1 V (depleted). The analog output voltage is then fed into the 12-bit ADC (Analog to Digital Converter) of the MCU to be converted into a digital value managed by the embedded firmware.
Figure 4, depicts the architecture of the microcontroller unit and the supporting ancillary circuits.
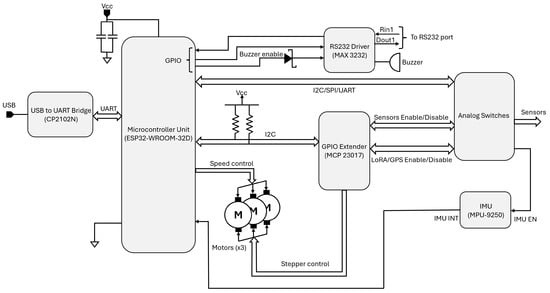
Figure 4.
The microcontroller unit and the supporting circuits.
The target application requires more I/O ports than those provided by the ESP32 microcontroller unit; for that reason, a GPIO (General Purpose I/O) extender (MCP 23017 by Microchip Technology Inc., Chandler, AZ, USA) is used to extend the number of available ports up to 50. The GPIO extender is controlled by the MCU through an I2C bus.
The system also integrates an MPU-9250 (TDK InvenSense, San Jose, CA, USA) Inertial Measurement Unit (IMU). This compact nine-axis motion sensor combines a three-axis accelerometer, gyroscope, and magnetometer that allows the system to accurately capture orientation, acceleration, and magnetic field data. The IMU monitors the robot’s inclination and movement and signals the MCU in case of flipping, tilting or drifting to ensure the robot stays stable on the water.
The system supports several communication protocols: USB, UART (through GPIO) and I2C.
USB is used only to program and debug the ESP32 microcontroller. USB differential signaling is converted into a UART protocol using a CP 2102 bridge (Silicon Labs, Austin, TX, USA). Additionally, an RS232 line driver based on MAX 3232 (Analog Devices, Wilmington, NC, USA) is present on board.
The PCB can be extended by means of peripheral modules. The system supports wireless communication through an external breakout board that embeds a LoRa (Long Range Communication) and a GPS module. The PCB is providing six 4-pin-JST connectors for extension purposes. These extension connectors have been used for several use-cases. An interesting use-case that has been implemented as a bachelor thesis, comprises the use of the extension possibilities for the control of three Thruster motors, which are attached to a 3D printed submarine that carries three I2C sensors for water quality measurements. The connectors offer PWM and direction pins to control the required external H-bridge motor drivers and electronic speed controllers. This modular approach allows students to explore diverse sensor and actuator combinations and expand the platform’s capabilities by developing custom add-on modules and embedded firmware.
Figure 5 depicts the final result of a Bachelor’s thesis based on the hardware platform used as part of a Submarine with I2C-based water quality sensors and three Thruster motors.
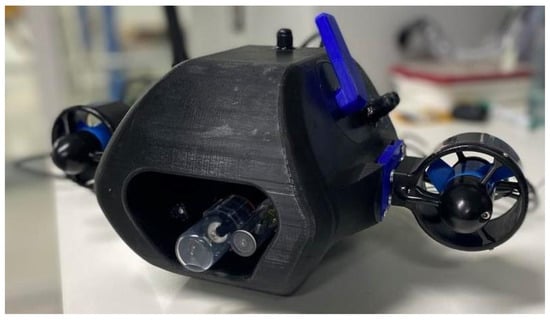
Figure 5.
Submarine with I2C-based water quality sensors and three Thruster motors. Two at the side and one at the rear (not visible in the photo).
2.3. Sensor Integration
Figure 6 depicts the architecture of the sensor interface. The system supports an array of up to five sensors over two digital I2C isolated channels and three analog channels.
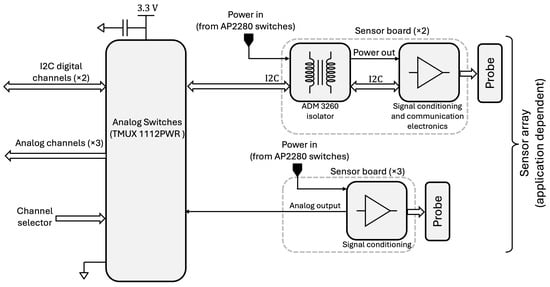
Figure 6.
The sensor interface.
The sensor interface has been designed to guarantee signal integrity by isolating the sensor boards from external interference. In the initial version of the board, isolation was not implemented, which led to a significant problem as almost all sensor readings were incorrect due to electrical interference and cross-talk on the shared I2C bus. To solve this issue, additional switches (TMUX 1112PWR by Texas Instruments, Dallas, TX, USA) were added to disable some lines, reduce traffic congestion, and offer electrical isolation to prevent leakage.
In addition, the system also supports sensors with a very weak output (that could be easily disrupted by the noise injected by other parts of the system) by providing galvanic isolation using ADM 3260 isolator ICs (Analog Devices, Norwood, MA, USA).
The heart of our hardware platform lies in the integration of a diverse array of sensors, each catering to specific environmental parameters. The selection of sensors was based on the insights garnered from the “Smart Water” project, emphasizing the critical measurements of water quality, temperature, and atmospheric conditions.
To ensure seamless integration, each sensor module includes standardized interfaces and protocols. Our platform supports multiple sensors such as temperature, dissolved oxygen, conductivity, water turbidity and pH sensors, providing a comprehensive toolkit for environmental monitoring. The modular design facilitates easy replacement and experimentation, allowing students to gain hands-on experience with different sensing technologies.
2.4. Validation and Testing
The hardware platform underwent rigorous validation and testing phases to ensure its reliability and functionality. Validation included extensive testing of sensor accuracy, communication interfaces, and the expandability of the platform. Real-world scenarios, inspired by the environmental monitoring challenges addressed in the “Smart Water” project, were simulated to evaluate the platform’s performance in diverse conditions.
Student feedback and engagement were also crucial in refining the hardware platform. Iterative testing sessions were conducted within educational settings to gather insights into the platform’s usability, educational effectiveness, and potential areas for improvement.
2.5. Open-Source Education Model
To foster collaboration and knowledge sharing, the hardware platform is accompanied by comprehensive open-source documentation. This documentation includes detailed hardware specifications, schematics, firmware source code, and educational materials. The open-source nature of the project ensures accessibility and encourages contributions from the community, promoting continuous improvement and innovation. Implementing an educational model based on open-source hardware offers a transformative approach [21,22] to teaching and learning in engineering and technology disciplines. The core philosophy of open-source hardware in education is grounded in accessibility, collaboration, and innovation. By adopting open-source platforms, students gain hands-on experience with real-world technologies, fostering a practical understanding of hardware design principles. The teaching model encourages active participation, enabling students to engage directly with the hardware, modify designs, and contribute improvements.
In this model, the emphasis is not only on theoretical concepts but also on collaborative problem-solving. Open-source hardware facilitates knowledge-sharing among students, educators, and the wider community. Students benefit from a collective pool of resources, including documentation, code, and design files, enhancing their learning experience. Moreover, the model promotes a culture of innovation, as students are encouraged to build upon existing projects, create custom add-ons, and propose enhancements, leading to a continuous cycle of improvement. The students could rely on the existing hardware designs and embedded software code for inspiration and to improve their understanding of complex embedded electronic systems.
The collaborative and transparent nature of open-source hardware aligns with the principles of open education. Students not only gain technical skills but also develop critical thinking, adaptability, and a sense of community within the field.
3. Build Instructions
The design is cost-driven; thus, all the electronics have been laid out on a standard two-layer FR4 PCB board with a 105 mm diameter. For convenience, almost all the components are placed on the front layer. Conversely, the buzzer and the reed switch are placed on the back layer of the PCB.
Figure 7 shows the PCB layouts of both the main board and the sensor isolation board. The design is modular and each nodule has been implemented in a different design file.

Figure 7.
PCB layouts: (a) main board, and (b) sensor isolation board.
Table 1 summarizes the different parts of the designed board along with the schematic design files where those parts have been implemented. A complete component list is provided in Table 2.

Table 1.
PCB modules and design files.

Table 2.
Bill of materials.
The PCBs have been divided into five regions:
- The computing module that relies on the low-cost ESP32-WROOM microcontroller. This module comes with out-of-the-box Bluetooth and Wi-Fi interfaces and a variety of peripherals. However, this microcontroller provides only 34 of the 50 I/O ports needed to support the target monitoring applications. For this reason, the design also includes an MCP23017 I/O expander by Microchip, which provides 16 additional I/O ports controlled over the I2C bus.
- The sensor module is split across two boards: the main board and the isolated sensor board. The former integrates onboard sensors, such as the MPU-9250 IMU for motion and orientation sensing, while the latter accepts up to five external sensors via JST connectors. Four of these sensors (pH, temperature, electrical conductivity and dissolved oxygen) communicate over the I2C bus using four-pin connectors (power, ground, SCL, SDA), while the fifth sensor (turbidity) provides an analog output via a 3-pin JST connector.
- The communication module is hosted on a breakout board mounted at the center of the main PCB. The design supports an RFM95W LoRa breakout based on the Semtech SX1276 radio. In addition to the LoRa module, the system provides Bluetooth for sensor calibration, instantaneous measurements, and network tests, and Wi-Fi for Firmware-Over-The-Air (FOTA) updates.
- The power distribution module controls the external power supply (USB power, battery charge/supply, and solar panels) and distributes regulated power to the MCU, sensors, and communication module. Each sensor can be powered independently.
- The auxiliary component module includes a USB-to-UART interface (Silicon Labs CP2102) for MCU programming and debugging, and an RS-232 line driver based on a MAX3232 chip.
External modules and breakout boards can be connected to the main PCB through several connectors. Table 3 shows a list of the most relevant PCB connector and their functionality [1].

Table 3.
List and functionality of relevant PCB connectors.
The setup described in this work comprises the sensors reported in Table 4 along with their main characteristics. pH, temperature, Electrical Conductivity (EC) and Dissolved Oxygen (DO) were manufactured by Atlas-Scientific, a company specializing in water monitoring and environmental robotics. The turbidity sensor was manufactured by DFRobot [1].

Table 4.
Sensor characteristics.
The PT-1000 temperature sensor is not a standalone device but comes embedded in the ENV-50-PH sensor probe.
4. Operating Instructions
The following instructions outline the key steps for powering, connecting, and maintaining the device to ensure optimal operation. For an overview of the board layout and its components, refer to Figure 7.
- Powering the device:The device supports multiple power input methods:
- USB: Operates at a standard voltage of 5 V, internally regulated to supply stable power to the board components.
- Battery: The device is compatible with standard Li-ion/LiPo batteries, supporting a voltage range from 3.7 V (nominal) to 4.2 V (fully charged). Charging and management are handled by the MCP73871 chip.
- Solar Panel: The device supports small photovoltaic panels and manages fluctuating input voltage and current through Voltage Proportional Charge Control (VPCC). It requires a minimum input voltage of 4.5 V to activate VPCC for stable charging.
- Sensors:The board is compatible with 3.3 V sensors. Connect the sensors to the appropriate connectors based on their type:
- I2C Sensors (pH, temperature, electrical conductivity, dissolved oxygen): Use the 4-pin JST connectors (K10, K11, K13, K17).
- Turbidity Sensor: Use the 3-pin JST connector (K12).
Make sure that all sensors are firmly connected and that their pins are properly aligned to avoid any miscommunication or damage. - Using the Communication Module:Insert the LoRa (MOD1) and GPS (MOD2) breakout boards into their designated slots. Use Bluetooth for sensor calibration, network tests, and real-time measurements.
- Programming and Debugging:Connect the USB to a computer to program the ESP32 MCU. Use the typical ESP32 development environment, such as PlatformIO or Arduino IDE, to write and upload the code. Debug using the RS232 line driver via the MAX3232 chip, if needed.
- Interfacing with External Devices:The board can connect to various external devices through its dedicated connectors. Table 3 shows the specific functions of each connector.
- Sensor Calibration:Use the Bluetooth interface to calibrate the sensors. Use any general serial communication app to connect to the sensor board using the Bluetooth interface. Switch off the robot and switch it back on to set the robot in calibration mode for 30 s. During this period the robot will listen to connection requests. Once connected, the robot will start the calibration procedure and send a text with the operations to perform. During the calibration of the sensors, calibration liquids are required.
- Testing and Deployment:Verify all connections and functionality before deploying the system. If using the turbidity sensor, make sure it is oriented correctly and keep it out of harsh environments that are outside of its designated range. Ensure that the solar panels are positioned to receive the most sunlight possible for long-term use.
- Maintenance:Regularly inspect connections for wear or corrosion. Update the firmware periodically via Wi-Fi using Firmware-Over-The-Air (FOTA) updates. Check the sensors for bio-fouling and check the membranes of the sensors at least every 3 months. Clean the sensors with clear water and replace the membranes if broken or if the readings of the sensor are not becoming stable during the calibration procedure.
5. Validation Instructions
The designed board is supposed to power robots for environmental monitoring applications. Since deploying, retrieving and maintaining a robot is a time-consuming operation, the system has been designed with low-power operation in mind and has been stressed in real scenarios to determine the battery lifetime and the elapsed time between two consecutive maintenance cycles.
The system’s average power consumption is determined by the energy used during both active (wake-up) and deep sleep phases. Let Pwu be the average power consumed during the wake-up phase of duration twu, and Pdsleep the average power consumed during deep sleep over duration tdsleep. The total cycle time is:
The average power consumption Pavg over a full operation cycle is then:
Accordingly, the estimated battery lifetime L(t) in hours can be expressed as:
Here, Cbat is the battery capacity (in Wh), and SFbat is a safety factor accounting for battery inefficiencies or degradation. The asymmetric duty cycle (22 s wake-up, 578 s sleep) is captured in the time-weighted power model, yielding a realistic estimate of device lifetime.
The system power consumption in both wake-up and sleep states has been measured with Nordic Semiconductor Power Profiler Kit II (PPK). The PPK can measure currents ranging from 200 nA to 1 A. Several measurements (with sampling rates ranging from 1 Hz to 10 kHz) were carried out to evaluate the system’s typical power consumption.
To demonstrate system operations and estimate its performance, an embedded software described in the sequel has been designed to stress all the functionalities. As in many power-constrained IoT applications, data is acquired periodically and sent to a gateway or other node for further processing. The rest of the time, the whole system enters in deep sleep mode to save energy and extend battery lifetime. Thus, a periodic traffic pattern that goes through four different states is implemented:
- System wake-up;
- Sensors are enabled and measurements performed;
- Collected data is transmitted using LoRa module;
- System disconnects and returns to deep sleep.
Listing 1 shows the pseudo-code of the software routine that performs the required measurements at system wake up. Sensors are activated sequentially and as soon as the necessary data has been collected, it is sent to a remote server through the LoRa radio.
During each 10 min cycle, the board wakes up for about 22 s to read sensors, process data and transmit results. It then goes back to deep sleep for the remaining 578 s and stays there until the next cycle begins.
| Listing 1. Water quality monitoring wakeup routine. | |
| 1 | void WakeupRoutine () { |
| 2 | // Activate pH and Temperature sensors |
| 3 | ActivateSensor ("pH"); |
| 4 | ActivateSensor ("Temperature"); |
| 5 | |
| 6 | // Wait for system setup delay |
| 7 | Wait (SystemSetupDelay); |
| 8 | |
| 9 | // Begin data acquisition from Temperature and pH sensors |
| 10 | float TemperatureSample = ReadSensor ("Temperature"); |
| 11 | |
| 12 | // Loop to perform 10 pH reads with necessary delay |
| 13 | float pHSample [10]; |
| 14 | for (int i = 0; i < 10; i++) { |
| 15 | pHSample [i] = ReadSensor ("pH"); |
| 16 | Wait (DataAcquisitionDelay); |
| 17 | } |
| 18 | |
| 19 | // Disable pH and Temperature sensors |
| 20 | DeactivateSensor ("pH"); |
| 21 | DeactivateSensor ("Temperature"); |
| 22 | |
| 23 | // Activate DO and EC sensors |
| 24 | ActivateSensor ("DO"); |
| 25 | ActivateSensor ("EC"); |
| 26 | |
| 27 | // Begin data acquisition from DO sensor |
| 28 | float DOSample [5]; |
| 29 | for (int i = 0; i < 5; i++) { |
| 30 | DOSample [i] = ReadSensor ("DO"); |
| 31 | Wait (DataAcquisitionDelay); |
| 32 | } |
| 33 | |
| 34 | // Begin data acquisition from EC sensor |
| 35 | float ECSample [5]; |
| 36 | for (int i = 0; i < 5; i++) { |
| 37 | ECSample [i] = ReadSensor ("EC"); |
| 38 | Wait (DataAcquisitionDelay); |
| 39 | } |
| 40 | |
| 41 | // Disable DO and EC sensors |
| 42 | DeactivateSensor ("DO"); |
| 43 | DeactivateSensor ("EC"); |
| 44 | |
| 45 | // Activate Turbidity sensor |
| 46 | ActivateSensor ("Turbidity"); |
| 47 | |
| 48 | // Wait for necessary delay for turbidity data acquisition |
| 49 | Wait (TurbiditySetupDelay); |
| 50 | |
| 51 | // Get Turbidity data |
| 52 | float TurbiditySample = ReadSensor ("Turbidity"); |
| 53 | |
| 54 | // Turn off Turbidity sensor |
| 55 | DeactivateSensor ("Turbidity"); |
| 56 | } |
| 57 | |
| 58 | // Function to activate a sensor |
| 59 | void ActivateSensor (char∗ sensor) { |
| 60 | // Implementation to activate sensor |
| 61 | } |
| 62 | |
| 63 | // Function to deactivate a sensor |
| 64 | void DeactivateSensor (char∗ sensor) { |
| 65 | // Implementation to deactivate sensor |
| 66 | } |
| 67 | |
| 68 | // Function to read data from a sensor |
| 69 | float ReadSensor (char∗ sensor , PORT_ADDR) { |
| 70 | // Implementation to read data from sensor |
| 71 | float sensorData = 0.0; |
| 72 | switch (sensor) { |
| 73 | case TEMPERATURE : |
| 74 | sensorData = ReadTemperatureSensor (PORT_ADDR); |
| 75 | break; |
| 76 | case PH: |
| 77 | sensorData = ReadPHSensor (PORT_ADDR); |
| 78 | break; |
| 79 | case DO: |
| 80 | sensorData = ReadDOSensor (PORT_ADDR); |
| 81 | break; |
| 82 | case EC: |
| 83 | sensorData = ReadECSensor (PORT_ADDR); |
| 84 | break; |
| 85 | case TURBIDITY: |
| 86 | sensorData = ReadTurbiditySensor (PORT_ADDR); |
| 87 | break; |
| 88 | default: |
| 89 | // error : unsupported sensor |
| 90 | break; |
| 91 | } |
| 92 | return sensorData; |
| 93 | } |
| 94 | |
| 95 | // Function to wait for a specified delay |
| 96 | void Wait (int delayTime) { |
| 97 | // Implementation to wait for the specified delay time |
| 98 | } |
The board performance has been stressed in a real environment. Current consumption at wake-up has been measured and the sampled data has been compared with the measures performed using an EXO2 high-quality multiparameter sonde for water quality monitoring provided by the company YSI.
Figure 8 depicts the current drawn by the board circuits during the wake-up and measurement phase. The table summarizes current consumption in different test set-ups [1].
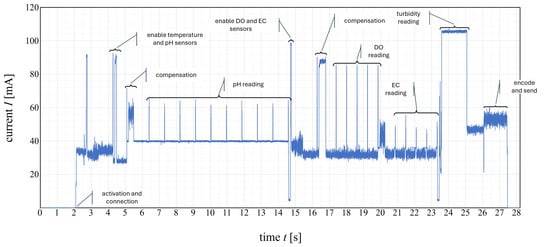
Figure 8.
Board current consumption during wake-up routine (measurement at 1 kHz sampling rate).
Table 5 presents the average and peak current consumption of the board under different configuration modes. The average current reflects the mean current drawn over a full operational cycle, including both active measurement and deep sleep phases. The peak current corresponds to the highest value recorded during a single cycle.

Table 5.
Average and peak current consumption in different test set-ups.
Notably, the peak current remains nearly identical in both the no sensors and with sensors configurations. This indicates that current spikes primarily occur during the brief wake-up and initialization phase of the ESP32, rather than as a result of sensor activity. The sensors integrated on the PCB consume significantly less current and do not materially contribute to these transient peaks. Consequently, the peak current is predominantly determined by the microcontroller’s wake-up behavior [1].
Finally, Figure 9 shows the relative measurement error of our sensor board with respect to the results obtained by performing the same measurements with a high-precision YSI EXO2 sonde.
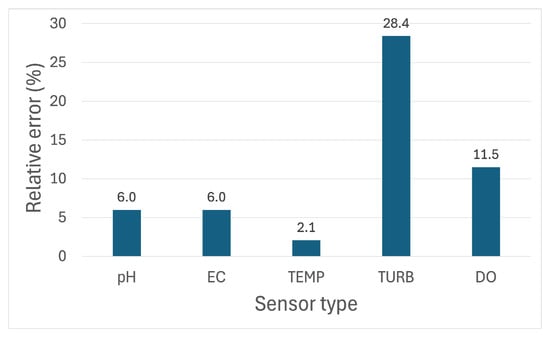
Figure 9.
Relative measurement error with respect to YSI high-precision sonde.
Experimental data has been obtained on five water samples for which each sensing parameter (i.e., pH, temperature, turbidity, etc.) has been measured five times [1].
In general, our implementation, despite the limitations due to our cost-constrained design, performs fairly well except for the turbidity and DO measurements, where we have detected 28.4% and 11% errors, respectively. The turbidity mismatch is due to the fact that a sensor calibration procedure has not yet been incorporated in the system, and that the sensor is not protected from external light sources. The DO sensor error is mainly due to calibration issues, as the sensor could not be adequately calibrated using the procedure provided by Atlas-Scientific, the manufacturer of this sensor.
6. Conclusions
The presented open-source hardware platform has successfully demonstrated its potential as an educational tool and a versatile solution for multi-sensor environmental monitoring. The integration of sensors, modular design, expandability, and positive educational outcomes collectively position the platform as a catalyst for advancing both hardware design education and environmental monitoring technologies. The dynamic interplay between education and practical application showcased in this platform lays the groundwork for empowering the next generation of engineers and scientists to address the challenges of a rapidly changing world.
Supplementary Materials
The following supporting information can be downloaded at: https://www.mdpi.com/article/10.3390/hardware3040013/s1.
| Name | Type | Description |
| Educational_Platform_Project | KiCad Project Archive (.zip) | Main Board schematics and PCB layout |
| SW_Sensor_Board_V2_2_Expander | KiCad Project Archive (.zip) | Sensor Isolation Board schematics and PCB layout |
| Educational_Platform_Schematic_PDF | PDF (.pdf) | Exported schematic diagram of the main board PCB |
| Educational_Platform_PCB_Layout_PDF | PDF (.pdf) | Layers views of the Main board PCB layout |
| Sensor_Isolation_Schematic_PDF | PDF (.pdf) | Exported schematic diagram of the isolation PCB |
| Sensor_Isolation_PCB_Layout_PDF | PDF (.pdf) | Layers views of the Isolation board PCB layout |
| LoRaBoardSW | Firmware Code Archive (.zip) | LoRa Board Firmware, C++ (PlatformIO/VS Code) |
Author Contributions
Conceptualization, A.T. and G.C.; methodology, A.T. and G.C.; software, A.T., S.F. and M.L.; validation, A.K.; data curation, A.K.; writing—original draft preparation, G.C.; writing, A.K., O.M., M.S.A. and A.T.; review and editing, G.C., A.K., O.M., S.F. and A.T.; visualization, A.K.; supervision, A.T.; project administration, M.L., A.K. and A.T. All authors have read and agreed to the published version of the manuscript.
Funding
This research received no external funding.
Data Availability Statement
The original contributions presented in this study are included in the article/Supplementary Material. Further inquiries can be directed to the corresponding author.
Conflicts of Interest
The authors declare no conflicts of interest.
Abbreviations
The following abbreviations are used in this manuscript:
| ADC | Analog to Digital Converter |
| DO | Dissolved Oxygen |
| FOSH | Free and Open-source Hardware |
| GPIO | General Purpose Input Output |
| GPS | Global Positioning System |
| I2C | Inter Integrated Circuit |
| IMU | Inertial Measurement Unit |
| I/O | Input/Output |
| JST | Japan Solderless Terminal |
| LoRa | Long Range |
| MCU | Micro Controller Unit |
| PCB | Printed Circuit Board |
| PWM | Pulse Width Modulation |
| SCL | Serial Clock Line (I2C protocol) |
| SDA | Serial Data Line (I2C protocol) |
| STEM | Science, Technology, Engineering and Mathematics |
| UART | Universal Asynchronous Receiver and Transmitter |
| USB | Universal Serial Bus |
| VPCC | Voltage Proportional Charge Control |
References
- Quevy, Q.; Lamrini, M.; Chkouri, M.; Cornetta, G.; Touhafi, A.; Campo, A. Open Sensing System for Long Term, Low Cost Water Quality Monitoring. IEEE Open J. Ind. Electron. Soc. 2023, 4, 24–71. [Google Scholar] [CrossRef]
- Manoj, M.; Kumar, V.D.; Arif, M.; Bulai, E.-R.; Bulai, P.; Geman, O. State of the art techniques for water quality monitoring systems for fish ponds using IoT and underwater sensors: A review. Sensors 2022, 4, 2088. [Google Scholar] [CrossRef] [PubMed]
- Tsai, K.-L.; Chen, L.-W.; Yang, L.-J.; Shiu, H.-J.; Chen, H.-W. IoT based smart aquaculture system with automatic aerating and water quality monitoring. J. Internet Technol. 2022, 23, 177–184. [Google Scholar]
- Sun, X.; Zhang, Y.; Shi, K.; Zhang, Y.; Li, N.; Wang, W.; Huang, X.; Qin, B. Monitoring water quality using proximal remote sensing technology. Sci. Total Environ. 2022, 803, 149805. [Google Scholar] [CrossRef] [PubMed]
- Ryu, J.H. UAS-based real-time water quality monitoring, sampling, and visualization platform (UASWQP). HardwareX 2022, 11, e00277. [Google Scholar] [CrossRef] [PubMed]
- Dunbabin, M.; Grinham, A.; Udy, J. An autonomous surface vehicle for water quality monitoring. In Proceedings of the Australasian Conference on Robotics and Automation (ACRA), Sidney, Australia, 2–4 December 2009; pp. 2–4. [Google Scholar]
- Gholizadeh, M.H.; Melesse, A.M.; Reddi, L. A comprehensive review on water quality parameters estimation using remote sensing techniques. Sensors 2016, 16, 1298. [Google Scholar] [CrossRef] [PubMed]
- Gupta, S.; Kohli, M.; Kumar, R.; Bandral, S. IoT based underwater robot for water quality monitoring. IOP Conf. Ser. Mater. Sci. Eng. 2021, 1033, 012013. [Google Scholar] [CrossRef]
- Heradio, R.; Chacon, J.; Vargas, H.; Galan, D.; Saenz, J.; De La Torre, L.; Dormido, S. Open-Source Hardware in Education: A Systematic Mapping Study. IEEE Access 2018, 6, 72094–72103. [Google Scholar] [CrossRef]
- Rowe, A.A.; Bonham, A.J.; White, R.J.; Zimmer, M.P.; Yadgar, R.J.; Hobza, T.M.; Honea, J.W.; Ben-Yaacov, I.; Plaxco, K.W. Cheapstat: An open-source, “do-it-yourself” potentiostat for analytical and educational applications. PLoS ONE 2011, 6, e23783. [Google Scholar] [CrossRef] [PubMed]
- Saari, M.; bin Baharudin, A.M.; Hyrynsalmi, S. Survey of prototyping solutions utilizing Raspberry Pi. In Proceedings of the 2017 40th International Convention on Information and Communication Technology, Electronics and Microelectronics (MIPRO), Opatija, Croatia, 22 May 2017; pp. 991–994. [Google Scholar]
- Sarikand, J.; Kymissis, I. Labkits using the arduino prototyping platform. In Proceedings of the 2010 IEEE Frontiers in Education Conference (FIE), Arlington, VA, USA, 27 October 2010. T3C-1–T3C-5. [Google Scholar]
- Araujo, A.; Portugal, D.; Couceiro, M.S.; Rocha, R.P. Integrating arduino-based educational mobile robots in ROS. J. Intell. Robot. Syst. 2015, 77, 281–298. [Google Scholar] [CrossRef]
- Zachariadou, K.; Yiasemides, K.; Trougkakos, N. A low-cost computer-controlled Arduino-based educational laboratory system for teaching the fundamentals of photovoltaic cells. Eur. J. Phys. 2013, 33, 1599. [Google Scholar] [CrossRef]
- Zhang, C.; Anzalone, N.; Faria, R.; Pearce, J. Open-Source 3D-Printable Optics Equipment. PLoS ONE 2013, 8, e59840. [Google Scholar] [CrossRef] [PubMed]
- Baden, T.; Chagas, A.M.; Gage, G.; Marzullo, T.; Prieto-Godino, L.L.; Euler, T. Open Labware: 3-D Printing Your Own Lab Equipment. PLoS Biol. 2015, 13, e1002086. [Google Scholar] [CrossRef] [PubMed]
- Schelly, C.; Anzalone, G.; Wijnen, B.; Pearce, J.M. Open-source 3-D printing technologies for education: Bringing additive manufacturing to the classroom. J. Vis. Lang. Comput. 2015, 28, 226–237. [Google Scholar] [CrossRef]
- Chronis, C.; Varlamis, I. FOSSBot: An Open Source and Open Design Educational Robot. Electronics 2022, 11, 2606. [Google Scholar] [CrossRef]
- Amaral, F.; Matia, E.; Júnior, A.O.; Zorawski, M.; Queiroz, J.; Leitão, P. A learning module to design printed circuit boards for IoT devices. In Proceedings of the 5th Workshop on Disruptive Information and Communication Technologies for Innovation and Digital Transformation, Valladolid, Spain, 12 September 2022; pp. 13–29. [Google Scholar]
- Blöschl, G.; Bierkens, M.F.; Chambel, A.; Cudennec, C.; Destouni, G.; Fiori, A.; Kirchner, J.W.; McDonnell, J.J.; Savenije, H.H.; Sivapalan, M.; et al. Twenty-three unsolved problems in hydrology (UPH)—A community perspective. Hydrol. Sci. J. 2019, 64, 1141–1158. [Google Scholar] [CrossRef]
- Pugh, K.J.; Linnenbrink-Garcia, L.; Koskey, K.L.; Stewart, V.C.; Manzey, C. Motivation, learning, and transformative experience: A study of deep engagement in science. Sci. Ed. 2010, 94, 1–28. [Google Scholar] [CrossRef]
- Pugh, K.J.; Bergstrom, C.; Spencer, B. Profiles of transformative engagement identification, description, and relation to learning and instruction. Sci. Educ. 2010, 101, 369–398. [Google Scholar] [CrossRef]
Disclaimer/Publisher’s Note: The statements, opinions and data contained in all publications are solely those of the individual author(s) and contributor(s) and not of MDPI and/or the editor(s). MDPI and/or the editor(s) disclaim responsibility for any injury to people or property resulting from any ideas, methods, instructions or products referred to in the content. |
© 2025 by the authors. Licensee MDPI, Basel, Switzerland. This article is an open access article distributed under the terms and conditions of the Creative Commons Attribution (CC BY) license (https://creativecommons.org/licenses/by/4.0/).