Abstract
In PAC spectroscopy, hyperfine interactions of a radioactive probe nucleus with its surroundings are measured, providing information about the local atomic structure and dynamics at the probe site. In the so-called fast reorientation time regime for fluctuating nuclear quadrupole interactions (NQIs), the PAC signal is an exponentially decaying function, with decay constant λ depending on both the hyperfine interaction and dynamics. For a molecular system in solution, dynamics may originate from Brownian molecular tumbling (rotational diffusion) with rotational correlation time τc and from local dynamics at the probe site, occurring at a characteristic time scale τloc. The τc and the τloc cannot be discriminated in a single PAC spectrum; however, assuming that they scale differently with viscosity and temperature, a series of experiments in which these parameters are varied may allow for discrimination of τc and the τloc. Three models are presented for the effect of dynamics on the PAC signal: (1) the Stokes–Einstein–Debye model with linear scaling of λ with viscosity ξ; (2) a more general model presenting a power law scaling of λ with (ξ/ξ0)n; and (3) a model that includes rotational and local dynamics leading to an expression for λ that scales with ξ/(ξ + c), where c is a constant that depends on temperature, molecular volume, and τloc. These models may serve as different approaches to analyze PAC data and their dependence on temperature and solvent viscosity in the fast reorientation time regime, and they can be applied to design experiments for optimal discrimination of global rotational diffusion and local dynamics at the probe site.
1. Introduction
Molecular diffusion affects a range of solution phenomena and reflects properties of both the solute and the solvent. For a rigid, spherical rotor with uniform mass distribution, and a solvent which can be modeled as a continuum with a given viscosity, the Stokes–Einstein–Debye (SED) model is the simplest incarnation of a relation among rotational correlation time τc, viscosity ξ, effective molecular volume V, and temperature T [1]:
where k is Boltzmann’s constant. This simple scaling, or variants where a proportionality constant is introduced to account for non-spherical shape of the solute or slip/no slip conditions at the solute–solvent interface while maintaining linear scaling [2,3,4,5], often adequately describes observations, especially for relatively large solutes. However, deviations have been observed, for example, for small solutes, which have been taken to indicate that local microviscosity differs from bulk, presumably due to heterogeneous environments and specific solute–solvent interactions [6,7,8]. In such cases, a power-law scaling may serve as a more general description of how τc depends on viscosity ξ and temperature T [9,10,11,12]. Local dynamics at the probe site may also contribute to measurable dynamic effects at the spectroscopic probe nucleus.
Perturbed Angular Correlation (PAC) spectroscopy is sensitive to orientational and local dynamics on the pico- to microsecond time scale [13,14,15,16,17,18,19,20,21,22]. In PAC, angle- and time-correlated detection of two γ-rays emitted in succession from a suitable nuclear probe reflect the hyperfine interaction of the nucleus while it is in the intermediate state (during the time between γ-ray emissions). In the cases described here, the hyperfine interaction of interest is the electric nuclear quadrupole interaction (NQI) between the nuclear quadrupole moment and the electric field gradient (EFG) from the surrounding charge distribution. For randomly oriented molecules, the NQI may be described by two parameters, the fundamental quadrupole frequency ω0 and the asymmetry η (not to be confused with the viscosity). For stochastic reorientation of the principal EFG axes, for example, when the molecular probe undergoes Brownian rotation, the resulting fluctuations in the NQI give rise to attenuation of the perturbation function , which is the normalized PAC signal. In the slow reorientation time regime, defined by slow tumbling with respect to the measured NQI frequency, , damping of an oscillating signal is observed. In the fast reorientation time regime, , the perturbation function becomes an exponentially decaying function, , with a decay rate that depends on ω0, η, and τc:
where is the nuclear spin of the probe in its intermediate state. It is important to note here that λ in Equation (2) is not the molecular tumbling rate, but simply the decay rate of the PAC signal. The general underlying theory of PAC may be found in the canonical reference by Frauenfelder and Steffen [13], and in a seminal paper by Abragam and Pound [14]. Dattagupta elucidated the effect of stochastically varying fields across various experimental techniques (PAC, NMR, μSR, and Mössbauer spectroscopy) [15]. Danielsen and Bauer [16,17] extended the theory to non-axially symmetric EFGs and provided examples for molecules in solutions, while Collins and coworkers demonstrated application of PAC to measure fluctuating EFGs arising from translational diffusion steps of the probes in solids [18,19,20].
Measuring the PAC signal across a controlled viscosity (e.g., using added sucrose or co-solvents) or a temperature series allows for a test of SED scaling, i.e., a quantitative assessment of deviations from the SED model. Although important work using PAC spectroscopy [13,14,15,16,17,18,19,20,21] in the rapid rotational diffusion time regime has been published, no systematic study on effects of temperature and solvent viscosity has been reported. With this work, we provide three different models which may be adopted or rejected in the interpretation of such PAC data and show that local dynamics may be discerned from pure global rotational diffusion, if they depend differently on viscosity and temperature. Moreover, the models presented here may serve as a guide to select experimental conditions optimal for the discrimination of local and global dynamics.
2. Methods
For a PAC signal obtained from probes experiencing the fast fluctuation regime, it is not possible to determine separately values of ω0, η, and τc from a single measurement; see Equation (2). Therefore, it is not possible to measure τc absolutely without an independent determination of the hyperfine parameters ω0 and η. If an absolute measure is needed, it may be possible to estimate the hyperfine parameters by extrapolating trends in the parameters when measured in the slow fluctuation regime or through calculations using density functional theory.
Often, scaling properties of the correlation time rather than its absolute value are of interest. In this case, a series of measured PAC decay rates can be compared by scaling them to a reference value λ0, corresponding to the reference correlation time τc,0 and viscosity ξ0. Assuming that the structure of the probe complex does not change along the series, i.e., that the NQI parameters, ω0 and η, remain the same, Equation (2) leads to
Note that in Equation (3), the value of λ, which may be derived from the experimental data, is related directly to the rotational correlation time, without the need to determine the NQI parameters. That is, although the NQI parameters affect the value of λ, they need not be known, if only the scaling properties of λ are of interest. This is in contrast to typical PAC studies, where the NQI parameters are at the center of attention, because they reflect the local structure at the probe site.
Next, three different models for the scaling of λ that can be reasonably expected for varying viscosity are considered.
2.1. The Stokes–Einstein–Debye Model—Linear Scaling of λ with ξ
The rotational correlation time depends on viscosity, effective molecular volume, V, and temperature, T, and the simplest relation is provided by the Stokes–Einstein–Debye (SED) model; see Equation (1). The assumptions underlying this expression are that the solute is homogeneous (mass distribution), rigid, and spherical (although a pre-factor accounting for non-spherical shape will be divided out in Equation (3)) and that it is significantly larger than the solvent molecules, which can be treated as a continuum with a given viscosity. Moreover, no specific interactions are assumed to occur between solute and solvent, and translational and rotational diffusion are assumed to be independent.
Combining Equations (1) and (3), . For a series of measurements made at constant T, this simplifies to
assuming that molecular volume is also a constant in the series of measurements.
This simple SED model serves as a starting point in most analyses of rotational diffusion [1,2,3,4,5,6,7,8,9,10,11,12,23,24,25,26]. Similarly, we have recently demonstrated that for a protein, i.e., a relatively large probe molecule, in aqueous solutions of varying viscosity (controlled by the addition of sucrose), PAC data in the slow reorientation time regime appear to be adequately described by the SED model, i.e., by a simple linear scaling of λ with ξ [22].
2.2. Power Law—λ Scaling with (ξ/ξ0)n
It has been demonstrated in a number of studies that the simple SED model fails such as for supercooled o-terphenyl [11], for small probe molecules relative to the size of solvent molecules [23], and for proteins in dense solutions [9]. In such cases, a power law has been applied successfully to describe the scaling of the rotational correlation time with ξ. For example, a power law with exponent < 1 has been applied to account for the rotational diffusion of proteins in solutions where the viscosity was controlled by addition of relatively large molecules as co-solvents (dextrans) [12]. Interestingly, the exponent, n, depended on the molecular weight of the protein and the molecular weight of the co-solvent, such that for a given protein, the exponent decreased upon increasing the co-solvent molecular weight. For example, for bovine serum albumin (MW = 66 kDa) the exponent became smaller than 1 already when the co-solvent was an order of magnitude smaller.
Similarly, here we generalize the SED model, allowing for a power-law dependence to obtain where is a reference viscosity, conveniently taken at the same measurement used for . For a series of measurements made at constant T, this simplifies to
again, assuming constant volume.
2.3. Scaling of λ When Local Dynamics at the Probe Site Is Present in Addition to the Global Rotational Diffusion; λ Scales with ξ/(ξ + c)
If local dynamics at the probe site is present on a characteristic time scale of τloc in addition to the rotational diffusion, then τc in Equation (1) may be replaced by a more general characteristic time scale, τ, assuming the local dynamics is independent of the rotational diffusion, determined by the following:
Combining Equations (2) and (6) gives
Next, it is assumed that local dynamics is independent of viscosity. It may depend on temperature, τloc(T) (e.g., with an Arrhenius dependence), but for a series of experiments at constant temperature, τloc will itself be constant. In that case, assuming Equation (1) correctly describes the rotational diffusion correlation time, one obtains
where , and , and volume is assumed to be a constant over the range of measurements.
3. Results and Discussion
In order to evaluate model dependences on viscosity, it is convenient to plot versus , as shown in Figure 1. This allows a comparison that is independent of the NQI parameters. The selected span of viscosities reflects conditions of aqueous solutions which are readily achieved in the lab, for example, from pure water at 20 °C (1 mPa∙s) to 66% w/w sucrose in aqueous solution at 20 °C (182 mPa∙s) [24], although higher viscosities may be reached. The selected span of decay rates of the PAC signal reflect measurable values of λ for the prototypical PAC probe 111mCd, for example 1 μs−1 to 200 μs−1, although broader and different spans may be achieved both with 111mCd and other PAC probes.
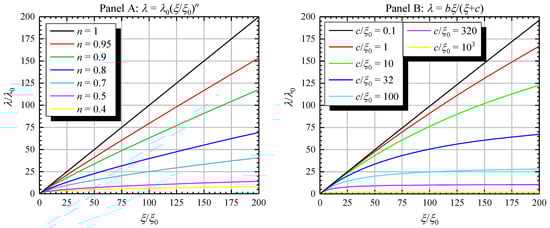
Figure 1.
Exponential decay rate of the PAC signal, λ, versus viscosity ξ for selected values of the exponent n of the power-law model (Panel A) and for selected values of c in the model that includes both global Brownian tumbling and local dynamics (Panel B). Pure linear scaling described by the SED model corresponds to a line with slope 1 in both panels, and it equals the special case n = 1 in Panel A. Values of b are selected to maintain constant V and T with values of 100 Å3 and 20 °C along with ξ0 = 1 mPa·s to generate the curves shown. Values of λ and ξ are scaled by their respective reference values, λ0 and ξ0, and c is also scaled by ξ0. The range of values of ξ were selected to represent those that are typically achievable in aqueous solution by addition of sucrose. Note that λ is not the Brownian tumbling rate, but the decay rate of the PAC signal.
Panel A of Figure 1 shows the expected behavior for a range of values of the power-law exponent n < 1. Deviation from the ideal SED model, which corresponds to n = 1, is readily observable over the viscosity range selected. Notice that some of the modeled curves are close to linear in the range of the plot, and therefore may be difficult to discriminate from the SED model in an experiment. However, the slope drops significantly with decreasing n, and thus, a slope < 1 in a data set which appears to scale linearly, may in itself be an indicator of deviation from the SED model.
The behavior of the model with local dynamics for a range of constant c/ξ0 is shown in Panel B of Figure 1. Deviation from the ideal SED behavior can be seen for values of c/ξ0 > 0.1 for the selected range of viscosity. From an experimental point of view, it will be difficult to accurately determine changes in λ/λ0 smaller than a few units, leading to an estimate of the upper limit of detectable c/ξ0 of around 300.
This third model is interesting, because it leads to an expression where we propose that it is possible to discriminate global rotational diffusion from local dynamics on the pico- to nanosecond time scale. That is, if the scaling of λ is best analyzed with the viscosity and temperature dependence presented by this model, it is likely that local fluctuating electric field gradients contribute significantly to the dynamics experienced by the nuclear probe. Moreover, it is possible to estimate the characteristic time scale of this local dynamics. For T = 20 °C, ξ0 = 1 mPa·s (the viscosity of pure water at 20 °C), and assuming the molecular probe has a radius of 3 Å, leading to a volume of about 100 Å3, then 0.1 < c/ξ0 < 1000 equates to an approximate range of τloc between about 25 ps and 25 ns. Note the important facet of this analysis—it is not necessary to know the NQI parameters ω0 and η in order to estimate the time scale of local dynamics. The scaling properties of λ with viscosity alone provide this information, as a consequence of the different dependence of the rotational correlation time and the local dynamics on viscosity.
Both panels show deviations from SED which will be readily apparent (at least for an approximate range of τloc between about 25 ps and 25 ns). But, it is not clear that the two effects (power law, panel A, and local dynamics, panel B), are readily discernable from one another; it would require careful design of the experiments, and in some cases high signal-to-noise ratios to establish curvature characteristics in panel B that are not present in panel A, for example, by appropriate selection of the range of viscosities applied in a series of experiments. The two expressions illustrated in panel A and B indicate that, if possible, it is desirable to design the experiments such that the limiting asymptotic behavior in panel B for large ξ is reached, because that is significantly different from the behavior in panel A, where no upper bound on λ/λ0 of is present. For large values of it may be relatively straightforward to advance into the range of ξ where asymptotic behavior dominates, but for small values of it may be difficult and require very high viscosities.
It is also worth noting that panel A represents a specific form of power law—scaling of viscosity only, which may not be universal. Lavalette et al. demonstrated that this describes deviation from SED behavior related to the relative size of solute and solvent molecules [12]; however, deviations from the SED model due to other effects such as specific interactions for ionic or dipolar solutes with the solvent may give rise to more complex scaling properties. Indeed, was found to describe experimental results well in references [9,11].
It is important to emphasize that the underlying assumption of the three models in this paper—that a single exponential decay describing the perturbation function in the time regime of rapidly fluctuating NQIs—is a simplification and may not always be applicable. It presupposes, for example, that all PAC probes are in the same molecular species and in the same local molecular environment. It also assumes that non-spherical geometry, heterogeneity, slip boundary conditions, and crowding effects can be included simply as factors multiplying , as was possible, as examples in references [2,3,4,5]. The validity of this assumption, especially in cases where such effects are not represented by a simple scaled-linear model such as in references [9,11,23], is uncertain. In those cases, a more complicated functional form of the perturbation function may be needed to accurately describe the resulting distribution of correlation times. A rigorous investigation of this would necessitate a derivation following methods such as those used by Abragam and Pound [14] or by Winkler [25], which is beyond the scope of the present work.
An estimation of how anomalous rotational diffusion effects could impact the functional form of the perturbation function can be obtained through a heuristic derivation assuming the power-law dependence . Adapting the reasoning that Banks and Fradin applied for translational diffusion [26] to rotational diffusion, one can generalize the usual expression for the root-mean-square of angular displacement for Brownian molecular tumbling of spherical molecules, to one that follows a power law in time: where is called the transport coefficient [27]. In the normal diffusion case, the diffusion coefficient obeys the relation . This can be used as the basis to obtain an effective diffusion coefficient (which is time-dependent) as a correction for the power-law dependence. That is,
In this case, the functional dependence of the PAC perturbation changes, becoming
or
where in analogy to .
Importantly, with this more general power-law treatment, the perturbation function is no longer a simple exponential of the form , but rather it has a different functional dependence on time: for . This stretched exponential perturbation function will decay more slowly than the exponential function at smaller values of t and then decay more rapidly at larger values of t for values and selected such that both curves have the same halving time (Figure 2). To discriminate the pure exponentially decaying G2(t) from a stretched exponential, or the limiting case of a Gaussian function (α = 0), in particular, the behavior near t = 0 should be explored, while it is, of course, also necessary that the decay is appreciable over the time range of the measurement.
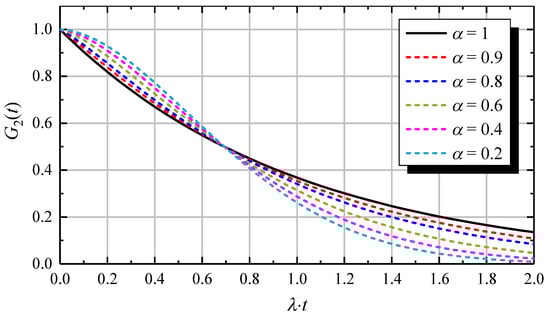
Figure 2.
Simulations of the PAC signal for varying power-law exponent . The curve is identical to the simple exponential form . To compare shapes of curves, the time axis was scaled by the decay rate of the simple exponential form, and values of were chosen so that all curves have the same halving time as the simple exponential form, that is, . An example is provided as a guide for interpreting this graph. Taking values , = 264.1 Mrad/s, = 0, and = 51.2 ps, then = 10.0 MHz and the maximum time shown in the above graph (which corresponds to ) would be 200 ns.
Interestingly, the change towards a Gaussian shape of G2(t) as α decreases towards 0 is similar to the functional form G2(t) would have in the slow reorientation time regime, for an NQI with very low ω0, i.e., a slowly oscillating function, where only the first half of an oscillation is observed. In particular, the derivative with respect to time goes towards 0 at the origin for both the expression presented here with α = 0, and for the analytical expression for G2(t) in the slow reorientation time regime. Thus, additional experimental effort must be devoted to discriminate these two interpretations of the data, for example, if possible, by extending the measurement to longer times, allowing for observation of a full oscillation, if the signal represents G2(t) in the slow reorientation time regime.
Finally, a note on a caveat when applying PAC spectroscopy to elucidate dynamics. It is important to take into account the radioactive decay leading to observed γ-γ cascade, particularly in cases where this may give rise to relaxation phenomena and thereby affect the dynamics of the daughter isotope. The optimal decay is by isomeric transitions, i.e., a γ-γ cascade, where no transmutation of element occurs and the recoil energy in the process of γ-emission is negligible, for example, 111mCd or 199mHg. Another common route to a γ-γ cascade, which is useful for PAC spectroscopy, is decay by β-emission. In such cases, it is a γ-γ cascade of the daughter nucleus that is observed, and immediately after the β-decay, the system is out of equilibrium both because of the change in element and because the daughter nucleus has received kinetic recoil energy. Often, the electronic and structural relaxation following β-decay occurs so fast (<ns), that there are no further time-dependent changes due to the decay during the PAC measurement, but that is not always the case [28]. Finally, electron capture decays commonly present aftereffects which are relatively long-lived (>ns) for molecular systems and thus interfere with the PAC measurement [29].
4. Conclusions
We have presented three models for the scaling of the exponential decay rate, λ, of PAC data (the perturbation function) with viscosity for experimental conditions leading to rapidly fluctuating nuclear quadrupole interactions: linear scaling predicted by the Stokes–Einstein–Debye model, a power law scaling as a more general approach, and a model that includes both global rotational diffusion and local dynamics at the probe site. The latter model exhibits asymptotic behavior of λ for sufficiently large viscosity, indicating that it may be possible, with appropriate experimental design, to discriminate local dynamics from rotational diffusion and to estimate the time scale of local dynamics.
Author Contributions
Conceptualization, methodology, writing—original draft, review and editing, M.O.Z. Conceptualization, methodology, writing—original draft, review and editing, L.H. All authors have read and agreed to the published version of the manuscript.
Funding
This research received no external funding.
Institutional Review Board Statement
Not applicable.
Informed Consent Statement
Not applicable.
Data Availability Statement
The original contributions presented in this study are included in the article. Further inquiries can be directed to the corresponding authors.
Acknowledgments
The authors used chatGPT-5 for the purpose of generating the graphical abstract. The authors have reviewed and edited the output and take full responsibility for the content of this publication.
Conflicts of Interest
The authors declare no conflicts of interest.
References
- Debye, P. Polar Molecules; Dover: New York, NY, USA, 1929. [Google Scholar]
- Koenderink, G.H.; Zhang, H.; Aarts, D.G.A.L.; Lettinga, M.P.; Philipse, A.P.; Nägele, G. On the validity of Stokes–Einstein–Debye relations for rotational diffusion in colloidal suspensions. Faraday Discuss. 2003, 123, 335–354. [Google Scholar]
- Klüner, R.P.; Dölle, A. Friction Coefficients and Correlation Times for Anisotropic Rotational Diffusion of Molecules in Liquids Obtained from Hydrodynamic Models and 13C Relaxation Data. Phys. Chem. A 1997, 101, 1657–1661. [Google Scholar]
- Baumler, S.M.; Mutchler, J.M.; Blanchard, G.J. Comparing Rotational and Translational Diffusion to Evaluate Heterogeneity in Binary Solvent Systems. J. Phys. Chem. B 2019, 123, 216–224. [Google Scholar] [PubMed]
- Inamdar, S.R.; Mannekutla, J.R.; Sannaikar, M.S.; Wari, M.N.; Mulimani, B.G.; Savadatti, M.I. Photophysics and rotational diffusion dynamics of large prolate non-polar laser dyes. J. Mol. Liq. 2018, 268, 66–76. [Google Scholar] [CrossRef]
- McClung, R.E.D. On the Extended Rotational Diffusion Models for Molecular Reorientation in Fluids. Adv. Mol. Relax. Interact. Process. 1977, 10, 83–171. [Google Scholar] [CrossRef]
- Starzonek, S.; Sylwester, J.; Rzoska, S.J.; Drozd-Rzoska, A.; Pawlus, S.; Biała, E.; Martinez-Garcia, J.C.; Kistersky, L. Fractional Debye–Stokes–Einstein behaviour in an ultraviscous nanocolloid: Glycerol and silver nanoparticles. Soft Matter 2015, 11, 5554–5562. [Google Scholar]
- Bittermann, M.R.; Grzelka, M.; Woutersen, S.; Brouwer, A.M.; Bonn, D. Disentangling Nano- and Macroscopic Viscosities of Aqueous Polymer Solutions Using a Fluorescent Molecular Rotor. J. Phys. Chem. Lett. 2021, 12, 3182–3186. [Google Scholar] [CrossRef]
- Das, N.; Khan, T.; Halder, B.; Ghosh, S.; Sen, P. Macromolecular crowding effects on protein dynamics. Int. J. Biol. Macromol. 2024, 281, 136248. [Google Scholar] [CrossRef]
- Mazza, M.G.; Giovambattista, N.; Stanley, H.E.; Starr, F.W. Connection of translational and rotational dynamical heterogeneities with the breakdown of the Stokes-Einstein and Stokes-Einstein-Debye relations in water. Phys. Rev. E 2007, 76, 031203. [Google Scholar]
- Andreozzi, L.; Giordano, M.; Leporini, D. Linear and non-linear electron spin resonance study of the rotational diffusion of a molecular tracer in supercooled o-terphenyl. J. Non-Cryst. Solids 1998, 235, 219–224. [Google Scholar]
- Lavalette, D.; Tétreau, C.; Tourbez, M.; Blouquit, Y. Microscopic Viscosity and Rotational Diffusion of Proteins in a Macromolecular Environment. Biophys. J. 1999, 76, 2744–2751. [Google Scholar] [CrossRef]
- Frauenfelder, H.; Steffen, R.M. Alpha-, Beta-and Gamma-Ray Spectroscopy; Siegbahn, K., Ed.; North-Holland Publishing: Amsterdam, The Netherlands, 1965; pp. 997–1198. [Google Scholar]
- Abragam, A.; Pound, R.V. Influence of Electric and Magnetic Fields on Angular Correlations. Phys. Rev. 1953, 92, 943–962. [Google Scholar]
- Dattagupta, S. Studies of Time-Dependent Hyperfine Interactions by PAC, Mössbauer Effect, μSR and NMR: A Review of Stochastic Models. Hyperfine Interact. 1981, 11, 77–126. [Google Scholar] [CrossRef]
- Danielsen, E.; Bauer, R.; Schneider, D. Rotational correlation times of peptides determined by perturbed angular correlations of γ–rays. Eur. Biophys. J. 1991, 20, 193–201. [Google Scholar] [CrossRef]
- Danielsen, E.; Bauer, R. Analysis of Perturbed Angular Correlation Spectra of Metal Ions Bound to Proteins with Rotational Correlation Times in the Intermediate region. Hyperfine Interact. 1990, 62, 311–324. [Google Scholar] [CrossRef]
- Zacate, M.O.; Favrot, A.; Collins, G.S. Atom Movement in In3La Studied Via Nuclear Quadrupole Relaxation. Phys. Rev. Lett. 2004, 93, 49903. [Google Scholar] [CrossRef]
- Collins, G.S.; Wang, Q.M.; Bevington, J.P. Impurity Diffusion in Highly-Ordered Intermetallic Compounds Studied by Nuclear Quadrupole Interactions. Diffus. Found. 2014, 2, 95–105. [Google Scholar] [CrossRef]
- Newhouse, R.; Cawthorne, S.; Collins, G.S.; Zacate, M.O. Diffusion of Tracer Atoms in Al4Ba Phases Studied Using Perturbed Angular Correlation Spectroscopy. Crystals 2022, 12, 1152. [Google Scholar] [CrossRef]
- Hemmingsen, L.; Sas, K.N.; Danielsen, E. Biological applications of perturbed angular correlation of gamma-rays (PAC) spectroscopy. Chem. Rev. 2004, 104, 4027–4062. [Google Scholar] [CrossRef]
- Fromsejer, R.; Jensen, M.L.; Zacate, M.; Karner, V.L.; Pecoraro, V.L.; Hemmingsen, L. Molecular Rotational Correlation Times and Nanoviscosity Determined by 111mCd Perturbed Angular Correlation (PAC) of γ-rays Spectroscopy. Chem. Eur. J. 2023, 29, e202203084. [Google Scholar] [CrossRef]
- Turton, D.A.; Wynne, K. Stokes–Einstein–Debye Failure in Molecular Orientational Diffusion: Exception or Rule. J. Phys. Chem. B 2014, 118, 4600–4604. [Google Scholar] [CrossRef] [PubMed]
- Barber, E.J. Calculation of Density and Viscosity of Sucrose Solutions as a Function of Concentration and Temperature. J. Natl. Cancer Inst. Monogr. 1966, 21, 219. [Google Scholar]
- Winkler, H. γγ Angular Correlations Perturbed by Randomly Reorienting Hyperfine Fields. Z. Phys. A 1976, 276, 225–232. [Google Scholar] [CrossRef]
- Banks, D.S.; Fradin, C. Anomalous Diffusion of Proteins Due to Molecular Crowding. Biophys. J. 2005, 89, 2960–2971. [Google Scholar] [CrossRef]
- Feder, T.J.; Brust-Mascher, I.; Slattery, J.P.; Baird, B.; Webb, W.W. Constrained diffusion or immobile fraction on cell surfaces: A new interpretation. Biophys. J. 1996, 70, 2767–2773. [Google Scholar] [CrossRef]
- Bauer, R.; Danielsen, E.; Hemmingsen, L.; Bjerrum, M.J.; Hansson, O.; Singh, K. Interplay between the oxidation state and coordination geometry of metal ions in azurin. J. Am. Chem. Soc. 1997, 119, 157. [Google Scholar] [CrossRef]
- Haas, H.; Shirley, D.A. Nuclear quadrupole interaction studies by perturbed angular correlations. J. Chem. Phys. 1973, 58, 3339–3355. [Google Scholar] [CrossRef]
Disclaimer/Publisher’s Note: The statements, opinions and data contained in all publications are solely those of the individual author(s) and contributor(s) and not of MDPI and/or the editor(s). MDPI and/or the editor(s) disclaim responsibility for any injury to people or property resulting from any ideas, methods, instructions or products referred to in the content. |
© 2025 by the authors. Licensee MDPI, Basel, Switzerland. This article is an open access article distributed under the terms and conditions of the Creative Commons Attribution (CC BY) license (https://creativecommons.org/licenses/by/4.0/).