Abstract
Evaluation of market connectedness and asymmetric volatility spillover has recently seen a surge in financial risk analytics and portfolio diversification. We carried out a meta-literature review on connectedness and spillovers, providing solid insight into the research field and robust guidelines for future investigation. The review consists of a quantitative bibliometric analysis of 594 papers and a qualitative content analysis of 77 papers covering 1991 to 2021. The results of the meta-citation analysis show that Diebold’s Spillover index (2007) is the predominant method in most works as far as market connectedness and spillover are concerned. With an extensive review, we achieved the following objectives: (1) Analyze the most influential authors, journals, and publications. (2) Understand the research streams and most studied streams. (3) Understand the theme’s structure, thematic evolution, and keyword trends. (4) Examine the pattern of collaboration and most productive affiliations. (5) Explore future research directions and untapped areas. The content analysis revealed the following important research streams in the current literature: (1) Asymmetries in market connectedness. (2) Influence of macro factors in market connectedness and spillover. (3) The role of oil in market spillovers and hedging portfolios. (4) Dynamic cross-market connectedness and spillovers. Our study is the first to employ a meta-review to assess the domain of market connectedness; thus, our work will significantly contribute to macroeconomic policymakers, researchers and hedging investors.
1. Introduction
The past decade has exhibited a significant perturbation of the markets, with consequent international crises. This has led to research, as reported in the literature, on financial market integration, connectedness, and co-movements, and there is a spillover of this research, with implications for policy and portfolio diversification. While financial turmoil threatens the market’s stability, it also threatens the stability of the country’s economic activities. Two of the main non-trivial problems decision-makers and investors face are managing optimal portfolios and asset allocations and adopting policies that will stabilize the economy and markets [1].
Ref. [2] defined financial shocks and transmissions, or causality in the variance between markets and volatility spillovers. Ref. [3] called this variance contagion, usually detected during events or crises as they increase cross-market linkage or co-movements. Later, studies [1,4,5] explored the information dissemination and asymmetries surrounding market connectedness and spillovers, which pose another non-trivial problem, as there is a lack of knowledge on the market’s reaction towards these asymmetries.
Ref. [6] proposed that the increase in volatility converges from innovation and development, investor protection, financial openness, and the country’s level of risk. Studies have addressed determinants of why and how these volatility transmissions occur. Most triggering factors are macro- and economic-policy-based, and some are potentially due to the firm’s origin or country of origin [7,8,9,10,11]. Thus, market connectedness and volatility spillovers grabbed researchers’ interest in market information dissemination and how to help this behavior bear fruit, so to speak, from markets, through hedging and diversification.
Although there have been several studies concerning market integration, and there is also literature regarding linkage, our study tried to delve into a specific field, rather than a broad review: connectedness and volatility spillover across the market. We tried to address these research areas from the evolutionary point of view. For this, we conducted a review with the following objectives: (1) Analyze the most influential authors, journals, and publications. (2) Understand the research streams and most studied streams. (3) Understand the theme’s structure, thematic evolution, and keyword trends. (4) Examine the pattern of collaboration and most productive affiliations. (5) Explore future research directions and untapped areas. To examine the above questions to the fullest, we have adopted the meta-literature review method, comprising a bibliometric analysis and content analysis from 1991 to 2021 with the keywords given in Figure 1.
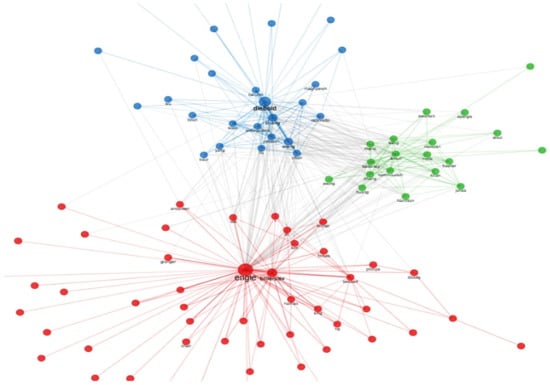
Figure 1.
Results of co-citation analysis. Source: Produced by the author using Biblioshiny.
We identified four streams in the current literature on connectedness and spillover: (1) Asymmetries in market connectedness. (2) The influence of macro factors in market connectedness and spillover. (3) The role of oil in market spillovers and hedging portfolios. (4) Dynamic cross-market connectedness and spillovers. We also identified key research questions and future research directions, which will be of great interest to researchers, policymakers, and potential investors.
The paper is presented as follows. In Section 2, the methodology and analysis conducted are discussed. Section 3 and Section 4 present significant aspects of connectedness, spillover, and visualization, as well as the results of the co-citation analysis and word analysis, respectively. In Section 5, we provide an extensive content analysis of the core papers of the literature, and in Section 6 we discuss potential research streams and future directions. In Section 7, we concluded the paper.
2. Methodology
A meta-analysis is an excellent tool for extracting multiple explorations of a subject matter from numerous pieces of work [12]. The systematic review of the literature has grown in popularity, evidently, and become an ideal method to deliver evidence on the meta-level and disclose which area needs more research contributions [13]. Our study used bibliometric analysis to assess statistical properties and content analysis to assess the validity and reliability of the research.
Bibliometric analysis has evolved considerably, and is aligned with many software updates for the mapping and visualization of research. Bibliometrix, an R package, allowed us to evaluate various statistical parameters and perform mapping. Content analysis is a text-mining method that systematically reviews and assesses the validity of research knowledge—an outline of the methodology is provided in Figure A1 in the Appendix A.
2.1. Data Collection and Sample Selection Process
Our sample selection comprised the following steps: first, we extracted the data using keywords and refined the final ones using the most used author’s keywords in the data from the Scopus database. Ref. [14] mentioned that Scopus is quite comprehensive as it includes expansive publications, houses, and fields of study.
We useed Bibliometrix to examine the metadata (bibliographic information) for the most used keywords to refine our data to the core papers. The final keywords used to refine the extraction of articles from the database are stated in Figure A1 in the Appendix, in which also appear the title, abstracts, and keywords. Secondly, we filtered the journals based on their score on the SJR. For quality papers, we selected only the journals that scored one and above in the SJR.
2.2. Data Analysis and Visualization
2.2.1. Meta-Literature Review
Our research is centered on two methods: bibliometric analysis for quantitative and empirical analysis and content analysis for qualitative analysis. Following [12,15,16,17,18,19], the subsequent analyses are conducted: (1) co-citation analysis, (2) co-authorships, and (3) co-word and thematic evolution analyses.
We predominantly utilize the RStudio package ‘Bibliometrix’ provided by [20]. Bibliometrix is an R tool for comprehensive science mapping analysis that uses the metadata (bibliographic information) as input and provides networks, clusters and themes for the input data. The software is utilized to conduct (1) co-citation analysis, (2) co-authorship analysis, and (3) co-word analysis and thematic evolution. The tool captures the intellectual, conceptual and social network of the specified research field. Our study design is described in the following subsections.
2.2.2. Co-Citation Analysis
Co-citation analysis investigates the cited documents, examines the connections, and infers the shift in the apex and schools of thought. Depending on the scope of analysis, the co-citation network attempts to depict the connection between sources, articles and authors. Thus, it assists us in capturing the impact of these various actors in the field and their influence on the research area [12,20,21]. Even though numerous citation analyses exist to improve the literature research, we employ co-citation analysis in our study due to its prospective and dynamic nature as well as its efficacy across multiple time segments.
2.2.3. Co-Authorship Analysis
Using co-authorship and collaboration analysis, a social network framework among various affiliations and countries is constructed. Future global and regional collaboration and research directions can be inferred. Consequently, a comprehensive structure of the research pyramids is attained by evaluating the domain’s social structure and leading scholars, as well as capturing the total knowledge production in the field.
2.2.4. Co-Word Analysis
Co-word analysis provides a framework for conceptual structure by mapping and clustering the keyword co-occurrences. The software provides us with the conceptual structure by means of multiple correspondence analysis, which identifies the cluster of related concepts [22,23].
2.2.5. Word Trend and Thematic Analysis
We performed a keyword analysis to identify the key streams in the literature. We used the word trend and thematic analysis in the software. We illustrated the significant shifts in keyword usage over time and evaluated the pertinent change in the streams through thematic analysis.
2.2.6. Content Analysis
We conducted content analysis to add a qualitative dimension to the empirical research from [17,24]. We verify and categorize the research stream and explore in greater depth the origins and evolution of the concepts, research topics, significant findings and research gaps in more detail.
3. Identification of Significant Aspects of Connectedness and the Spillover Literature
The general information about our sample is presented in Table 1.

Table 1.
Main information about the data.
We have also provided a comprehensive summary of key papers in each stream in Appendix Table A1.
3.1. Most Studied Countries
We provided the list of most studied countries in Table 2 based on the total number of articles the and MCP ratio.
Table 2.
Most studied countries.
It is evident that the top three countries studied in the literature are the United States, China, and the United Kingdom, while the remaining top 10 countries are predominantly European. Based on the content analysis, we determined that extensive research must be conducted on the frontier countries and specific Asian countries. Examining the most- and least-researched nations assists in directing future research. Cross-market portfolio diversification can be explored effectively by the inclusion of frontier countries. However, few effective studies have been conducted on the dynamics of frontier markets and it appears that the focus of the research will transfer from developed markets to the emerging and frontier markets.
3.2. Most Influential Journal
We identified top journals based on three parameters—number of articles, impact scores, and Bradford’s law. The results are shown in Table 3.
Table 3.
Influential journals.
It is essential to note that Energy Economics is the leading journal based on all the analyses. We analyzed total citations, citations per year, and impact scores (h index, g index and m index to avoid discrepancies between these metrics). The extensive contribution of the Energy Economics journal makes it a notable publication in the connectedness and spillovers literature.
3.3. Influential Authors and Articles
We conducted an extensive analysis to identify the core authors based on their local citations (among our sample), impact scores (h index, g index and m index) and their production over time (where the circle denotes the number of articles and shade intensity denotes the number of citations over the time), as shown in Table 4.
Table 4.
Influential authors.
The identification of core authors facilitates us explore how these authors directs a research stream in the field and how their future collaboration will develop. We discovered the influential articles based on their local citations, as shown in Table 5. Diebold’s work is clearly the most cited article, and the content analysis also revealed that the spillover index is the most utilized methodology in the literature.
Table 5.
Most influential articles.
4. Citation Analysis and Visualization
4.1. Co-Citation Mapping
We conducted the co-citation analysis using Bibliometrix. The minimum citation threshold was set to 12 and the walk trap algorithm was implemented for citation networking. We obtained three main clusters—red, blue and green—corresponding to asymmetries in market connectedness, major determinants and macroeconomic variables or factors that influence the market connectedness and spillovers, and dynamic market spillover among different markets and sectors, respectively (presented in Figure 1).
To add the element of thematic evolution and to identify the primary focus of research for each cluster, we conducted a content analysis; we extracted the core papers using the PageRank metric and evaluated them to corroborate their linkages and integrity [25]. The content analysis revealed that extensive studies have been conducted on oil, which should be given special consideration; thus, we treated them as a distinct stream in this paper. The identified streams consist of (1) asymmetries in market connectedness, (2) macro factors that impact market connectedness and spillovers, (3) the role of oil in spillover and hedging portfolios and (4) dynamic cross-market connectedness and spillovers.
4.2. Co-Authorship Visualization
We conducted the co-authorship analysis, with the minimum threshold of three co-authored papers. This provides a unique perspective on the evolution of these research streams over time with these authors [26]. The authors do not constitute a vast network; however, the network is pertinent, and the affiliations are strengthening over time. The analysis outcome is depicted in Figure 2.
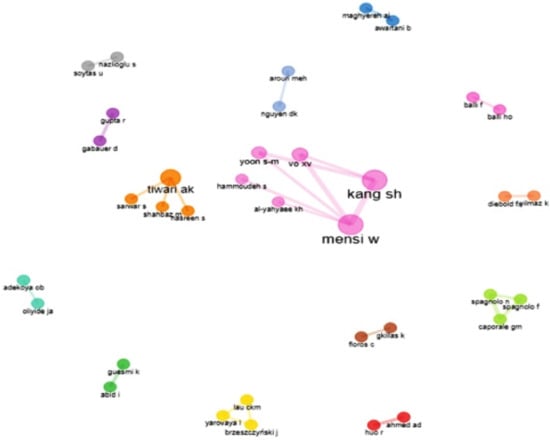
Figure 2.
Results of Co-authorship analysis. Source: same as Figure 1.
4.3. Co-Word and Thematic Analysis
We performed co-word analysis followed by thematic analysis to illustrate the evolution of keywords and themes within each stream. Figure 3 depicts the outcome of the keyword analysis, which provides the evolution of keyword usage by the authors and the growth of the current literature over time.
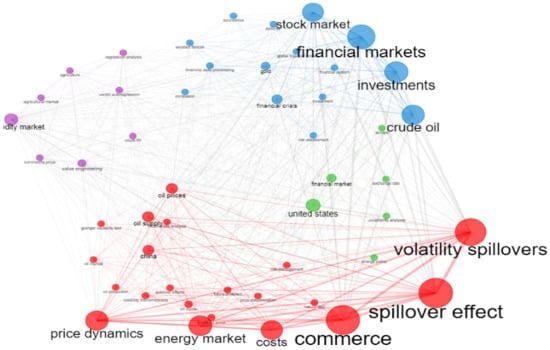
Figure 3.
Results of co-word analysis. Source: same as Figure 1.
We employed concepts of centrality and density to identify core keywords. We analyzed their evolution across time and the entire sample period, categorizing the themes into base, motor, isolated, and declining or emerging themes, as shown in Figure 4.
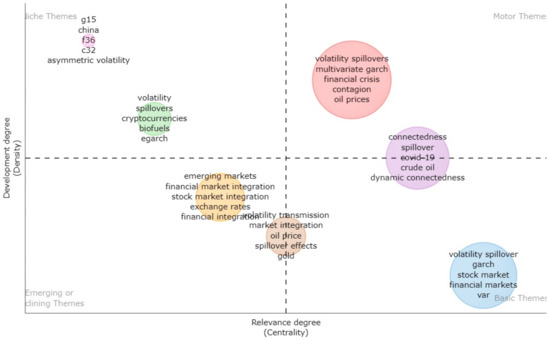
Figure 4.
Results of thematic analysis using author’s keywords. Source: same as Figure 1.
5. Content Analysis of the Four Clusters
5.1. Asymmetries in Market Connectedness
Ref. [27] analyzed the asymmetries in the forex market of AUD, GBP, CAD, EUR, JPY, and CHF during the 2007–2015 period. The Global Financial Crisis (GFC, 2008) mainly induced good volatility, and Japan became the primary receiver. Ref. [28] conducted ARMAX-GARCH to investigate the volatility spillover of the commodity market (energy, industrial metals, precious metals, oil seeds) to the sovereign CDS of 23 emerging and frontier markets and noticed significant but inconsistent transmission over time. However, the results vary over time and commodities that are considered.
Ref. [29] verified the statistical properties of asymmetries in return connectedness between the Asian currencies from 1994 to 2019. They proposed that considering the size of the return shock is proportional to connectedness and crucial for the development of rigorous portfolio diversification and policies. The study argues that planning policies and schemes should take into account the prospects of the market’s potential positive and negative asymmetries. According to Ref. [30], policymakers should exercise caution when simultaneously investing in currency and energy markets. Assessment of structural breaks improves a deeper comprehension of the persistent behavior of the market [30,31].
Large asymmetric transmission exists between oil and equities, whereas bilateral transmission is negligible. Instead of using historical volatility, Ref. [32] argued that implied volatility provides additional information on the connectedness and risk transmission between different markets and countries. Ref. [33] demonstrated that China’s and global oil prices are asymmetries. According to Ref. [9], the Asian stock market co-moves without discernible asymmetry between them.
Ref. [34] defined asymmetries in OPEC’s announcement as the cut, maintain, and hike decisions and investigated their influence on cereal products. They confirm a significant asymmetric effect of oil and gasoline on cereals over a continuous period, disregarding economic fundamentals and the prices of the commodities; they referred to decisions to make cuts as bad news and decisions to maintain the status quo as good news.
Refs. [32,35,36] argued that market volatility spillover and asymmetries are crucial when constructing hedge ratios and optimal portfolios. However, in accordance with Ref. [37], market connectedness is not extremely susceptible to information spillover among the ASEAN markets.
5.2. Macro Factors Impact on Market Connectedness and Spillovers
Ref. [37] demonstrated that market size does not play a significant role in market integration. After removing the effects of the global market, they discovered that the level of connectedness drops drastically. Refs. [8,37] showed that capital account restrictions, exchange restrictions, and capital control play a unique role in the integration and information dissemination among the markets. Different regimes (tax, size, stability, technological advancements) have distinct effects on connectedness.
Ref. [31] supported the notion of flight-to-quality, i.e., shifting to safe haven assets during times of crisis. In his study, VIX is considered the ideal hedging instrument and unconditional against developed markets where currency treasuries (likely Yen and USD) are contingent on the market conditions. For developed markets, the safe haven assets exhibit relatively low-risk exposure, less than unity; however, this exposure increased during the GFC. As per Ref. [38], the macroeconomic developments in the European Economic and Monetary Union (EMU) initiates the bond–stock market integration.
Ref. [33] asserted that arbitrage plays a vital role when the oil market’s prices are below the threshold level by using the threshold VECM, and defined these threshold effects as originating from the transaction cost. Ref. [8] advocated four linkages, which are economic, financial, information capacity, and industrial similarity, and revealed that information capacity and industrial similarity are highly prone to developed markets whereas economic and financial integration are crucial in developing and developed markets.
Ref. [7] provided evidence that future trading impacts the spot stock prices but not the futures spreads, and the impact is not due to the exogenous factors but rather to broad market factors. Ref. [10] added that during extreme events, the currency carry trade and stock markets affect each other, i.e., a bilateral spillover exists in times of events.
EPU has an enormous impact when the stock market confronts downside risk. When stimulative schemes are enacted, the upside risk is sensitive to the EPU but shifts in the opposite direction regarding disputes or contagion [39]. However, Ref. [40] observed that EPU’s effect on dynamic connectedness is regime-dependent.
5.3. Role of Oil in Market Spillovers and Hedging
Ref. [41] stated that the influence of natural gas has not received less attention compared to crude oil, despite the former having environmental benefits. They found an optimal hedging ratio between stocks and oil and natural gas, i.e., a dollar invested in stock should be hedged with a cent in natural gas futures or short selling of the oil futures. When equities possess significant asymmetries, they found that Indian investors tend to favor natural gas over oil for hedging. Similarly, as per [42], a dollar in Brent crude oil should be hedged with 10 cents in DJASIA and 30 cents in Italy stocks. In this regard, the hedging is contingent on the time horizon, and the uncertainty depends on the contingents. They observed that during ESDC, hedging is more costly than during the GFC and oil price bursts. Higher oil prices can affect vulnerable economies, break the exchange rates, and deteriorate the performance of the stock returns. It is also emphasized that higher oil prices improve the oil-exporting countries’ fiscal stability.
Ref. [43] enriched the literature by filling the gap by examining the impact of the oil volatility on the stocks of heavy oil importing countries; he found that oil played a significant role post-crisis (GFC). The oil volatility had little effect on Lebanon, a country which is dominated by banking and services, whereas Jordan has shown a significant response to the oil shocks. The presence of foreign investors influenced small countries such as Morocco and Tunisia.
Ref. [44] analyzed the oil and exchange rate connectedness and spillover of the major oil exporting and importing countries. He segregated the oil shocks into demand, supply and risk following [41] segregation. The study found that the demand and risk shock significantly affect the exchange rates and increase after the crisis; the author asserts these phenomena possess potential forecasting advantages that can be used to construct an international hedging portfolio. He states that it is also important for policymakers to pursue oil shocks for trade balance as part of macro-level regulation and policing.
Ref. [45] tried to capture the role of exogenous shocks on the information transmission of the oil–equity uncertainty index. They figured that the exogenous shocks impacted the volatility spillovers between the oil and equity uncertainty index post-crisis but was insignificant pre-crisis. Ref. [46] found that the exchange rates and interest rates and the oil prices co-move over time, and the important oil importing and exporting countries’ exchange rates were affected by the crude oil, and importing countries were affected relatively higher than exporting countries in their study. They noted that the rise in oil prices results in exchange rate appreciation.
5.4. Dynamic Cross-Markets Connectedness and Spillover
Ref. [37] found that the level of cross-market integration within the ASEAN market is not as high as is commonly perceived when considering the global market influence; the interconnectedness is relatively low. They noticed that the cross-market connectedness decreases when the world market factors are filtered out. Ref. [41] demonstrated that the dynamic model (DCC) captures the asymmetries in the market better compared to the constant model (CCC). In their sample, oil serves a crucial role in cross-market spillovers. Studies have considered the dynamic models for cross-market analysis to incorporate the geopolitical risk that transits into the world market systems [47]. In addition, they analyzed the geopolitical risks of BRICS, oil, and gold and found that they varied over time and frequency frame and intensified in the short term. For short-term investors, the impact of the geopolitical risk has to be the main focal element, as the study stated that the GFC and the Ukrainian crisis caused numerous spikes in the spillover. They have stated that gold and oil have a hedging function during geopolitical events, and the oil–gold nexus has to be the main concern for the hedgers.
In the crypto market, investors are not only acclimated to positive returns. Ref. [48] noticed that the general notion of Bitcoin does not apply to crypto market connectedness, and Bitcoin has transitioned from a net contributor to a net receiver over time. At the same time, other significant currencies entered the market, and Litecoin became the epicenter of connectedness. Studies have observed that if return and trading volumes are connected, there is a significant linkage between the return connectedness and the trading volume; however, Ref. [49] asserted that the volatility of Bitcoin exchange markets depends on the asset’s withdrawal rather than the trading volume. Ref. [50] demonstrated that the LME nonferrous metal futures impact SFE nonferrous metal and added that the GFC intensified the impact pattern. Ref. [38] observed bond and stock integration and discussed the reason why it is happening. They pointed out that international bond and stock integration are typically characterized by dynamism. In the event that monetary policies play a role in these linkages, bonds usually have the upper hand.
Ref. [51] found shreds of evidence in the spillover from the developed stock market to the emerging market; however, the linkage is tenuous. Studies found that Asian countries’ stock markets exhibit co-movements and strengthened after the impact of the GFC. However, the interaction between Asia and the US was minimal, and hardly any co-movements ensued. Ref. [52] found that the asymmetry transmission can be discerned as stabilizing unit between the stock markets and should be regarded as a hedging tool. He found a degree of transmission between the developed markets and the emerging Asian markets.
6. Discussions and Future Directions
6.1. Asymmetries in the Market Connectedness and Spillover
With a growing profundity in asymmetry studies, research increasingly focuses on information dissemination in terms of good and bad news in the market. Rarely do studies explore the geopolitical risks of various institutional unions, macro variables, and investing tools. One should also account for the geographical setting and the time difference between regions when addressing cross-country asymmetries. Ref. [53] argued that social and cultural factors can also influence market information dissemination. Although there are comprehensive studies on cross-country, cross-listed, and cross-market analysis, they focus on large markets, ignoring the frontier and small countries. Structural reversals are often observed in the risk spillovers from the oil nexus which differs at different quantiles and spikes at both tails against the median [54]. Contrary to the findings of the content analysis, a study found that Asian markets are strong negative spillers in the major international stock market network [55]. Thus, a broad study must be conducted on these frontier markets and small countries (potentially growing ones).
The methodologies for connectedness and spillover have been upgraded from basic GARCH models to frequency analysis and other significant techniques. However, in our study, the DY or spillover index, DCC-GARCH, and variants of GARCH models are the most prevalent techniques. At the same time, Barunik’s SAM and frequency asymmetric index have contributed considerably to the asymmetry hypothesis analysis [4,5]. The usage of high-frequency data is stagnant in this particular framework. Other financial methods and tools had to be examined under the connectedness literature.
6.2. Macro Factor Influence on Market Connectedness and Spillover
We have already mentioned that the studies focus on developed markets while ignoring small markets, despite the fact that few studies have shown that the size effect does not play a significant role in connectedness. Small markets have to be considered to determine the bilateral spillover or whether they were acting as primarily net receivers only. Policy creation, global speculation, and anticipation must be indexed in terms of connectedness, and the same criteria must be indexed with the frontier and emerging markets. Ref. [56] found that the effects of macro and economic policy uncertainty (EPU) are time-varying, asymmetric, and non-linear. The immunity of the aggressive and defensive sectors in the markets towards the macroeconomic policy would help us to construct their structural breaks and linearity patterns. Globalization, market openness, innovation in trading, and monetary unions must be thoroughly examined for their contributions to the volatility transmission between markets. Country-specific determinants have yet to be explored. The time-varying nature of these determinants, as well as their functions and dynamics in times of contagion, must be addressed.
6.3. Role of Oil in Market Spillovers and Hedging Portfolios
Prior studies did not consider the role of oil in the market linkages in terms of the geopolitical risk it holds; we explored the oil impacts in market spillover and its effect on hedging. Oil is the subject of the majority of investigations. The notion of small countries that are large oil importers has to be explored in terms of their contributions to the oil volatility fluctuation. Oil futures must be investigated from a country-specific perspective to demonstrate how hedging can be made possible, given that the markets are connected. Analysis of the GCC countries reveals that with the exception of Qatar, all other countries are prone to global geopolitical risk [57]. This has to be evaluated using empirical methods to quantify the network of the GCC’s impacts and their long-term behavior. The connectedness between large oil-importing and oil-exporting Asian countries must be evaluated to determine how the oil volatility influences their net spillovers. The safe haven properties of the oil–gold nexus and oil–crypto nexus will be crucial in the upcoming years as the study disputes the absence of safe haven properties in the oil–gold–Bitcoin nexus [58]. The impact of green alternatives and green energy on oil volatility and oil spillovers should be assessed in the context of the current literature.
6.4. Dynamic Cross-Market Connectedness and Spillovers
Lately, the time-varying spillover between and across different markets and sectors has been examined. Numerous studies have documented the stock and bond market connectedness; however, the influence and network with the commodity market remain understudied. In the current literature, the time-varying integration of the feedback trading of cross-listed shares and the intensity of foreign investors is largely unexplored. Methods-based cross-quantile studies reveal that the crypto-currency market possesses a heterogeneous pattern [59]. However, this pattern varies based on the market sizes as opposed to the main findings in the content analysis. G10 countries are affected to varying degrees by financial contagions, with the most prominent finding of this study being that the Eurozone was able to contain the shock transmission from Brexit by adopting effective measures [60]. As previously stated, currency, monetary union, and liquidity effects on the stock–bond connectedness have yet to be made for a number of countries.
Thus, we outline the gaps from the identified streams from the literature and present them as future research questions in Table 6.
Table 6.
Future research questions.
7. Conclusions
We wanted to investigate the prominent literature on market connectedness and spillovers. We followed some of the previous studies’ footprints in a meta-literature review in order to derive a set of quantitative and qualitative structures for the literature, for which we conducted bibliometric analysis for the former and content analysis for the latter. We utilized the Bibliometrix package for various bibliometric analyses including co-citation, co-authorship, co-word, and thematic analysis. The advantages of the study are co-word analysis, which introduces an element of thematic analysis that was absent from previous works of literature, and the extraction and purging of 40 years (1991–2021) of data from the Scopus database in accordance with the structure of the study.
The paper contributes in two ways. First, it extracts the most influential facets of the connectedness literature including the most studied countries, top collaborations, sources, authors, and articles. Then, we examined the themes in the field and categorized them according to the most compelling topics and the base, motor, and emerging themes. With an extensive content analysis of 75 papers comprised of core and secondary papers, we identified four major streams in the connectedness in the literature, which are (1) asymmetries in the market connectedness, (2) macro factors’ impact on the connectedness and spillovers across markets and countries, (3) the role of oil in market spillovers and portfolio hedging, and (4) dynamic cross-market connectedness and spillovers. We analyzed and summarized the key findings from the abovementioned streams, as well as mapped the essential methodologies and authors. We contributed by identifying the literature gaps, then outlined and discussed the future directions of the research field.
The growing globalization and interactions between markets and countries have made the market co-movements more complex in analytics; with the ongoing innovations and contagions or crises, the literature on connectedness and spillover would be of outstanding contribution and interest to the policymakers, investors, and hedgers for portfolio diversification and risk management. Nonetheless, the study is restricted to citation analysis which can be expanded by interpreting the empirical form by undertaking a meta-regression on the study domain and how the changes are recorded accordingly.
Author Contributions
Conceptualization, K.A.K. and A.K.M.; methodology and software, K.A.K.; validation, K.A.K.; formal analysis, K.A.K.; resources, K.A.K. and A.K.M.; data curation, K.A.K.; writing—original draft preparation, K.A.K.; writing—review and editing, K.A.K. and A.K.M. All authors have read and agreed to the published version of the manuscript.
Funding
This research received no external funding.
Institutional Review Board Statement
Not applicable.
Informed Consent Statement
Not applicable.
Data Availability Statement
Not applicable.
Conflicts of Interest
The authors declare no conflict of interest.
Appendix A

Figure A1.
Outline of Methodology.
Figure A1.
Outline of Methodology.

Table A1.
Summary of the core literatures in each stream.
Table A1.
Summary of the core literatures in each stream.
| Authors (Year) | Type of Paper (Empirical or Qualitative) | Title of Study | Objective/Research Question | Methods (Technique/Sample of Study/Data Questions | Main Findings |
|---|---|---|---|---|---|
| Empirical | Volatility spillovers in east Asian financial markets: A mem-based approach | Volatility spillover during the Asian Currency Crisis | MEM-GARCH | Hong Kong was a major transmitter and build-up of volatility transmission during the currency crises in 1997 but few in the 9/11 attack. |
| Empirical | Bear squeezes, volatility spillovers and speculative attacks in the hyperinflation 1920s foreign exchange | Co-movements between exchange rates during 1920 and their behavior to present exchange rate connectedness | QMLE and Robust Wald test for causality, 7 Country 162 Weekly exchange rates | Even though there is a significant relationship during events, there is no clear evidence of transmission between exchange rates. |
| Empirical | On the global financial market integration “swoosh” and the trilemma | Analyzing the pattern in Financial Market Integration | Factor Model and CAPM 17 country’s 1554 monthly equity portfolio of 1885–2014 | There is no significant regional cointegration, but the cointegration among countries follows a swoosh pattern as opposed to the previous findings. |
| Empirical | Oil price fluctuation, volatility spillover and the Ghanaian equity market: Implication for portfolio management and hedging effectiveness | Hedging and portfolio diversification during oil shocks in west Africa and Nigeria stocks | VAR-GARHC, VAR-AGARCH &DCC-GARCH,574 weekly Ghana stock, oil from 2000–2010 | There is significant volatility spillover between oil and the two stock markets, and the information shocks intensified the spillovers and predictability. |
| Empirical | Evolution of international stock and bond market integration: Influence of the European Monetary Union | EMU influence on stock-bond integration | EGARCH, PCA&GLS, the eurozone and non-eurozone total of seven countries of 1994–2003. | The introduction of EMU impacted the eurozone stock-bond co-movement but not the non-euro countries; it led to a flight to quality phenomena. |
| Empirical | Dependence Structure between Oil Prices, Exchange Rates, and Interest Rates | What is the co-movement nature of the oil, exchange rate and U.S. interest rate | TGARCH and Asymmetric ARCH, APRCH and Copula, weekly data 1998–2017 | There is a negative relationship between oil and the U.S. interest rate; Oil fluctuations are transported to the Exchange rate of oil exporting countries. |
| Empirical | Exogenous shocks and the spillover effects between uncertainty and oil price | Examining the information spillover between oil and stock pre- and post-GFC | Bi-variable EGARCH, VIX, ted spread, S&P 500 index and gold future oil price as exogenous shocks, daily data of 2004–2014 | There was no information transmission between the oil and stock pre crises, but it became significant after the crises, and the exogenous shocks intensified the transmission. |
| Empirical | Analyzing the time-frequency connectedness among oil, gold prices and BRICS geopolitical risks | Examining the interaction between oil, BRICS, gold and geopolitical risk index. | Asymmetric Frequency Index, 2000–2019, Gold, Geopolitical risk index, BRICS risk index and Oil price. | There is a clear presence of spillover among the variables. |
| Empirical | Asymmetric volatility connectedness on the forex market | Do asymmetries exist in the volatility of the currency market, and if they do, what is their uniformity? | BK (2016) & DY (2012) & SAM | GFC triggers good volatility spillover, and JPY is the receiver mainly, and macro variables play their role in monetary policies and bank interventions. |
| Empirical | Oil volatility shocks and the stock markets of oil-importing MENA economies: A tale from the financial crisis | AVS between oil and MENA countries (Jordan and Lebanon Stock markets). | L.M. test & ARMAX-GARCH | Oil volatility impacts Jordan’s stock post-GFC, whereas oil volatility does not predict Lebanon’s volatility. There is a heterogeneity in the comparison between Tunisia and Morocco (small and heavy oil-importing countries). |
| Empirical | Volatility transmission from commodity markets to sovereign CDS spreads in emerging and frontier countries | AVS from commodity to sovereign CDS, sector-wise, and country-wise analysis. | L.M. test & AR-GARCH | 10 out of 17 emerging, four frontier markets are affected by commodity price volatility, whereas the energy and precious metals sectors are large contributors. |
| Empirical | Extreme spillovers across Asian-Pacific currencies: A quantile-based analysis | AVS between Asian currency markets. | Quantile based VAR | Return spillovers vary between periods of appreciation and depreciation and extreme events. |
| Empirical | Spillovers in higher moments and jumps across U.S. stock and strategic commodity markets | AVS in the higher moment and jumps between | TVP-VAR, GIRF & GFEVD | U.S. (RV&RK), oil (R.S. & jumps) main transmitter, and gold is the primary receiver. |
| Empirical | Does feedback trading drive returns of cross-listed shares? | Analyze feedback and information volatility spillover among cross-listed shares, whether the same market segmentation information gives volatility of the same stock and how exogenous shocks affect the price discovery. | Feedback Model- VAR, VECM, VAR-MV-GARCH | Cross-listed shares have long-run co-movements and bi-directional causations; a dynamic exists between volatility and liquidity. |
| Empirical | Realized volatility connectedness among Bitcoin exchange markets | To determine the integration degree of the crypto market. | Realized Volatility, FEVD, D.Y. Connectedness | Coinbase is the most influential exchange, although not in the top 3 in trading volume, and Binance is the no. 1 in terms of trading volume but not influential. |
| Empirical | Dynamic connectedness and integration in cryptocurrency markets | Return connectedness and volatility spillover between six cryptocurrencies. | FEVD, D.Y. Connectedness | The largest net transmitter is Bitcoin and receivers are Ethereum and Dash. A negative return is more potent than a positive, dynamically, moved Bitcoin from net transmitter to net receiver, and trading volume might be a significant determinant given that return and trading volume have linkages. |
| Empirical | Macro factors and the realized volatility of commodities: A dynamic network analysis | Analyzing macro factors’ impact on commodity volatilities. | Realized Volatility, FEVD, D.Y. Connectedness | Gold is the net information transmitter. Gold and crude oil show significant time-varying characteristics over macro information; gold influenced mainly from the sentiment index and volatility index and crude oil for default spread and volatility index. |
| Empirical | Housing market spillovers through the lens of transaction volume: A new spillover index approach | Analyzing the determinants and the pattern of housing information transmission. | Directed Cycle Graph (DAG) and Spillover index. Eight Chinese provinces’ daily housing index, from Nov 2009 to Feb 2018 | Hierarchy in the cities is the primary determinant and propounds different dynamic information transmissions. The usage of high- and low-frequency results in different daily fluctuations housing sector. |
| Empirical | Analyzing and forecasting volatility spillovers, asymmetries and hedging in major oil markets | Crude oil price volatility. | CCC, VARMA–GARCH, VARMA–AGARCH | Conditional correlation forecasts exhibited both upward trend and downward trends, and optimal portfolio weights suggest holding the light sweet grade category in a more significant proportion than theheavier and less sweet-grade category. |
| Empirical | Dynamic connectedness of oil price shocks and exchange rates | Different sources of oil price shocks are connected to the exchange rates of major oil-dependent countries. | ARMA, VAR, SVAR | Oil price shocks resulting from changes in demand and risk significantly contribute to variations in exchange rates, while supply shocks have virtually no impact. |
| Empirical | Dynamic spillover effects among crude oil, precious metal, and agricultural commodity futures markets | Spillover effects among six commodity futures markets. | multivariate DECO-GARCH, Spillover Index | Hedging strategies depend on market conditions, with a higher value for the hedge ratios during episodes of financial turmoil. |
| Empirical | Dynamic spillovers among major energy and cereal commodity prices | Examining the impacts of three types of OPEC news announcements on the volatility spillovers and persistence | VAR-BEKK-GARCH, VAR-DCC-GARCH | Empirical models are flexible enough to capture the dynamic structure of the return interactions, volatility spillovers, and conditional correlations. |
| Empirical | Exploring the time-frequency connectedness and network among crude oil and agriculture commodities V1 | frequency domain connectedness between oil and agriculture commodity prices. | frequency domain spillover method, D.Y. Spillover Index | vegetable oil prices are net volatility transmitters at any frequency band. |
| Empirical | Dynamic spillovers between Shanghai and London nonferrous metal futures markets | Examines the dynamic return and volatility spillovers between the Shanghai Futures Exchange (SFE) and the London Metal Exchange (LME). | new spillover index of Diebold and Yilmaz | LME nonferrous metal futures have a more significant impact on SFE nonferrous metal futures. |
| Empirical | Volatility spillovers between oil and equity markets and portfolio risk implications in the U.S. and vulnerable E.U. countries | Frequency dynamics of volatility spillovers between Brent crude oil and stock markets in the U.S., Europe, Asia, GIPSI, Ireland, Portugal, Spain and Italy. | Methods by Diebold and Yilmaz, and Barunik and Krehlik, AR (1)-FIGARCH | Spillover effect between the oil and the stock markets is conidered time-varying, crisis-sensitive, and frequency-dependent. |
| Empirical | Return and volatility transmission between world oil prices and stock markets of the GCC countries | Return links and volatility transmission between oil and stock markets in the Gulf Cooperation Council (GCC) countries. | VAR-GARCH, GCC-GARCH | Oil stock return and volatility linkages could compare their causality across GCC countries and other oil-exporting and oil-importing countries. |
| Empirical | Risk spillovers and hedging effectiveness between significant commodities and Islamic and conventional GCC banks | Dynamic risk spillovers and hedging effectiveness between two important commodity markets (oil and gold). | DECO-FIGARCH, spillover index of Diebold and Yilmaz | Gold offers the best hedging effectiveness for UAE, Qatar and Saudi Arabia, which are major oil exporters, while oil provides the highest hedging effectiveness for Bahrain, which is a minor oil producer. |
| Empirical | Correlations and volatility spillovers between oil prices and the stock prices of clean energy and technology companies | Analyze the volatility spillovers between oil prices and the stock prices of clean energy companies and technology companies. | MGARCH, BEKK | Stock prices of clean energy companies correlate reasonably highly with the stock prices of technology companies. Portfolio of clean energy stocksand oil futures can be built, and oil futures can be used to hedge an investment in clean energy stock prices. |
| Empirical | Stock market integration of emerging Asian economies: Patterns and causes | Patterns and causes of stock market integration of selected emerging Asian nations against the U.S., Australia, China, and India. | GARCH-DCC, EGARCH | Monthly correlations were least influenced; six Asian markets were relatively more correlated with the Chinese stock market than those of India, Australia, or the U.S. |
| Empirical | Structural breaks, dynamic correlations, asymmetric volatility transmission, and hedging strategies for petroleum prices and USD exchange rate | Influence of structural changes on the asymmetry of volatility spillovers, asset allocation and portfolio diversification between the USD/euro exchange market and each of six major spot petroleum markets, including WTI, Europe Brent, kerosene, gasoline and propane. | Bivariate DCC-EGARCH Model | Volatility spillovers from the petroleum prices to the dollar/euro exchange rate have implications for import inflation and the general price level; portfolio strategies are sensitive to the petroleum-currency nexus. |
| Empirical | The directional volatility connectedness between crude oil and equity markets: new evidence from implied volatility indexes | Directional connectedness between oil and equities in eleven major stock exchanges. | VAR, KPSS H-Step | The study exploited newly introduced implied volatility indices and directional connectedness measures to study the risk transfer between the oil market and a group of global equity markets. |
| Empirical | Volatility spillovers for spot, futures, and ETF prices in agriculture and energy | Relationship and the interactions on price and volatility, and on the covolatility spillover effects for agricultural and energy industries. | Full BEKK and DCC, | Volatility spillovers exist for all four financial assets in three different markets, though there are some differences in the quantitative results. |
References
- BenSaïda, A. Good and bad volatility spillovers: An asymmetric connectedness. J. Financ. Mark. 2019, 43, 78–95. [Google Scholar] [CrossRef]
- Engle, R.F.; Ito, T.; Wenlong, L. Metor Shower? Heteroskedastic Intra-Daily Volatility in the Foreign Exchange Market. Econometrica 1990, 58, 525–542. [Google Scholar] [CrossRef]
- Forbes, K.J.; Rigobon, R. No contagion, only interdependence: Measuring stock market comovements. J. Financ. 2002, 57, 2223–2261. [Google Scholar] [CrossRef]
- Baruník, J.; Křehlík, T. Measuring the frequency dynamics of financial connectedness and systemic risk. J. Financ. Econ. 2018, 16, 271–296. [Google Scholar] [CrossRef]
- Baruník, J.; Kočenda, E.; Vácha, L. Asymmetric connectedness on the U.S. stock market: Bad and good volatility spillovers. J. Financ. Mark. 2016, 27, 55–78. [Google Scholar] [CrossRef]
- Brown, G. Why Are U.S. Stocks More Volatile ? J. Financ. 2012, LXVII, 1329–1370. [Google Scholar]
- Chang, E.C.; Cheng, J.W.; Pinegar, J. Does futures trading increase stock market volatility? The case of the Nikkei stock index futures markets. J. Bank Financ. 1999, 23, 727–753. [Google Scholar] [CrossRef]
- Liu, L. International stock market interdependence: Are developing markets the same as developed markets? J. Int. Financ. Mark. Inst. Money 2013, 26, 226–238. [Google Scholar] [CrossRef]
- Narayan, S.; Sriananthakumar, S.; Islam, S. Stock market integration of emerging Asian economies: Patterns and causes. Econ. Model. 2014, 39, 19–31. [Google Scholar] [CrossRef]
- Liu, C.-L.; Yang, H.-F. Systemic risk in carry-trade portfolios. Financ. Res. Lett. 2016, 20, 40–46. [Google Scholar] [CrossRef]
- Hu, M.; Zhang, D.; Ji, Q.; Wei, L. Macro factors and the realized volatility of commodities: A dynamic network analysis. Resour. Policy 2020, 68, 101813. [Google Scholar] [CrossRef] [PubMed]
- Fetscherin, M.; Heinrich, D. Consumer brand relationships research: A bibliometric citation meta-analysis. J. Bus. Res. 2015, 68, 380–390. [Google Scholar] [CrossRef]
- Snyder, H. Literature review as a research methodology: An overview and guidelines. J. Bus. Res. 2019, 104, 333–339. [Google Scholar] [CrossRef]
- Vieira, E.S.; Gomes, J.A.N.F. A comparison of Scopus and Web of science for a typical university. Scientometrics 2009, 81, 587–600. [Google Scholar] [CrossRef]
- Apriliyanti, I.D.; Alon, I. Bibliometric analysis of absorptive capacity. Int. Bus. Rev. 2017, 26, 896–907. [Google Scholar] [CrossRef]
- Alon, I.; Anderson, J.; Munim, Z.H.; Ho, A. A review of the internationalization of Chinese enterprises. Asia Pac. J. Manag. 2018, 35, 573–605. [Google Scholar] [CrossRef]
- Zamore, S.; Djan, K.O.; Alon, I.; Hobdari, B. Credit Risk Research: Review and Agenda. Emerg. Mark. Financ. Trade 2018, 54, 811–835. [Google Scholar] [CrossRef]
- Patel, R.; Goodell, J.W.; Oriani, M.E.; Paltrinieri, A.; Yarovaya, L. A bibliometric review of financial market integration literature. Int. Rev. Financ. Anal. 2022, 80, 102035. [Google Scholar] [CrossRef]
- Bajaj, V.; Kumar, P.; Singh, V.K. Linkage dynamics of sovereign credit risk and financial markets: A bibliometric analysis. Res. Int. Bus. Financ. 2022, 59, 101566. [Google Scholar] [CrossRef]
- Aria, M.; Cuccurullo, C. bibliometrix: An R-tool for comprehensive science mapping analysis. J. Informetr. 2017, 11, 959–975. [Google Scholar] [CrossRef]
- Aria, M.; Misuraca, M.; Spano, M. Mapping the Evolution of Social Research and Data Science on 30 Years of Social Indicators Research. Soc. Indic. Res. 2020, 149, 803–831. [Google Scholar] [CrossRef]
- MCobo, M.J.; López-Herrera, A.G.; Herrera-Viedma, E.; Herrera, F. An approach for detecting, quantifying, and visualizing the evolution of a research field: A practical application to the Fuzzy Sets Theory field. J. Informetr. 2011, 5, 146–166. [Google Scholar] [CrossRef]
- Sanchez-Nunez, P.; Cobo, M.J.; Heras-Pedrosa, C.D.L.; Pelaez, J.I.; Herrera-Viedma, E. Opinion Mining, Sentiment Analysis and Emotion Understanding in Advertising: A Bibliometric Analysis. IEEE Access 2020, 8, 134563–134576. [Google Scholar] [CrossRef]
- Potter, W.J.; Levine-Donnerstein, D. Rethinking validity and reliability in content analysis. J. Appl. Commun. Res. 1999, 27, 258–284. [Google Scholar] [CrossRef]
- Xu, X.; Chen, X.; Jia, F.; Brown, S.; Gong, Y.; Xu, Y. Supply chain fi nance: A systematic literature review and bibliometric analysis. Int. J. Prod. Econ. 2018, 204, 160–173. [Google Scholar] [CrossRef]
- Acedo, F.J.; Casillas, J.C. Current paradigms in the international management field: An author co-citation analysis. Int. Bus. Rev. 2005, 14, 619–639. [Google Scholar] [CrossRef]
- Baruník, J.; Kočenda, E.; Vácha, L. Asymmetric volatility connectedness on the forex market. J. Int. Money Financ. 2017, 77, 39–56. [Google Scholar] [CrossRef]
- Bouri, E.; de Boyrie, M.E.; Pavlova, I. Volatility transmission from commodity markets to sovereign CDS spreads in emerging and frontier countries. Int. Rev. Financ. Anal. 2017, 49, 155–165. [Google Scholar] [CrossRef]
- Bouri, E.; Lucey, B.; Saeed, T.; Vo, X.V. Extreme spillovers across Asian-Pacific currencies: A quantile-based analysis. Int. Rev. Financ. Anal. 2020, 72, 101605. [Google Scholar] [CrossRef]
- Mensi, W.; Hammoudeh, S.; Yoon, S.-M. Structural breaks, dynamic correlations, asymmetric volatility transmission, and hedging strategies for petroleum prices and USD exchange rate. Energy Econ. 2014, 48, 46–60. [Google Scholar] [CrossRef]
- Balcilar, M.; Demirer, R.; Gupta, R.; Wohar, M.E. The effect of global and regional stock market shocks on safe haven assets. Struct. Chang. Econ. Dyn. 2020, 54, 297–308. [Google Scholar] [CrossRef]
- Maghyereh, A.I.; Awartani, B.; Bouri, E. The directional volatility connectedness between crude oil and equity markets: New evidence from implied volatility indexes. Energy Econ. 2016, 57, 78–93. [Google Scholar] [CrossRef]
- Liu, L.; Chen, C.-C.; Wan, J. Is world oil market ‘one great pool’ ?: An example from China’s and international oil markets. Econ. Model. 2013, 35, 364–373. [Google Scholar] [CrossRef]
- Mensi, W.; Hammoudeh, S.; Nguyen, D.K.; Yoon, S.-M. Dynamic spillovers among major energy and cereal commodity prices. Energy Econ. 2014, 43, 225–243. [Google Scholar] [CrossRef]
- Maghyereh, A.I.; Awartani, B.; Tziogkidis, P. Volatility spillovers and cross-hedging between gold, oil and equities: Evidence from the Gulf Cooperation Council countries. Energy Econ. 2017, 68, 440–453. [Google Scholar] [CrossRef]
- Chang, C.-L.; McAleer, M.; Tansuchat, R. Analyzing and forecasting volatility spillovers, asymmetries and hedging in major oil markets. Energy Econ. 2010, 32, 1445–1455. [Google Scholar] [CrossRef]
- Wu, F. Stock market integration in East and Southeast Asia: The role of global factors. Int. Rev. Financ. Anal. 2019, 67, 101416. [Google Scholar] [CrossRef]
- Kim, S.-J.; Moshirian, F.; Wu, E. Evolution of international stock and bond market integration: Influence of the European Monetary Union. J. Bank. Financ. 2006, 30, 1507–1534. [Google Scholar] [CrossRef]
- Wang, Z.; Li, Y.; He, F. Asymmetric volatility spillovers between economic policy uncertainty and stock markets: Evidence from China. Res. Int. Bus. Financ. 2020, 53, 101233. [Google Scholar] [CrossRef]
- Mokni, K.; Hammoudeh, S.; Ajmi, A.N.; Youssef, M. Does economic policy uncertainty drive the dynamic connectedness between oil price shocks and gold price? Resour. Policy 2020, 69, 101819. [Google Scholar] [CrossRef]
- Kumar, S.; Pradhan, A.K.; Tiwari, A.K.; Kang, S.H. Correlations and volatility spillovers between oil, natural gas, and stock prices in India. Resour. Policy 2019, 62, 282–291. [Google Scholar] [CrossRef]
- Mensi, W.; Hammoudeh, S.; Vo, X.V.; Kang, S.H. Volatility spillovers between oil and equity markets and portfolio risk implications in the US and vulnerable EU countries. J. Int. Financ. Mark. Inst. Money 2021, 75, 101457. [Google Scholar] [CrossRef]
- Bouri, E. Oil volatility shocks and the stock markets of oil-importing MENA economies: A tale from the financial crisis. Energy Econ. 2015, 51, 590–598. [Google Scholar] [CrossRef]
- Malik, F.; Umar, Z. Dynamic connectedness of oil price shocks and exchange rates. Energy Econ. 2019, 84, 104501. [Google Scholar] [CrossRef]
- Li, L.; Yin, L.; Zhou, Y. Exogenous shocks and the spillover effects between uncertainty and oil price. Energy Econ. 2016, 54, 224–234. [Google Scholar] [CrossRef]
- Kim, J.-M.; Jung, H. Dependence Structure between Oil Prices, Exchange Rates, and Interest Rates. Energy J. 2018, 39, 233–258. [Google Scholar] [CrossRef]
- Li, Y.; Huang, J.; Gao, W.; Zhang, H. Analyzing the time-frequency connectedness among oil, gold prices and BRICS geopolitical risks. Resour. Policy 2021, 73, 102134. [Google Scholar] [CrossRef]
- Ji, Q.; Bouri, E.; Lau, C.K.M.; Roubaud, D. Dynamic connectedness and integration in cryptocurrency markets. Int. Rev. Financ. Anal. 2018, 63, 257–272. [Google Scholar] [CrossRef]
- Ji, Q.; Bouri, E.; Kristoufek, L.; Lucey, B. Realised volatility connectedness among Bitcoin exchange markets. Financ. Res. Lett. 2019, 38, 101391. [Google Scholar] [CrossRef]
- Kang, S.H.; McIver, R.; Yoon, S.-M. Dynamic spillover effects among crude oil, precious metal, and agricultural commodity futures markets. Energy Econ. 2017, 62, 19–32. [Google Scholar] [CrossRef]
- Li, H.; Majerowska, E. Testing stock market linkages for Poland and Hungary: A multivariate GARCH approach. Res. Int. Bus. Financ. 2008, 22, 247–266. [Google Scholar] [CrossRef]
- Yarovaya, L.; Brzeszczyński, J.; Lau, C.K.M. Intra- and inter-regional return and volatility spillovers across emerging and developed markets: Evidence from stock indices and stock index futures. Int. Rev. Financ. Anal. 2016, 43, 96–114. [Google Scholar] [CrossRef]
- Ederington, L.H.; Guan, W. How asymmetric is U.S. stock market volatility? J. Financ. Mark. 2010, 13, 225–248. [Google Scholar] [CrossRef]
- Liu, Z.; Shi, X.; Zhai, P.; Wu, S.; Ding, Z.; Zhou, Y. Tail risk connectedness in the oil-stock nexus: Evidence from a novel quantile spillover approach. Resour. Policy 2021, 74, 102381. [Google Scholar] [CrossRef]
- Mensi, W.; Maitra, D.; Vo, X.V.; Kang, S.H. Asymmetric volatility connectedness among main international stock markets: A high frequency analysis. Borsa Istanb. Rev. 2021, 21, 291–306. [Google Scholar] [CrossRef]
- Ngene, G.M. What drives dynamic connectedness of the U.S equity sectors during different business cycles? N. Am. J. Econ. Financ. 2021, 58, 101493. [Google Scholar] [CrossRef]
- Alqahtani, A.; Klein, T. Oil price changes, uncertainty, and geopolitical risks: On the resilience of GCC countries to global tensions. Energy 2021, 236, 121541. [Google Scholar] [CrossRef]
- Disli, M.; Nagayev, R.; Salim, K.; Rizkiah, S.K.; Aysan, A.F. Aysan, In search of safe haven assets during COVID-19 pandemic: An empirical analysis of different investor types. Res. Int. Bus. Financ. 2021, 58, 101461. [Google Scholar] [CrossRef]
- Bekiros, S.; Hedström, A.; Jayasekera, E.; Mishra, T.; Uddin, G.S. Correlated at the Tail: Implications of Asymmetric Tail-Dependence Across Bitcoin Markets. Comput. Econ. 2021, 58, 1289–1299. [Google Scholar] [CrossRef]
- BenSaïda, A.; Litimi, H. Financial contagion across G10 stock markets: A study during major crises. Int. J. Financ. Econ. 2021, 26, 4798–4821. [Google Scholar] [CrossRef]


Disclaimer/Publisher’s Note: The statements, opinions and data contained in all publications are solely those of the individual author(s) and contributor(s) and not of MDPI and/or the editor(s). MDPI and/or the editor(s) disclaim responsibility for any injury to people or property resulting from any ideas, methods, instructions or products referred to in the content. |
© 2023 by the authors. Licensee MDPI, Basel, Switzerland. This article is an open access article distributed under the terms and conditions of the Creative Commons Attribution (CC BY) license (https://creativecommons.org/licenses/by/4.0/).