INTRODUCTION
The purpose of this study was to examine changes in maximum tongue strength, as well as masseter activity and oropharyngeal transit time during swallowing, across the lifespan in people without known disorders or dysfunctions. This cross-sectional study was part of a larger study, The Idaho State University Tongue Thrust Project (
Ashbocker et al., 2009-2013), as an aggregation of 17 previously unpublished studies of swallowing function.
Swallowing function does not simply develop but rather evolves through interaction with the environment. For example, the mandibular corpus undergoes rapid remodeling between the ages of 3 and 5 years, with bone being added to the posterior and inferior aspects. In non-humans, the introduction of hard food has been shown to promote mandibular growth (
Enomoto et al., 2010;
Karamani et al., 2022), reflecting clinical knowledge in humans of the critical nature of the transition to a hard food diet. Similarly, the hard palate is relatively vaulted at birth. Bone is added to the oral surface and resorbed from the nasal surface, resulting in caudal palatal growth (
Enlow & Bang, 1965), a remodeling process that is also observed in the region of the alveolar process (
Arat & Rübendüz, 2005). These postnatal remodeling processes parallel the progression of diet from liquid to solid food, a shift that results in chewing rather than open-mouth sucking. This change, in turn, results in the mature tongue resting posture that spreads the dental arch and promotes arch alignment (
Jan et al., 2023;
Markus et al., 1992). Bite force increases progressively from 3 years of age until adulthood (
Edmonds & Glowacka, 2020;
Kamegai et al., 2005), and the use of masticatory muscles appears to have an impact on bone development (
Buvinic et al., 2021;
Pepicelli et al., 2005;
Rauch, 2005), with failure to develop a rotatory chewing pattern linked to a dolichofacial (vertically elongated) pattern. There appears to be a sensitivity period for taste and food acceptance, with receptivity to new tastes declining after 6 months (
Harris & Mason, 2017). Similarly, a sensitivity period for mastication is found in infants between 6–10 months of age (
Delaney & Arvedson, 2008;
Northstone et al., 2001); failure to capitalize on that period will often result in appearance of idiosyncratic food preferences by 15 months of age.
Beyond the structural effects, there appears to be a neurophysiological impact of normal mastication and deglutition.
Barlow and Estep (
2006) report that sensory deprivation arising from mechanical ventilation alters subsequent suck ability, potentially altering the development of central pattern generators (CPGs) for mastication and respiration. This interruption effect was demonstrated for respiration, as the CPG for respiration begins prenatally and continues to develop as the newborn and infant experience independent breathing. Much as a premature infant who must receive ventilator support may fail to develop fully mature neurophysiological support for the CPG and respiratory muscle development (e.g.,
Dassios et al., 2022), it is possible that the CPGs for sucking, chewing, and swallowing may be underdeveloped in those unable to complete the skilled practice of these actions. Orofacial myofunctional disorders (OMDs) and other swallowing disorders arising from diverse issues can have a significant impact on health and quality of life that can persist into adulthood.
Orofacial Myofunctional and Swallowing Disorders
OMDs are believed to result from a combination of factors, including the oral musculature and structure, genetics, and environmental influences that disrupt the normal development of the orofacial complex (e.g.,
D’Onofrio, 2019). Similar to oropharyngeal dysphagia, OMDs can affect individuals of all ages, including those with uncorrected conditions, such as tethered oral tissues, craniofacial disorders, sleep-disordered breathing, and facial trauma. OMDs encompass a range of conditions, including tongue thrusting, ankyloglossia, labial ties, poor jaw-tongue-lip dissociation, atypical tongue or lip resting posture, decreased mastication and bolus management, and more.
Hanson and Mason (
2003) defined OMDs as “abnormal patterns of use of the mouth and face and their relationships with dentition, speech, and vegetative function… [and a] collection of oral patterns that are variably related to psychological and physiological factors” (p. 3).
Mason (
2005) and others (e.g.,
Kilinc & Mansiz, 2023) further described OMDs as resulting in significant changes in posture and function. Citing Mason, the American Speech-Language-Hearing Association (
ASHA, n.d.) states in its online Practice Portal that OMDs are “patterns involving oral or orofacial musculature that interfere with normal growth, development, or function of orofacial structures, or call attention to themselves.” The site also notes that OMDs may co-occur with speech and swallowing disorders.
Oral-stage dysphagia has been described as a “transfer dysphagia” in the sense that it is characterized by difficulties in the oral preparation and oral phases of swallowing, which then affect the transition to swallow initiation during the pharyngeal phase (
Lembo, 2014). This difficulty can be caused by several underlying disease conditions, such as neurological, structural, iatrogenic, and idiopathic disorders, as well as age-related alterations in structure and function. Dysphagia is typically a symptom of disease rather than a disorder itself, in the same fashion that the oral pattern apparent in orofacial myofunctional disorders is likely a symptom of an underlying structural or functional maladaptation.
The process of chewing and swallowing is facilitated by the coordination of facial muscles. Forming a bolus is the initial step of the oral preparatory phase, which necessitates the cooperation of the lips, teeth, and tongue (
Mankekar, 2015). The tongue plays a crucial role in the swallowing process by manipulating, preparing, forming, and transferring food. The masseter muscle, along with the temporalis, medial, and lateral pterygoid muscles, compose the muscles of mastication and support the chewing process by moving the jaw. The masseter muscle also functions as a mandibular elevator, and along with the lips, closes the mouth and creates the necessary intraoral pressure to move the bolus (
Bahia, 2022). A decline in muscle mass (sarcopenia) begins at 20 years of age (
Nair, 2005), and loss of elasticity of connective tissue becomes marked around 40 years of age (
Albert et al., 2007). Both of these changes can result in reduced strength and range of motion, which can impede the efficiency of swallowing food through the upper digestive system (
Sura et al., 2012). The overall implication is that age-related changes may result in increased risk of dysphagia, beginning between 60 and 65 years of age (
Ney et al., 2009;
Sura et al., 2012). Age-related loss of muscle mass (sarcopenia) begins at 20 years of age in humans (
Nair, 2005). Tongue strength and velum function decrease with age (
Machida et al., 2017), translating into reductions in tongue volume, strength, and endurance for the aged, particularly for those of 79 years of age (
Crow & Ship, 1996;
Machida et al., 2017).
Clinical Assessment of OMD and Oropharyngeal Dysphagia (OPD)
Historically, the clinical swallow evaluation used for both OMD and OPD largely consists of an oral mechanism examination that includes behavioral observations, such as determining the severity of lingual deviation in isolated movement, strength and timing of swallowing, and palpating the contracted buccinator or masseter muscles to presumably ascertain weakness and/or reduced muscle tone. Many clinical characteristics are shared between OMD and OPD assessments, including evaluation for orofacial muscular weakness, abnormal oral phase transit time, avoidance of certain foods, poor bolus formation, multiple swallows per bolus, and residue after the swallow. Both OPD and OMD assessments collect a detailed client history, including chart review and patient/caregiver interview, and a clinical evaluation consisting of an oral mechanism examination and
per os (PO) trials of liquid and solid boluses (
Logemann, 1998), whereas OMD assessments will consider oral and facial structure and function. In both cases, the clinical evaluation is looking for deviations in structure and function, as well as signs of disorder indicated by the presence of residue and muscular weakness. In addition, both OMD and OPD assessments provide stimuli to measure function, such as a series of bolus swallows. In the case of OPD, clinicians closely monitor perceptual signs of bolus penetration or aspiration, whereas in the OMD assessment the clinician focuses on abnormal oral behaviors, such as forward thrusting of the tongue while swallowing.
In clinical practice, orofacial myofunctional therapists (OMTs) and speech-language pathologists (SLPs) can innovate and borrow from other healthcare disciplines to address assessment gaps and enable objective measurement for tracking change. For instance, some SLPs use the Mallampati score, a visual rating of tongue base size and oropharyngeal space that predicts ease of tracheal intubation (
Corrêa, 2021;
Mallampati et al., 1985;
Samsoon & Young, 1987). In the examination of OMDs by otolaryngologists, the Orofacial Examination Test with Scores (OMES) by
de Felicio and Ferreira (
2008) remains a reliable tool (
Kilinc & Mansiz, 2023). Therapists practicing in the areas of OMD or dysphagia may use baseline oral function measurement tools, such as a hanging scale to measure labial strength under resistance (e.g.,
Dworkin, 1991), the Quick Tongue-Tie Assessment Tool (QTT) (e.g.,
Yoon et al., 2017), or anterior tongue range of motion ratio (TIP-TRMR) or posterior tongue mobility using lingual-palatal suction (TRMR-LPS) (
Zaghi et al., 2021) for assessing ankyloglossia. Lingual strength is frequently measured by the IOPI (IOPI Medical, Woodinville, WA) or Tongueometer (E2 Scientific, Covina, CA) to measure lingual or labial strength.
Traditionally, the oral mechanism examination (OME) is an intrinsic element of the clinical evaluation of both OMD and OPD. Both evaluations for OMD and OPD utilize food or liquid trials, and the clinical evaluation for OPD adds palpation to estimate oropharyngeal transit time. In most settings there is little or no instrumental measurement, thereby increasing error through subjectivity. The critical emphasis on evidence-based practice has, at its root, the need for initial data that are as accurate as possible. Instrumental measurement removes a large source of observational variability.
Vaiman, Eviatar, and Segal (
2004) stated that there is an increasing need to develop quantifiable and noninvasive assessment measures of swallowing disorders, which requires a solid base of normative swallowing data, including lingual and orofacial muscular strength, as well as swallow timing. This study sought to contribute data on age-related changes on variables, using objective lingual and mandibular measurements for the clinical evaluation of OMD and OPD (
Logemann et al., 2002).
Instrumental Measures
The significance of tongue function and strength in the process of swallowing is indisputable (e.g.,
Clark et al., 2003;
Vanderwegen et al., 2013), and tongue strength is often measured subjectively during the OME using the perception of force on a tongue depressor as the metric (
Clark et al., 2003;
Solomon, 2004). While Clark et al. found that subjective measures of tongue strength had a moderate relationship with objective measures using the IOPI, the use of an instrument to provide objective measurement significantly enhances the likelihood of both reliable and valid assessments (
Solomon, 2004;
Youmans et al., 2009).
As with all muscle groups, the tongue is subject to changes during both development and aging. The age-related differentiation of tongue strength has been demonstrated by various studies.
Potter and Short (
2009) found that anterior tongue strength increased with age, with the greatest changes in strength occurring between 3–8 years, and with no clear differences between sexes in this age range, as did
Song (
2015) using unspecified IOPI bulb placement. At the other end of the age spectrum,
Crow and Ship (
1996) found that individuals over 79 years of age had significantly lower anterior tongue strength, with no differences found within the larger late-adolescent/adult grouping. Nonetheless, regression analysis revealed that the age of males predicted tongue strength. Further, women overall had lower tongue strength than men.
Vanderwegen et al. (
2013) confirmed these results and additionally demonstrated that posterior tongue strength was lower than anterior strength across the adult lifespan through 70 years of age. Notably, the authors found that anterior tongue strength in men began its decline at 60 years of age. In a meta-analysis of 44 studies on tongue and hand strength,
Arakawa-Kaneko et al. (
2022) confirmed that adults over 60 years of age had significantly lower tongue strength than those under 60, and that the women in the younger group had lower tongue strength than men.
Adams et al. (
2013) found similar results in their meta-analysis for those under and greater than 60 years of age, as well as finding a similar strength gradient for both men and women between these two age groups.
Stierwalt and Youmans (
2007) found both age and sex differences using unspecified tongue position, with the youngest participants (19 – 39 years) having significantly greater tongue strength than the oldest group (6091 years). Men had greater tongue strength than women. The finding of age and sex differences is not universal, however, with
Vitorino (
2010) finding that a smaller sample of Portuguese men and women showed no differences among 20–40, 41–60, and 61–80 age groups. The Vitorino sample size and distribution and general placement of the IOPI bulb (not differentiating anterior and posterior placement) could account for inconsistent results among the studies.
Another prominent sign and contributor to swallowing deficit is increased swallowing duration (
Vaiman, Segal, & Eviatar, 2004). Increased transit time has been associated with weak lingual and orofacial muscles in individuals with Duchenne muscular dystrophy (
van den Engel-Hoek et al., 2013) and amyotrophic lateral sclerosis (
Hiraoka et al., 2017) who have OPD. With weak oral musculature being a hallmark of OMD, it is possible that this weakness-transit time relationship will forge a link between these two disorders. The clinical evaluation of swallow timing is typically based on subjective submental palpation for tongue muscle activation and simultaneous elevation of the thyroid cartilage, with the highly refined videofluoroscopic swallowing study (VFSS) serving as one of the gold standards for objective measurement of swallowing (e.g.,
Steele et al., 2023). A compromise instrumental measure of swallow timing was developed by
Crary et al. (
2006), involving the use of surface electromyography (sEMG) to identify the onset and offset of the swallow. Crary et al. showed that submental and thyroid lamina electrode placement provided a reliable means of measuring swallow timing that overcomes much of the subjectivity of the 5-finger palpation method.
Ono et al. (
2009) found that the submental anterior digastricus was the first muscle group to be activated during the swallow.
Vaiman and Eviatar (
2009) recommended sEMG as a screening tool for dysphagia, and
Stepp (
2012) recognized the potential for use of sEMG in differentiating groups for swallowing assessment and research.
Begnoni et al. (
2019) examined muscular activity of the masseter, temporalis, and submental complex during swallowing, and found that sEMG was a reliable method of differentiating normal and abnormal swallowing, a finding echoed by
Monaco et al. (
2008).
Gioia et al. (
2021) used masseter activity as an indicator of swallow function between individuals with normal and atypical swallows, finding that measures of masseter and temporalis activation provided a strong differentiation of the two groups for a 10 cc thin-liquid bolus.a
sEMG has been utilized to assess differences in swallow function between older and younger individuals.
Poorjavad et al. (
2017) found that sEMG of the masseter, submental, and infrahyoid muscles was a reliable indicator of swallowing function in older and younger individuals, while
Pernambuco et al. (
2011) found significant differences in level of activation based on side of the face, and that the sEMG activity varied based on bolus size for thin liquids. sEMG of the masseter has also been shown to be among the most useful muscles for differentiation of individuals with normal swallowing from those with dysphagia (
Roldan-Vasco et al., 2023), as well as between individuals with multiple sclerosis and healthy controls (
Santos et al., 2019).
Vaiman, Segal, and Eviatar (
2004) provided normative data for the orbicularis oris, masseter, submental and infrahyoid muscles during water swallows, and
Kang et al. (
2016) found that older individuals have greater mean masseter activation while swallowing hard and soft boluses than their younger counterparts. A systematic review of swallowing research in healthy older participants also noted the importance of factoring in the effects of aging on the swallow, but was only able to clearly delineate changes that occur in swallow initiation with aging (
Namasivayam-MacDonald et al., 2018).
The aim of the present study was to examine lingual strength, swallow timing, and swallow-related masseter activity in participants without known OMD or OPD to contribute normative data to the literature and to further examine the effects of normal development and aging on these components in individuals with normal swallowing function. The research questions were as follows:
Are there significant differences among age categories (young, late-adolescent/adult, older adult) and sex (male, female) on measures of anterior and posterior tongue strength?
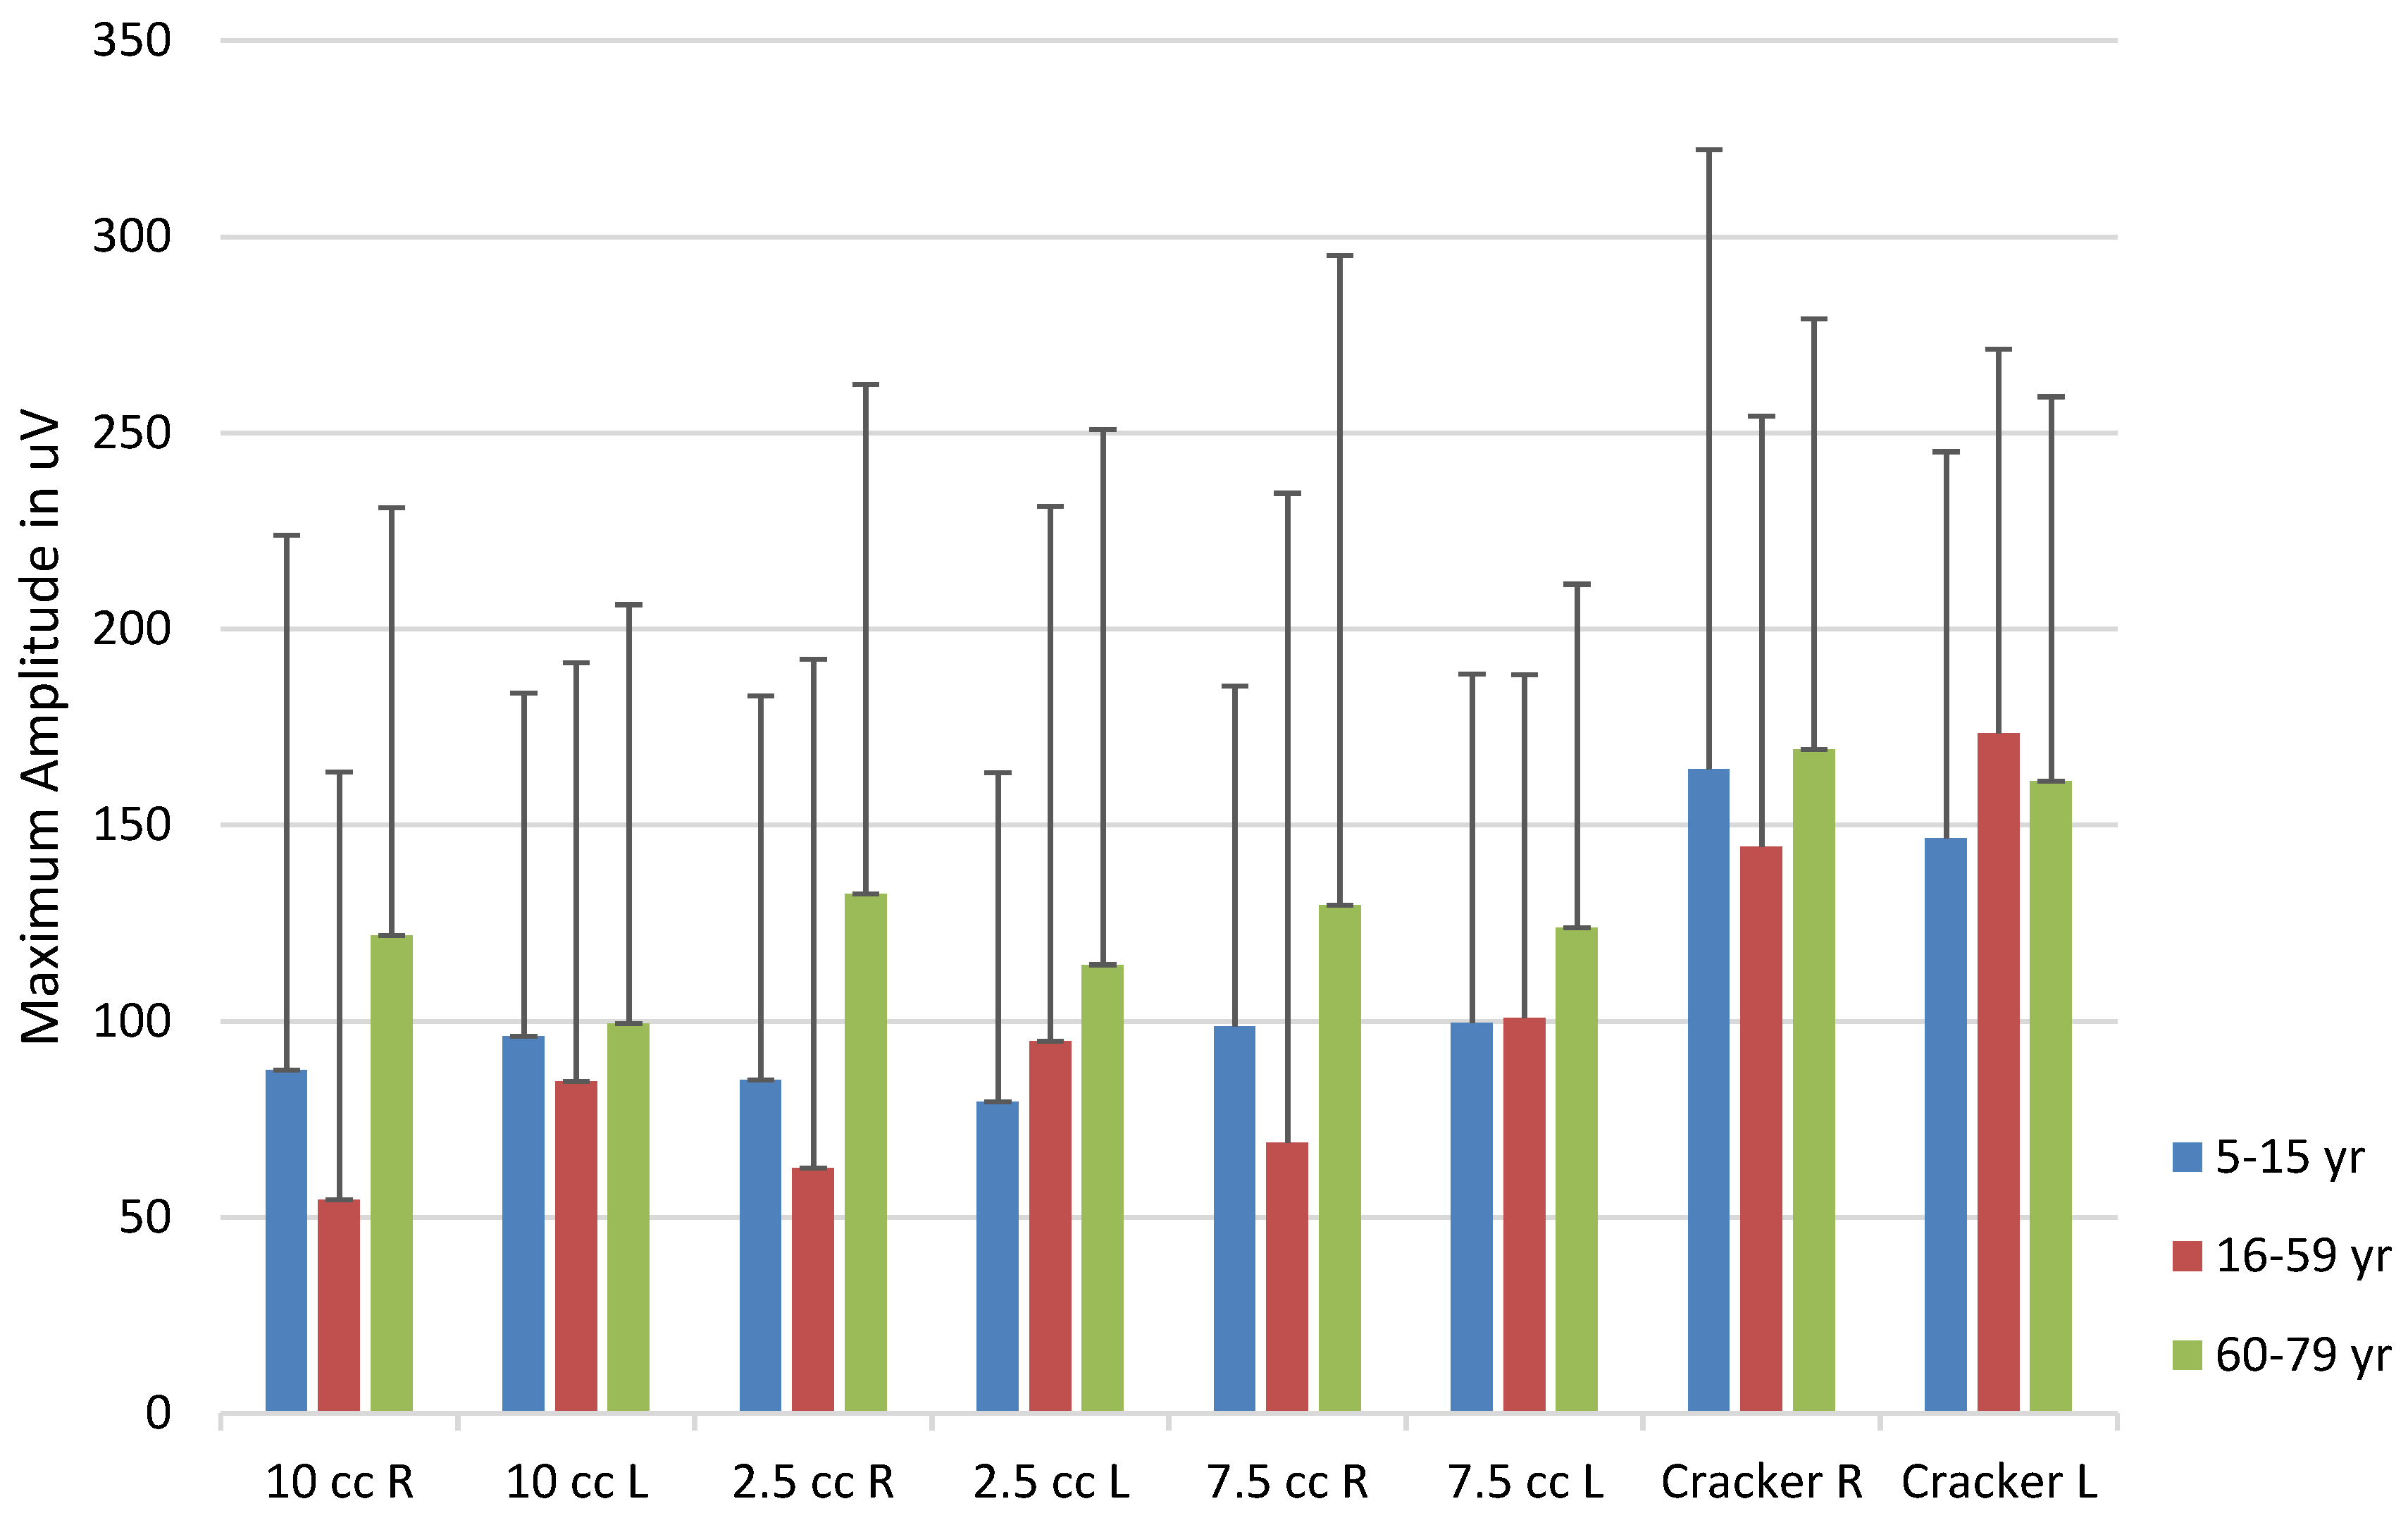
Are there significant differences among age categories (young, late-adolescent/adult, older adult) and sex (male, female) on the maximum amplitude of masseter muscle activity during swallowing of four bolus consistencies (10 cc water, 2.5 cc pudding, 7.5 cc pudding, cracker)?
Are there significant differences among age categories (young, late adolescent/adult, older adult) and sex (male, female) on measures of swallow timing during swallowing of the four bolus consistencies?
Are significant relationships revealed among the dependent variables?
Materials and Methods
This study was part of a larger project examining oral function and signs of orofacial myofunctional disorders. Only those measures utilized in the present report are discussed in the methodology. This study examined changes in tongue strength, as well as masseter activity and oropharyngeal transit time during swallowing of four bolus consistencies across the lifespan, using a cross-sectional design. Data were collated and analyzed from 17 previous studies of swallowing function totaling 409 participants, all part of the Idaho State University Tongue Thrust Project (
Ashbocker et al., 2009-2013).
Participants
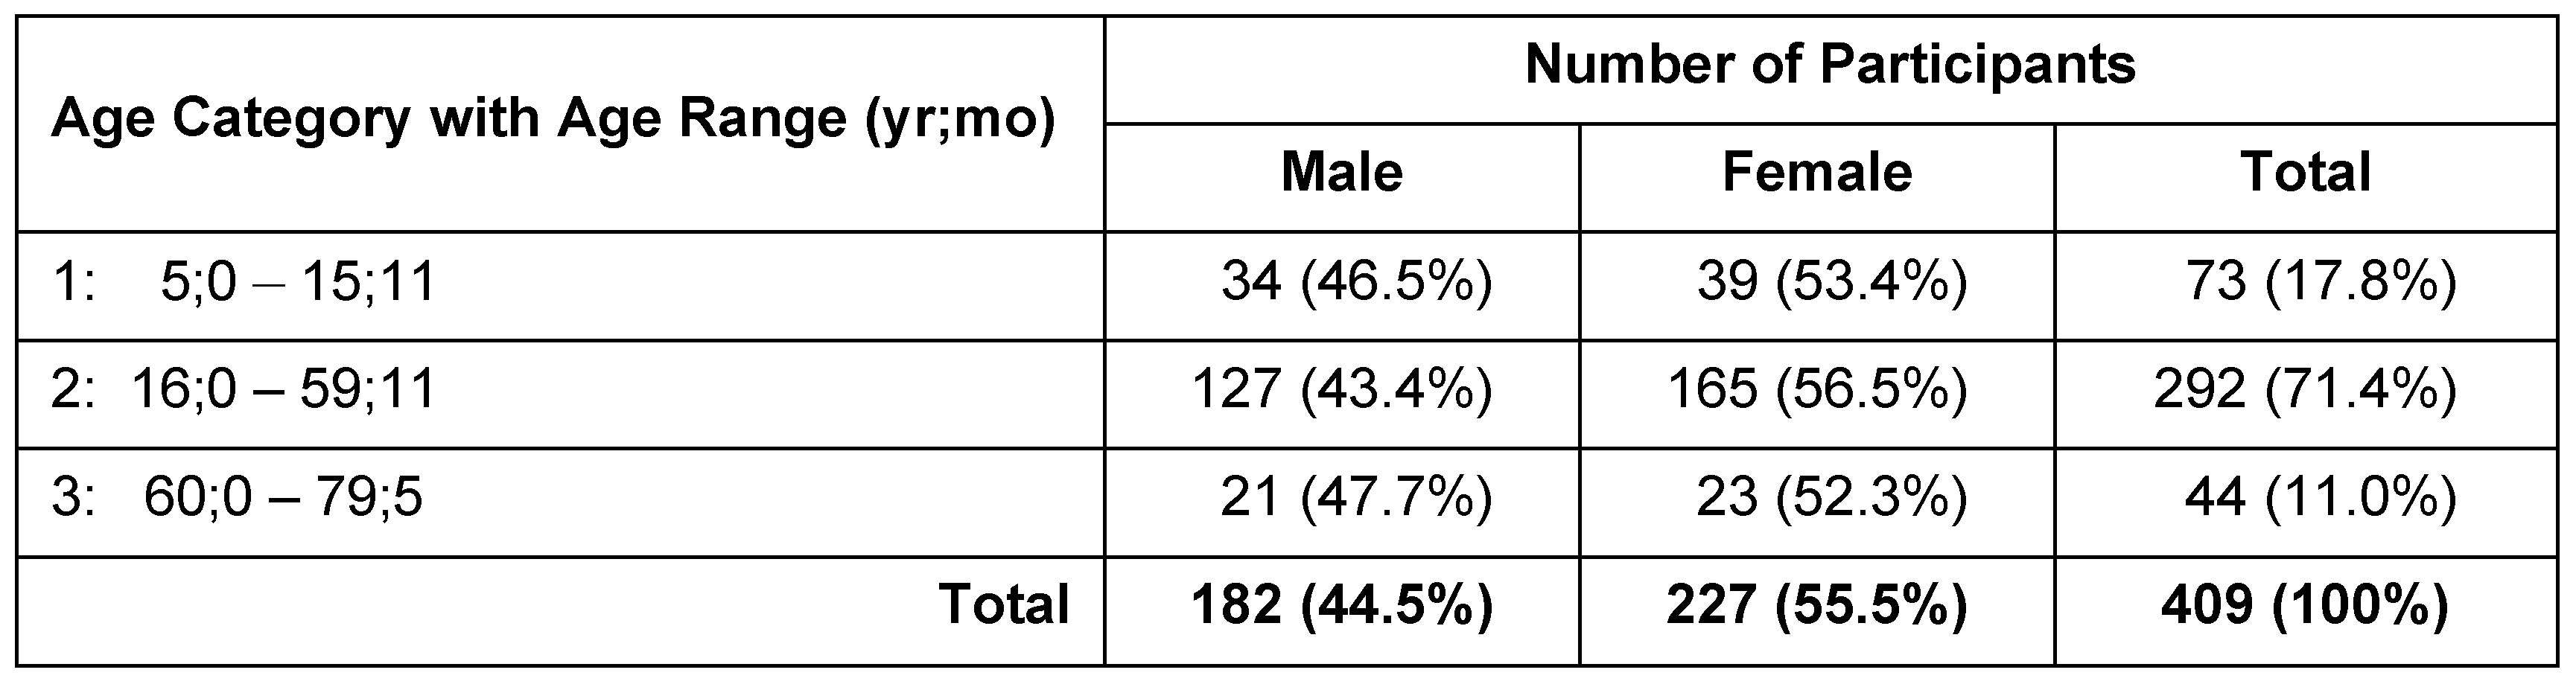
Participants were recruited by a convenience sample and included 409 individuals (182 males; 227 females) with no known OMD or OPD. All studies comprising this research were reviewed and approved by the Idaho State University Institutional Review Board and informed consent from participant obtained before data collection commenced. Participants ranged in age from 5;0 (yr;mo) – 79;5 (Med = 33;4, M = 34;11). Stratified sampling was done in 5-year age groups to ensure a relatively even spread of ages across the sample, with the exception of the
> 60-year-old group, which ranged from 60;0 to 79;5 (Med = 62;6, M = 65;4). For analysis purposes, participants were further placed into one of three age categories (
Table 1). Age Category 1 (children) comprised 34 boys and 39 girls ages 5;0 – 15;11 (Med = 9;11, M = 9;11). Age Category 2 (adults) was the largest group, comprised 127 boys and men, and 165 girls and women, ages 16;0 – 59;11 (Med = 35;4; M = 36;4). Age Category 3 consisted of 21 men and 23 women, ages 60;0 – 79;5 (Med = 62;7, M = 65;4).
The cutoff between the two younger groups was chosen in an effort to capture the post-birth developmental period for oral growth and swallowing function, while avoiding the relatively steady-state period of adulthood. Mandibular growth is essentially complete by 15 years of age for females and 18 for males (
Shahzad, 2020), while the maxilla has most of its vertical growth between 7 – 15 yr (
Chen et al., 2003;
Enlow & Bang, 1965;
Laowansiri et al., 2013;
Nahhas et al., 2014;
Ochoa & Nanda, 2004). Antero-posterior maxillary growth has a sudden acceleration between 6 – 18 yr, although this dimension continues to develop slowly into adulthood by between 1 – 2 mm/yr. The female maxillae reach stable adult size before the male (
Delaire, 1997;
Ochoa & Nanda, 2004;
Vorperian et al., 2005). The oral cavity generally reaches its adult size by age 18 yr (
Vorperian et al., 2005,
2009), while the pharynx shows maximum growth between 8 – 12 yr, with declining rate of growth beyond that. While appealing, the researchers felt that adoption of a 20-yr age cutoff would capture more adult characteristics than developmental aspects. The 16-yr age cutoff was a compromise that sought to balance periods of rapid growth from the more steady-state adult period. Similarly, some researchers have used 65 years of age (e.g.,
Hazan, 2017, for speaking rate) as the starting age for their older group in research although the 60-year starting age has many proponents. Age cutoffs of 60 – 61 yr have been frequently employed in studies of speech diadochokinesis (
Kianfar et al., 2017), voice fundamental frequency and formant changes (
Eichhorn et al. 2018), tongue pressure generation during swallowing (
Yokoyama et al., 2000;
Youmans & Stierwalt, 2006), and swallow timing (
Im et al., 2012;
Pongpipatpaiboon et al., 2018).
Robbins et al. (
1992) and
Tracy et al. (
1989) observed measurable changes around the age of 60 yr. We chose the 60-year age cutoff as a reflection of research examining structural and functional changes occurring at the onset of the 6
th decade.
Candidates for participation in the study were excluded if they had received a diagnosis of an OMD, or had a history of neurogenic or structural impairments to the head or neck, as indicated by observation, subject report, and demographic survey (
Gardner, 2008). All individuals with a history of neurogenic disorders or who had undergone loss of consciousness due to trauma that lasted more than 5 minutes were excluded from the sample as well. Candidates who had a mild TBI with no reported motor or cognitive sequelae were retained in the study. Upon entering the study, participants completed a demographic and health-history survey (Online Supplement A).
Instrumentation and Materials
Two clinical assessment protocols (Idaho State University Tongue Thrust Protocol and the Idaho State University Clinical Evaluation Protocol) were merged to create the protocol used by all researchers in this study (Online Supplement B). The senior researcher (JAS) supervised creation of a training video for all researchers to ensure fidelity with the protocol within the individual studies. The IOPI (Breakthrough Model 1.5) was used to measure anterior and posterior tongue maximum pressure generation (Pmax). The IOPI device measures pressure generated by compression of the IOPI bulb, resulting in an output in kilopascals (kPa). Compression with maximum muscular effort was used as a measure of tongue strength. The IOPI was calibrated per the manufacturer’s instructions prior to beginning collection of each participant’s data.
A two-channel Infiniti Electromyograph (Myotrac Infiniti, Thought Technology, Montreal, Quebec, Canada) using surface electrodes was used to assess masseter activity during swallowing, as well as to aid decision-making about oropharyngeal transit time, thus providing an electrical measurement of muscle activity in microvolts (µV). The sEMG system senses the electrical activity of the muscle groups over which the surface electrodes are placed (raw sEMG). The device uses a sampling rate of 2048 samples/s and 14- bit output. Listed input error for the device is ± 5% +0.6µV RMS. The device calculates a root mean square (RMS) signal by rectifying the raw signal and generating an amplitude signal from the rectified signal to remove signal jitter. When measuring swallow timing, the onset of the sEMG trace (temporal component) was used to indicate initiation of the swallow. When measuring masseter activity, the maximum signal amplitude was measured, and the average of those measures were used in calculations.
The clinical swallowing evaluation materials included water, sugar-free chocolate pudding (Hunt’s Snack Pack), and crackers (Triscuit Original by Nabisco). A 10-cc syringe was used to deliver the liquid bolus and a teaspoon (5 cc) measuring spoon was used to measure pudding and water volumes. Other clinical materials included examination gloves, tongue depressors, mildly abrasive NuPrep skin preparation solution (NuPrep Skin Prep Gel by Weaver and Co.), alcohol swabs, gauze pads, and conductive gel for electrode placement (Ten 20™ Conductive Gel and Paste by Weaver and Co.).
Procedures
Three counterbalanced protocols were used to control for order effects in the studies. These protocols provided counterbalanced order of presentation of the IOPI, EMG masseter, and EMG timing measures, and as participants entered each study they were assigned to one of the three protocols. Males and females were treated as independent groups for purposes of protocol assignment. Swallowing data were primarily collected by speech-language pathology graduate students at Idaho State University as part of their individual thesis studies (
Ashbocker, 2009;
Astel, 2012;
Dahl, 2009;
Dallaserra, 2013;
Davis-Voldbaek, 2010;
Erickson, 2009;
Fish, 2011;
Fountain, 2009;
Frickey, 2009;
Hall, 2009;
Hanson, 2010;
Ives, 2010;
Klepfer, 2009;
Lomen, 2011;
Osterhout, 2009;
Stibel, 2009;
Subasic, 2010), as well as by two researchers at a skilled nursing facility.
Testing Environment
Participants were either tested in the Idaho State University Clinic (located in Pocatello or Meridian, Idaho), their homes, or in a skilled nursing facility. The test environment was quiet and free of distractions. Participants were seated comfortably in an upright position. The participants were informed that the study involved placement of an IOPI bulb in the mouth in two locations, as well as placement of sEMG surface electrodes on the throat and mandible. After providing informed consent, participants completed the demographic survey. A brief oral mechanism examination (OME) was conducted by the researcher prior to initiation of the trials. The investigator then presented the participant with the stimuli (3 presentations of each stimulus) according to the assigned protocol, described in detail below.
Tongue Strength Measures
For IOPI measurements of tongue strength, the IOPI bulb was first placed on the anterior tongue, and participants were instructed to place their teeth gently against the tubing attached to the bulb and to compress the bulb against the alveolar ridge with their tongue as hard as they could until instructed to stop (approximately 5 s), slightly longer than the compression time of
Clark and Solomon (
2012) and
McKay et al. (
2020). Pmax was recorded for each trial. The participant was then asked to sustain phonation of the vowel /a/ to facilitate placement of the IOPI bulb on the tongue dorsum (posterior tongue). The researcher placed the bulb on the tongue dorsum inferior to the juncture of the hard and soft palates, as indicated by the peak of the tongue during the phonation of /a/, following
Vanderwegen et al. (
2013). While this location is generally posterior to the location of the third molar, it was anticipated that this placement would optimize utilization of the palatoglossus muscle in exertion of force by the tongue on the hard palate. Participants were instructed to push the bulb against the palate with as much force as they could until instructed to stop. This was completed for three trials with the bulb being repositioned and dried off after each attempt. The researcher recorded Pmax after each attempt. Calculations for statistical purposes utilized the best of three trials of Pmax generated by the anterior and posterior portions of the tongue.
sEMG Masseter Activity During Swallow
To maximize conductivity and minimize electrical impedance, an electrode gel (NuPrep) was placed on a gauze pad and rubbed in the location of electrode placement with pressure for approximately 30 s to prepare for electrode placement. The electrodes were placed on the facial surfaces as follows.
For masseter measurements, participants were instructed to clench their back teeth as the researcher palpated the masseter belly. The sEMG electrodes were placed bilaterally on the masseter belly in a vertical plane. The electrode for Channel A was placed on the right masseter, and Channel B was assigned to the left masseter. The ground electrode was placed on the participant’s clavicle.
Maximum-effort masseter activity was recorded to be used in comparison with masseter activity during swallow. Participants were instructed to bite down with their back teeth as hard as possible for 3 s and then relax, repeated for 3 trials. The researcher recorded the maximum sEMG activity, and the average of these measures served to normalize each participant’s sEMG trial data for analysis.
Subsequently, participants were presented each bolus in the following order: 2.5 cc pudding, 7.5 cc pudding, 10 cc water, and free-choice bite of a cracker. With the exception of the cracker, the participant was given the bolus and instructed to hold it in the mouth until told to swallow. With the cracker, participants were allowed to chew until they were prepared to swallow, and then to do so with their own timing. While the participant swallowed, the researcher palpated to determine laryngeal elevation as an indication of initiation of swallowing. Upon perceiving laryngeal elevation, the computer spacebar was depressed to mark the approximate location of initiation of the swallow on the sEMG trace, which was later used for calculating maximum masseter activity during the swallow. Each stimulus was presented three times, and the researcher saved the data to later obtain the sEMG amplitude measurement.
sEMG and Swallow Timing
Swallowing onset was measured directly from the sEMG trace, while offset was indicated by event markers placed on the trial through behavioral observation through palpation. This hybrid measure method was adopted due to the variability of the signal from the thyroid lamina region (
Davis-Voldbaek, 2010;
Hanson, 2010).
Initiation of swallowing was operationally defined as beginning at the initial movement of the tongue; this was identified based on the sEMG signal from the submental region. Termination of the swallow was defined as the depression of the larynx following swallow, measured behaviorally using palpation, with spacebar press to indicate swallow termination on the trace.
The right (A) and left (B) electrodes were removed from the masseter and prepared for application to the neck to measure laryngeal elevation. Channel A’s electrodes were placed on the submental region, overlying the mylohyoid muscle, anterior digastricus, and other muscles involved in tongue-base retraction. One electrode was placed approximately 2 cm posterior from the most anterior position along the inferior mandible, and the second electrode was placed 2 cm posterior to the first. Channel B’s electrodes were placed on the lateral surface of the thyroid lamina in a vertical alignment 2 cm apart. The participants were given the bolus and were told to swallow when instructed. This was completed three times with each bolus type. Initiation of the swallow was marked by depression of the spacebar to facilitate identifying the swallow on the sEMG trace. Criteria were established for analyzing sEMG masseter data and sEMG swallow timing data and data descriptors are outlined in Online Supplements C and D.
Measurement Reliability
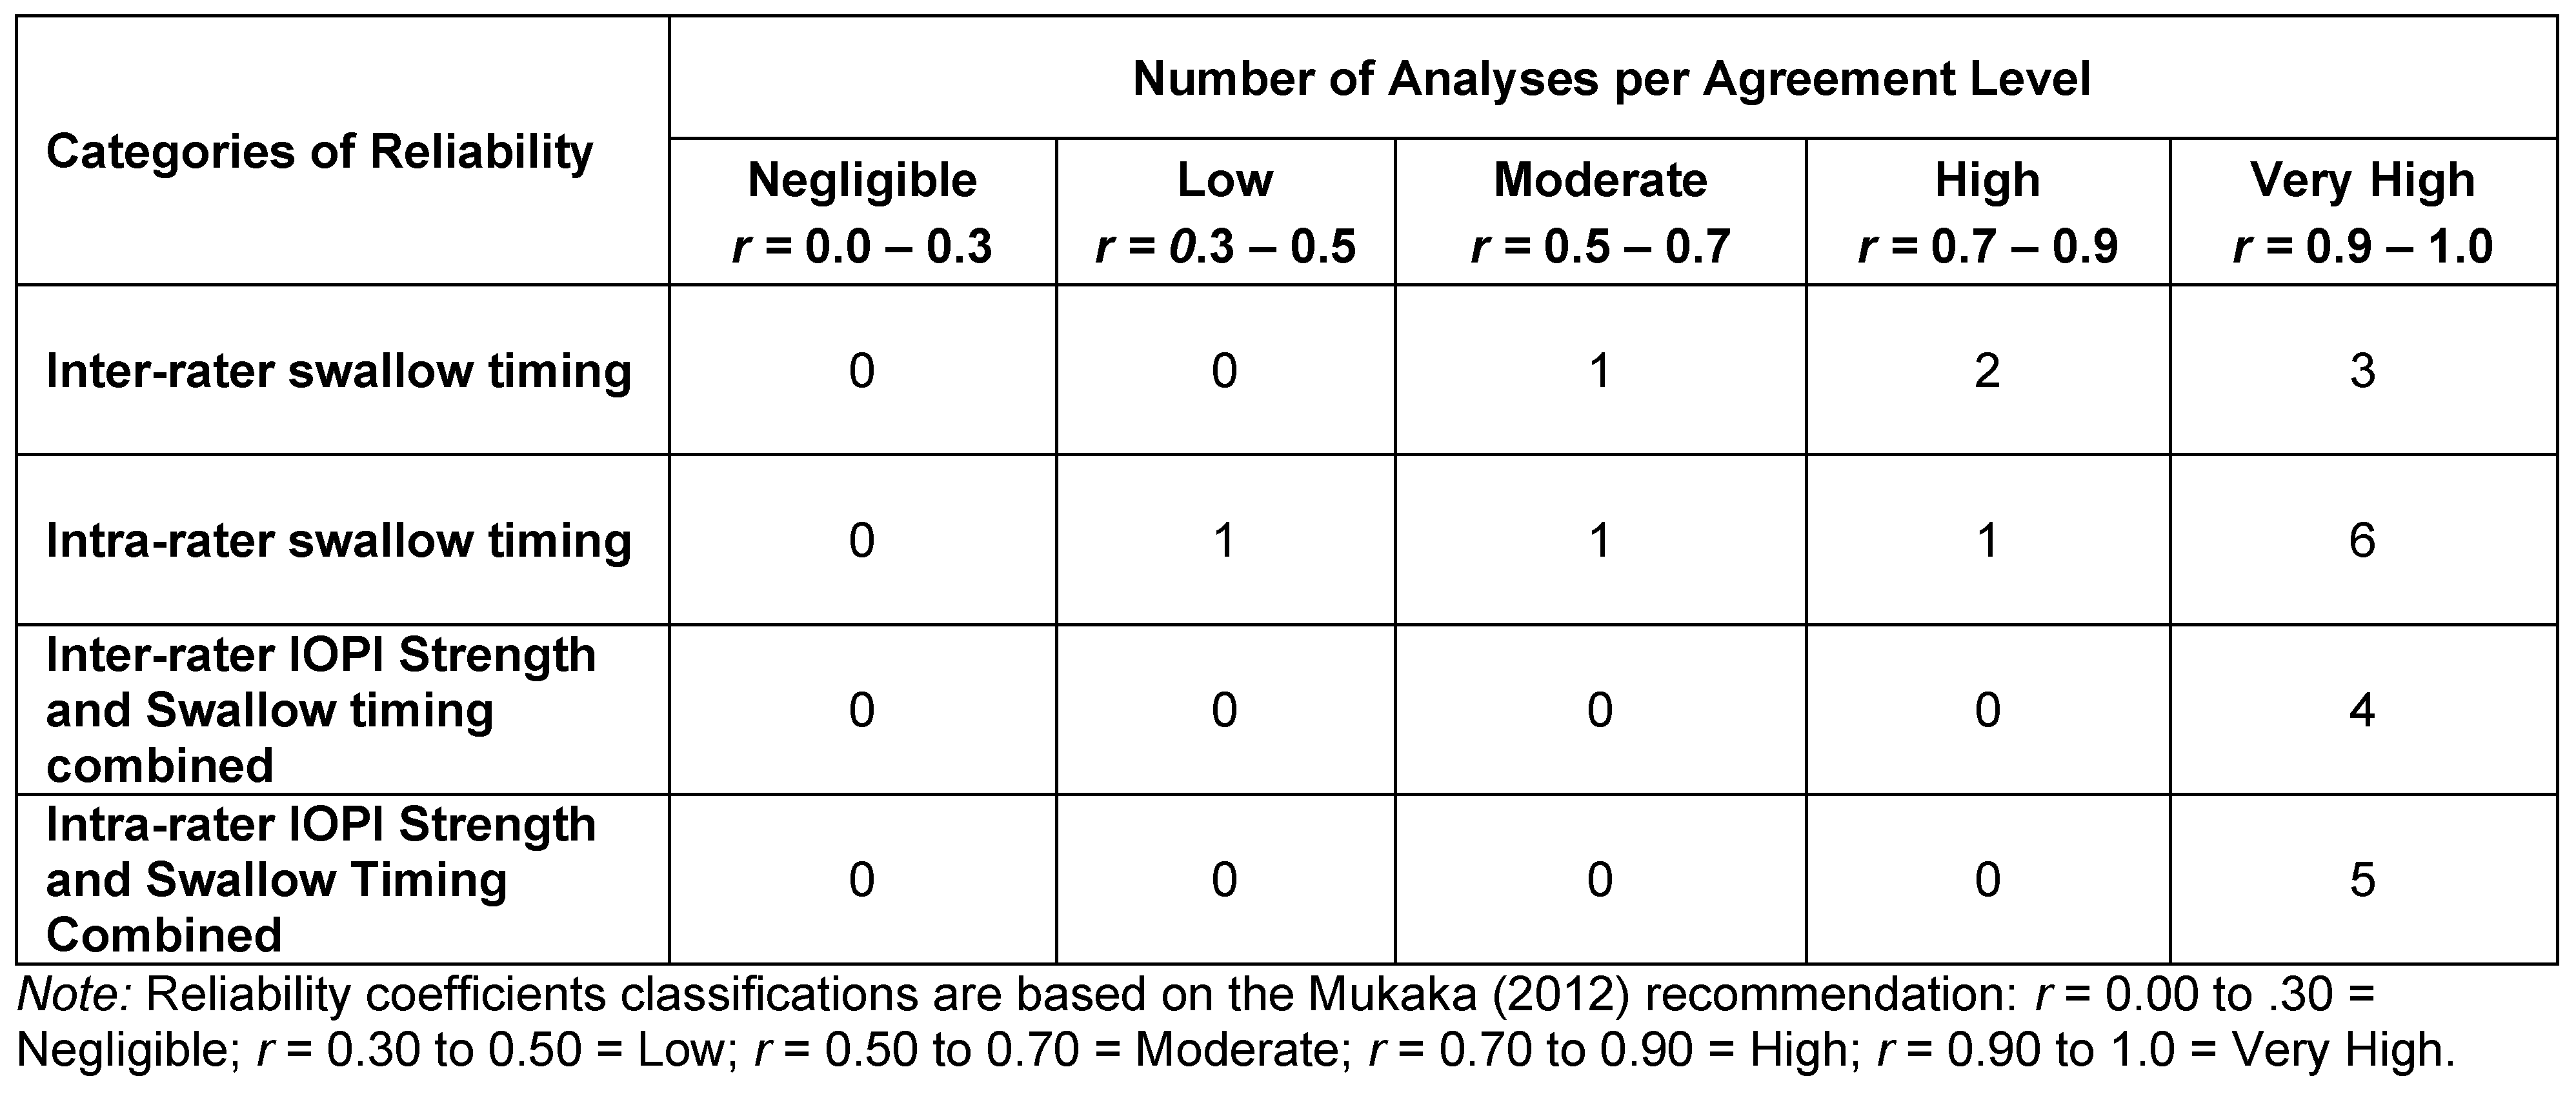
All researchers performed reliability checks on at least 10% of sEMG and/or IOPI measures. Coefficients were classified according to the
Mukaka (
2012) categorization for Pearson Product Moment Correlation Coefficients. Mukaka characterizes coefficients of .00 to .30 as negligible, .30 to .50 as low, .50 to .70 as moderate, .70 to .90 as high, and greater than .90 as very high. Six of the examiners re-measured swallow timing. Four researchers re-measured both IOPI strength and swallowing timing, calculating coefficients on the combined measures. Six researchers compared their IOPI strength data with measurements taken by a trained colleague, while another five compared their IOPI strength data and swallow timing data with those taken by a trained colleague. Seven (70%) of the interrater coefficients and 11 of the intra-rater coefficients (79%) were rated as very high (see
Table 2). All but one of the inter- and intra-rater coefficients had ratings of moderate or greater association.
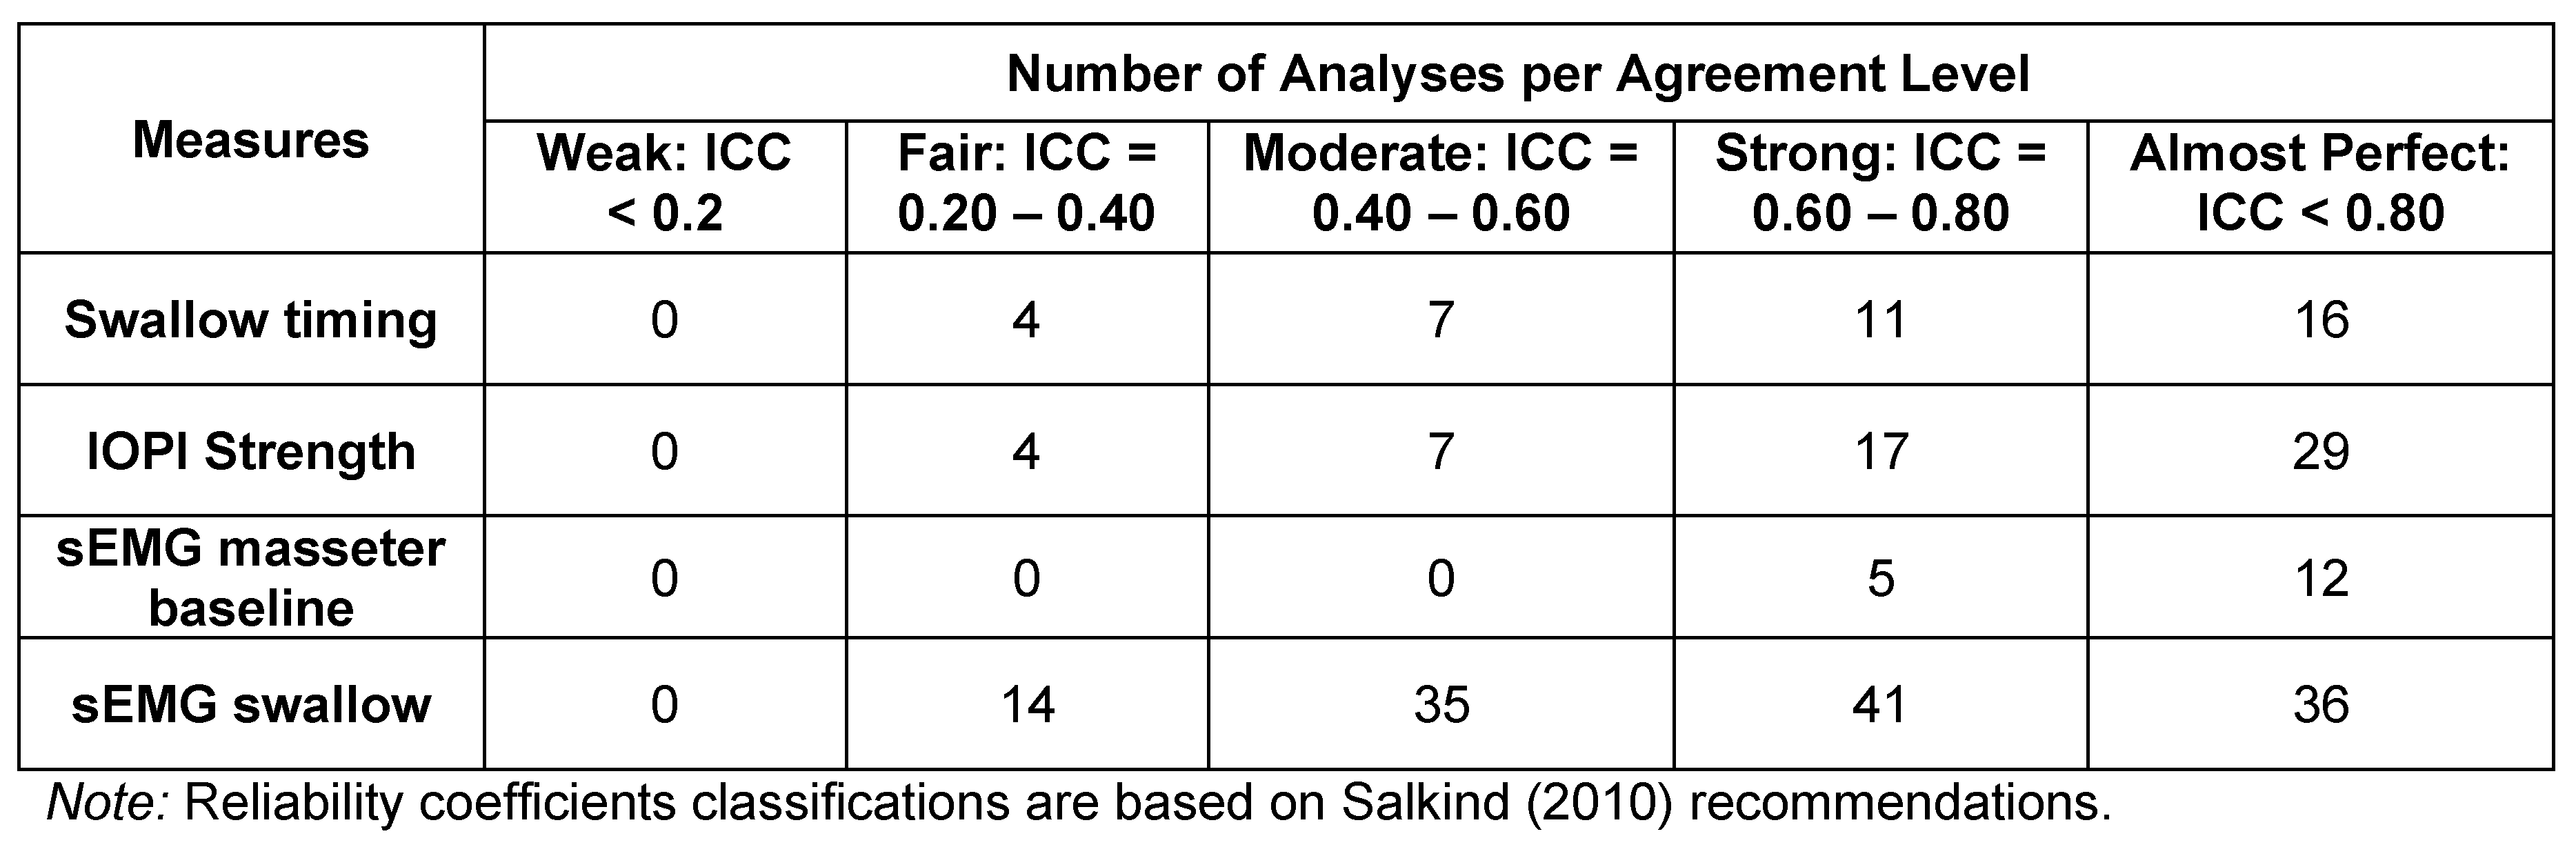
Three additional studies were conducted solely to assess inter-rater reliability (
Table 3). Twenty-four participants taken in three groups of eight were recorded twice by different researchers (
Reardon, 2013;
Ross, 2013;
Sebold, 2013). Intraclass correlation coefficients (ICCs) were derived for each measurement for each pair for the sEMG baseline measure, sEMG masseter swallowing measure, swallow timing, and IOPI strength measures. Note that Reliability Groups 1 and 2 calculated the ICCs for each individual variable within a measure, whereas Group 3 calculated the ICCs for the data of a measure as a whole. This accounts for the variability in number of coefficients per category.
Salkind (
2010) characterized the derived ICC categories as follows: <.2 is considered weak agreement; .2 to .4 is fair; .4 to .6 is moderate; .6 to .8 is strong; and >.8 is near-perfect agreement. Results of swallow timing revealed 27 (71%) of the coefficients to be in the strong or almost perfect category, with none classified as weak. Similar results were found for the IOPI strength measure, with 43 (80%) coefficients identified as strong or almost perfect. The masseter baseline measures showed the strongest associations, with 17 100% being in the top two categories. sEMG swallowing coefficients followed a similar pattern, with 77 (61%) coefficients being in the top two categories.
Five assessments made by each of the three raters for the inter-rater reliability study were examined for procedural reliability by a separate researcher (
Leckington, 2013). A 49-item checklist of critical procedures involved in the measurement process was used to assess fidelity by each researcher. Average procedural reliability was above 90% for all researchers. The reliability for sEMG was between 85% and 95%, while reliability for use of IOPI by the protocol was 100%.
Data Preparation
Data were obtained from each researcher in individual Excel spreadsheets. Data files were examined to ensure each spreadsheet contained the same number of fields in identical order, and then files were subsequently merged. Initially, the merge included the column labels to ensure each data set was added. Close data examination ensured every entry within each field was formatted identically.
The sEMG signal was normalized, such that the average maximum sEMG during trials was divided by the average maximal-effort sEMG measure. This process reduced the variability that is inherent in electrophysiological measures that depend upon skin conductance (
Lehman & McGill, 1999;
Sousa & Tavares, 2012). A series of subjective assessments was also completed in an effort to characterize the presence of undiagnosed oropharyngeal or orofacial myofunctional problems, but are beyond the scope of this paper. Masseter measures were collected but later discarded because variability in placement produced unreliable results. Lip strength measures were also collected but later abandoned when an error was found on the training video that could have resulted in a procedural error in data collection.
Statistical Analysis
Analysis of data was conducted on the demographic factors of sex and the three age groups to account for developmental and aging effects on swallowing anatomy and physiology. In preparation for statistical analysis, tests of linearity and variance equivalence of the distributions were conducted. All variables violated one or both of these assumptions, and thus Kruskal-Wallis analyses of variance was chosen to test for statistical differences. Dwass-Steel-Critchlow-Flinger pairwise comparisons were calculated to test the hypotheses concerning differences between age groups and sex within age groups, as well as the within-participants variables of differential responses to bolus, differences in articulator strength, and activity measurements generated by the muscles of mastication during the swallow.
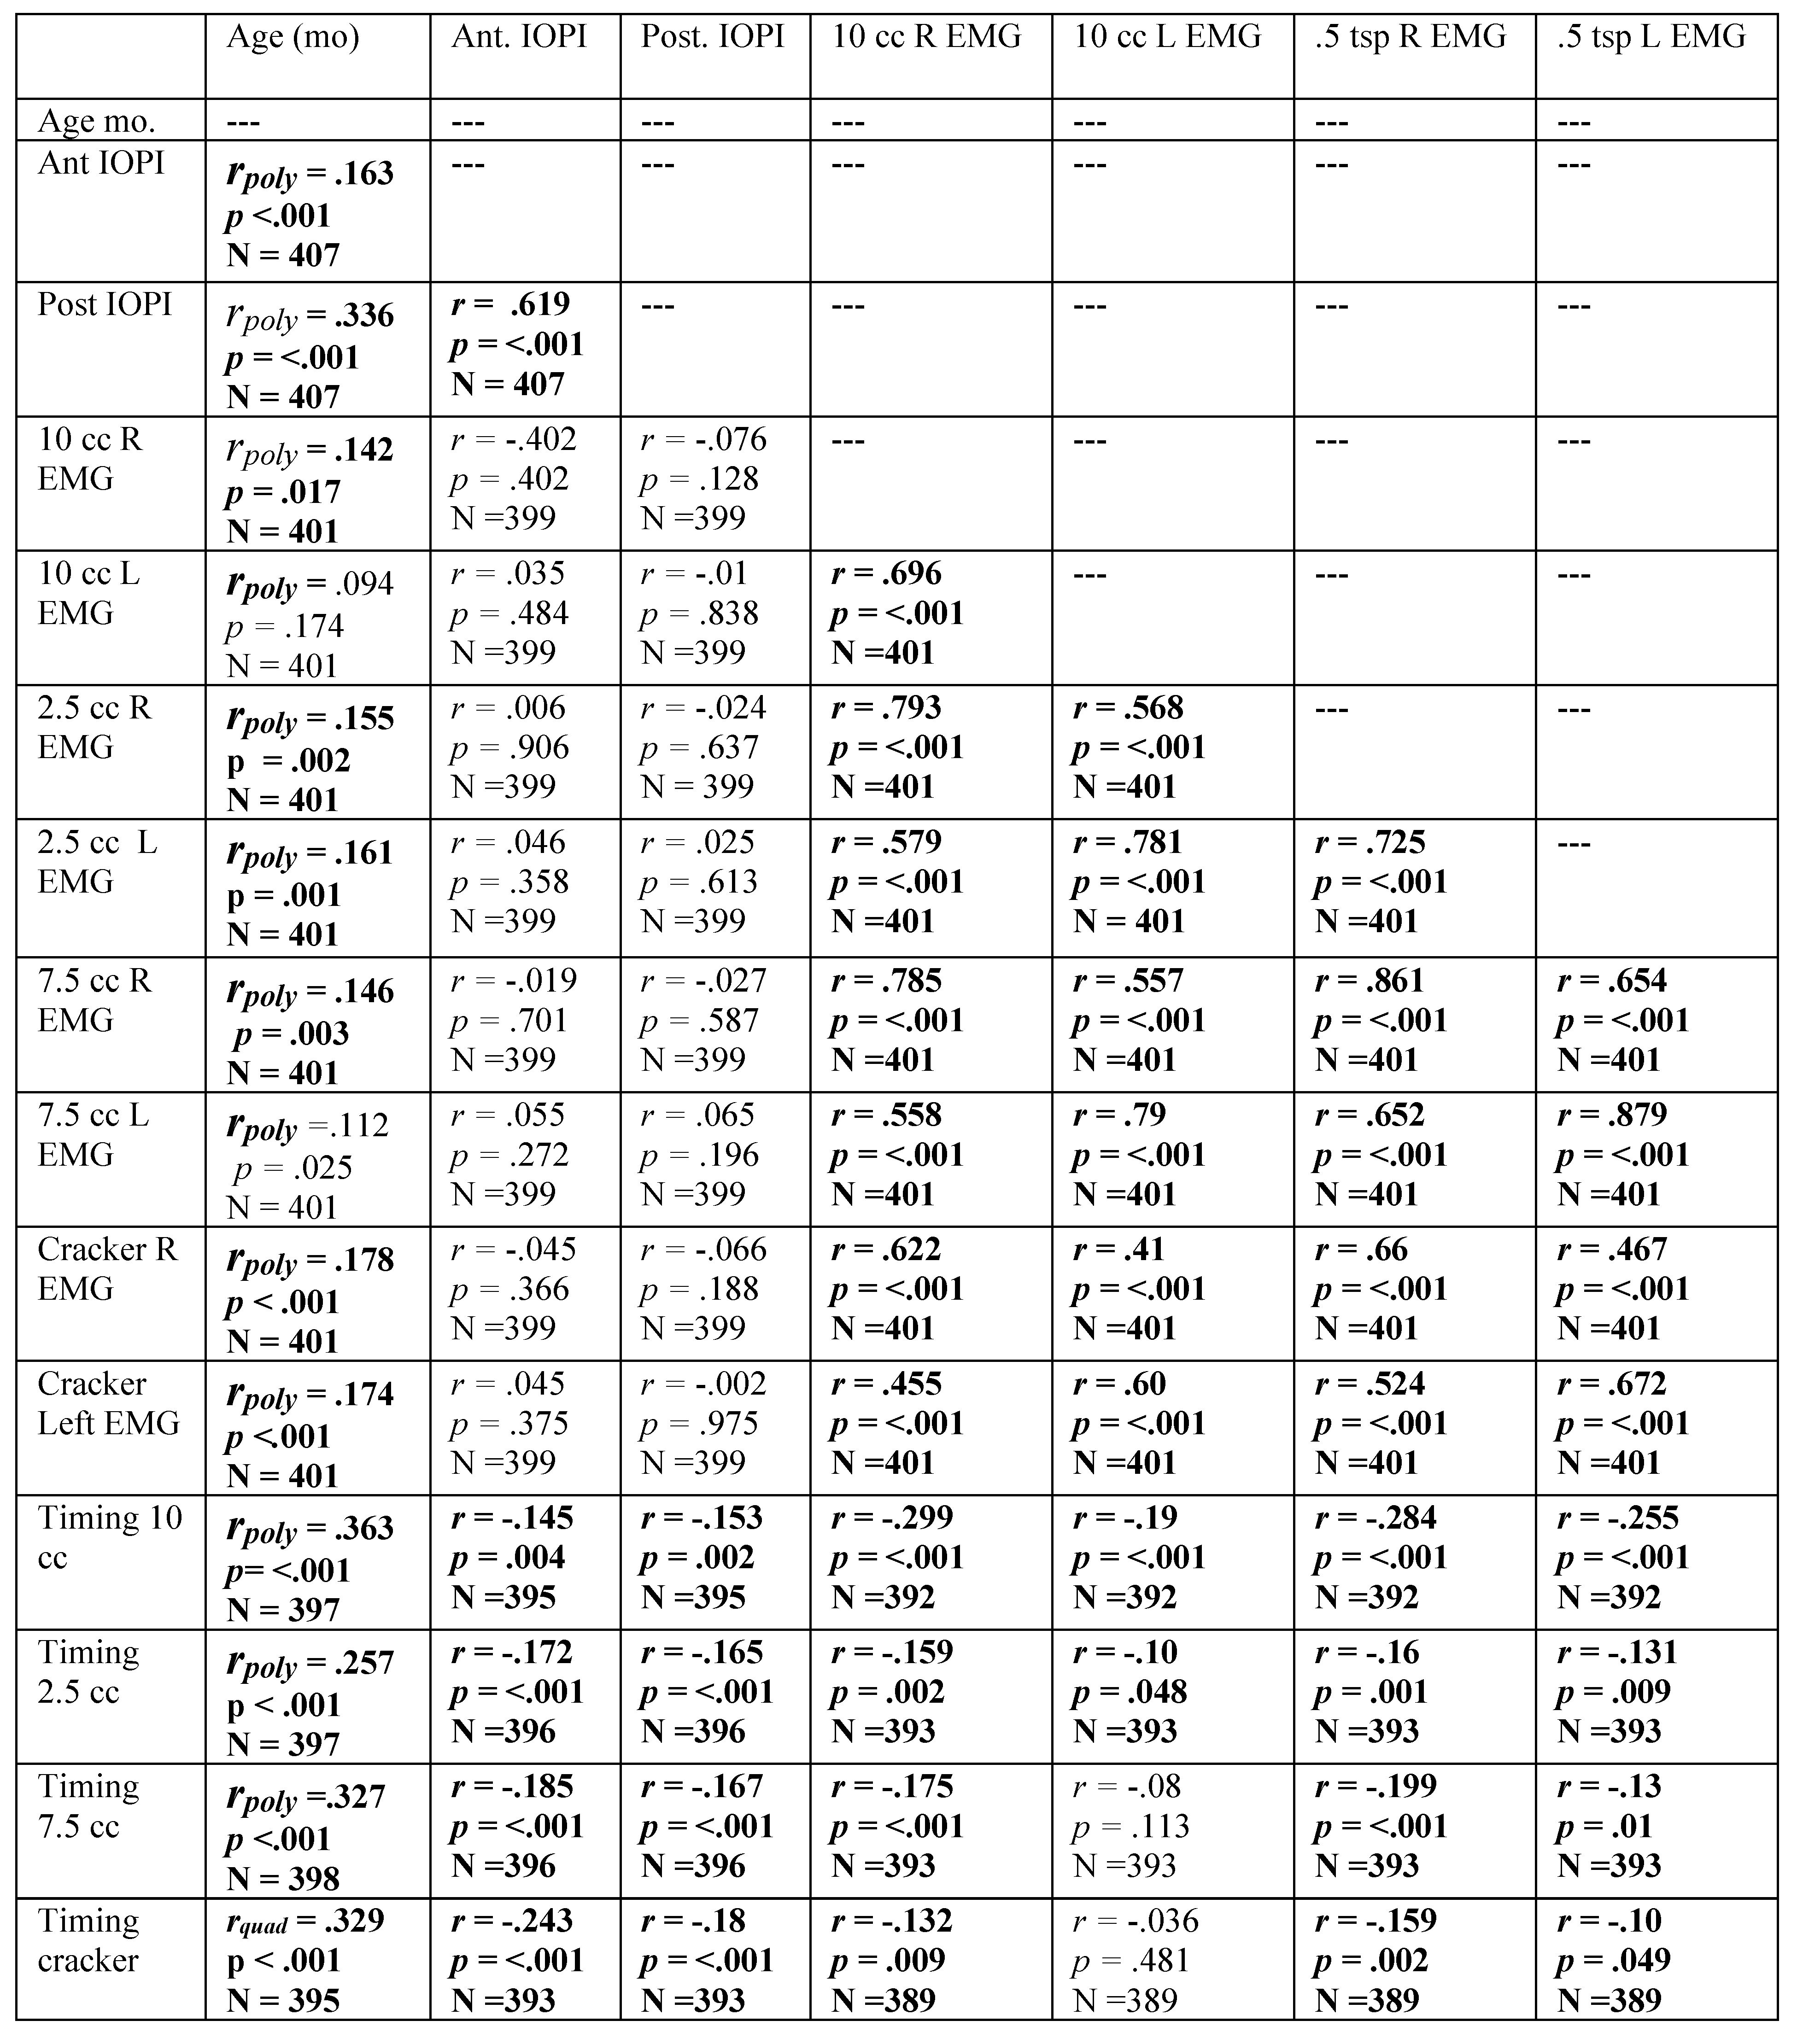
Inferential statistics included examination of differences based on age category and on sex for (a) anterior and posterior tongue strength, (b) activity for right and left masseters during swallow, and (c) swallow timing for 4 boluses. Finally, Spearman Rank Correlation Coefficients were calculated for all of the dependent variables. The Spearman Rho was utilized rather than Pearson Product Moment Correlations because of the Spearman Rho’s resistance to the effects of nonlinear data with non-normal distributions, as well as its resistance to the effects of outliers in a data distribution (
Bishara & Hittner, 2012). Scatterplots of the lifespan data revealed evidence of nonlinearity in the age-related correlations and residuals were subsequently examined for those variables correlated with age in months, revealing the need for a polynomial solution to accurately reflect prediction. A polynomial regression was calculated with age in months as the quadratic term. The square root of the R-squared for the model was calculated and reported. The
p-value in the correlation tables represents the significance level of the model. When the linear term was not significant, it was removed from the model. Jamovi version 1.6.23.0 was used to calculate statistics and analyze the data sets. Level of significance was set at
α = 0.05. Descriptive statistics are provided in
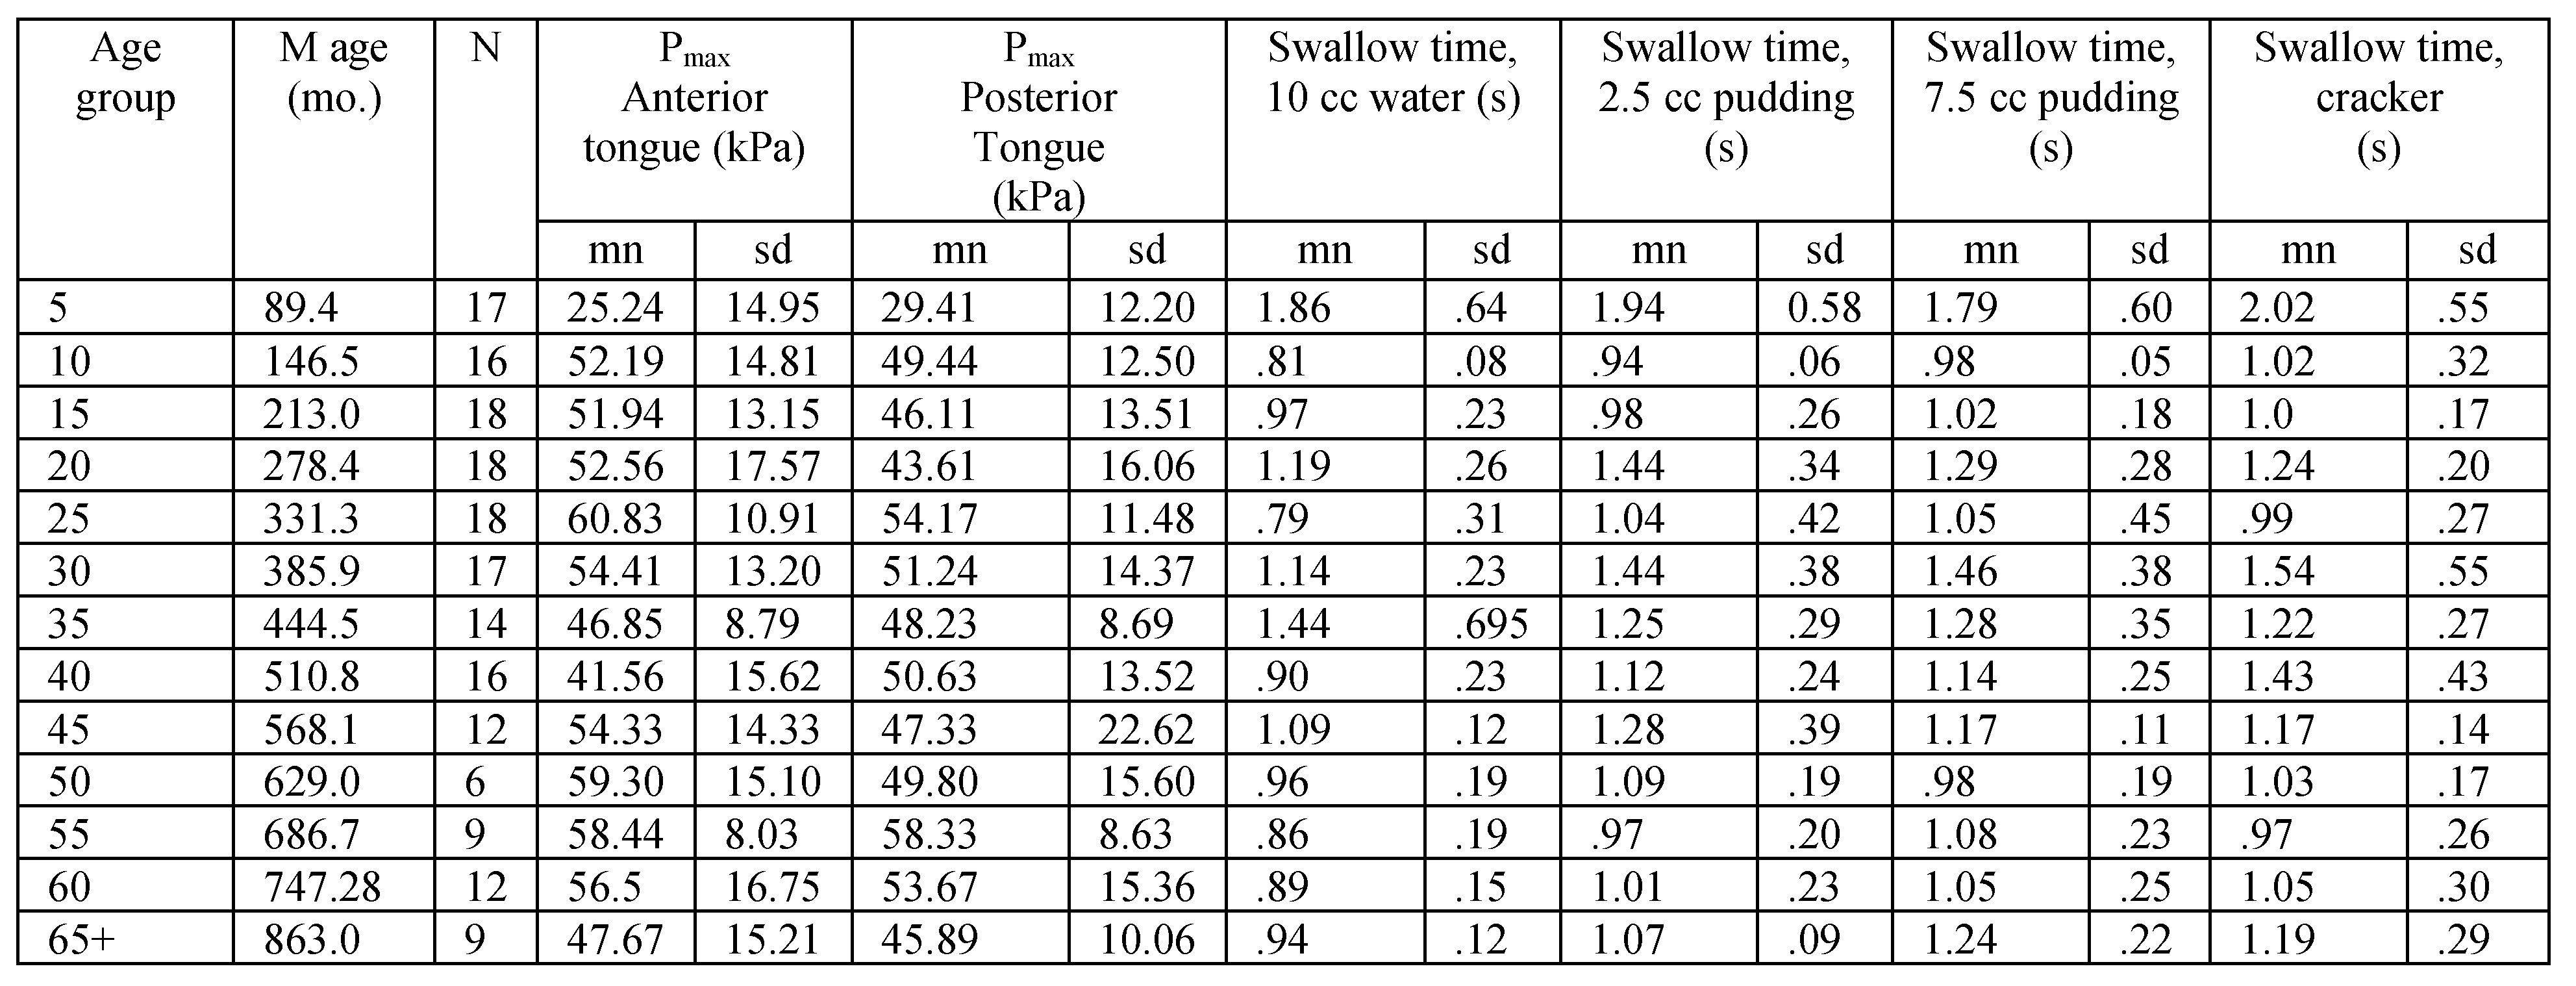
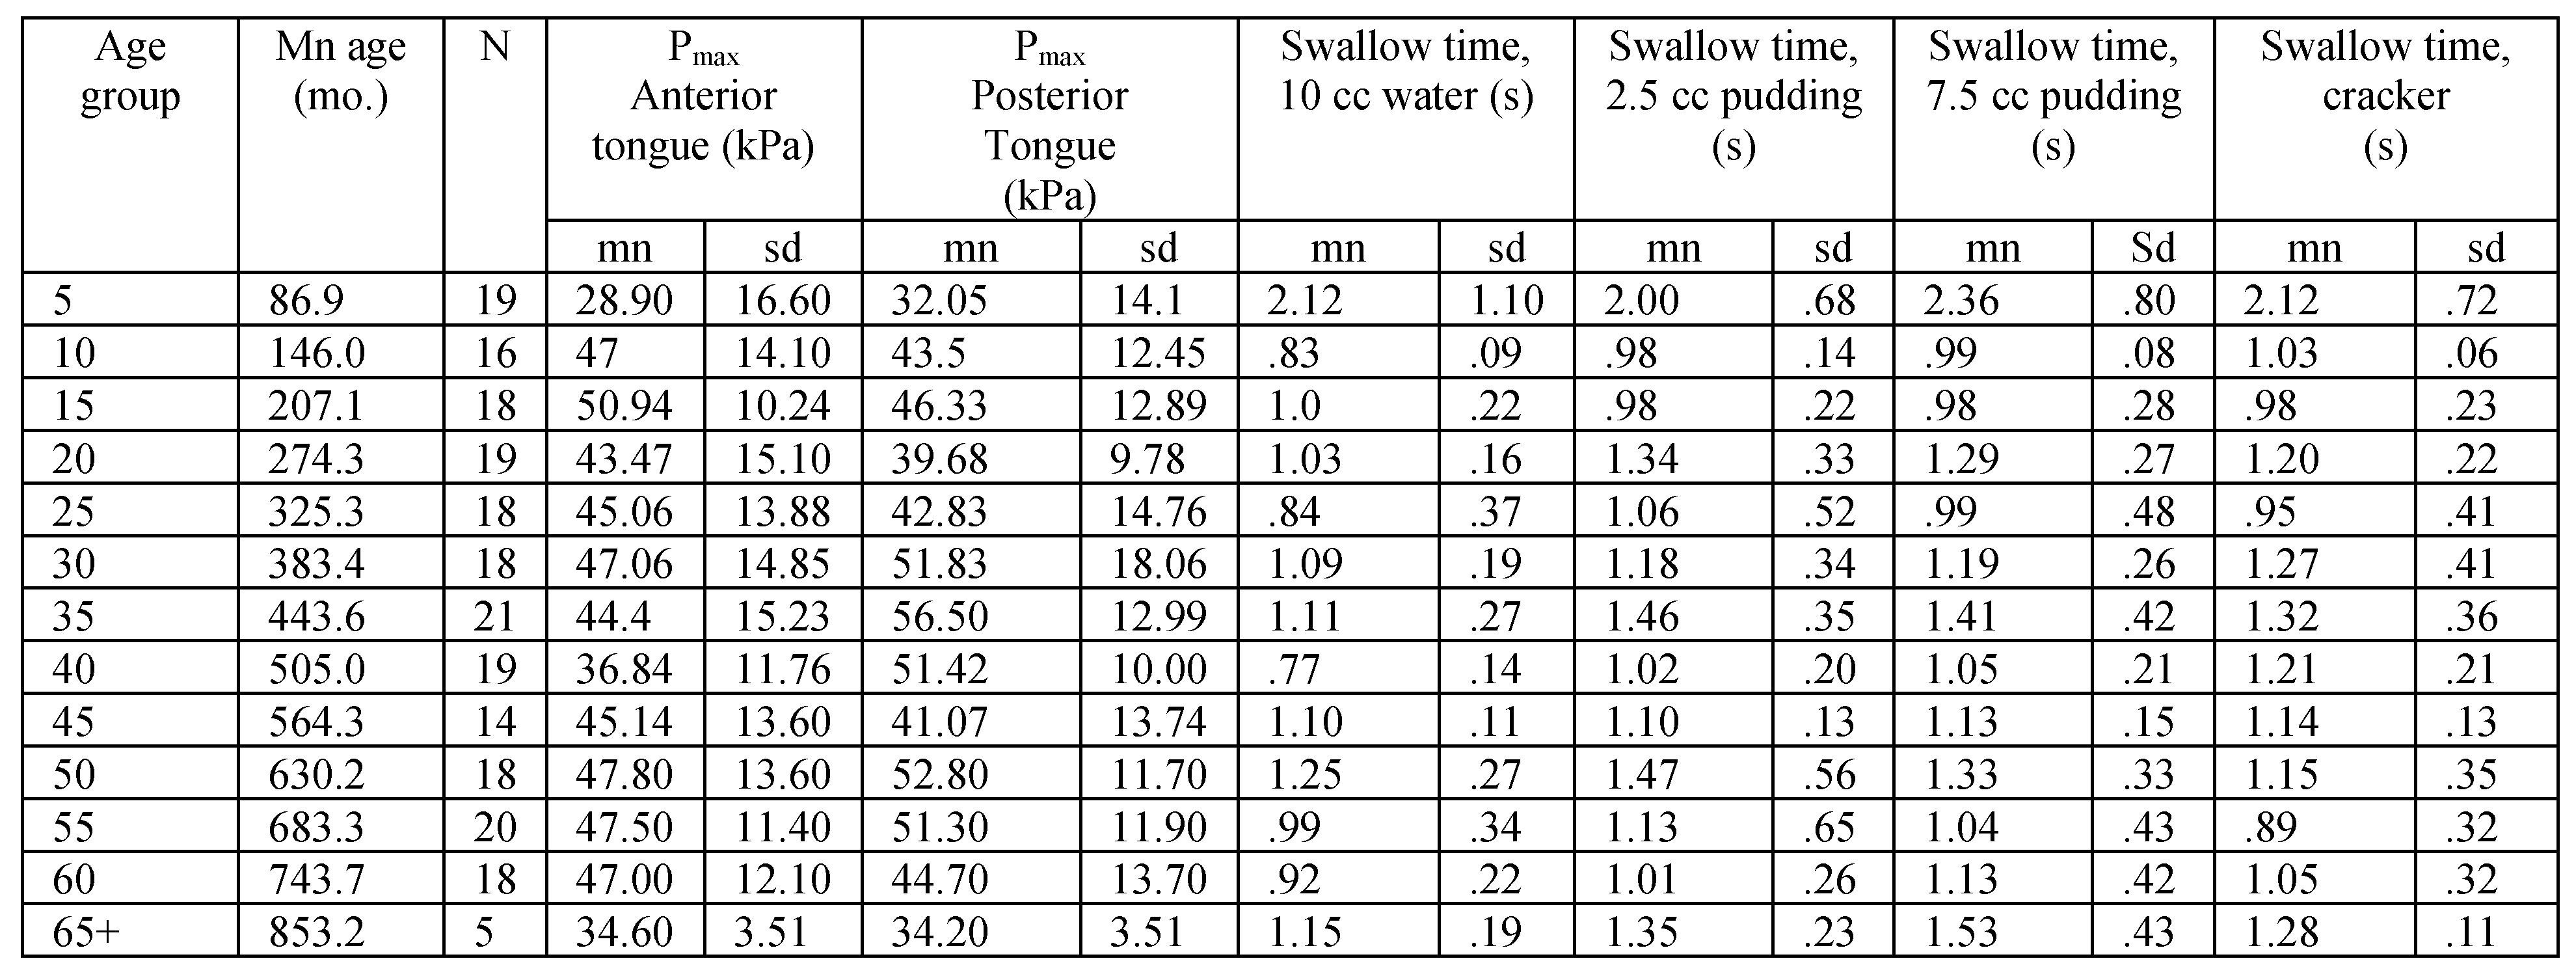
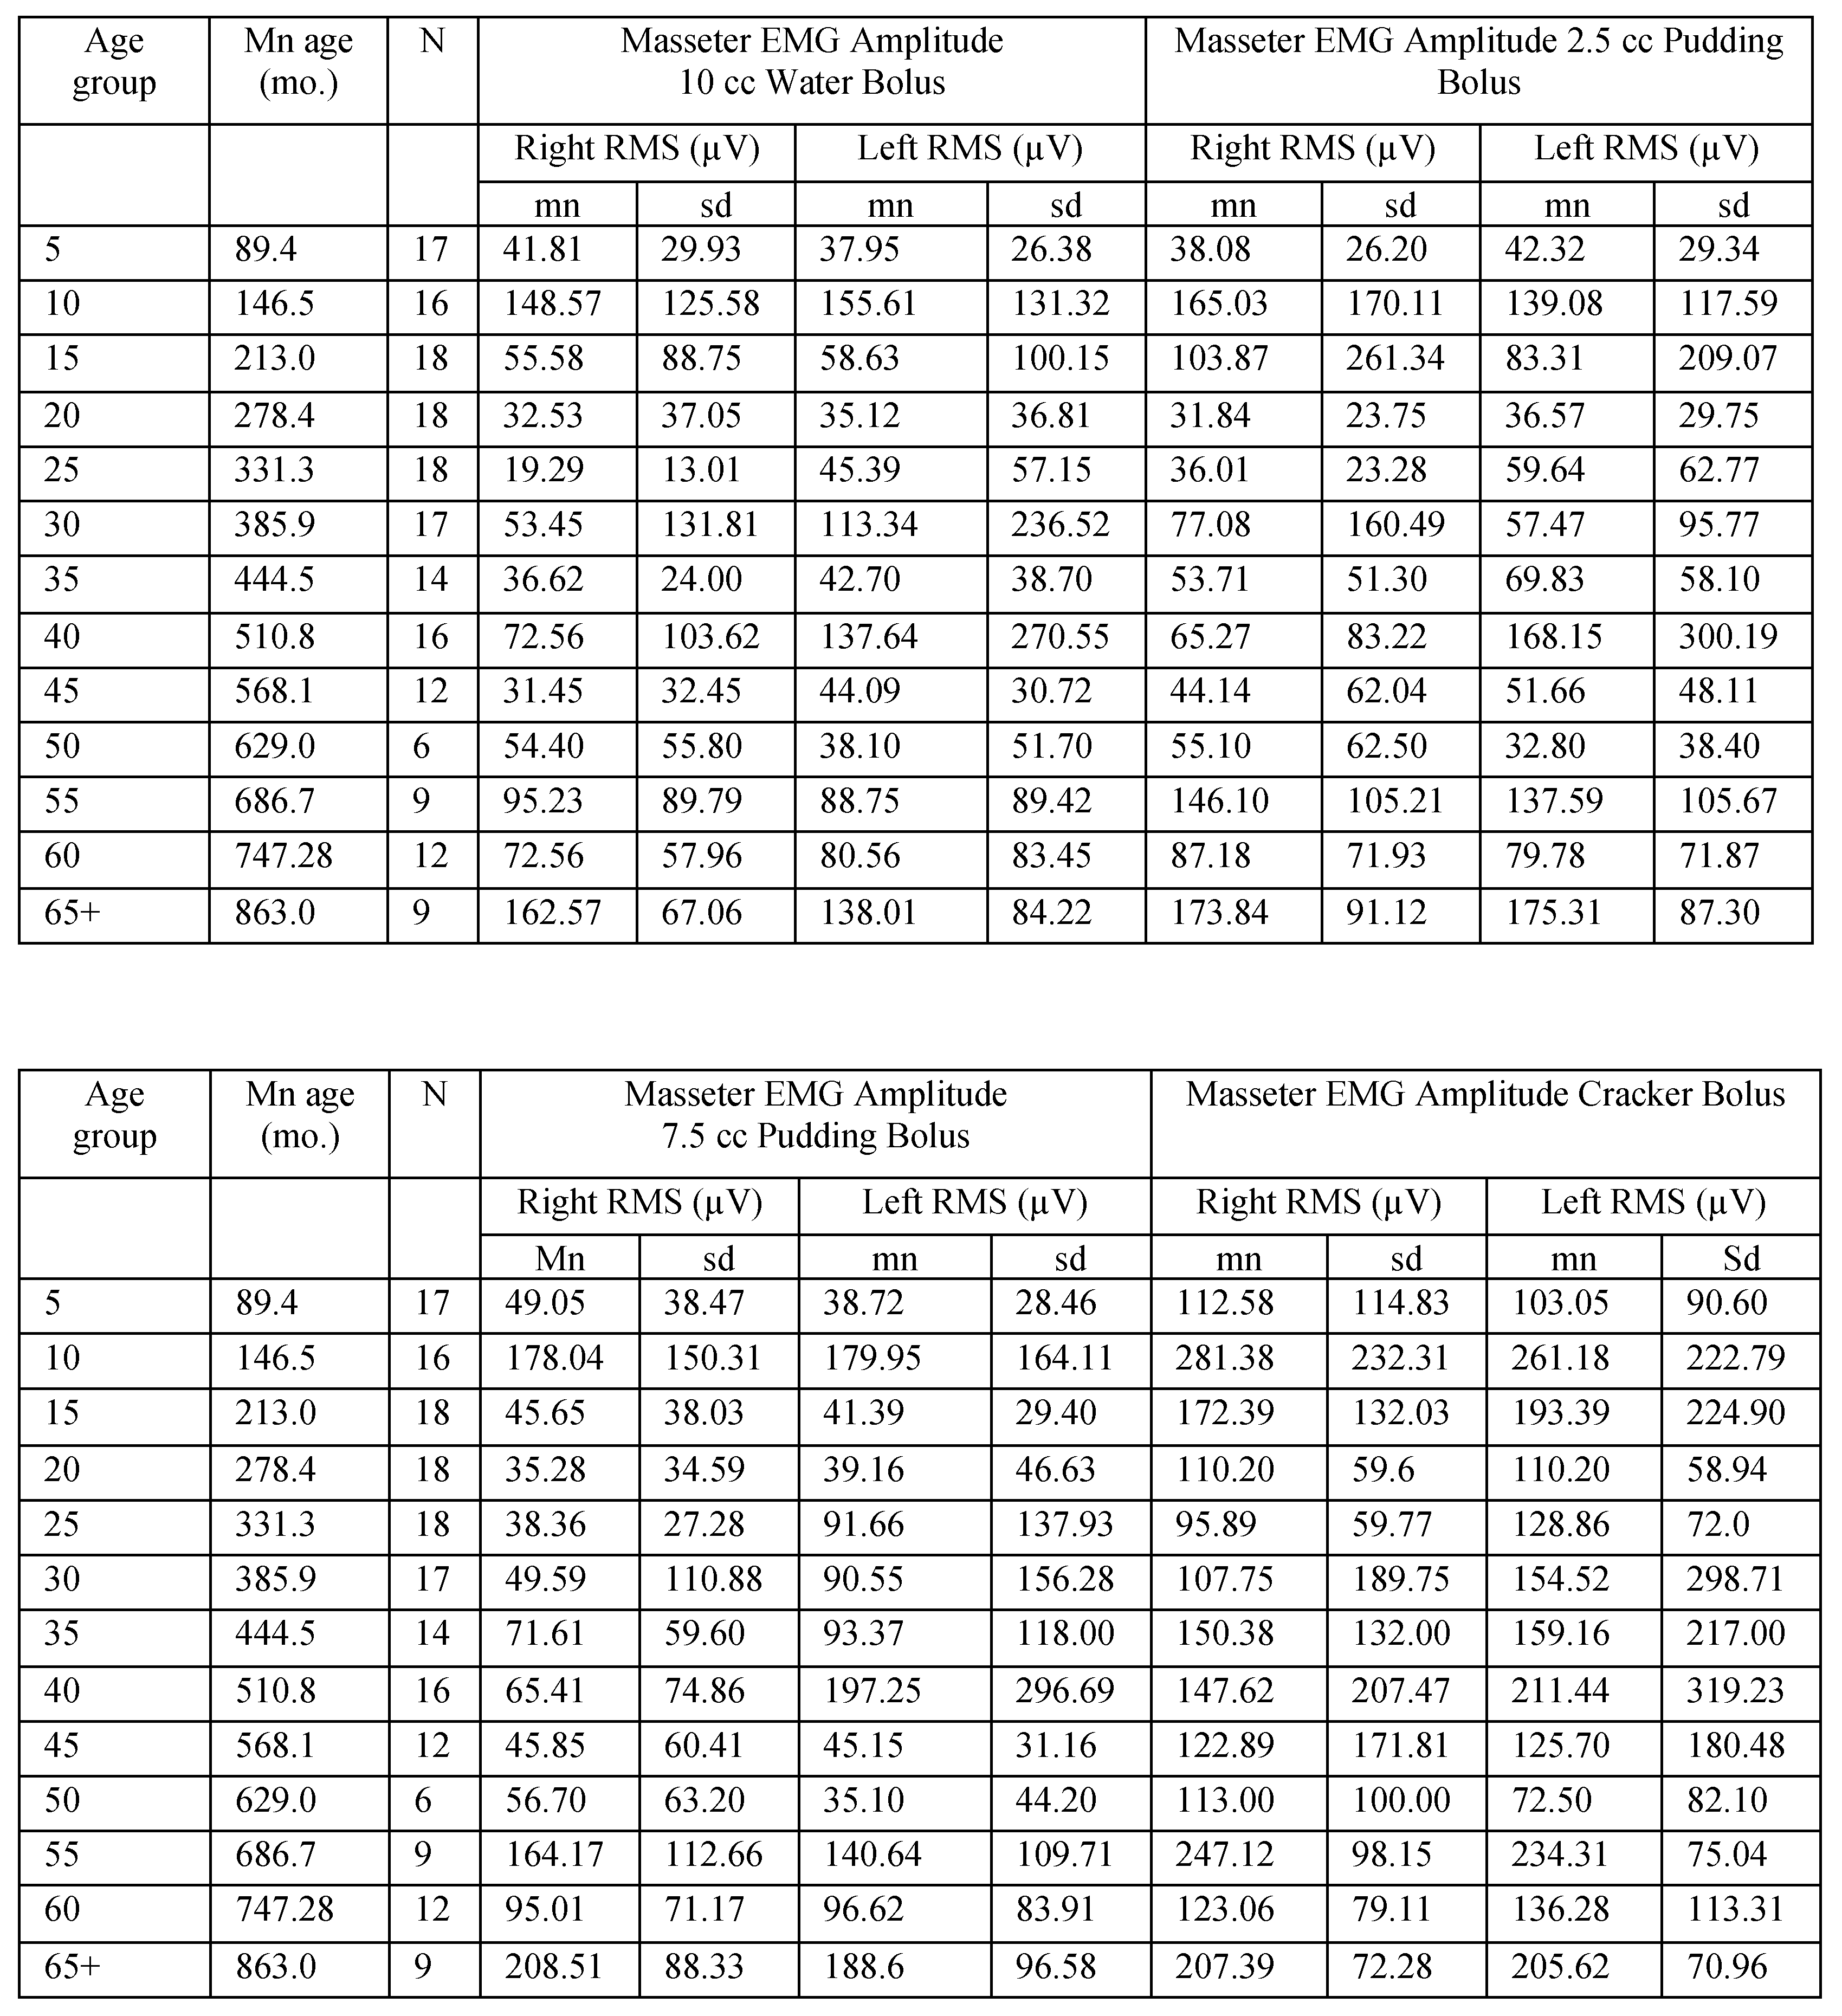
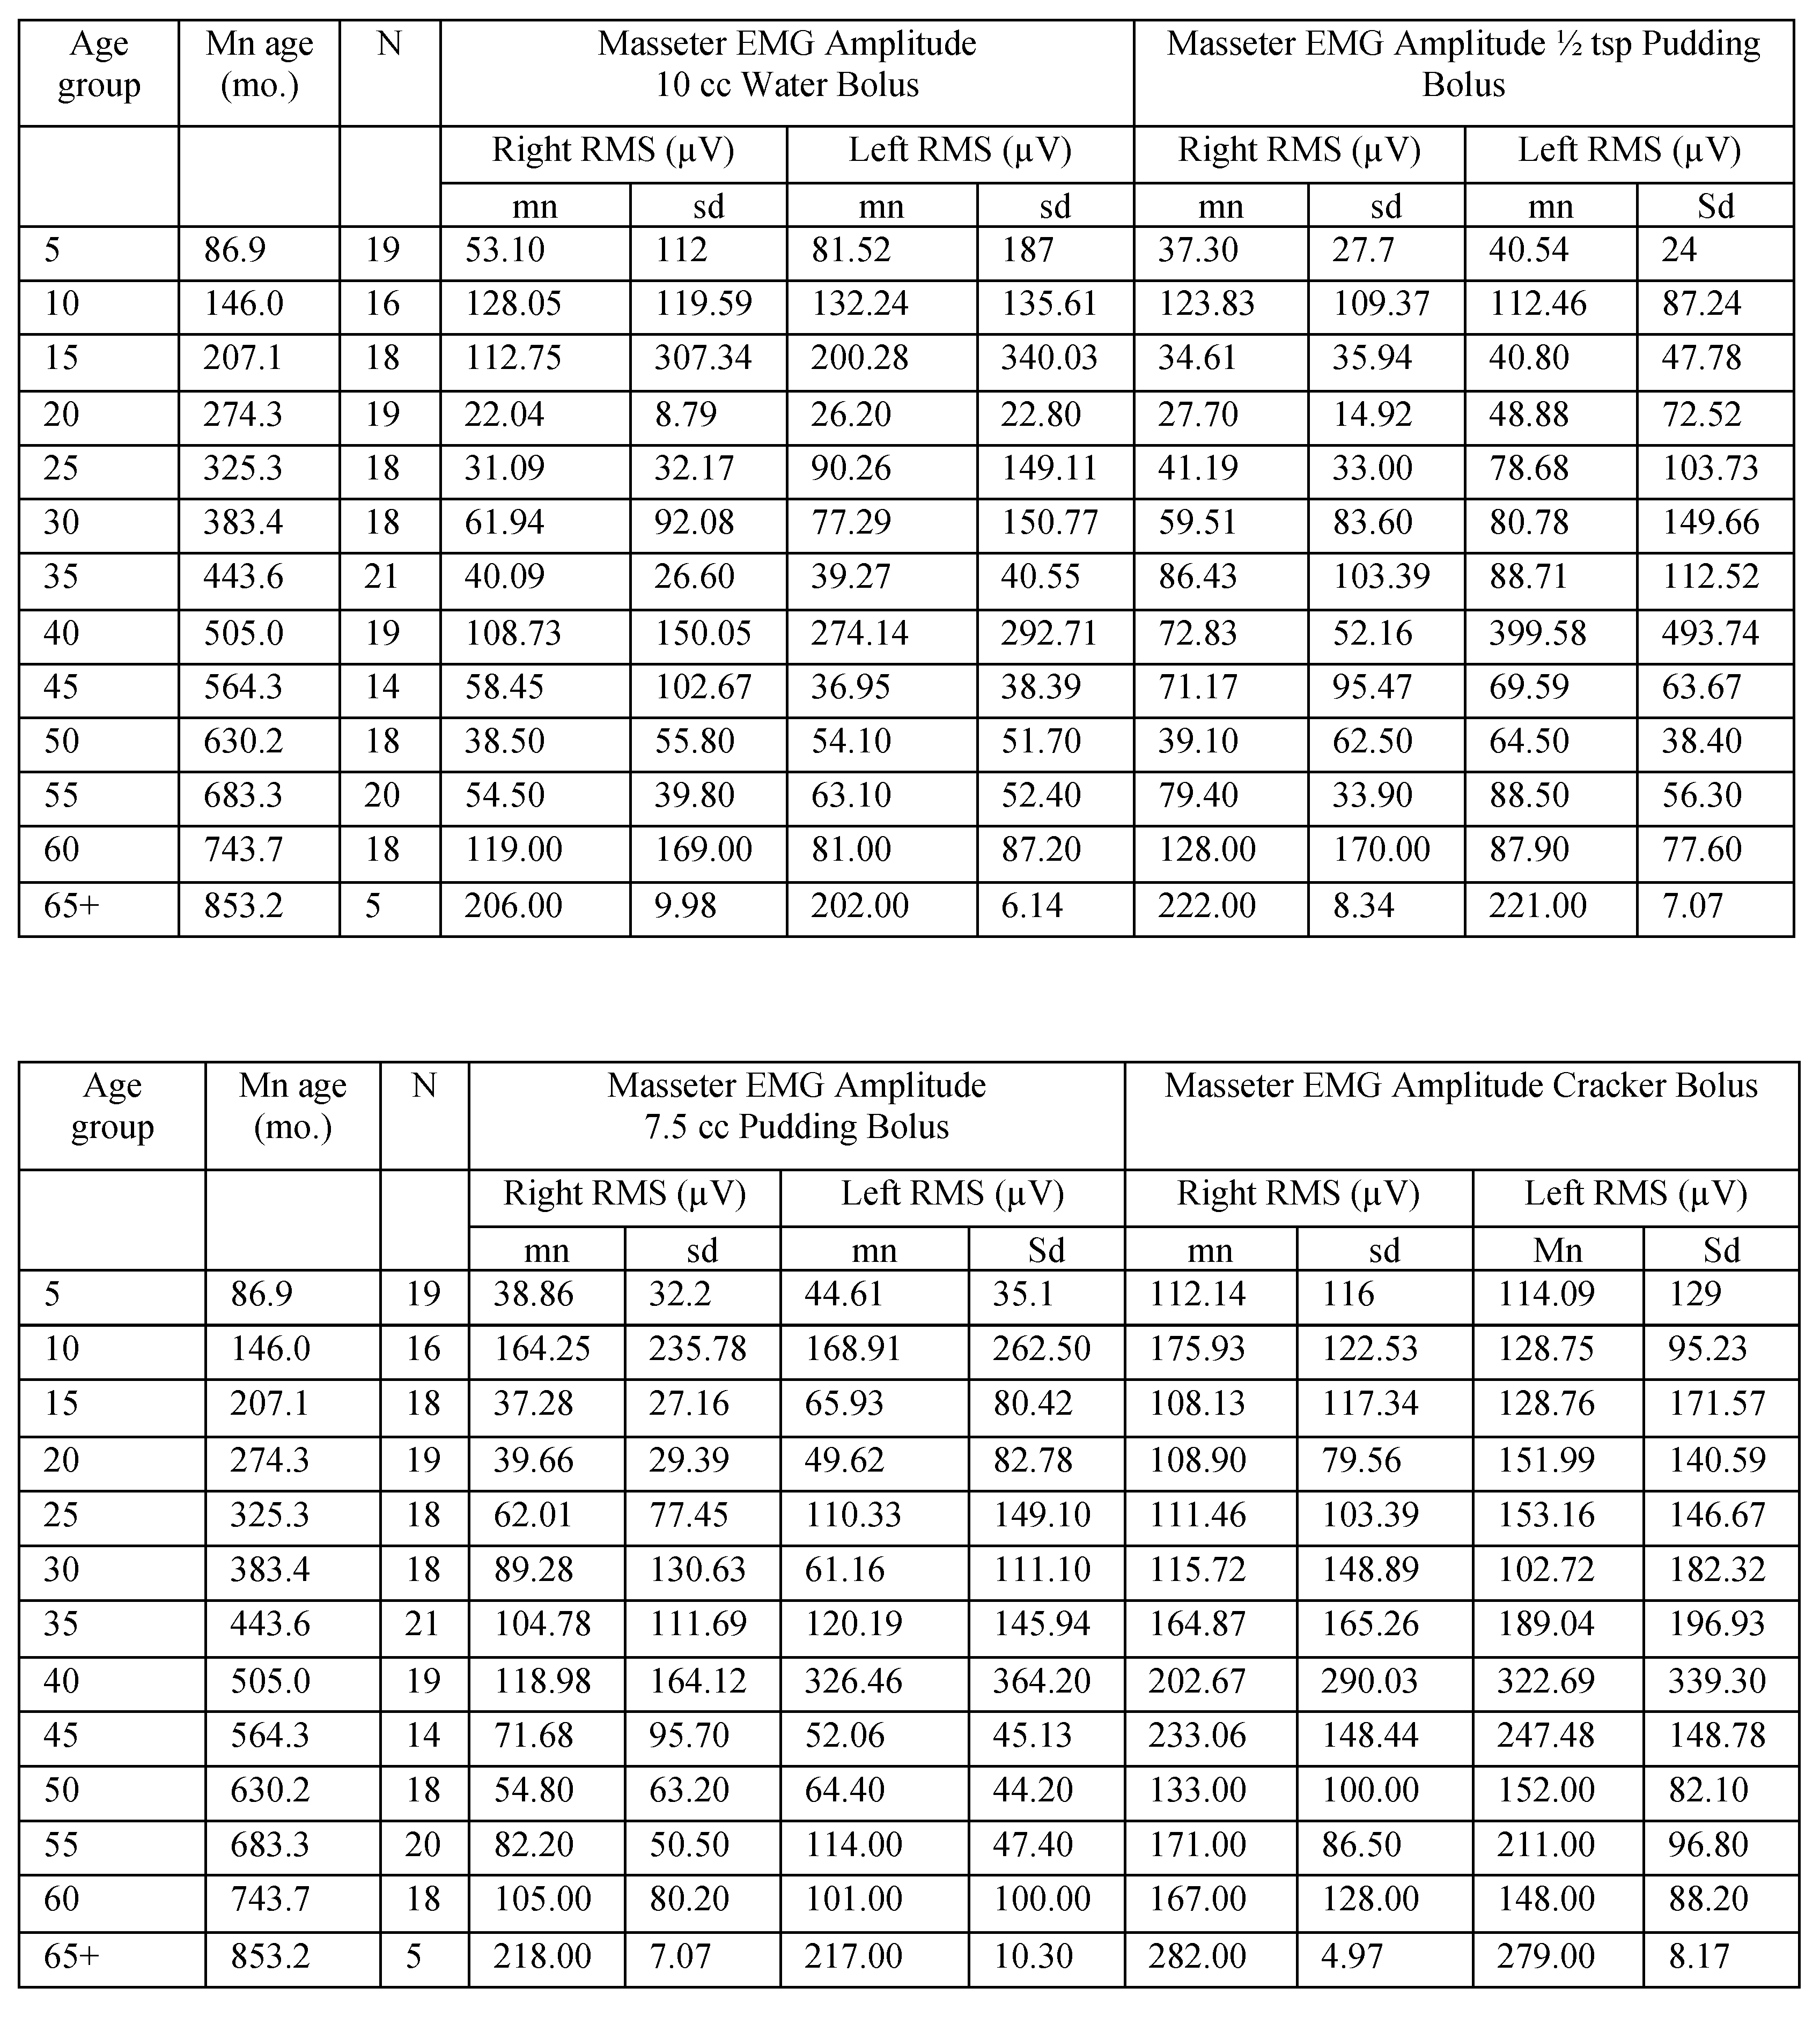
Appendix A.
Results
Tongue Strength Measures
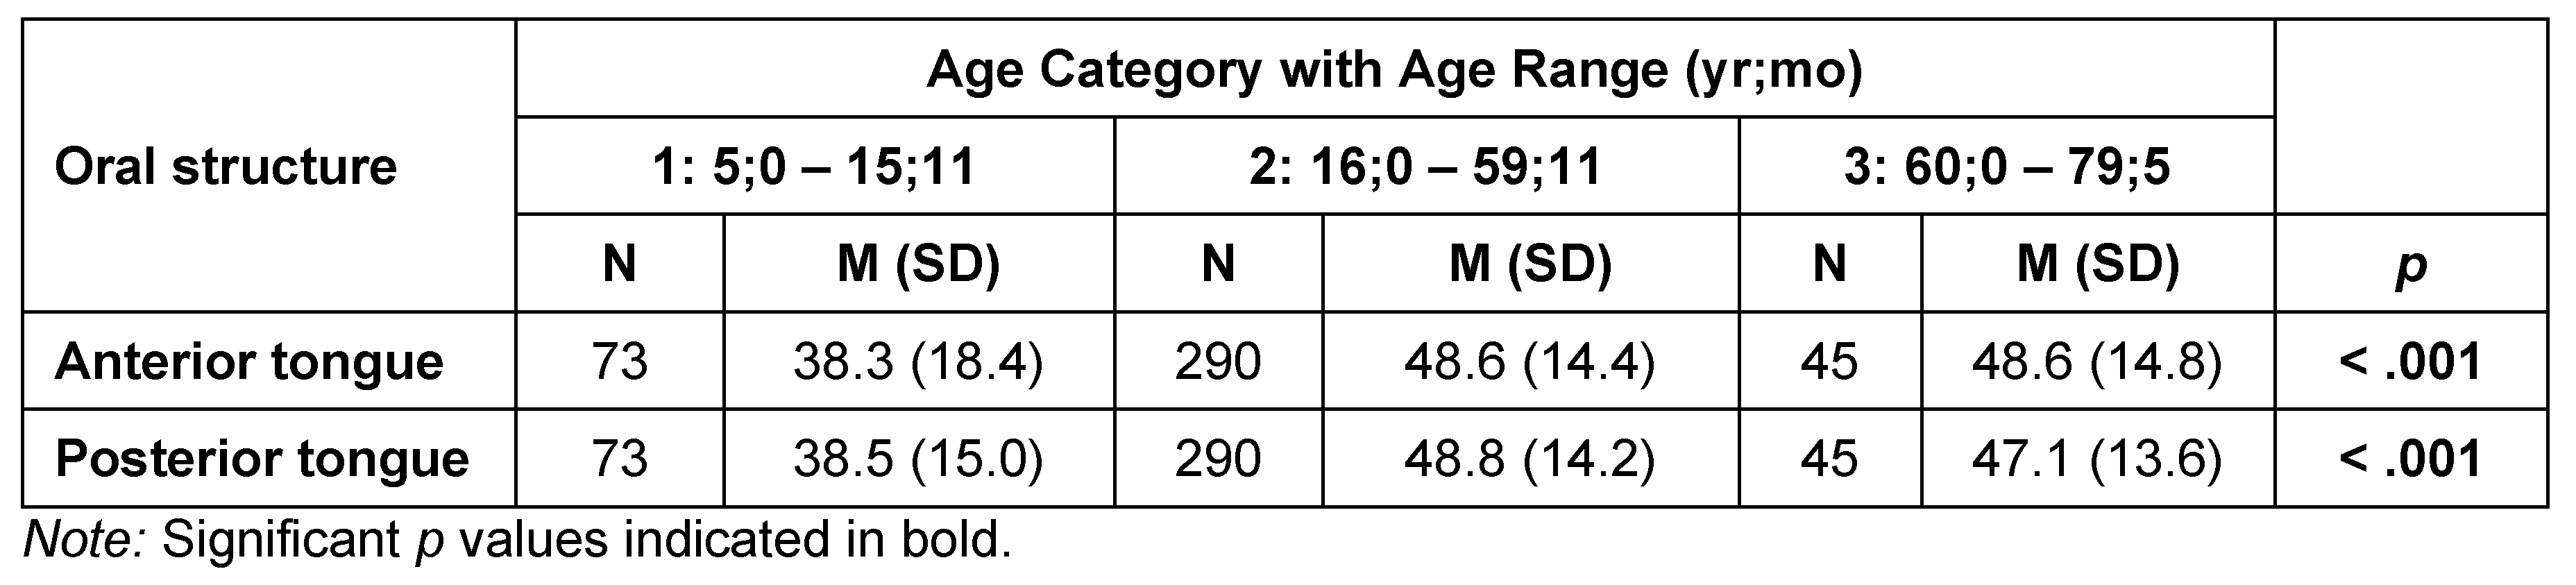
Table 4 and
Table 5 list summary and inferential statistics for tongue strength by age category and sex, respectively. Anterior tongue strength differed significantly by age category (
H = 16.8,
df = 2,
p < .001), as did posterior tongue strength (
H = 24.6,
df = 2,
p < .001). Pairwise comparisons revealed significantly lower anterior tongue Pmax, on average, for the youngest participants (Age Category 1: 38.3 kPa) than for the late-adolescent/adult group (Age Category 2: 48.6 kPa;
W = 5.749,
p < .001), and the older adults of Age Category 3 (48.6 kPa;
W = 3.785,
p = .02). Pairwise comparisons for posterior tongue measures revealed significant differences between Age Category 1 and Age Category 2 (38.5 kPa vs 48.8 kPa:
W = 6.99,
p < .001), as well as between the Age Category 1 and Age Category 3 (38.5 kPa vs 47.1 kPa:
W = 3.785,
p = .022).
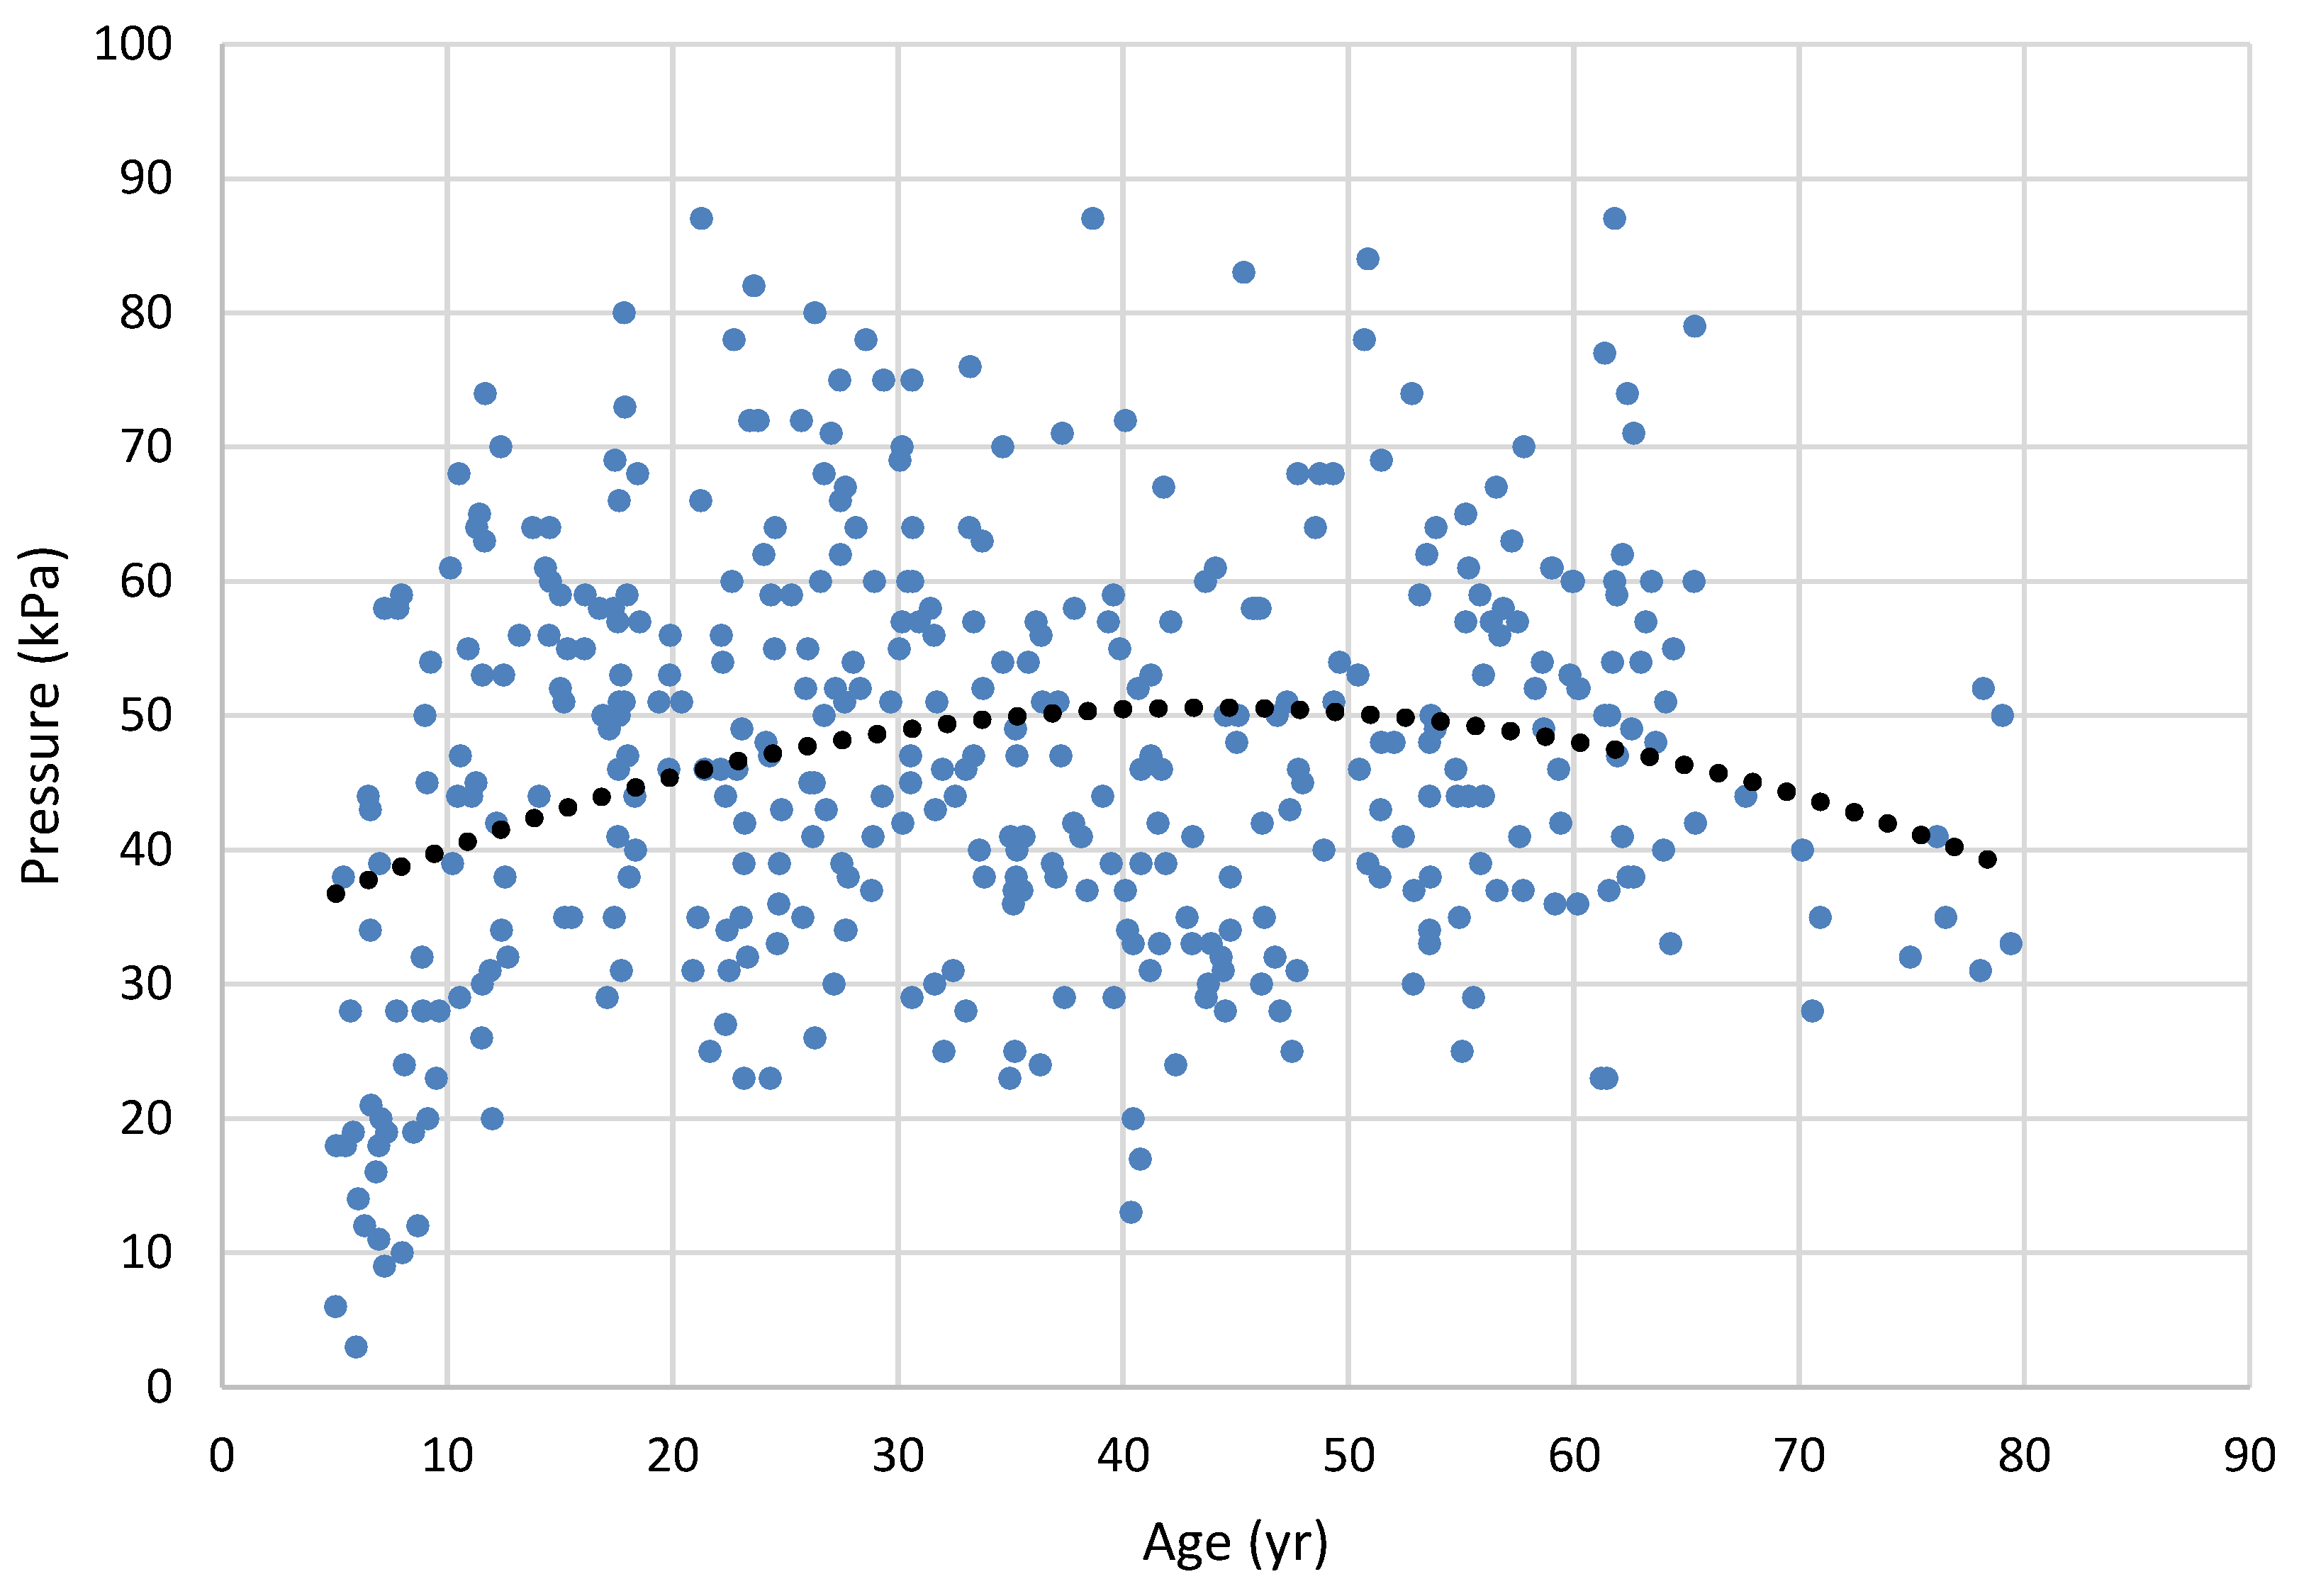
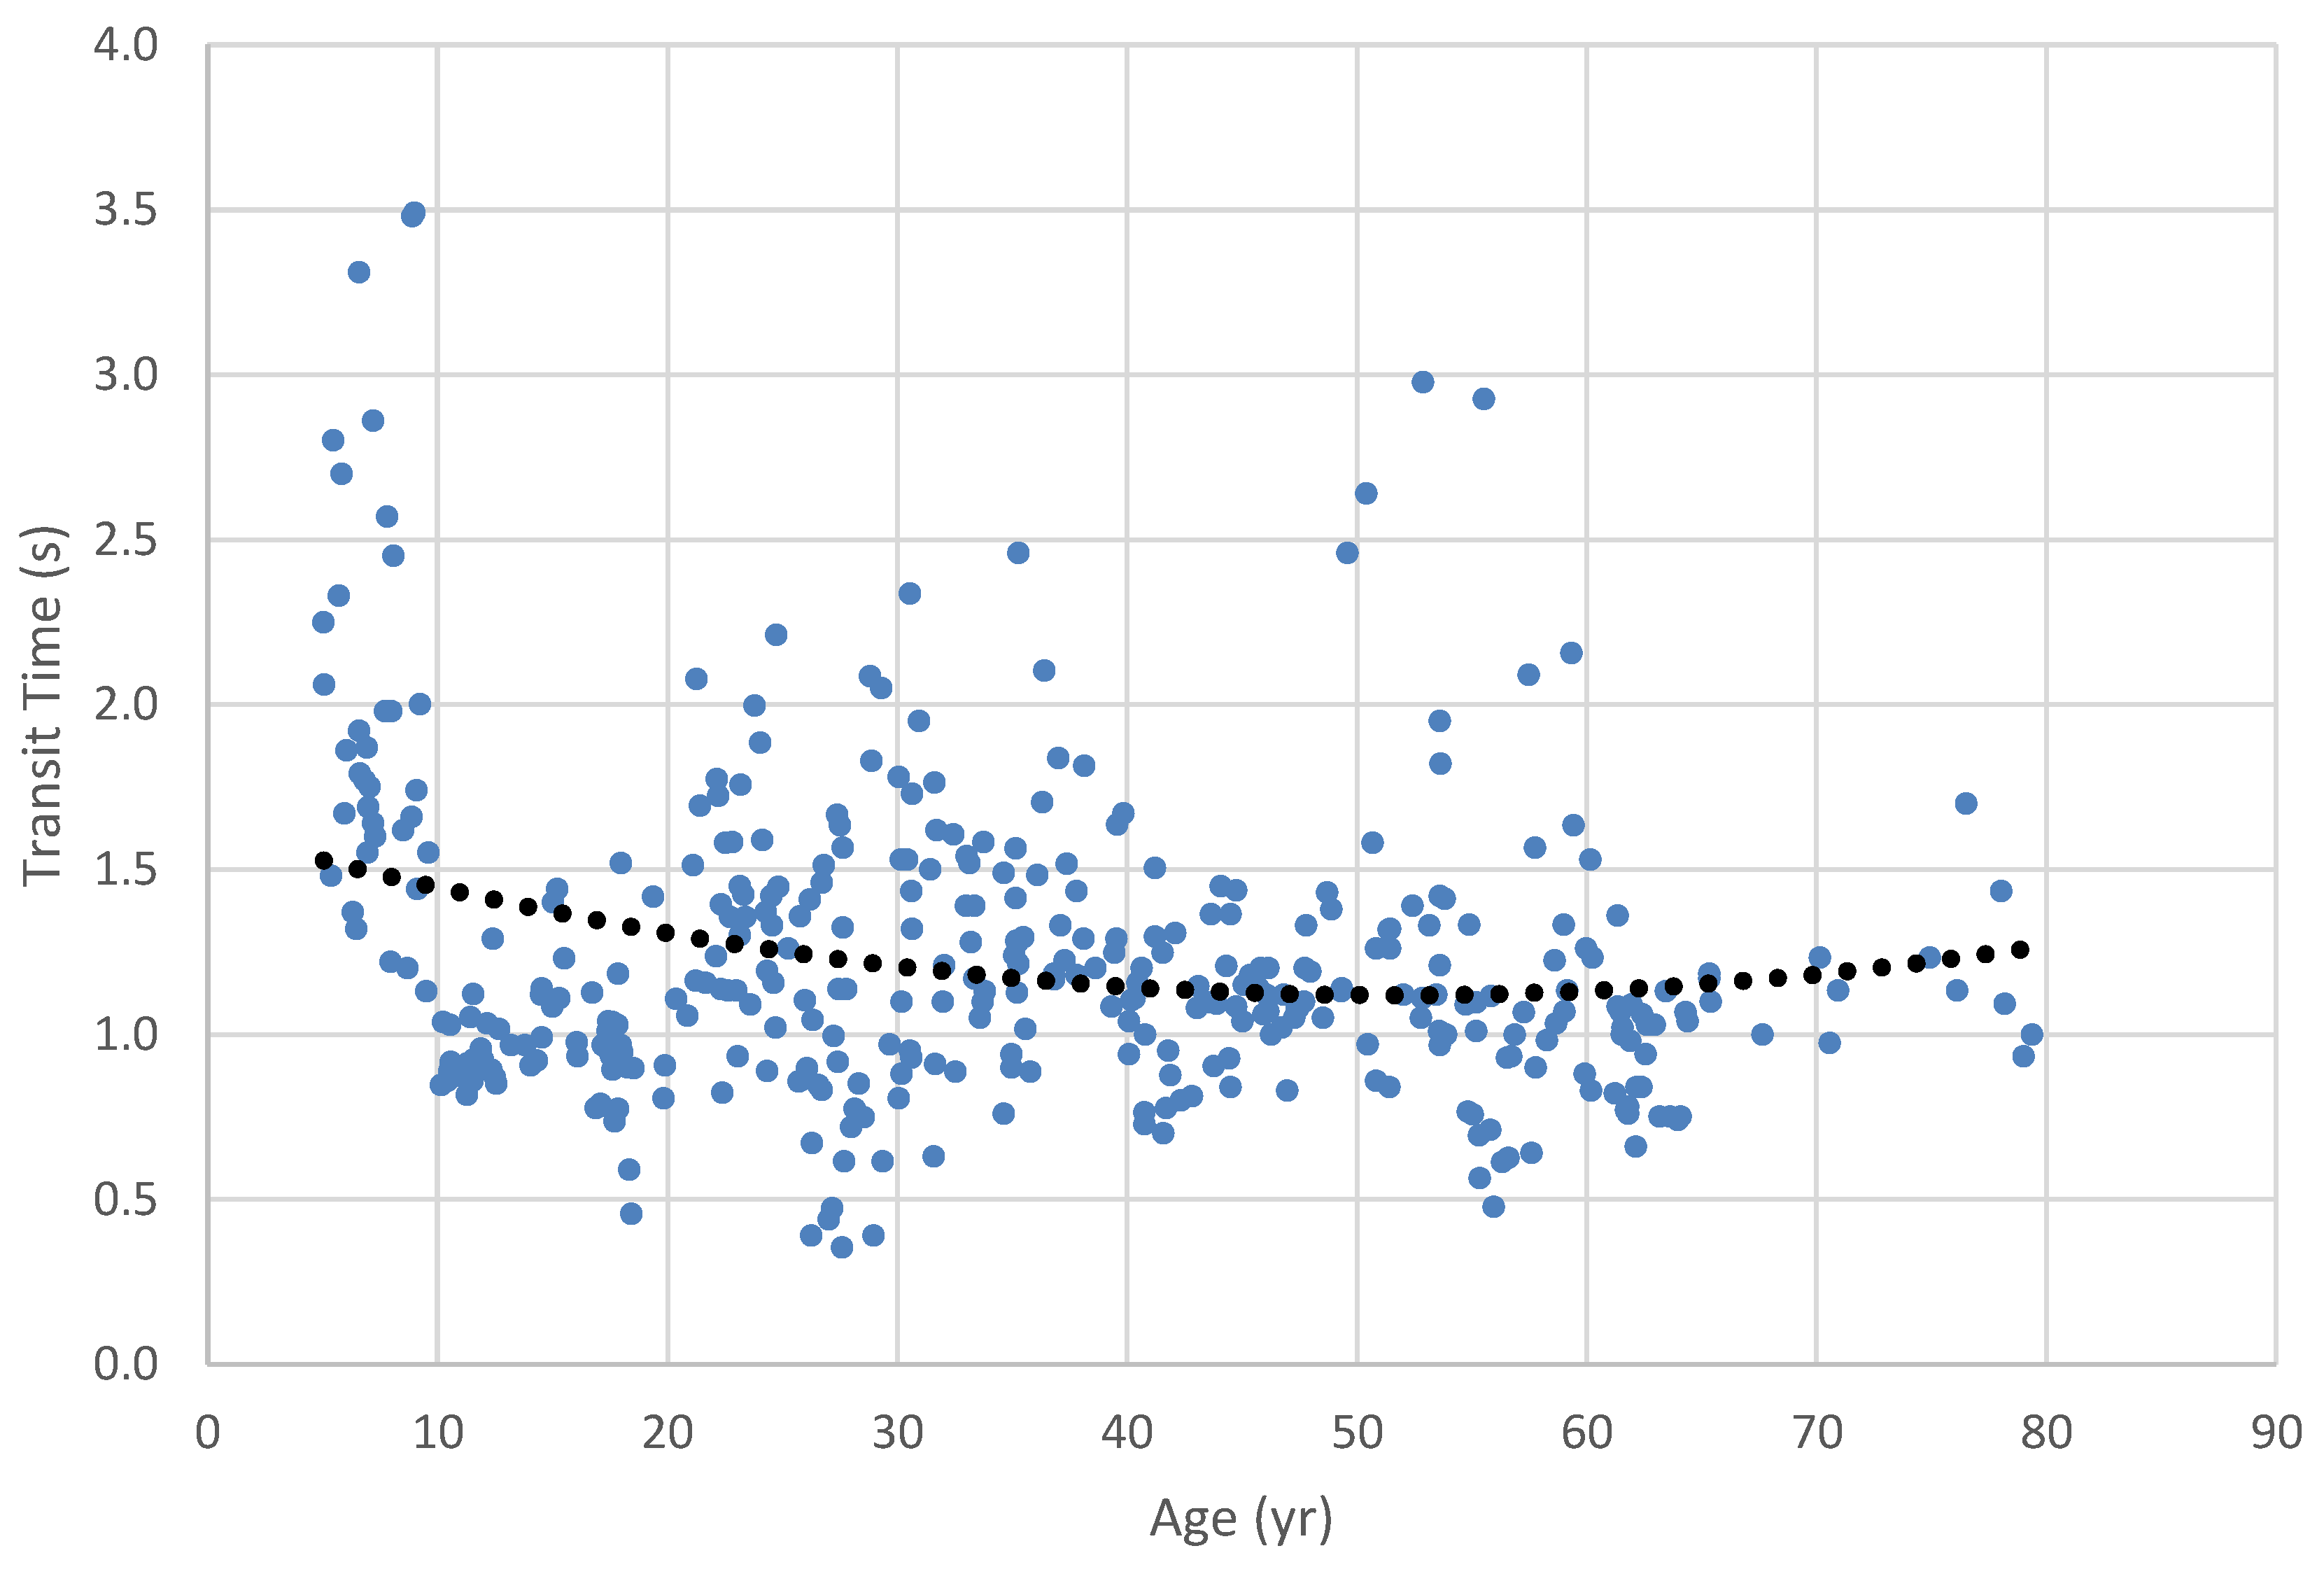
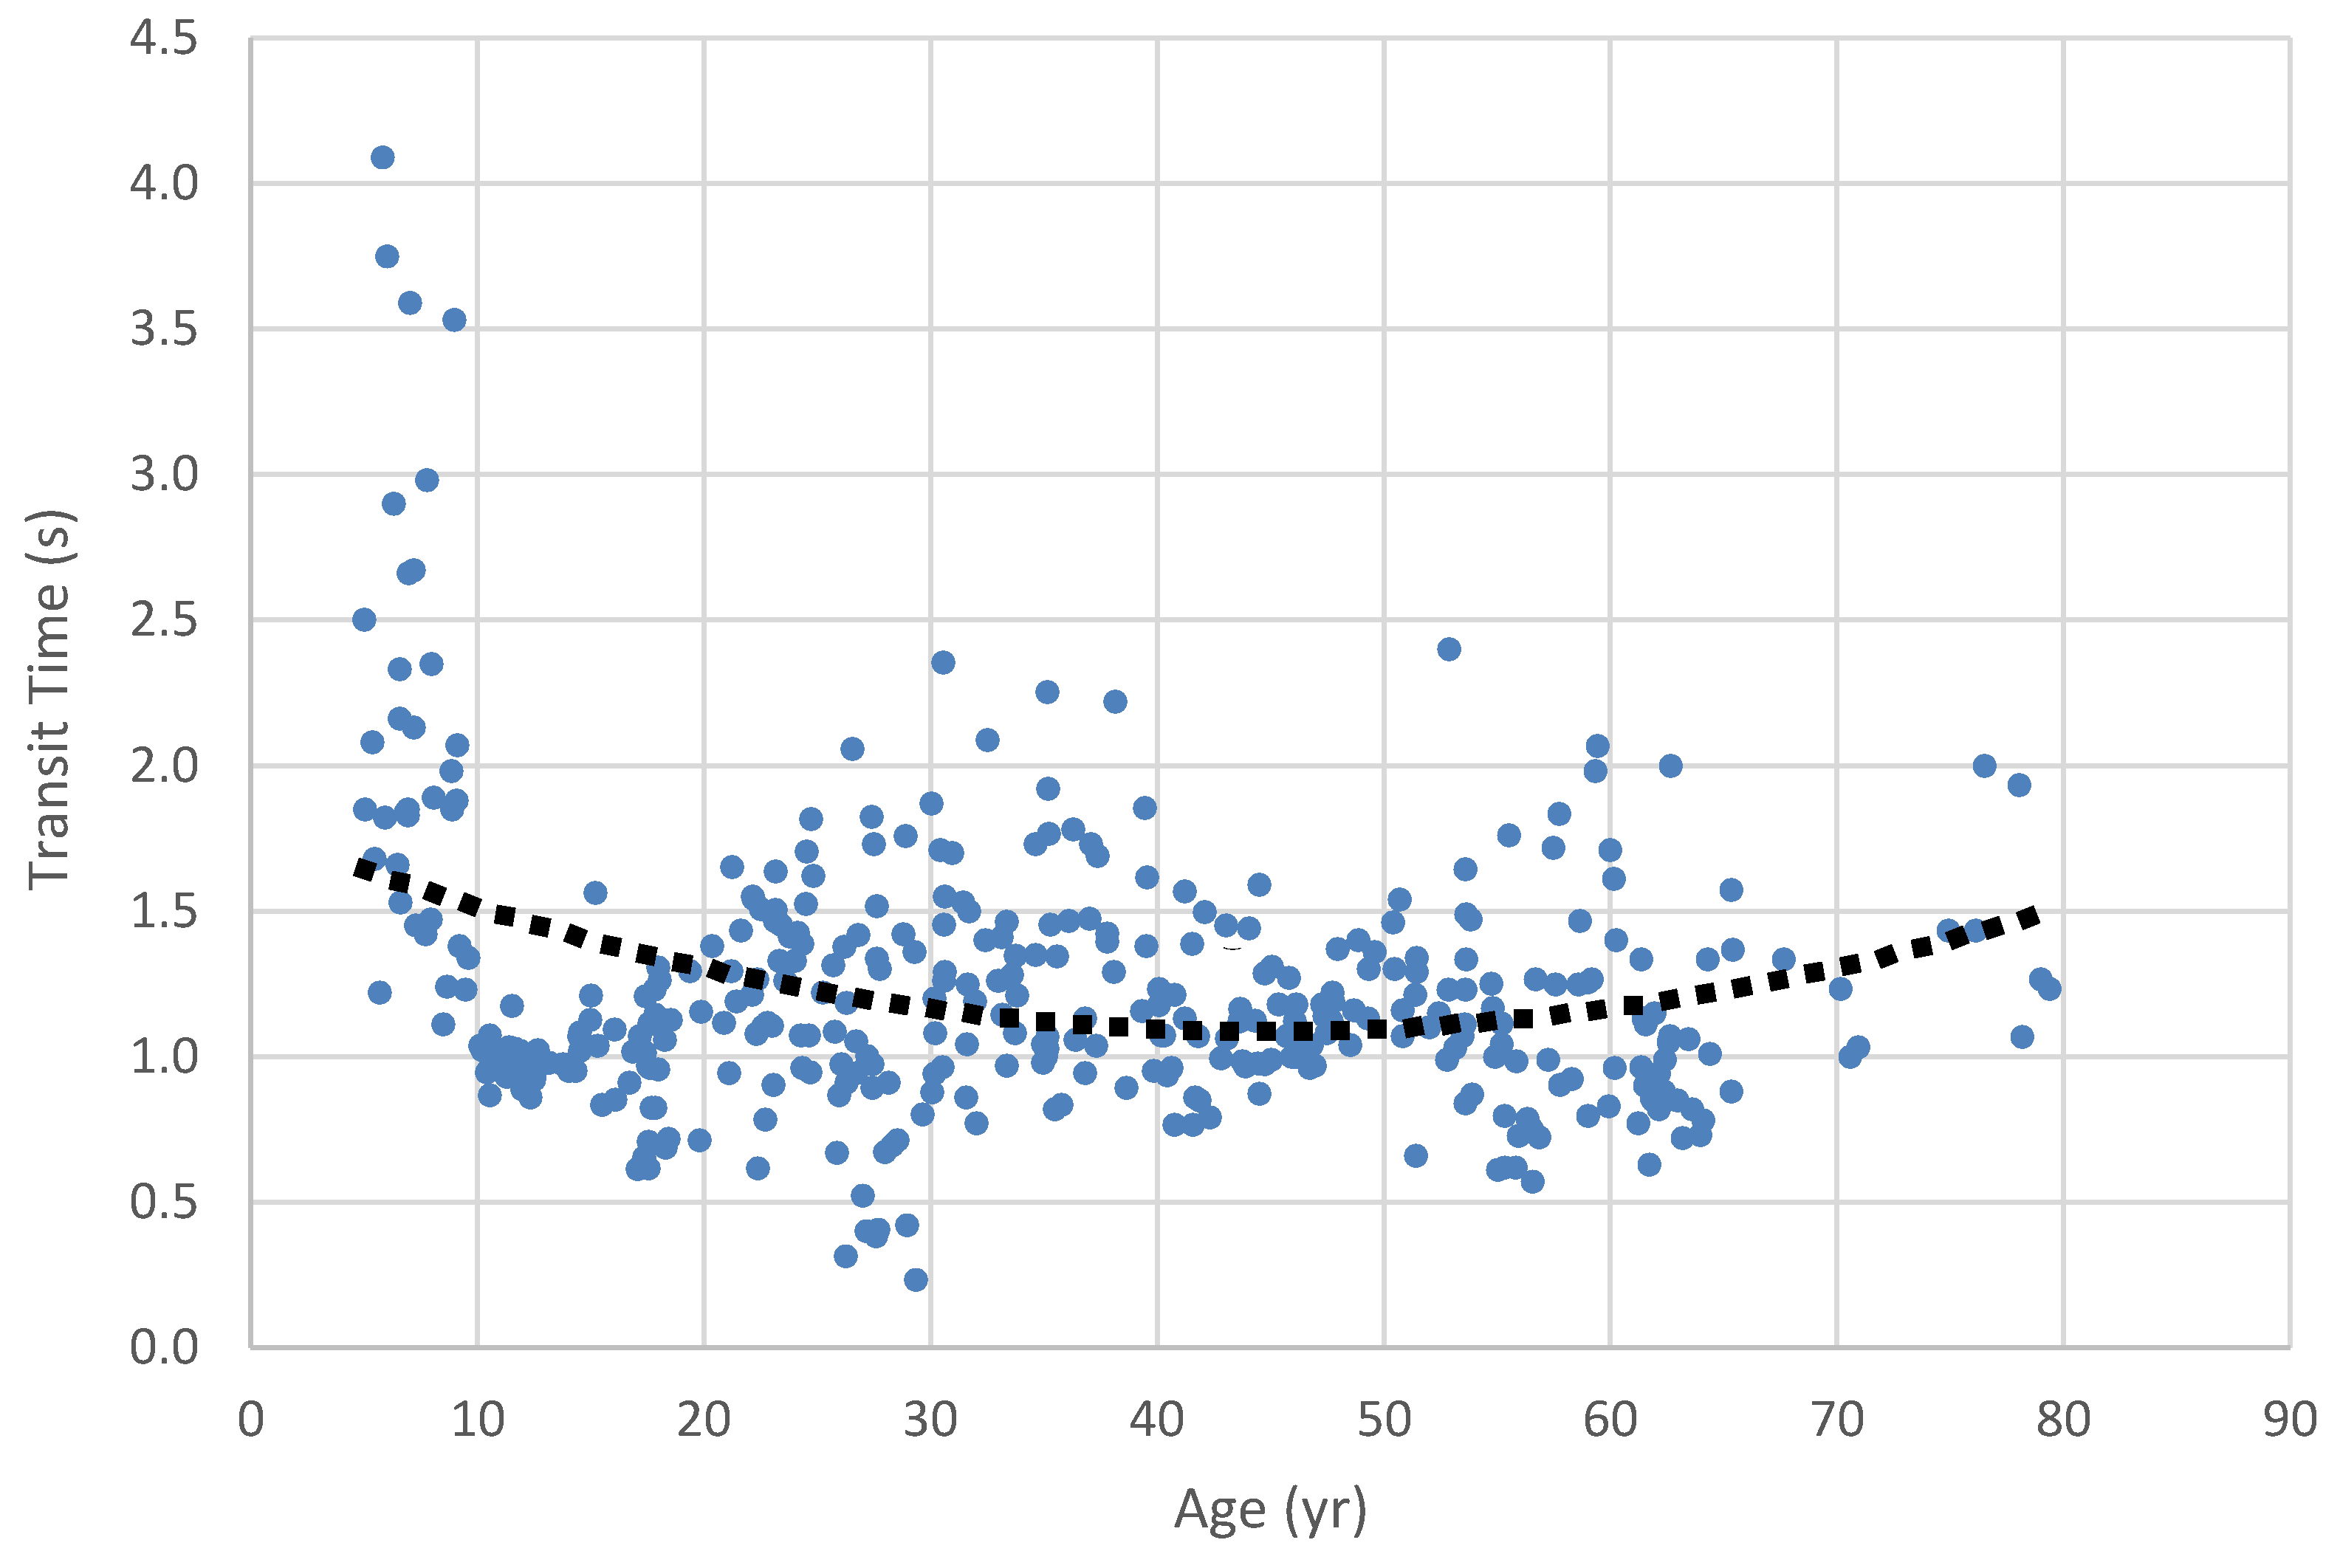
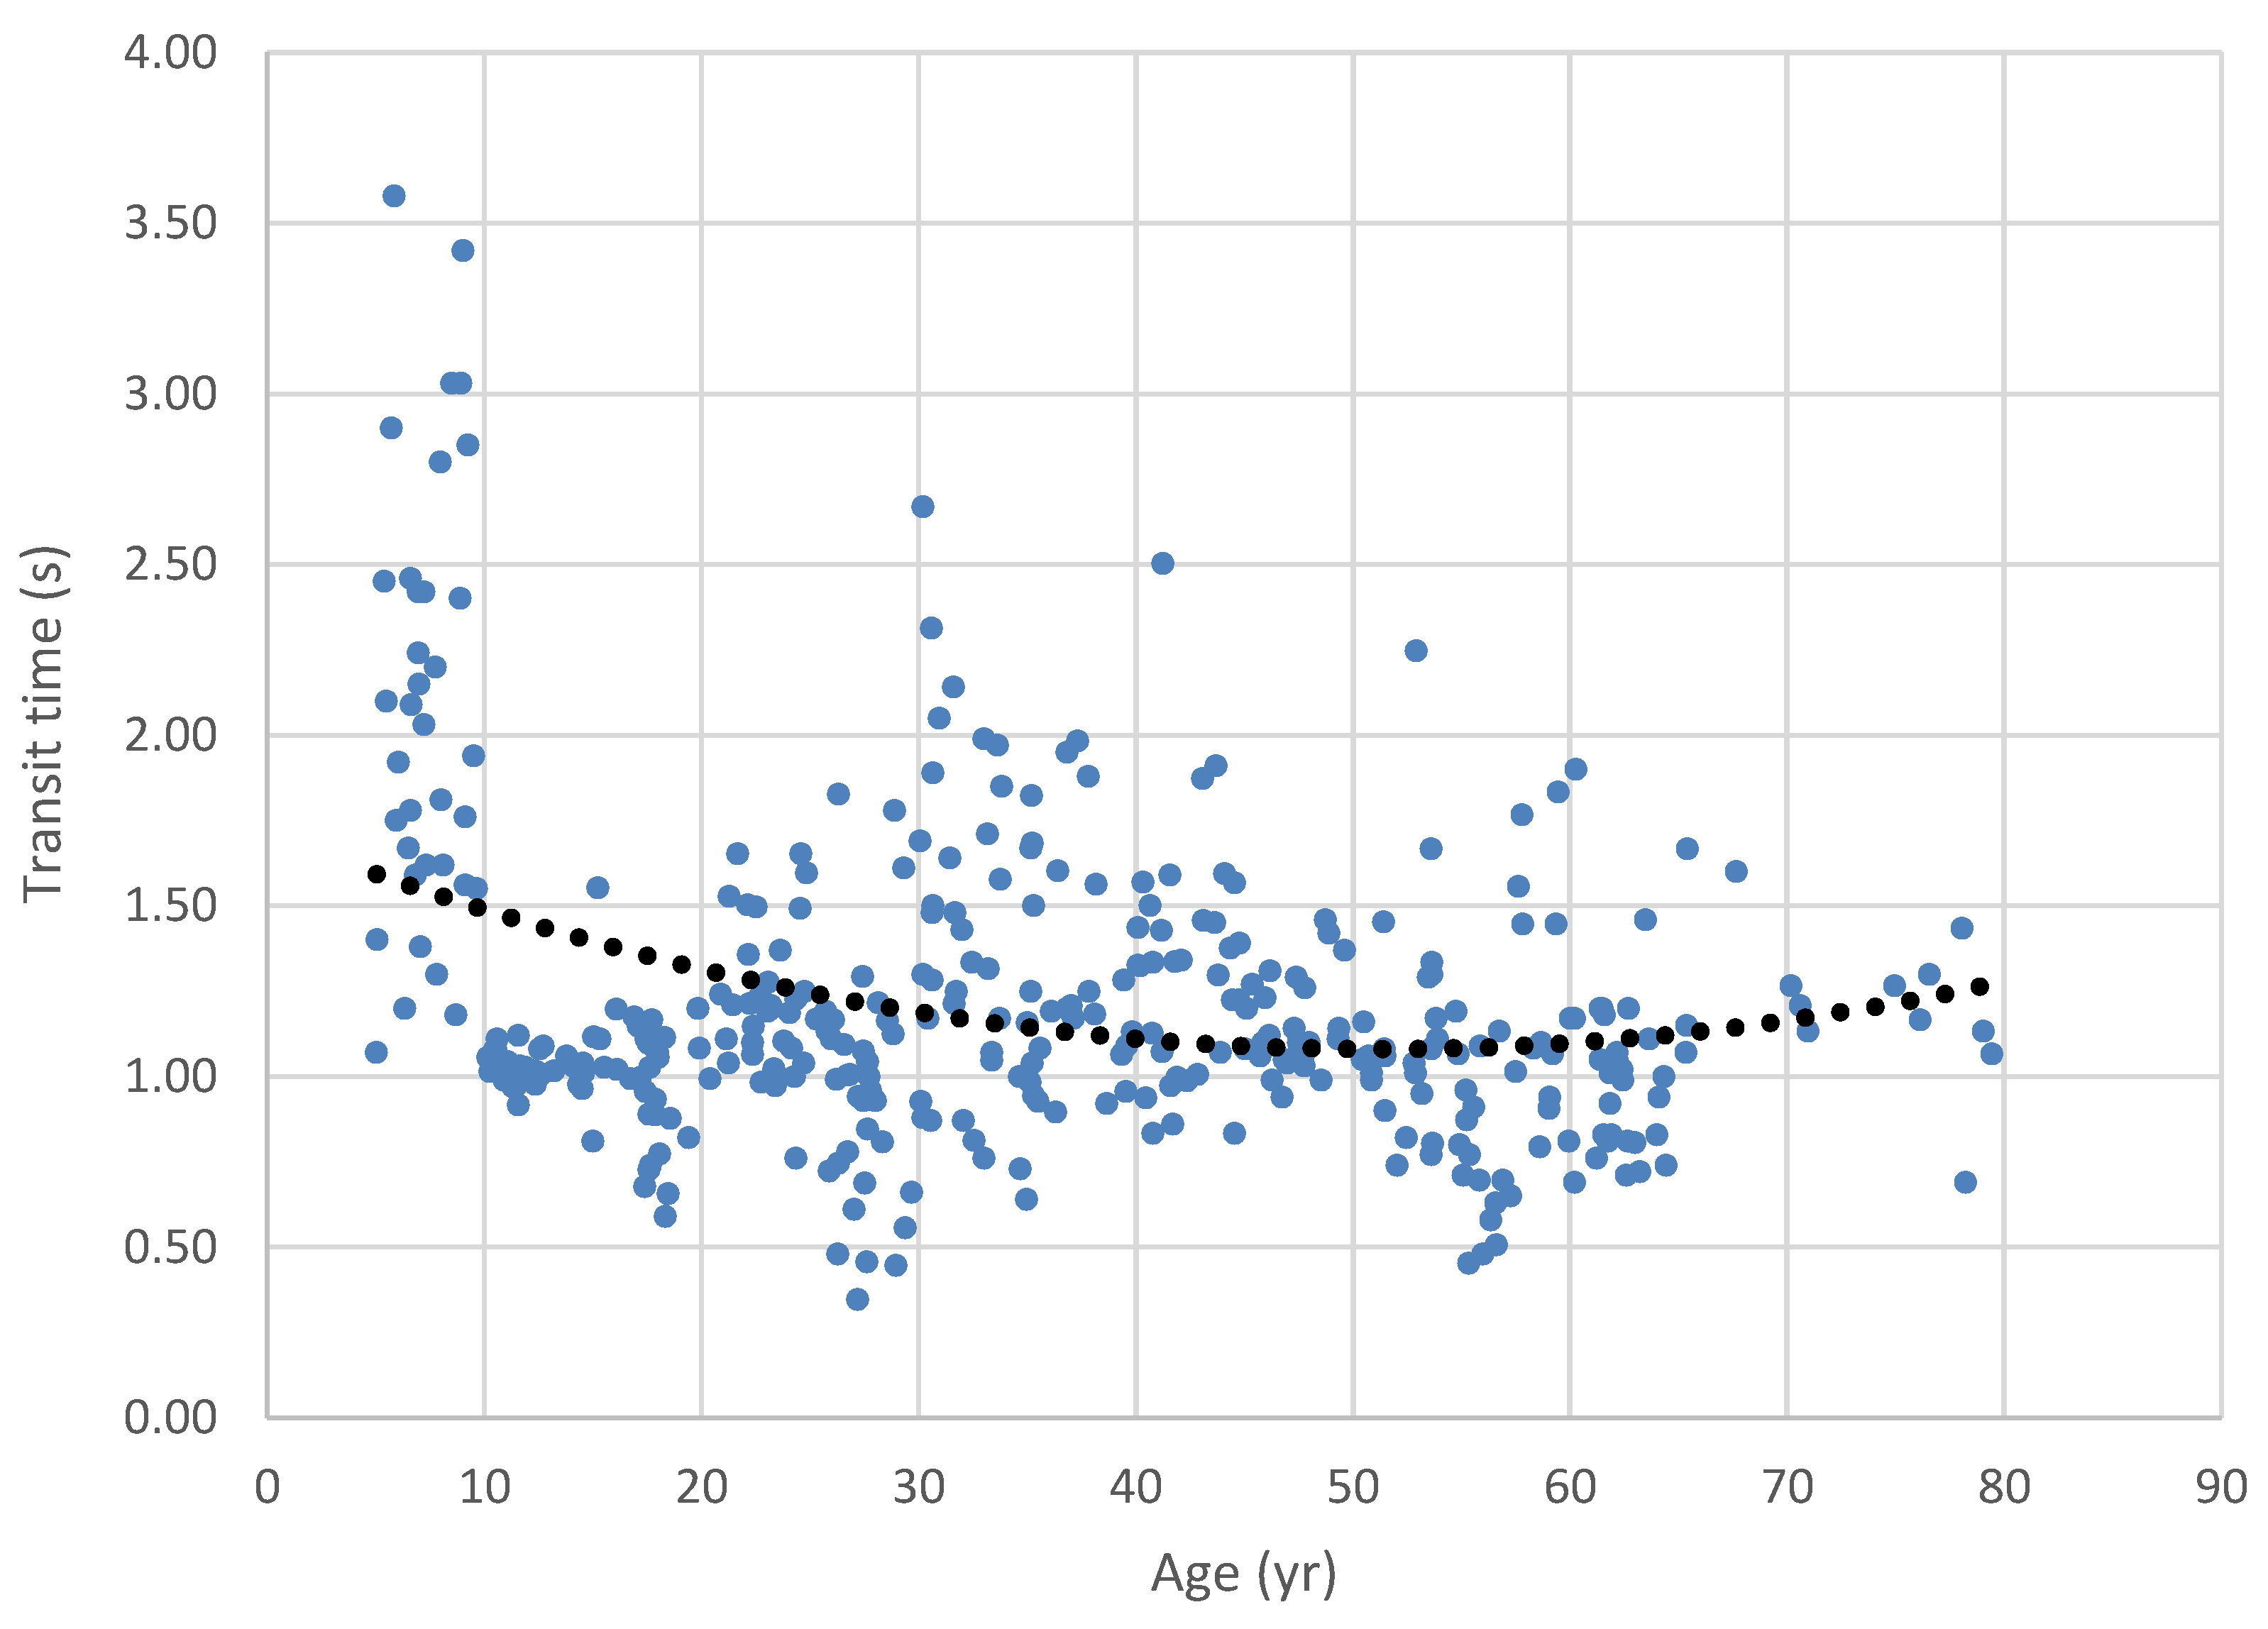
Figure 1 and
Figure 2 illustrate these changes across the lifespan. A polynomial trend line was chosen as the best fit for the data based on examination of the residuals in the relationships between the age variable and those displayed in the lifespan figures.
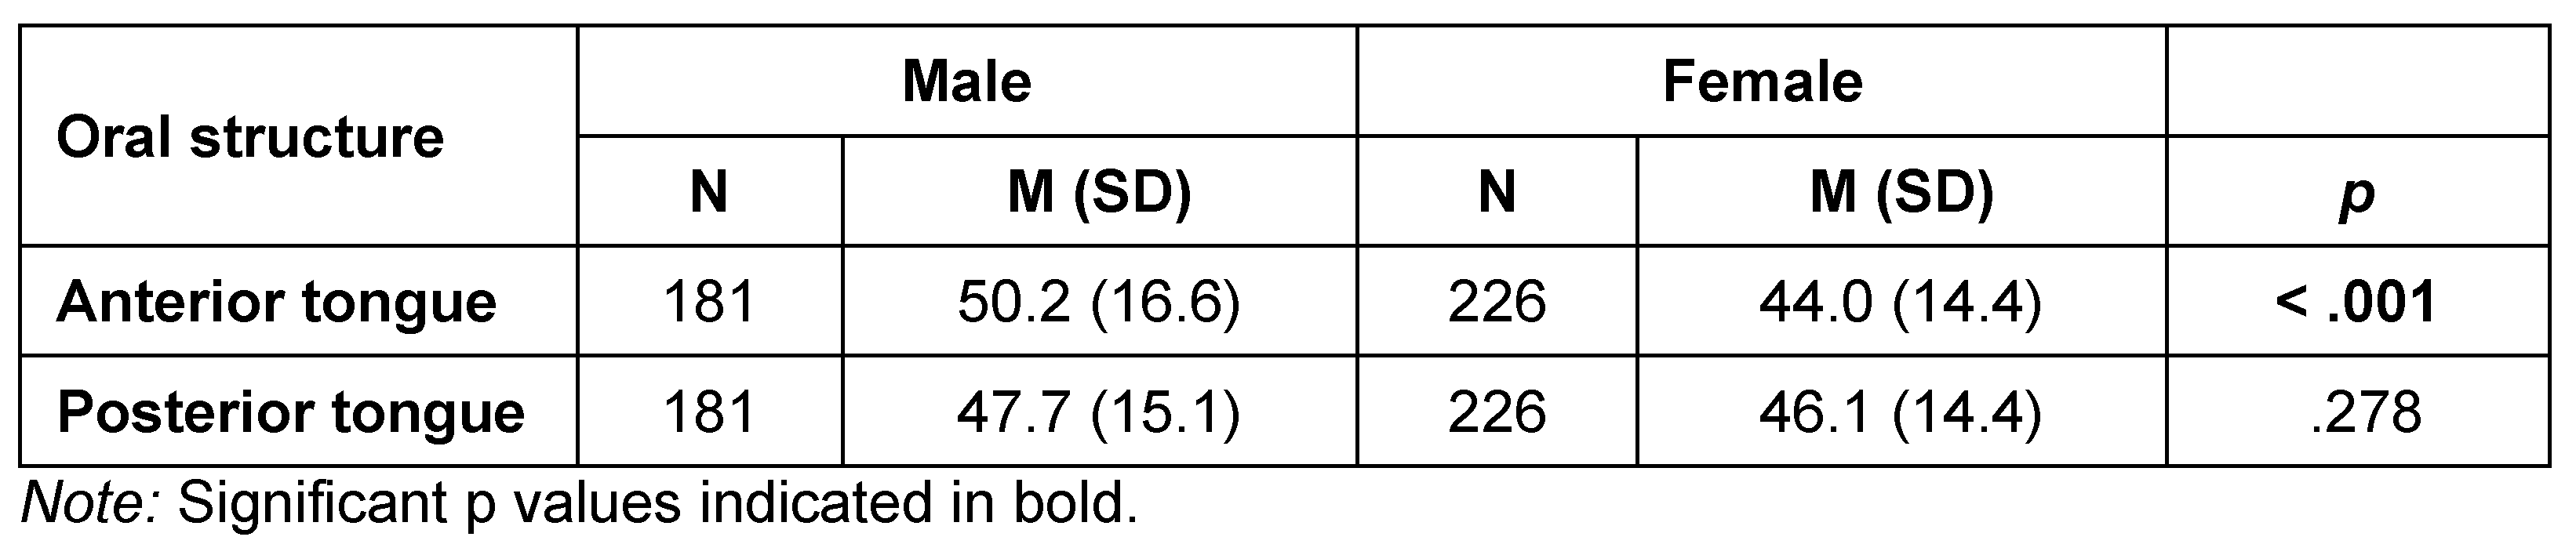
When anterior and posterior tongue strength were compared based on the sex of the participants, anterior Pmax was significantly lower for females than males (
H = 16.65,
df = 1,
p < .001), with anterior Pmax averaging 50.2 kPa for males and 44.0 kPa for females. The posterior tongue strength difference did not differ significantly for sex. Further, there was no statistically significant difference between anterior and posterior tongue strength overall (
t = -0.105,
p = .917).
Figure 3 displays all IOPI strength measures broken down by group and sex.
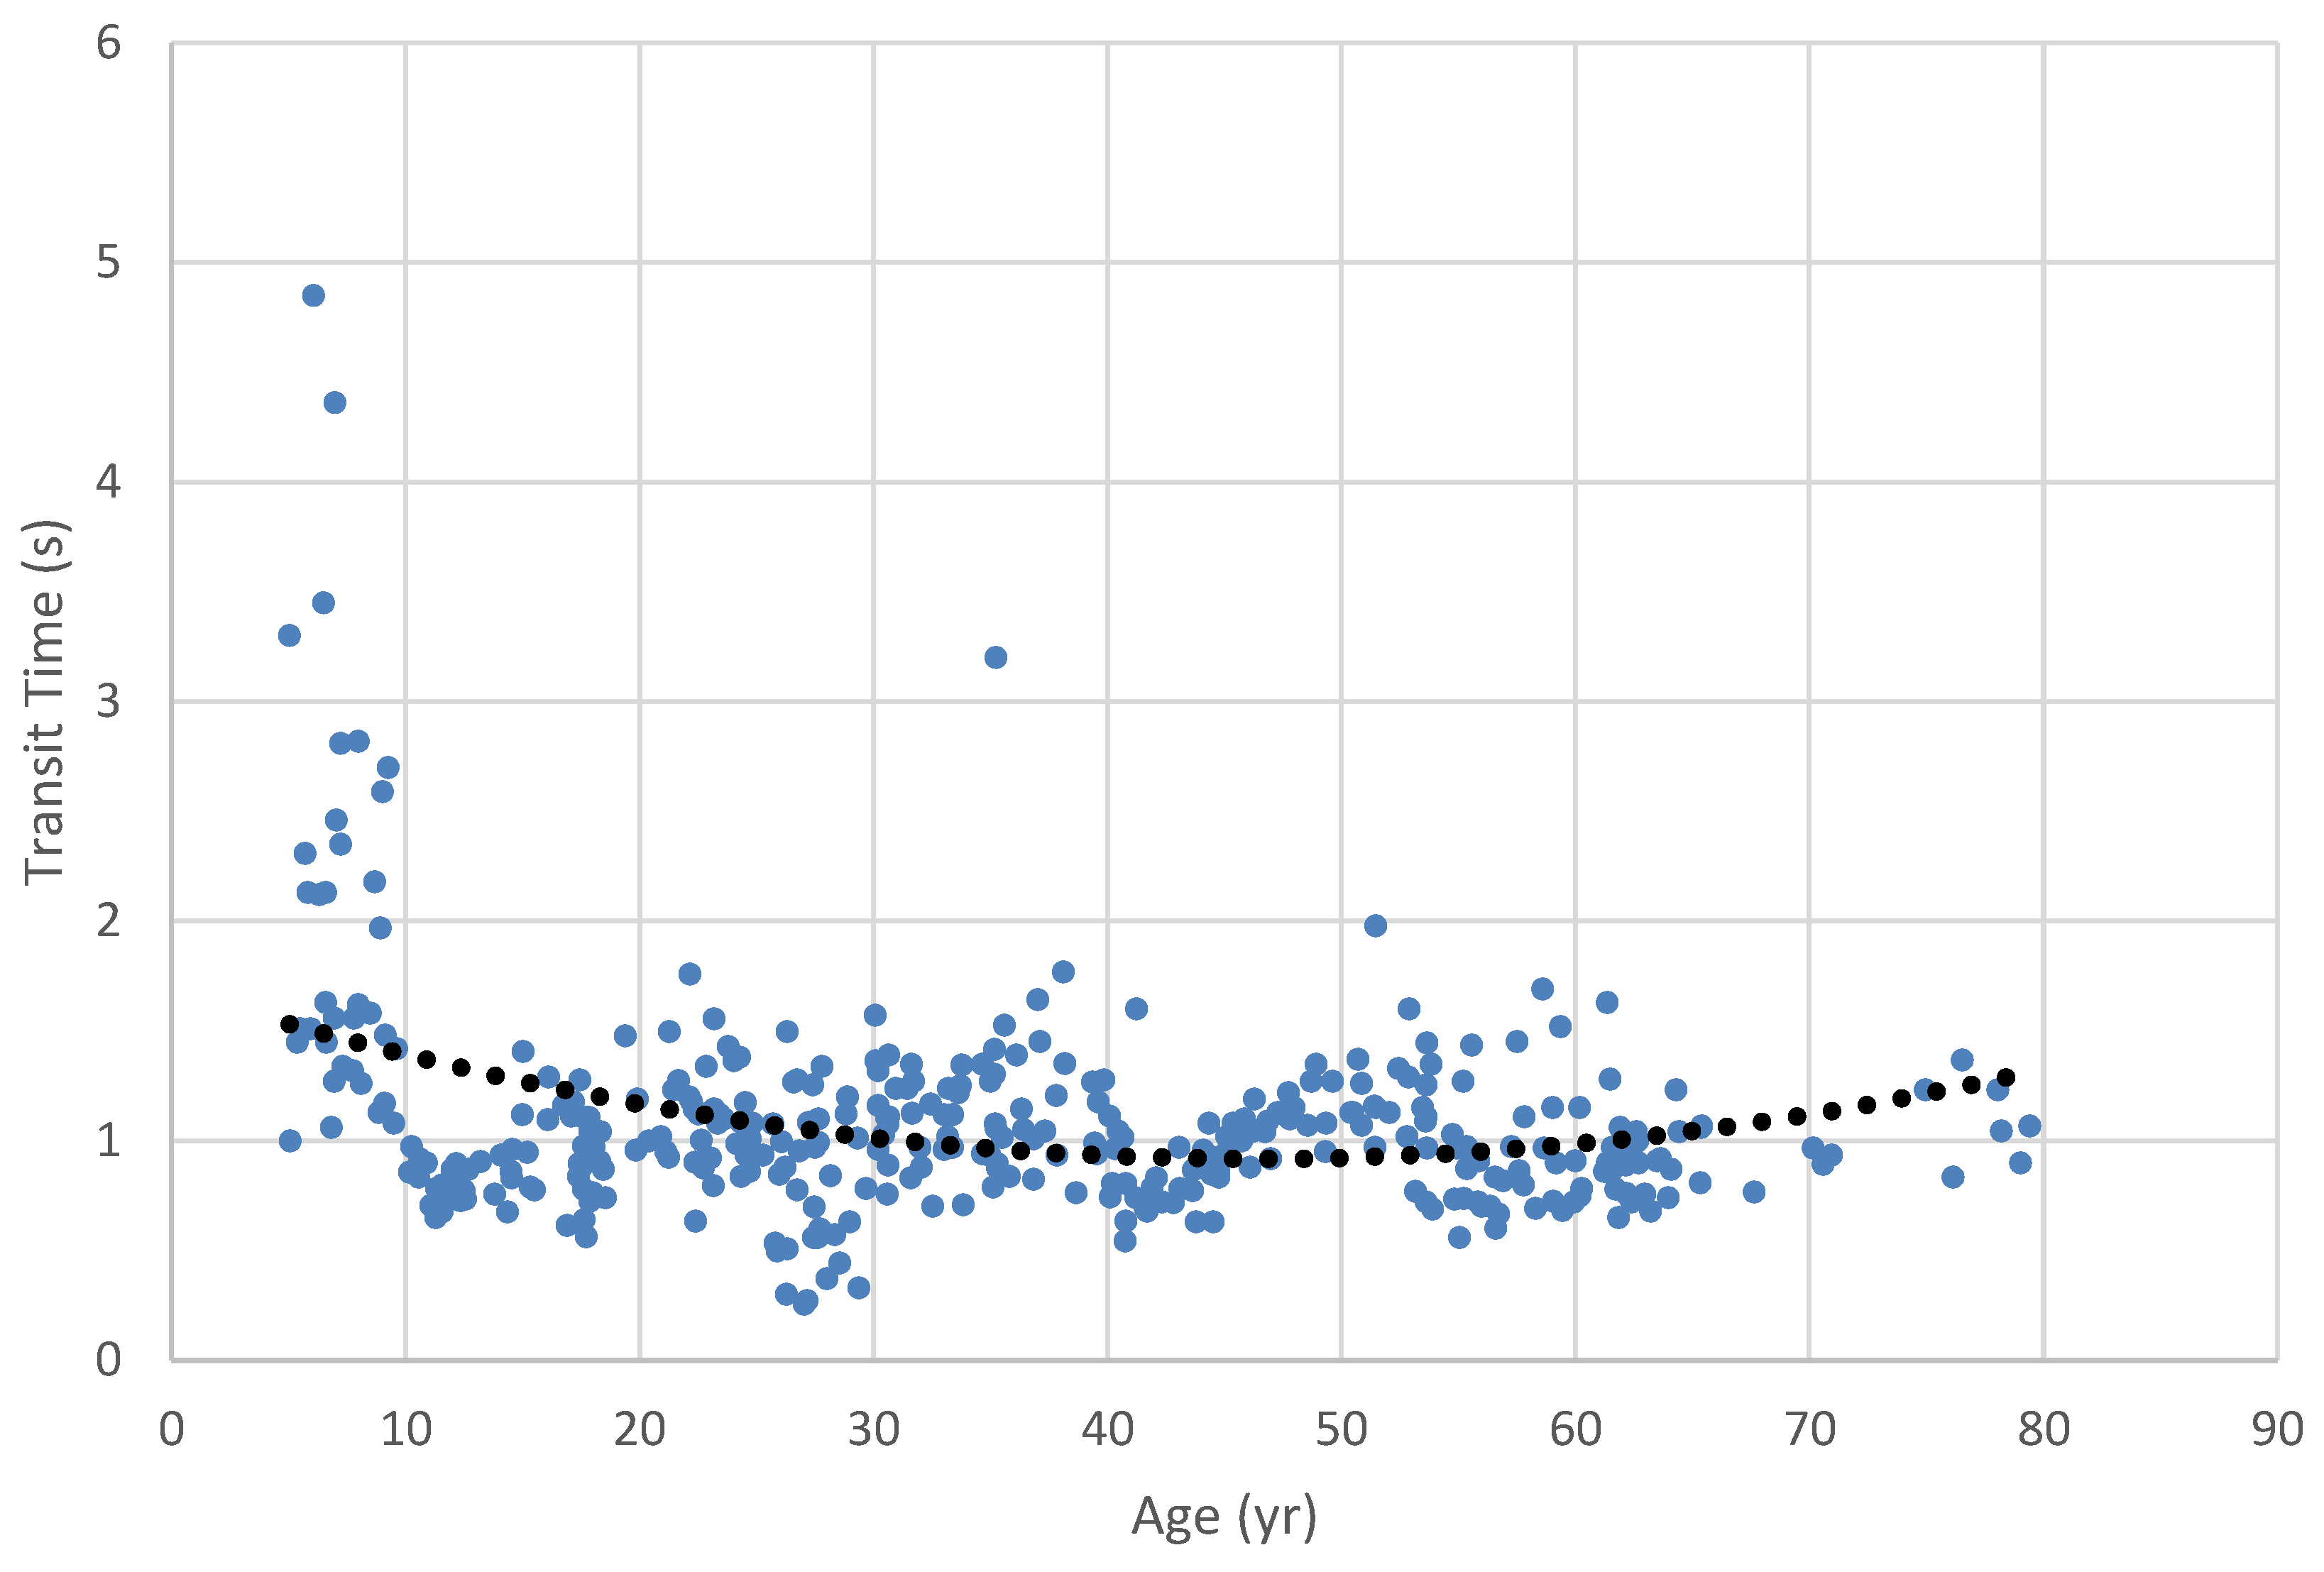
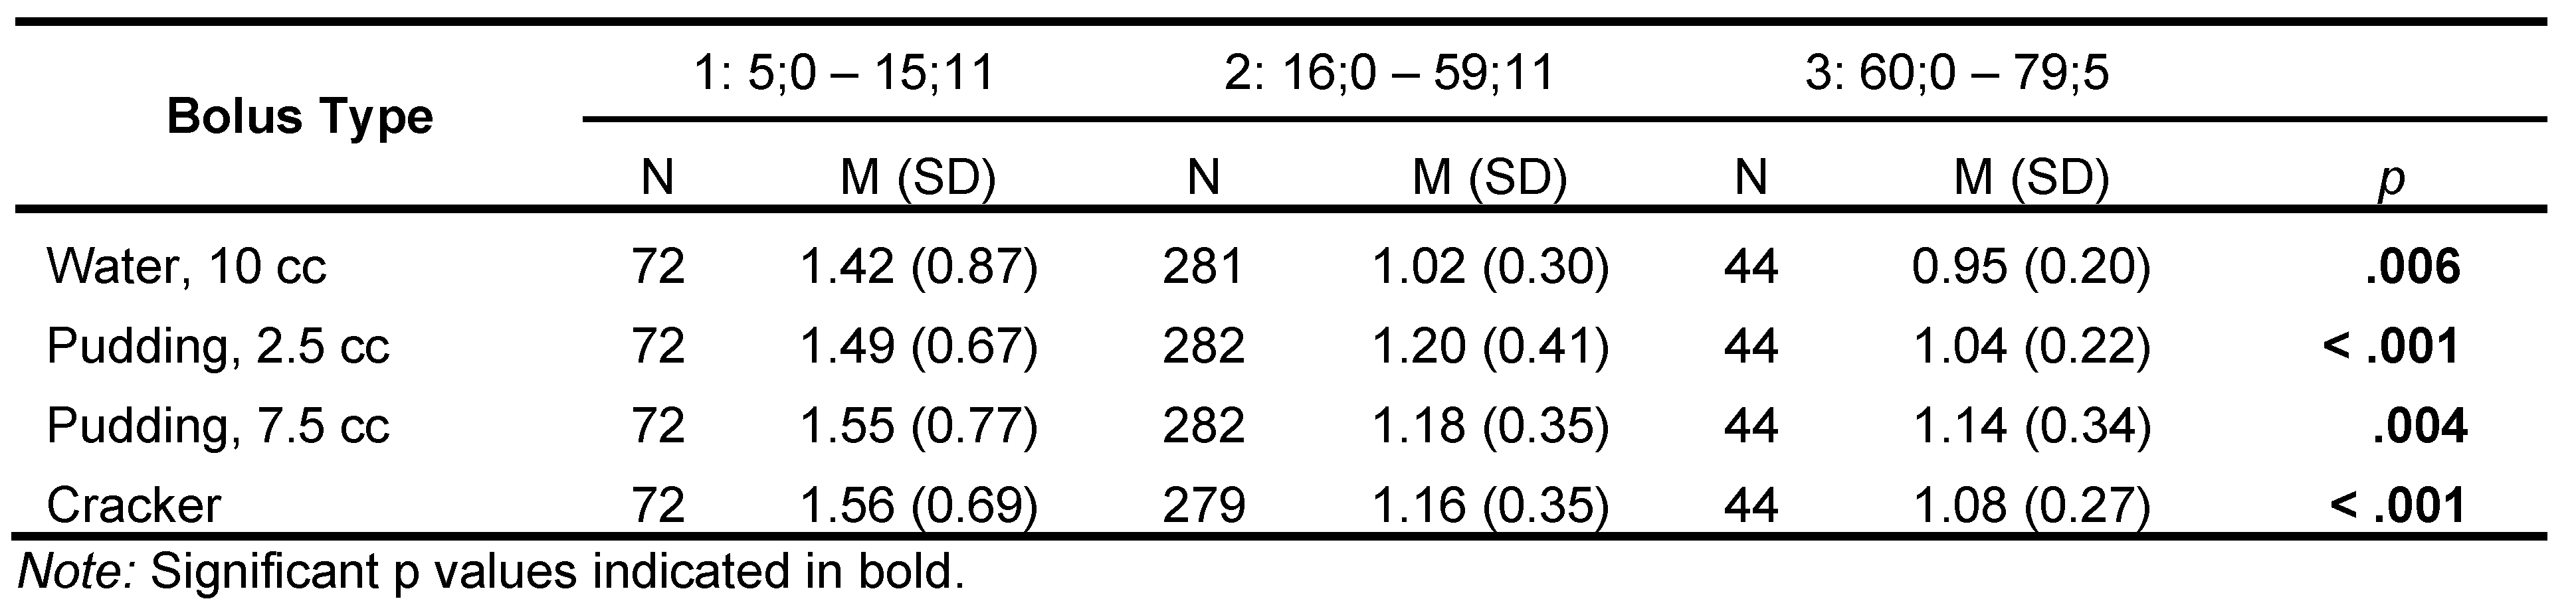
Swallow Timing. Differences between age categories for the 10-cc water bolus. were significant (
H = 10.2,
df = 2,
p = .006); pairwise contrasts revealed that Age Category 1 had significantly longer transit times (
M = 1.42 s) than Age Categories 2 (
M = 1.02 s:
W = -3.6,
p = .029) and 3(M=.954 s: W = -3.43, p = .041) (
Table 6 and
Figure 4,
Figure 5,
, Figure 6,
Figure 7 and
Figure 8).
Similarly, ANOVA examining transit time for the small (2.5 cc) pudding bolus among the age categories was significant (H = 16.7, df = 2, p < .001). Pairwise contrasts revealed that all groups were significantly different from each other. Age Category 1’s transit time (1.49 s) was significantly longer than that of Age Category 2 (1.20 s; W = -3.82, p = .019) and 3 (1.04 s; W = -5.19, p <.001). Transit times for Age Category 2 were significantly longer than those for Age Category 3 (W = -3.94, p = .015).
The ANOVA calculated to compare age categories for the larger 7.5 cc pudding bolus was significant (H = 10.8, df = 2, p = .004). Pairwise contrasts revealed that transit time for Age Category 1 was significantly longer than that of Age Category 2 (1.55 s vs. 1.18 s; W = -4.0, p = .013), and Age Category 3 (1.14 s; W = - 4.22, p = .008). The difference in transit time for Age Categories 2 and 3 was not significant.
The ANOVA comparing the cracker bolus transit time across age categories was significant (H = 16.9, df = 2, p < .001). Pairwise contrasts had results similar to the larger pudding bolus, with the Age Category 1 group having significantly longer transit times than Age Categories 2 (1.56 s vs. 1.16 s; W = -5.31, p < .001) and 3 (1.08 s; W = -4.87, p = .002). Again, the late-adolescent/adult and older groups did not differ significantly.
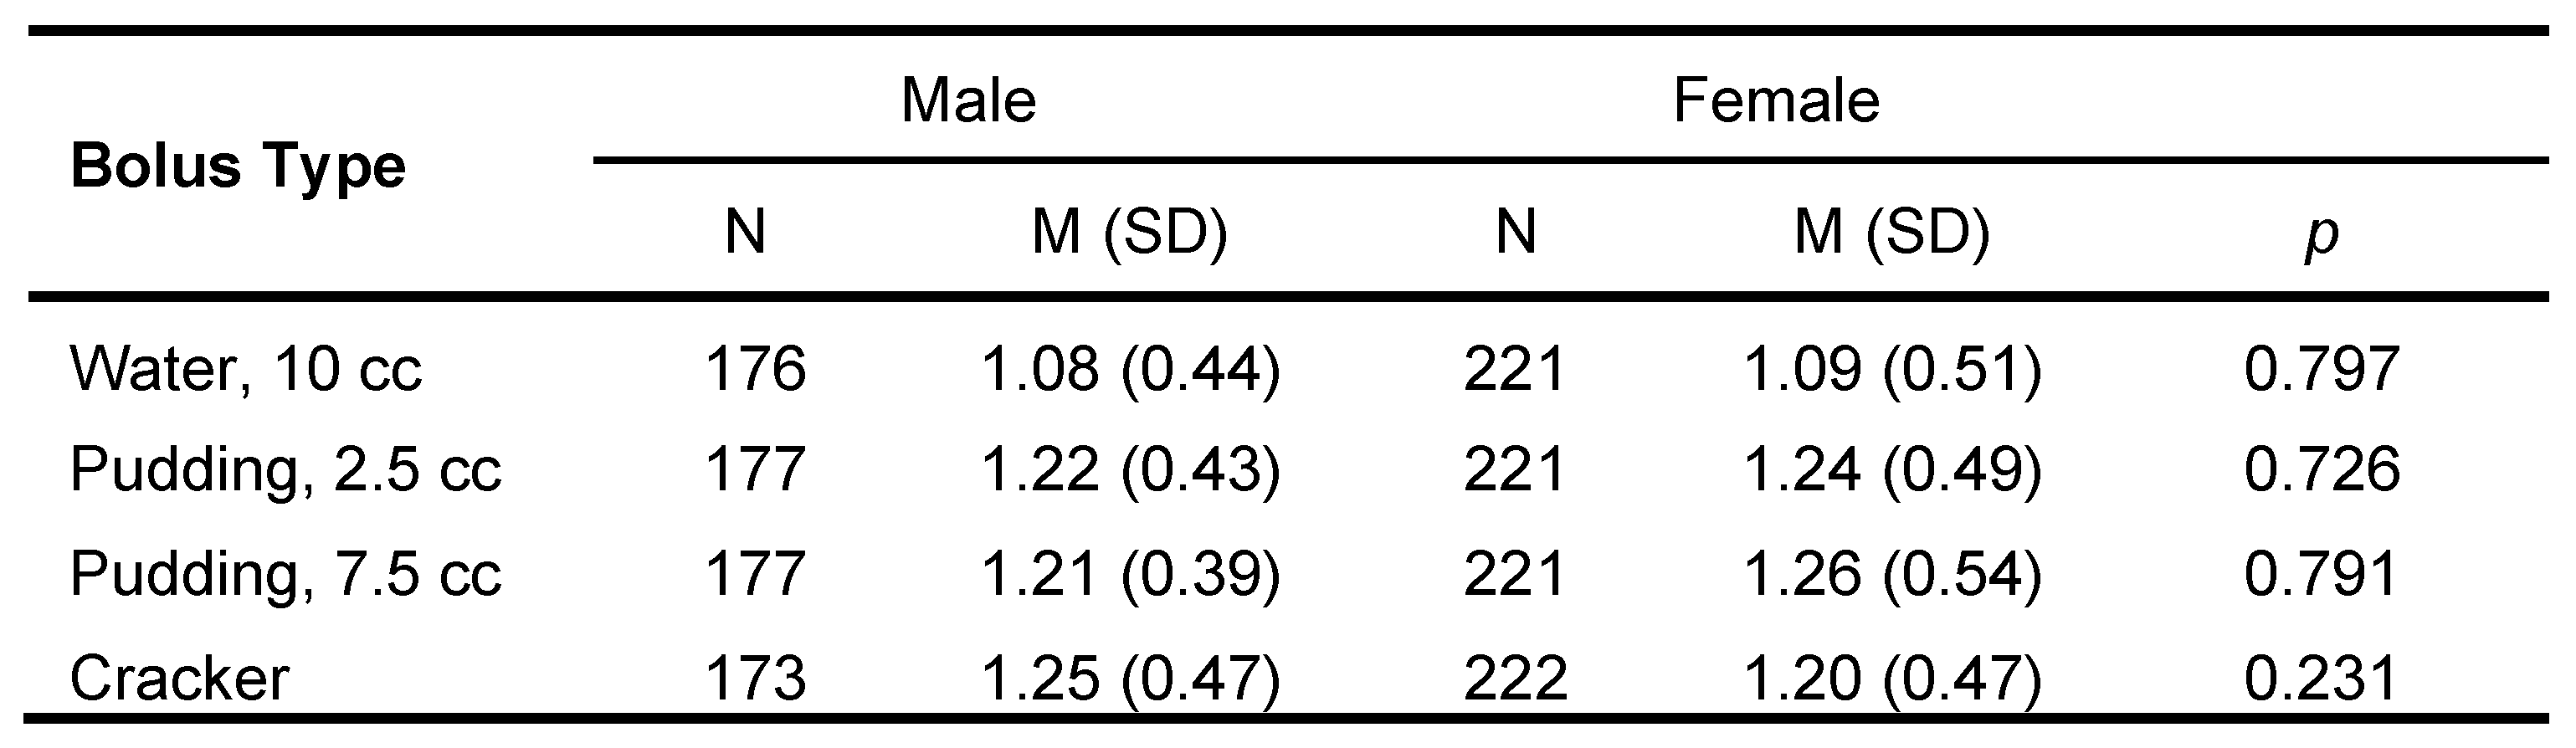
Oropharyngeal transit time as differentiated by sex was examined for each bolus consistency. There were no significant differences between sexes across the lifespan for bolus consistency and swallow timing (
Table 7).
sEMG Masseter Activity Measures
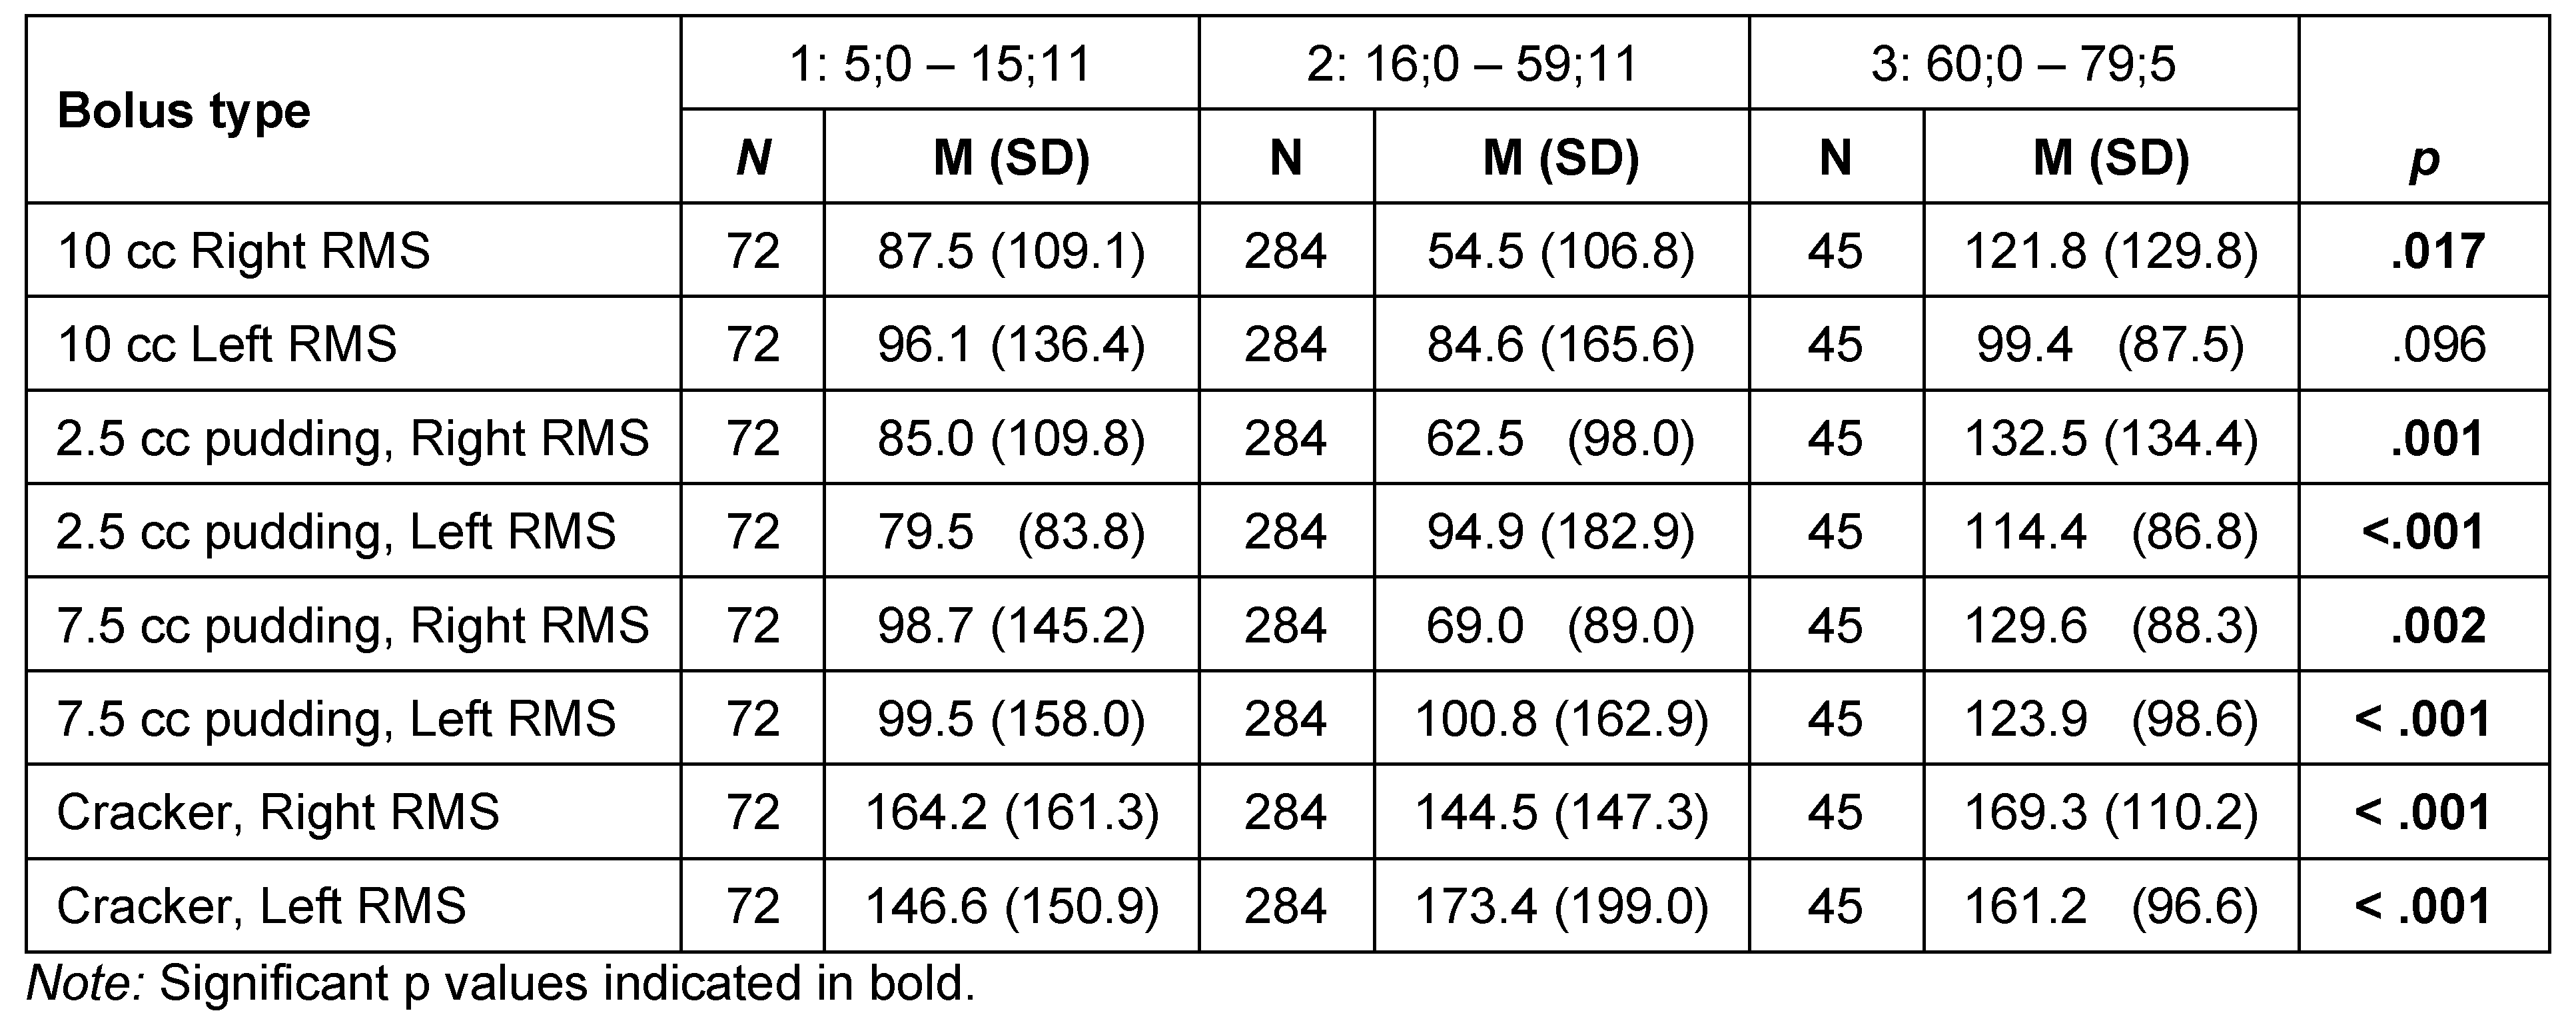
Results for masseter activity (sEMG in µV) during the swallow for each of the four bolus types among age categories and differences based on sex are shown in
Table 8 and
Figure 9. Differences were statistically significant for the 10-cc water bolus for the right masseter based on age category (
H = 8.21,
df = 2,
p = .017) but not for the left masseter. Pairwise comparisons revealed that this right masseter difference was within the contrast between Age Categories 1 and 3 (87.8.6 µV vs. 121.8 µV;
W = 4.671,
p = .03). There was no significant difference for the water bolus based on sex.
Masseter activity for the 2.5 cc pudding bolus revealed significant differences for both right (H = 13.35, df = 2, p = .001) and left (H = 15.27, df = 2, p < .001) masseters. Pairwise contrasts revealed that the right masseter differences again resided within the youngest group, with a significant contrast between Age Category 1 and Age Category 3 (85.0 µV vs. 132.5 µV: W = 6.03, p < .001). The youngest group had lower activity when compared with the older adults. The left masseter ANOVA was also significant for the 2.5 cc pudding bolus (H = 15.27, df = 2, p < .001). The pairwise contrasts showed the difference to reside again in the children, with left masseter in Age Category 1 being significantly more active when compared with Age Categories 2 (79.5 µV vs. 94.9 µV; H = 4.80, p = .002) and 3 (79.5 µV vs. 111.4 µV; W = 5.70, p < .001). The right masseter activity for the 2.5 cc pudding bolus was significantly higher (78.4 µV) for males than females (70.8 µV; H = 5.758, p = .016).
The ANOVA examining the masseter activity for the right side for the 7.5 cc pudding bolus was significant (H = 12.60, df = 2, p = .002), and pairwise contrasts revealed that the muscle activity of Age Category 1 was significantly lower than Age Category 3 (98.7 µV vs. 129.6 µV; W =6.17, p < .001), with other contrasts failing to reach significance. The left masseter showed a similar pattern of activity relative to the smaller pudding bolus. The ANOVA was significant (H = 16.79, df = 2, = p < .001), with Age Category 1 having significantly lower activity than Age Categories 2 (99.5 µV vs. 100.8 µV; W = 5.243, p < .001) and 3 (99.5 vs. 123.9 µV; W = 5.57, p < .001). Right masseter activity was lower in males than females for the 7.5 cc bolus (77.7 µV vs 83.7 µV; H = 5.52, p = .019).
The ANOVA examining the masseter activity for right side for the cracker bolus was significant (H = 16.28, df = 2, p < .001). Pairwise comparisons revealed that the significant difference was found in greater right-side bolus activity for Age Category 1 than Age Category 2 (164.2 µV vs. 144.5 µV; W = 5.52, p < .001). The ANOVA for left masseter activity was significant (H = 33.21, df = 2, p < .001), and pairwise contrasts showed that this difference was between lower activity for Age Category 1 than Age Categories 2 (146.6 µV vs. 173.4 µV; W = 7.99, p < .001) and 3 (146.6 µV vs. 161.2 µV: W = 5.12, p <.001). The right masseter was significantly greater in females than males for the cracker bolus (151.7 µV vs 149.6 µV; H = 4.63, p = .031).
Correlations Between Dependent Variables
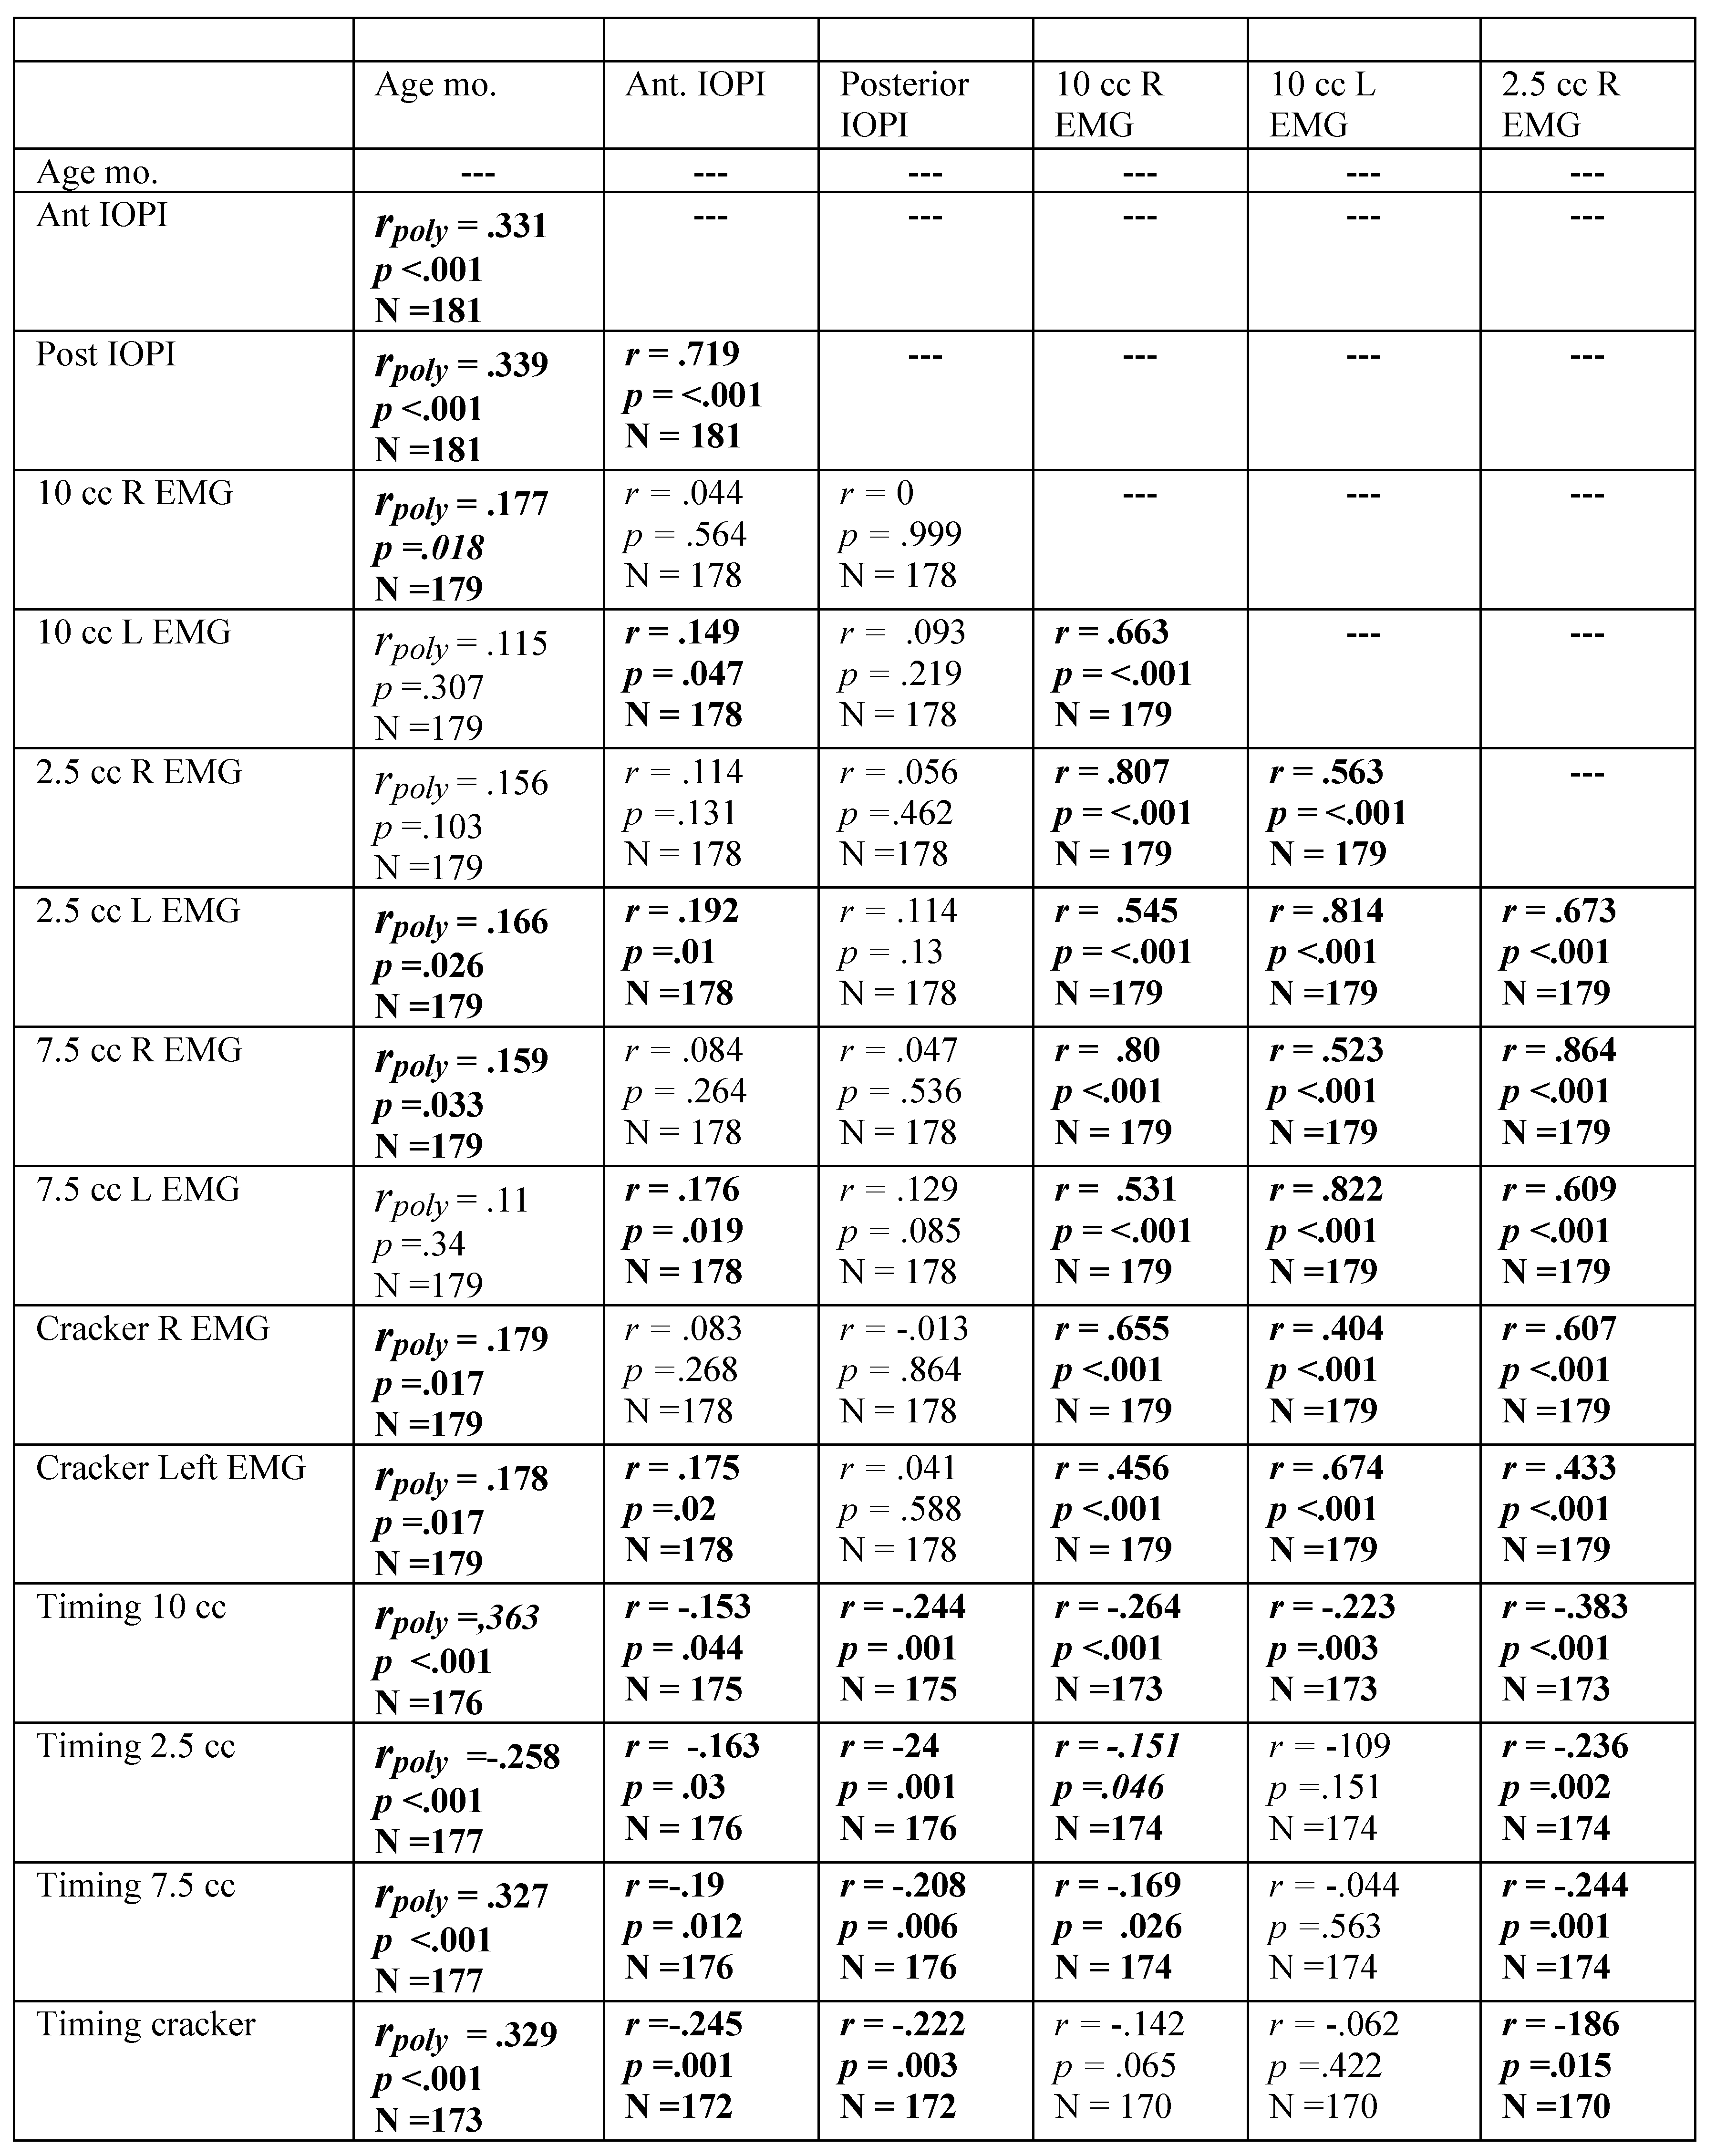
Spearman rank order correlation coefficients were calculated for all dependent variables for the group as a whole, as well as for males and females separately. Correlation tables are shown in
Appendix B. Most correlations would be classified as weak despite being statistically significant (Akoglu, 2018).
Because of the nonlinearity of the data according age, coefficients for all variables related to age were derived from polynomial regression, as discussed in data analysis. All coefficients between oropharyngeal timing and age were significant, as were the coefficients relating tongue strength and age. The anterior tongue force variable was correlated with posterior tongue strength, and both strength variables were significantly negatively correlated with all of the oropharyngeal timing variables.
For the males, age was significantly correlated with anterior and posterior tongue pressure, as well as with all timing measures and most of the EMG measures. As with the group as a whole, strength measures were significantly inversely related to the oropharyngeal timing measures. For females, age was significantly correlated with both strength and timing variables, as well as most of the EMG measures. As with the group as a whole and males, all timing correlations were inversely related to the strength measures.
Discussion
This study examined lifespan changes in maximum tongue strength, swallowing time, and masseter activity during swallowing in a non-disordered population. By employing quantitative methods for measurements of these variables, the research aims to generate normative data that can be used to compare clinical assessments of orofacial myofunctional disorders (OMD) and oropharyngeal dysphagia (OPD). Understanding these changes is crucial for developing effective diagnostic and therapeutic approaches for individuals affected by these conditions. The data obtained from this study will provide a comprehensive baseline, enhancing the ability to identify deviations in clinical populations and inform targeted interventions.
Our study specifically examined age-related changes in tongue strength, revealing both consistencies and divergences with past studies. The present results closely follow the tongue strength values of
Vanderwegen et al. (
2013), who studied individuals in the 20 to 80+ year age range. Our tongue strength values were generally higher than those reported by
Vitorino (
2010), although a direct comparison is difficult because Vitorino used an unspecified bulb position. Our results revealed that the anterior tongue strength was lowest for the young group, but that the older adolescent/adult and older adult groups of our study were statistically equivalent, a finding that echoes Vitorino’s findings. The findings contrast with those of
Clark and Solomon (
2012) who found that their 30–59 year-old group had greater anterior tongue strength than either younger (18–29 years old) or older (60–89 years old) participants. This difference could be attributed to differences in ages of the groups between the present study and that of Clark and Solomon. Clark and Solomon also found that the 30– 59 year-old age group had greater posterior tongue strength than their older group, which contrasts with no significant difference between the corresponding groups of the present study. This difference may be attributable to a methodological difference in placement of the IOPI bulb for the posterior measurement. Placement in the present study was more posterior than that of Clark and Solomon, perhaps resulting in compression of the bulb against the velum as opposed to the hard palate, which would fail to provide the necessary rigid surface to press against. While the present study asked participants to compress the bulb for 5 seconds as opposed to the more traditional timing of 3 seconds, it is unlikely that this would result in reduced tongue force seen in the posterior measures.
Our study’s data indicate significant differences in both anterior and posterior tongue strength across age categories. Specifically, anterior tongue strength was significantly lower for the youngest participants compared to the older groups. Similarly, posterior tongue strength was also lower in the youngest group compared to the older groups. When examining the data by sex, we found that anterior tongue strength was significantly lower in females than in males, although there was no significant difference in posterior tongue strength between sexes. Overall, there was no significant difference between anterior and posterior tongue strength, suggesting comparable strength in these areas across the population.
Vanderwegen et al. (
2013) found that 60 years of age marked the beginning of a decline in tongue strength, and that can be seen in our lifespan data in
Figure 1 and
Figure 2. Our correlational data show a weak-to-moderate increase in tongue force over the middle of the lifespan that tends to decline in older age, as revealed in the need for a polynomial solution. These results could certainly have been weakened by our reduced sample size in the older groups of participants, a problem shared with Vanderwegen et al. and Utanohara, et al. (2008). The addition of participants within the older age group could clarify these findings. This age-related decline was also documented in the meta-analysis of
Arakawa-Kaneko et al. (
2022).
Unlike
Vanderwegen et al. (
2013), we found that females had weaker anterior tongue strength than males. Our groups did not show this difference with the posterior bulb placement, a finding supported by
Arakawa-Kaneko (
2022) for the older groups examined, and
Crow and Ship (
1996) using undifferentiated bulb placement. It is possible that, had we examined the data with smaller age categories we would have had verification of the aging trend through inferential statistics. Vanderwegen et al. found that the anterior tongue can exert greater pressures than the posterior tongue across the lifespan, but our data did not reveal this. Our graphical display in
Figure 1 and
Figure 2 graphically support findings of
Utanohara et al. (
2008), who showed a decline in general tongue strength from 20 to 79 years.
Our inclusion of the youngest group revealed that the decline in old age is mirrored by lower tongue strength in the developmental period as well. Indeed, our results for that developmental period mirror those of
Song (
2015),
McKay et al. (
2020), and those of
Potter and Short (
2009) who showed rapid and significant increases in tongue force for undifferentiated bulb position from ages 3 – 8 years. Specifically, the mean anterior tongue strength for participants aged 5;0 to 15;11 is 38.4 kPa, and the mean posterior tongue strength is 38.7 kPa. This extension to age 10 significantly broadens the implications of our study, indicating that the developmental effects persist into later childhood.
Additionally, this research explores oropharyngeal transit times and their variation across different age groups, highlighting trends and inconsistencies with existing literature. The findings underscore the complexity of swallowing mechanics and the influence of age, bolus consistency, and sex on these processes.
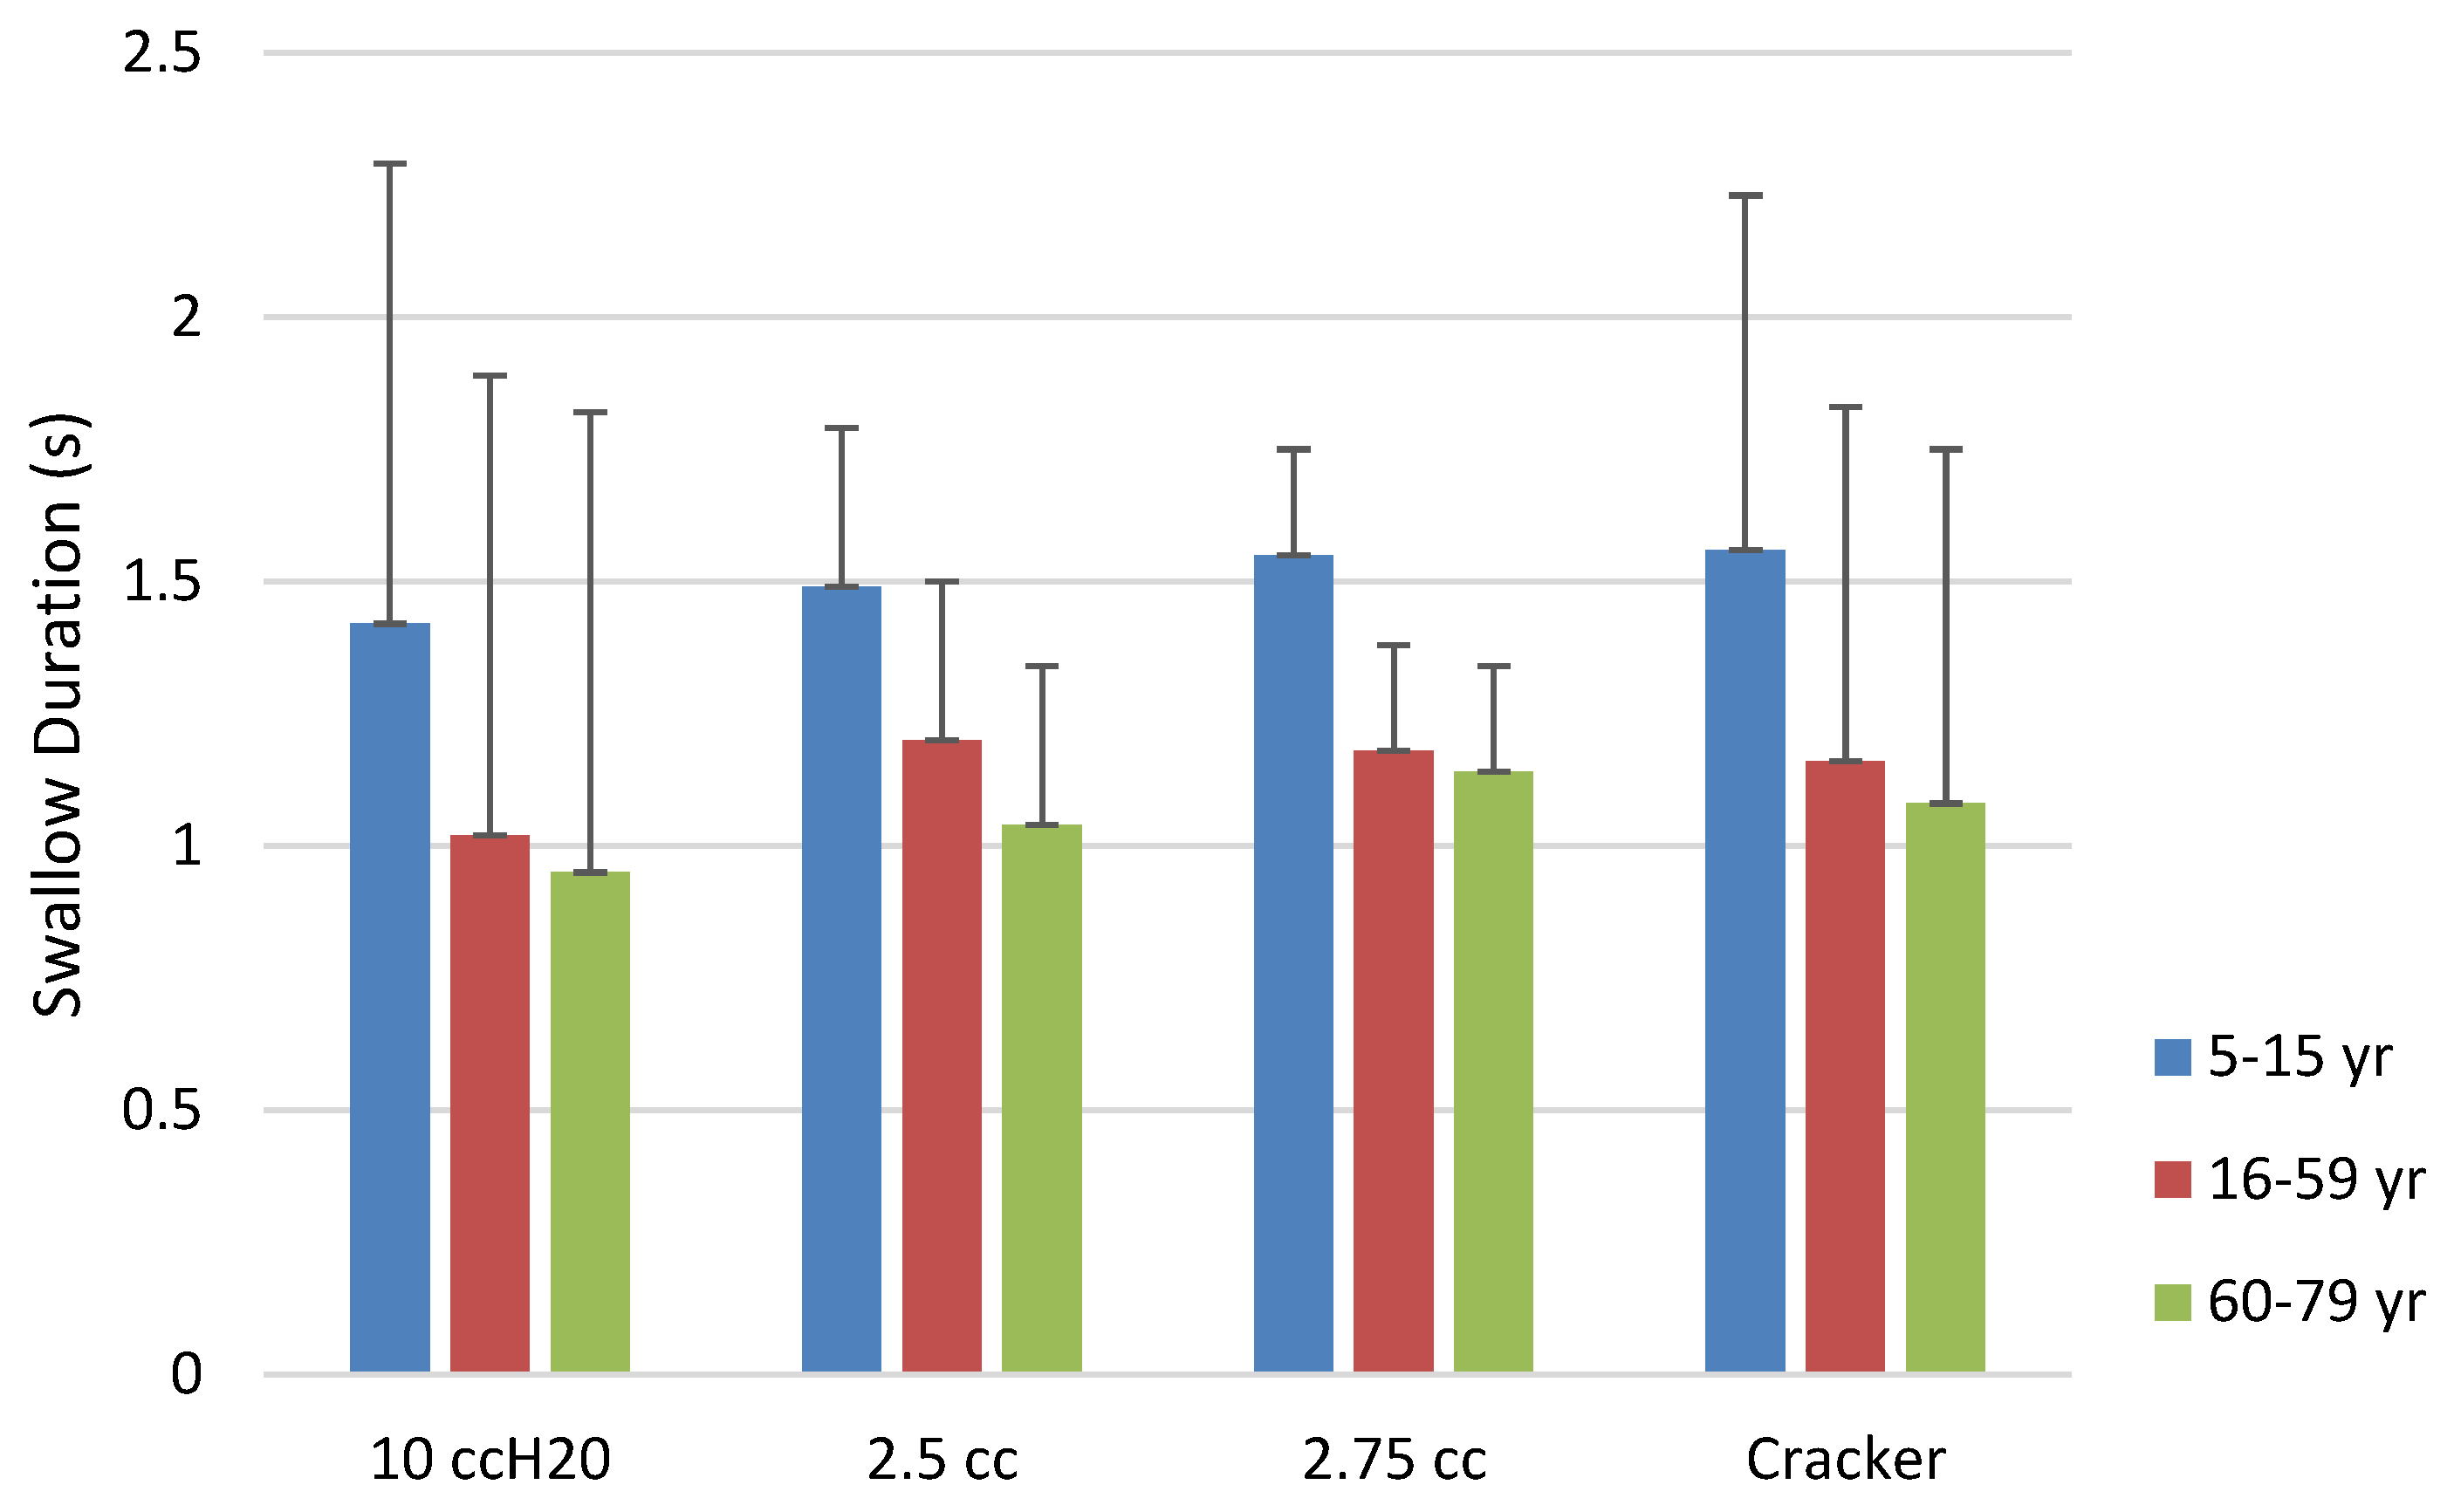
In our investigation of swallow timing, we found that the youngest group had consistently longer swallow duration than either of the older groups. Among the boluses we examined, the 2.5 cc pudding bolus provided the greatest data resolution, with all three groups being differentiated from the others: the youngest had the longest durations, followed by the late-adolescent/adult group and then the older adult group. Our
Figure 3,
Figure 4,
Figure 5,
Figure 6 and
Figure 7 illuminate these findings, in that the youngest group clearly show the longest durations, revealing a strong trend toward shorter durations in the middle age and older age groups. The trend toward longer transit times in the older group seen in the lifespan figures is paradoxical in the face of our grouped findings, although again the smaller sample size in the older adult group may have contributed to reduced strength of these results. Notably, our oldest age distribution was markedly skewed toward the middle Age Category, with the median age of the oldest group being 62 yrs. and the mean age being 65. Thus, while our Age Category 3 group had a nominal range of 19 yrs., 5 mo., the weight of the distribution did not reflect this range.
While many studies show prolonged oropharyngeal transit time with aging beginning after 60 (e.g.,
Hiss et al., 2001 for apneic period;
Pongpipatpaiboon et al., 2018 for pharyngeal phase duration;
Tracy et al., 1989 for oropharyngeal transit time),
Namasivayam-MacDonald et al. (
2018) revealed that swallowing timing for all boluses did not decline as unimpaired people aged, and that the changes often seen with aging is likely a product of declining health of the individual. Clearly, increased numbers in the older group will help clarify this issue.
An interesting finding was the inverse relationship between tongue strength and oropharyngeal timing for all boluses. Whereas
Clark et al. (
2003) examined both subjective and objective measures of anterior tongue strength and oral stage impairment, their subjective results were more predictive of impairment than the objective measures. In contrast, we found a weak but consistent inverse relationship between the anterior and posterior tongue pressure and duration of the swallow. Intuitively, immature musculature of the younger group could certainly be related to swallow duration, and tongue strength is regularly assessed as a contributor to oropharyngeal swallowing disorder.
Finally, the study investigated masseter activity during swallowing using surface electromyography (sEMG), providing insights into the differential activation of the masseter muscle based on age, bolus type, and other factors.
Crary et al. (
2006) established the utility of using sEMG for the clinical assessment of oropharyngeal transit time, subsequently supported by
Poorjavad et al. (
2017) and
Stepp (
2012). This study examined degree of activation of the masseter during swallowing, finding that side and magnitude of masseter activity varied based on age and bolus, and only slightly based on sex of the participant. The right masseter for the water bolus was less active in the late-adolescent/adults than in either the young or older groups. Activation of both the right and left masseters differed significantly for the small pudding bolus, again with the late-adolescent/adult group having the least activity of the three groups. The larger pudding bolus had reversed findings, in that children had the lowest activity for the right masseter. The left masseter revealed older adults with the highest amplitudes, and adolescent/adults with the lowest. For the cracker bolus, the right side for children was greater than that of the late-adolescent/adult group, while the left was lowest for children with the cracker bolus as compared with the other two groups.
As can be seen in
Figure 9, the older age group of this study showed consistently greater masseter activation than the other two groups. All groups tended to activate the right masseter more than the left, a difference attributed by Santos and colleagues (2019) to preference developed during chewing. As is also apparent in the figure, the older adolescent/adult group showed marked reductions in activation, a result born out in the statistical results. The hard cracker bolus resulted in the greatest activation for all groups, a finding that supports the work of
Kang et al. (
2016) in their study of older adults. Older adults were shown to have greater activation of the masseter in swallowing than younger adults, likely the result of greater muscle fiber recruitment in the older population (
Kang et al., 2016). The sEMG results of the present study were largely in concordance with other studies using sEMG of the masseter in swallowing.
There is potential for use of sEMG masseter measurements in the clinical assessment of orofacial myofunctional disorders.
Begnoni et al. (
2019) showed that individuals with atypical swallowing patterns including tongue thrust showed significantly reduced masseter activity, while Ciavarella, et al. (2018) found that individuals with temporomandibular joint dysfunction show greater masseter activation during swallowing. Masseter activation in swallowing has been shown to be higher in individuals with Multiple Sclerosis, a phenomenon that
Santos et al. (
2019) related directly to swallowing difficulty of those individuals.
Use of multiple bolus consistencies in the present study increases the understanding of the relationship between bolus size and masseter activity during the swallow. Most studies use either saliva or water swallow (e.g.,
Pernambuco et al., 2011), so the addition of thicker and harder consistency boluses adds to the literature concerning sEMG and swallowing function. Of all boluses, the cracker bolus resulted in the greatest masseter activation across all age groups, indicating that bolus hardness and texture significantly influence masseter muscle activity during swallowing.
While the study examined individuals with no known orofacial myofunctional disorder, the intention was to provide data that could improve the clinical assessment. These results hold significant potential for enhancing the clinical assessment and management of swallowing disorders. The additional boluses in the sEMG component may prove beneficial in this regard. In the present study, among all the sEMG measures, the 2.5 cc pudding bolus stands out as potentially the most useful for clinical evaluation. It demonstrates the highest effectiveness in differentiating between the three groups, showing bilateral activation and clear delineation of activity.
The observed laterality differences in masseter activity during swallowing trials could be expected due to several factors, including neurological control, muscular development, and habitual use. Swallowing is a complex process controlled by both hemispheres of the brain, but research indicates that there can be asymmetrical activation of the muscles involved.
Daniels et al. (
2006) found that swallowing muscles can show lateralized activity, potentially leading to differences in muscle strength and coordination on either side of the body. This neural asymmetry could contribute to the observed laterality differences, particularly in older adults who might develop compensatory strategies if one side becomes weaker.
Age-related changes in muscle strength and coordination also play a crucial role. As individuals age, they may experience a decline in muscle mass and function, which can affect the symmetry of muscle activation during swallowing.
Humbert et al. (
2009) highlighted age-related changes in the biomechanics of swallowing, suggesting that older adults might show more pronounced laterality differences due to these physiological changes.
Study Limitations
This study combined the research of a number of master’s thesis studies that spanned 4 years. While efforts were made to ensure that all methods were identical, inevitably there were variations in methods that were not apparent in the ultimate work. A further confound was the use of a convenience sample. Again, the sample most certainly reflected the individual researcher’s race and ethnicity, and we were not able to address issues that could be associated with lack of racial/ethnic balance. This is a limitation that future research should address, as there could be variations in swallowing mechanics and muscle activation associated with racial and ethnic differences. Ensuring a more racially and ethnically balanced sample in future studies will help to clarify these findings and improve the generalizability of the results. The distribution of males and females was not evenly balanced between males and females, despite our attempts to accomplish this. One of the most significant limitations was the skewed distribution of our Age Category 3, the older adults. Because of the nature of convenience sampling the distribution was weighted strongly toward the 6th decade of life, with fewer in the 7th. This inevitably had a marked impact on the lack of significant differences found between Age Categories 2 and 3.
Another limitation was in our posterior tongue strength measurement. We used a posterior IOPI bulb placement that differed from others, likely leading to lower posterior pressure values than found in other similar studies.
There is a great deal of variability intrinsic in any measure that involves skin conductance such as sEMG, and our data reflect that in the magnitude of the standard deviations. While we were able to control the inter-participant variability through normalizing data prior to statistical analysis, one should use caution in direct comparison of the raw sEMG data of the appendix with those of other individuals.
Finer resolution in analysis might have given us more clarity in our findings. Studies have performed fine-grained analysis, which in our case would have involved ANOVA for each of the 5-year age groups. While appealing, our lack of homogeneity of variance and normalcy of distribution limited access to more refined statistics. In addition, age categories were determined based on previous literature on tongue strength across age.
Future Research
This research aimed to contribute to comprehensive baseline through rigorous data collection and analysis, enhancing the ability to identify deviations in clinical populations and inform targeted interventions. The findings contribute to a broader understanding of swallowing physiology and its clinical implications, paving the way for future research and applications.
Future research should increase participant numbers, especially in the older age group. Including participants aged 80-100 would offer valuable insights into changes in tongue strength, masseter activity, and swallowing times in the oldest population segment, clarifying the relationship between age, oropharyngeal transit time, and strength measures.
The present results highlight the relationship between tongue strength and oropharyngeal transit time. However, since this study only measured tongue strength in individuals without diagnosed OMDs and the relationship between tongue weakness and OMDs is not absolute, the link between swallowing transit time and tongue weakness remains unconfirmed. Therefore, we cannot make definitive statements about causation based on the current data.
Future studies should investigate the relationship between tongue strength and oropharyngeal transit time in individuals with untreated tongue thrust and other OMDs. Comparing data from individuals with various untreated OMDs, particularly including older adults, would enhance the utility of the present data. Additionally, examining the current data set for indicators of OMDs or OPD could help clarify the risk of undiagnosed OMD and OPD in the population.
Including reliable measures of lip strength in future research would provide a more comprehensive understanding of the orofacial musculature involved in swallowing. Measuring masseter strength is not recommended due to challenges and potential risks, such as the possibility of injuring teeth.
Ensuring a more racially and ethnically balanced sample in future studies will improve the generalizability of these findings. By addressing these areas, future research can build on the current study’s findings, provide a more comprehensive understanding of factors affecting swallowing, and contribute to the development of more effective clinical assessments and interventions.

