Abstract
This study evaluated the effects of a Bacillus direct-fed microbial and microencapsulated calcium butyrate fed individually and in combination, as compared to an antibiotic growth promoter, on growth performance, processing characteristics, intestinal morphology, and intestinal microbiota of Ross 708 broilers reared from 0 to 47 d post-hatch. Dietary treatments included: (1) a negative control with no antimicrobial (NC), (2) a positive control diet containing bacitracin methylene disalicylate (PC), (3) a diet containing a Bacillus direct-fed microbial (CS), (4) a diet containing microencapsulated calcium butyrate (BP), and (5) a diet containing both CS and BP. Treatments were replicated with 10 pens of 20 birds each. From 0 to 15 d post-hatch, the FCR of broilers fed the PC, CS, BP, and CS + BP diets were lower (p < 0.05) than those fed the NC diet, but treatment effects (p > 0.05) were not observed on subsequent performance. BP supplementation improved (p < 0.05) total breast meat weight and yield at processing. Intestinal histology was not influenced (p > 0.05) by the treatment. Analysis of the jejunal microbiota collected at 15 d post-hatch revealed that the genus SMB53 was significantly lower for the CS group, and Sporanaerobacter was lower in the CS and CS + BP groups compared with the NC (p < 0.05). The jejunal microbiota from broilers in the CS + BP group had higher (p < 0.05) alpha and beta diversities compared with broilers fed the NC and CS diets. The results reflected synergistic effects between CS and BP in modulating the jejunal microbiota at 15 d that may have been related to enhanced feed efficiency (i.e., lower FCR) observed during this period.
1. Introduction
Global poultry production is continuously growing and industrializing as a result of increased population size, purchasing capacity, and urbanization [1]. Among animal-derived foods, poultry meat is expected to increase the most (121%) by 2050 to meet dietary protein demands of the growing human population, which is projected to reach 9.6 billion [2]. Intensive poultry farming practices can increase the prevalence of enteric diseases such as necrotic enteritis and Salmonella infections. Antibiotics were traditionally used as a prophylactic measure to prevent these infections as well as to improve growth rate and feed efficiency of broilers [3,4]. However, increasing concerns regarding the development of antimicrobial resistance led to a ban on the use of antibiotic growth promoters in the EU beginning 1 January 2006 (EC Regulation No. 1831/2003), and subsequent restrictions were enacted in several non-EU countries, including the US (FDA Guidance #213).
As reviewed by Huyghebaert et al. [4], numerous products were initially considered for their ability to enhance broiler health and performance, with varying degrees of success, following the removal of in-feed antibiotic growth promoters from poultry production systems. Direct-fed microbials have continued to receive much attention in this regard due to their ability to reduce pathogenic stress and exert antioxidant properties which can reinforce immune status [5,6,7,8]. Additionally, butyric acid, which is a short-chain fatty acid produced endogenously by microbial fermentation, promotes epithelial cell development and has been demonstrated to improve gastrointestinal health and performance of broilers through exogenous supplementation [9,10]. Due to the different mechanisms by which these additives might influence the intestinal environment, there is a potential for both antagonistic or synergistic effects between direct-fed microbials and butyric acid. Therefore, it is critical to assess the efficacy of these products when they are supplemented individually and in combination.
The objective of this study was to investigate the effects of a Bacillus subtilis direct-fed microbial and microencapsulated calcium butyrate, individually and in combination, and an in-feed antibiotic (bacitracin methylene disalicylate) on the performance, processing characteristics, intestinal histology, and jejunal microbiota of broilers. Due to the central roles of the gut microbiota in diverse aspects of host biology, we hypothesized that improved broiler performance conferred by these additives would be associated with changes in gut microbiota, providing insight into the mechanisms by which these potential antibiotics alternatives can benefit animal health and performance.
2. Materials and Methods
2.1. Broiler Husbandry and Dietary Treatments
Female Ross × Ross 708 broiler chicks were obtained from a commercial broiler hatchery on the day of hatch and transported to the University of Arkansas Division of Agriculture Poultry Research Farm. Upon arrival, chicks were group-weighed and randomly distributed to 50 floor pens on used (multiple flocks) litter top-dressed with fresh pine shavings (20 birds per pen; 0.093 m2 per bird). Birds were monitored daily for morbidity and mortality, and access to feed and water was provided ad libitum throughout the experiment. The lighting schedule and temperature targets were adjusted according to management guidelines provided by the primary breeder [11], and daily temperatures were verified in the house to ensure bird comfort. The live-bird phase of the experiment was conducted from September to October.
Broiler chicks were assigned to one of five dietary treatment groups (10 replicate pens per group) that included a negative control diet with no test additives (NC), a positive control diet with 50 mg/kg of bacitracin methylene disalicylate (Zoetis, Florham Park, NJ, USA; PC), and three experimental diets containing either 3.4 × 10⁸ spores/g of Bacillus subtilis PB6 (CLOSTAT, Kemin Industries, Des Moines, IA, USA; CS), encapsulated calcium butyrate (ButiPEARL, Kemin Industries, Des Moines, IA, USA; BP), or both (CS + BP). The addition of B. subtilis PB6 and encapsulated calcium butyrate was calculated to provide 1.7 × 10⁸ spores/kg and 131.1 mg butyrate/kg to the finished feeds, respectively. Test additives were added at the expense of sand in the basal diet. Experimental diets were fed in three phases that included starter (0 to 15 d), grower (15 to 29 d), and finisher (29 to 47 d) feeds. Dietary nutrient specifications (Table 1) of the basal diets were based on recommendations for Ross 708 broilers [12]. The starter diet was pelleted and crumbled, whereas the grower and finisher diets were fed as pellets.

Table 1.
Ingredient and calculated composition of basal diets.
2.2. Broiler Live Performance and Processing Yields
At the end of the starter, grower, and finisher feeding phases, all birds and feeders were weighed to determine body weight gain (BWG), feed intake (FI), and mortality-corrected feed conversion ratio (FCR) to assess growth performance. At 48 d post-hatch, five birds per pen that had been previously randomly selected and wing-banded were caught for processing following an overnight feed withdrawal. All birds were individually weighed at the back dock immediately before processing. Birds were electrically stunned, exsanguinated, scalded, and defeathered. After subsequent removal of heads and feet, carcasses were rehung on a mechanical shackle line and eviscerated. Hot carcass and fat pad weights were recorded, and carcasses were chilled in ice water for 4 h. Chilled carcasses were weighed and manually deboned for weighing of pectoralis major (breast fillets), pectoralis minor (tenders), wings, and leg quarters. Carcass and parts yields were calculated relative to individual live bird weights taken at the back dock.
2.3. Intestinal Histology
At d 15, two birds were randomly selected from each pen, euthanized by CO2 inhalation, and immediately dissected for sample collections. Ileal and jejunal sections, 2 cm in length, were collected for intestinal histology, rinsed with phosphate-buffered saline (PBS), and stored in 20 mL glass vials filled with 10% neutral-buffered formalin. Tissue samples were subsequently embedded in paraffin, set on glass slides, and stained with hematoxylin and eosin. A light microscope (Nikon Eclipse) equipped with a camera was used to image each intestinal cross-section under 4× magnification, and measurements of villus height and width as well as crypt depth were taken with imaging software (Nikon’s NIS Elements Basic Research Microscope Imaging). Measurements were taken on approximately six intact well-oriented villi and crypts per bird. Villi width was measured at the basal (crypt–villus junction) and apical regions, and apparent villus surface area was calculated using the following equation [13]: Apparent villus surface area = [(villus basal width + villus apical width)/(2 × villus height)]
2.4. Statistical Analysis of Performance, Processing, and Histology Data
For performance and processing data, the pen was considered the experimental unit, with 10 replicate pens for each of the five dietary treatments arranged in a randomized complete block design. Pen location was the blocking factor. The experimental design was a 2 (without or with CS) × 2 (without or with BP) factorial plus the PC group (BMD). Data were analyzed using two separate models using the MIXED procedure of SAS 9.4. In the first model, data from all treatments were analyzed by one-way ANOVA. In the second model, data from the PC group were removed from the dataset, and a two-way ANOVA was used to evaluate the main effects and two-way interaction between CS and BP in a 2 × 2 factorial arrangement. Statistical significance was considered at p ≤ 0.05 in all cases.
2.5. Microbiota Analyses
Sample Collection and Processing. During sampling at 15 d described above, an approximately 5 cm jejunal segment (2 cm upstream to Meckel’s diverticulum) was aseptically removed per bird and subsequently processed for microbiota sampling. Jejunal contents from a total of 93 samples (n = 19 per group except CS, in which n = 17; Table S1) were collected and processed by resuspending the jejunal contents in 2 mL of sterile PBS buffer for each sample. For evaluation of Leifsonia xyli (L. xyli) CTM as a novel spike-in control to construct quantitative microbiota profiles (QMP; see below for more information), one sample was selected from each pen (200 mg of jejunal contents) for each treatment group and spiked with 106 colony forming units (CFU) of L. xyli CTM. The L xyli CTM strain was provided by the Institute for Life Science Entrepreneurship (ILSE, Union, NJ). There was a total of 44 non-spiked and 49 spiked jejunal samples. All 93 jejunal samples (200 mg with or without spiking) were then used for genomic DNA extraction using QIAamp PowerFecal® DNA Kit (QIAGEN, Cat No. 12830-50), according to the manufacturer’s instructions. After DNA extraction, the concentration of DNA was measured using either Qubit® double stranded DNA Broad Range (BR) or Qubit® High Sensitivity (HS) assay kit (Thermo Fisher Scientific, Waltham, MA, USA).
Library Preparation for Sequencing. Q5® high-fidelity polymerase (New England Biolabs, Ipswich, MA, USA) was used to amplify the V1-V3 region of the 16S rRNA gene from each 2 μL genomic DNA sample using unique barcoded universal primers (0.6 μM), as described previously [14]. The thermocycling conditions were as described for the Q5 high-fidelity polymerase system by the manufacturer using 30 amplification cycles with 60 °C annealing temperature. After checking the expected band length of amplicons on a 0.7% agarose gel electrophoresis, their concentrations were normalized using the SequalPrep™ normalization plate kit (Thermo Fisher Scientific, USA) and pooled. The pooled amplicons were sequenced using MiSeq® Illlumina 300 cycle paired-end options at the University of California (Riverside, CA, USA).
Analysis of DNA Sequencing Data. All MiSeq® sequenced reads were checked for quality using FastQC, and low-quality reads were trimmed using Trimmomatic version 0.36 with sliding window option 4:20 and PHRED score of 20 for starting and end positions of the reads. The quality-filtered paired-end reads were joined together using the join_paired_ends.py command of Quantitative Insights into Microbial Ecology, QIIME version 1.9.1 (available at http://qiime.sourceforge.net/; [15]) with the fastq-join option [16]. After joining, the barcode positions were formatted using a customized Perl script, and the barcodes were removed using the extract_barcodes.py command of QIIME. The split_libraries_fastq.py command of QIIME was used for demultiplexing of joined reads. The reads were further processed using the VSearch plugin [17] available at QIIME2 version 2018.6.0 (https://qiime2.org; [18]) for de-replication of the merged reads. Additionally, chimeras, singletons (the reads that occurred only one time, which are very likely to be the reads containing at least one sequencing error), chloroplast, and mitochondria sequences were removed. The remaining reads were then subjected to operational taxonomic unit (OTU) clustering at a 99% threshold level. Following taxonomic assignment, comparative analysis between Leifsonia-spiked samples and non-spiked samples identified the two taxa, the genus Leifsonia and family Microbacteriacea with no genus assignment (Genus Leifsonia belongs to family Microbacteriaceae), as those that are attributable to the spiked L. xyli CTM strain. Therefore, these two taxa were filtered out for further analysis, when necessary, to remove the reads from L. xyli CTM. Taxonomic assignment was performed using a pre-trained Naïve Bayes classifier and the q2-feature-classifier plugin of QIIME2, where the classifier was trained on the Greengenes 13_8 99% OTUs full-length sequences. Differentially abundant taxa at phylum and genus levels were identified using a Kruskal–Wallis/Wilcoxon test built in JMP Genomics 9 or ANCOM [19]. For alpha and beta diversity analysis, core diversity metrics were calculated using the q2-diversity plugin of QIIME2 using an even sampling depth 2000, and a phylogenetic tree was generated through FastTree. Statistical differences in alpha and beta diversity among different treatment groups were identified using Kruskal–Wallis and PERMANOVA [20] tests, respectively, through the alpha/beta-group-significance command along with pairwise comparison. All figures except principal coordinate analysis (PCoA) plots were created using ggplot2 packages of R version 3.5.3. PCoA plots were generated using the unweighted UniFrac distance metric [21] and visualized using EMPeror [22].
The samples were analyzed for both RMP and QMP. For comparative analysis of the performance between RMP and QMP, all or a subset of the analyses described above were performed using three different datasets: RMP-93 (RMP data using all 93 samples), RMP-49 (RMP data using 49 spiked samples), and QMP-49 (QMP data using 49 spiked samples).
3. Results
3.1. Growth Performance, Processing Characteristics, and Histology
Live performance. Live performance data for broilers during the starter period from 0 to 15 d post-hatch are presented in Table 2. The one-way ANOVA indicated no effects (p > 0.05) of dietary treatment on BWG or FI during this period. Although the two-way ANOVA revealed a CS × BP interaction (p = 0.039) for BWG, these interaction means of 0.489, 0.502, 0.505, and 0.496 kg for the NC, CS, BP, and CS + BP groups, respectively, were not separated (p > 0.05) using a Tukey’s multiple comparison test. Relative to birds fed the NC diet, the FCR during this period was lower (p < 0.05) and similar among birds fed the PC, CS, BP, and CS + BP diets. The separation and ranking of the CS × BP interaction (p = 0.014) means were not different than when comparing all five treatments groups in the one-way ANOVA.
Table 2.
Live performance of broilers fed diets with and without bacitracin methylene disalicylate or various antibiotic alternatives from 0 to 15 d post-hatch 1.
There were no differences (p > 0.05) in BWG, FI, or FCR of broilers from 0 to 29 d post-hatch, except for a tendency (p = 0.078) for BP inclusion to lower FCR (Table 3). Similarly, there were no effects of any dietary treatment on cumulative (0 to 47 d post-hatch) BWG, FI, or FCR (Table 4). Cumulative mortality in this trial was less than 3% and not associated with any dietary treatment (p < 0.05).
Table 3.
Live performance of broilers fed diets with and without bacitracin methylene disalicylate or various antibiotic alternatives from 0 to 29 d post-hatch 1.
Table 4.
Live performance of broilers fed diets with and without bacitracin methylene disalicylate or various antibiotic alternatives from 0 to 47 d post-hatch 1.
Processing characteristics. Hot and chilled carcass and hot fat pad weight and yields of broilers processed at 48 d post-hatch are presented in Table 5. Excluding tendencies for BP to increase hot (p = 0.065) and chilled (p = 0.076) carcass weights and for CS to increase (p = 0.058) fat pad weights, there were no effects of any dietary treatment on whole carcass and fat measurements. Regarding parts weight and yields presented in Table 6, the one-way ANOVA indicated dietary effects on breast (pectoralis major) weights (p = 0.002) and yields (p = 0.014) and total breast (pectoralis major + pectoralis minor) weights (p = 0.003) and yields (p = 0.023), with no effects (p > 0.05) on the weights and yields of tenders (pectoralis minor), wings, or leg quarters. For both the yield and weights of breast fillets, values were highest for birds fed the PC diet, lowest for birds fed the NC and CS diets, and intermediate for those fed the BP and CS + BP diet. Despite the lack of dietary effects on tenders, these effects on breast fillets were large enough to result in a similar ranking in total breast weights and yields among dietary treatments, with the exception that total breast weight yield was not different (p > 0.05) between birds in the NC and PC groups. In removing data for the PC group to create a factorial analyzed by a two-way ANOVA, a main effect of BP addition was observed whereby total breast weight (p = 0.005) and yield (p = 0.032) were increased by 36 g and 0.5 percentage units, respectively.
Table 5.
Carcass characteristics of broilers fed diets with and without bacitracin methylene disalicylate or various antibiotic alternatives from 0 to 47 d post-hatch and processed at 48 d post-hatch 1.
Table 6.
Parts weights and yields of broilers fed diets with and without bacitracin methylene disalicylate or various antibiotic alternatives from 0 to 47 d post-hatch and processed at 48 d post-hatch 1.
Intestinal histology. There was no influence (p > 0.05) of any dietary treatment on the histological measurements of jejunal (Table 7) or ileal tissue (Table 8) sampled from broilers at 15 d post-hatch, except for tendencies (p < 0.10) for interactions between CS and BP on crypt depth and the ratio of villi height to crypt depth in both jejunal and ileal tissue.
Table 7.
Histological characteristics of jejunal tissue collected from broilers fed diets with and without bacitracin methylene disalicylate or various antibiotic alternatives 1.
Table 8.
Histological characteristics of ileal tissue collected from broilers fed diets with and without bacitracin methylene disalicylate or various antibiotic alternatives 1.
3.2. Microbiota Analysis
Effect of spiking on the microbial community structure. To determine the effect of L. xyli CTM spiking on the microbiota profiles, 44 non-spiked and 49 spiked samples were analyzed after removal of the reads attributed by L. xyli CTM strain from all spiked samples. Statistical analysis using the ANCOM method showed that there were no significant differences in any taxonomic levels between spiked and non-spiked samples (p < 0.5). Similarly, there were no significant differences in either alpha or beta diversity between the two groups as calculated by different core diversity metrics available through the q2-diversity plugin of QIIME2. Additional analysis using a smaller set of eight samples that were spiked at three different levels also confirmed that different levels of spiking (106 CFU in 50, 100, or 200 mg sample) with L. xyli CTM did not change the microbial community structure as compared to the non-spiked samples (see Supplementary Materials). These results suggest that the DNA sequencing data of the spiked and non-spiked samples (after the removal of L. xyli CTM reads) can be combined within the same treatment groups to perform the downstream analysis to investigate the treatment effects on the jejunal microbiotas.
Overview for the relative microbiota profiles. For construction of the RMP, all spiked and non-spiked samples of the five groups were pooled together after removing the L. xyli CTM sequences for analysis of treatment effects. The total number of reads retained was 1,480,334, and the average number of reads per sample was 15,917, with the range between 555 and 44,022 reads per sample. For the diversity analysis, samples with reads over 1500 per sample were used, which excluded 6 samples with read numbers less than 1500.
Composition. The relative abundance of the major phyla across different treatment groups is shown in Figure 1A. Firmicutes was found as a predominant phylum (NC: 97.54%, PC: 93.64%, CS: 97.28%, BP: 95.58%, and CS + BP: 87.73%), followed by Actinobacteria (NC: 0.71%, PC: 0.90%, CS: 0.59%, BP: 0.99%, and CS + BP: 1.05%) and Proteobacteria (NC: 0.20%, PC: 0.10%, CS: 0.03%, BP: 0.12%, and CS + BP: 0.34%) in all treatment groups. Statistical analysis of different phyla among treatment groups revealed that OD1 was the only phylum that showed a significant difference among the groups (Table S2). The phylum OD1 significantly increased in both PC (p = 0.0227) and CS + BP (p = 0.0392) groups as compared to NC.
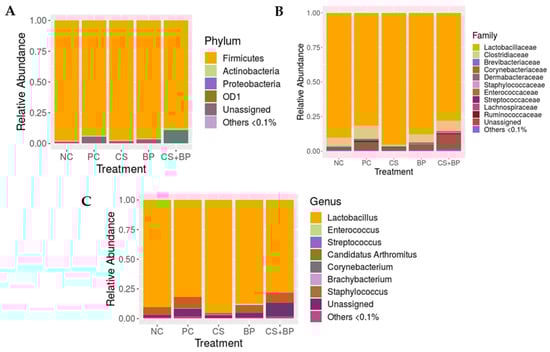
Figure 1.
Composition of the jejunal bacterial communities in five different groups of broilers at the phylum (A), family (B), and genus level (C).
At the family level, the predominant family was Lactobacillaceae (NC: 90.18%, PC: 81.56%, CS: 95.34%, BP: 87.83%, and CS + BP: 77.93%), followed by Clostridiaceae (NC: 6.36%, PC: 9.55%, CS: 1.23%, BP: 5.95%, and CS + BP: 7.62%) as shown in Figure 1B. There was no major family (>0.1% on average) that showed a significant difference among the treatment groups. It is important to note that the CS group showed consistently lower levels of the family Clostridiaceae (1.23 ± 0.65 %) as compared with other groups (NC: 6.36 ± 3.87%, PC: 9.55 ± 4.95%, BP: 5.95 ± 3.22%, and CS + BP: 7.62 ± 4.82%), although there was no statistical significance (Figure 2). However, the low level of the family Clostridiaceae found in CS was not observed when CS was used in combination with BP (CS + BP).
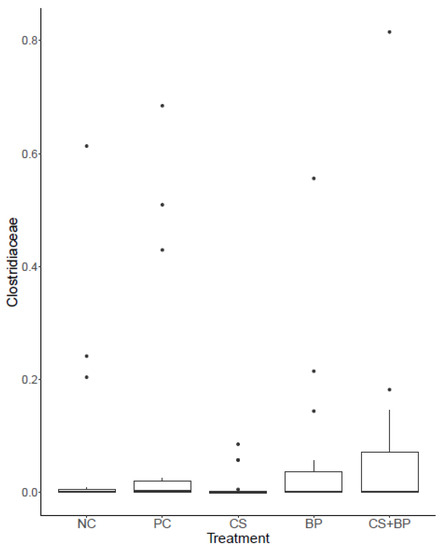
Figure 2.
The distribution of Family Clostridiaceae in five different groups of broilers.
At the genus level, the jejunal microbiota was dominated by Lactobacillus in all treatment groups, as shown in Figure 1C. Lactobacillus was found to be the highest in CS (95.34%), followed by NC (90.18%), BP (87.83%), PC (81.56%), and CS + BP (77.93%). After Lactobacillus, Candidatus Arthomatus was the next most abundant genus in all treatment groups (NC: 6.29%, PC: 9.52%, CS: 1.22%, BP: 5.93%, and CS + BP: 7.58%). Other notable genera that were reported across the treatment groups included Enterococcus, Streptococcus, Corynebacterium, Brachybacterium, and Staphylococcus, whose average relative abundance in each group was greater than 1% (Figure 1C). None of these major (>0.1% on average) genera showed significant differences among the treatment groups. As shown in Figure 3, there was substantial variation in the relative abundance of different genera within the same treatment groups, which might be the reason for the lack of genera showing significant differences among the treatment groups. However, there were four minor genera (<0.1% on average) that showed significant differences among the treatment groups, which include f_Bacillaceae; f_Clostridiaceae;g_SMB53, F_Tissierellaceae;g_Sporanaerobacter, and P_OD1;f_;g_ (Table S2). In the case of genus SMB53, which belongs to the family Clostridiaceae, both CS (p = 0.0086) and PC (p = 0.0441) groups showed significantly lower levels as compared with NC. Similarly, the genus Sporanaerobacter was significantly lower in CS (p = 0.0390), CS + BP (p = 0.0390), and PC (p = 0.0338) groups as compared with NC. On the contrary, an unidentified genus in phylum OD1 was significantly higher in CS + BP (p = 0.0392) and PC (p = 00217) groups as compared with NC. For the unidentified genus in phylum OD1, CS + BP was also significantly higher than CS (p = 0.0392).
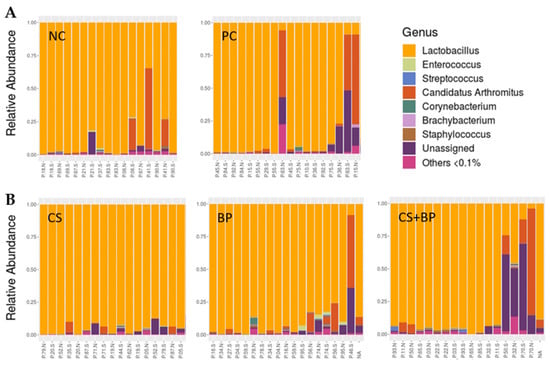
Figure 3.
Composition of the jejunal bacterial communities in five different groups of broilers at the genus level using (A) group average and (B) individual samples.
Alpha diversity. Alpha diversity was measured using observed OTUs and the Shannon index. With both metrics, there were significant differences (Figure 4). Notably, alpha diversity was significantly higher in the CS + BP group in comparison with NC at p < 0.01 with both observed OTUs (250.06 vs. 187.18) and the Shannon index (4.30 vs. 3.53). The results showed that the alpha diversity, which was not changed by CS or BP alone, increased significantly by CS + BP as compared with NC (p < 0.01) and CS (p < 0.05) with both alpha diversity metrics used.
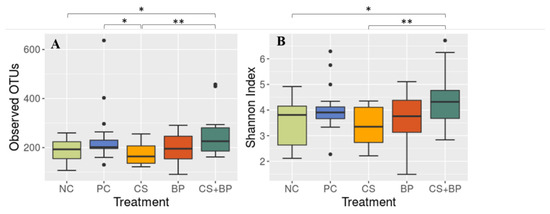
Figure 4.
Alpha diversity of the jejunal microbiotas in five treatment groups of broilers. (A) Observed OTUs and (B) Shannon index. Significant differences at different p-values are indicated by * (<0.05) and ** (<0.01).
Beta diversity. Beta diversity analysis was performed using different metrics including the Bray–Curtis, Jaccard, and weighted and unweighted UniFrac distance metrics. The analysis showed similar results with different distance metrics, and the PCoA plot showing the distance in microbial communities among the treatment groups using the weighted UniFrac distance metric is shown in Figure 5A. Although not obvious in the PCoA plot, statistical analysis using PERMANOVA showed a significance difference in weighted UniFrac distance among the treatment groups (p = 0.046). The distance of different treatment groups in reference to NC and CS groups based on weighted UniFrac distance is shown in Figure 5B. The CS + BP group (0.37) showed a significant difference from both the NC (0.25) at p < 0.05 and CS group (0.26) at p < 0.01.
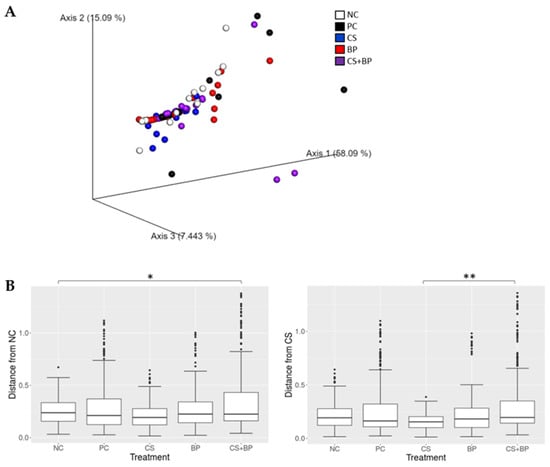
Figure 5.
Beta diversity analysis. (A) PCoA plot showing beta diversity distances among the 5 treatment groups and (B) the beta diversity distances in reference to NC and CS group based on weighted UniFrac distance metric. Significant differences at different p-values are indicated by * (<0.05) and ** (<0.01).
Quantitative microbiota profiling. Microbiota analysis based on high-throughput sequencing of the 16S rRNA gene provides information on the relative abundance of each taxon at different levels of classification (e.g., phylum, genus, etc.). Although very informative, understanding the changes in microbiota based on relative abundance alone can be misleading (Vandeputte et al., 2017, Tourlousse et al., 2016, Stämmler et al., 2016). To overcome the limitation of an RMP approach, Leifsonia xyli (L. xyli) CTM was used as a novel, quantitative spike-in control to construct QMP for more accurate assessment of the quantitative changes in microbiota in association with the treatments. L. xyli CTM is a Gram-positive bacterial species mainly associated with stunting disease in sugarcane and has never been detected in the gut microbiota of any vertebrates (Young and Nock 2017). For the QMP analysis, approximately half of the jejunum samples (9–10 samples per group) in each group were spiked with 106 CFU to 200 mg samples (Table S1), based on the result of the preliminary experiment using 3 different levels of spiking (Figures S1 and S2). Only 49 of these spiked samples (QMP-49) were used for the QMP analysis.
The result of the QMP analysis is shown in Figure 6A for the major genera (>0.1% on average based on CFU/g sample). The relative abundance of different genera in each sample remained the same between RMP (Figure 1C) and QMP (Figure 6A), but QMP shows the actual number of cells in CFU/g of jejunal contents for each genus, providing additional quantitative information lacking in RMP. When statistical analysis was performed on the QMP dataset from 49 spiked samples (QMP-49) using the Kruskal–Wallis/Wilcoxon test, two genera were identified as significantly different among the treatment groups: F_Leuconostocaceae and Propionibacterium (Table S2). These two genera were not identified as significantly different genera when the RMP-93 dataset was used. Identification of these two genera using the QMP-49 dataset might be attributed to the quantitative information in QMP or the use of a subset of the samples (RMP-49) for this analysis. When the same statistical analysis was applied to the RMP dataset based on the 49 spiked samples (RMP-49), three genera were identified as significantly different among the groups, in which two were commonly identified by both RMP-49 and QMP-49 datasets (Table S2). This result indicated that the two genera identified as significantly different by QMP-49 were due to the use of a subset of the samples used in RMP-93 and were not due to the additional quantitative information in QMP. Figure 6B shows the QMP based on all six genera that showed significant differences in any of the three datasets among the treatment groups (Table S2).
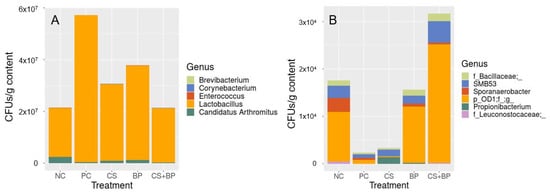
Figure 6.
Composition of the jejunal bacterial communities in five different groups of broilers at the genus level using quantitative microbiota profiling (QMP). (A) Genera that are ≥0.01% on average, and (B) genera that are significantly different based on either relative microbiota profiling (RMP) or quantitative microbiota profiling (QMP).
In order to explore the possible changes in the total bacterial load in jejunal contents associated with the treatments, the total bacterial loads according to the treatment groups based on the read number of L. xyli CTM spike-in control were calculated, as shown in Figure 7. PC showed the highest total bacterial load (6.31 × 10⁷ ± 1.65 × 10⁷ CFU/g), NC showed the lowest (2.80 × 10⁷ ± 4.79 × 10⁷ CFU/g), and other treatment groups were similar (CS: 3.67 × 10⁷ ± 0.62 × 10⁷ CFU/g; BP: 4.37 × 10⁷ ± 1.75 × 10⁷ CFU/g; and CS + BP: 2.83 × 10⁷ ± 0.77 × 10⁷ CFU/g) between PC and NC. However, no significant difference was found in the total bacterial loads among the treatment groups.
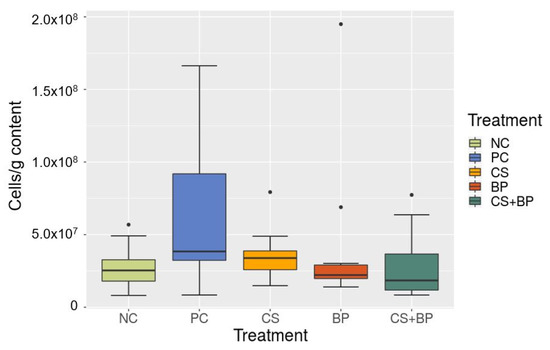
Figure 7.
Comparison of the bacterial loads (in cells/g) in jejunal samples in five different groups of broilers as estimated by L. xyli spike-in controls.
3.3. Correlation between Parameters in Broilers (Growth and Processing) and Gut Microbiota
In order to gain insights into the possible links between the parameters in growth performance or processing characteristics and the changes in jejunal microbiotas, nonparametric correlation analysis was performed using different correlation analysis measures. When alpha diversity measures (observed OTUs and Shannon index) or beta diversity distance in reference to NC (weighted UniFrac distance measure) were used as a microbiota parameter, a few significant correlations were detected (Figure S3). Among those, Shannon index showed a positive correlation with FCR (0–15 d; p < 0.0496) using Hoeffding correlation analysis. When all the genera that were shown to be differentially abundant among the groups (Table S2) were used for correlation analysis, the genus Sporanaerobacter showed significant correlations with four different processing characteristics (Figure S4).
4. Discussion
The efficacy of growth-promoting, in-feed antibiotics and alternative compounds that can replace benefits conferred by antibiotics is certainly influenced by the overall environmental and sanitary conditions under which the birds are reared. As such, antibiotics with established efficacy in field conditions, such as BMD, as was used in the current experiment, are often included as positive control groups to provide a general indication of the level of challenge in the environment and to serve as a benchmark for potential alternatives. Thus, the general lack of performance differences between the PC and NC groups indicates that conditions experienced by the birds in the current experiment, which included litter used for multiple flocks, did not optimize the potential for alternative compounds to provide benefits. Furthermore, because evaluating gut microbiota changes independent of non-bacterial enteric challenges such as coccidiosis was of primary interest, a chemical coccidiostat that was expected to have minimal direct effects on the gut microbiota, as opposed to an ionophore anticoccidial, was included in all feeds throughout the trial. This may have further minimized intestinal stress in the current experiment.
It appears that the greatest opportunity for an in-feed antibiotic or potential alternative to provide a benefit in the current trial was during the starter period from 0 to 15 d post-hatch, when birds fed the PC, CS, BP, and CS + BP diets had numerically higher BWG at similar feed intakes, resulting in reductions in the FCR of 4.1, 4.4, 4.8, and 4.3 points for these groups, respectively, as compared with the NC group. Though the interaction (p = 0.014) between CS and BP on FCR indicated that the magnitude of reduction in FCR when combining CS and BP was not as great as when feeding BP alone, these interaction means were not separated by the Tukey’s multiple comparison test. Beyond 15 d, no other performance differences were observed throughout the trial, despite a tendency (p = 0.08) for BP to reduce the FCR by 2.1 points from 0 to 29 d post-hatch. The fact that the first 15 days was the only period in which the BW of birds was below primary breeder performance standards may further support the interpretation that environmental stress did not limit genetic potential for growth during this experiment.
Previous studies have reported positive effects of butyric acid supplementation on carcass composition and meat yield [10,23], while others failed to observe similar results [24,25]. Proposed modes of action by which butyric acid can improve nutrient utilization and meat yield have been extensively reviewed and include energy provision to intestinal epithelial cells, enhanced immune function, anti-inflammatory activity, and beneficial effects on the intestinal microbiota [26,27]. Supplemental butyric acid efficacy and site of activity within the intestine is influenced by the amount and source fed [9]. The microencapsulation of butyrate tested in this experiment has been demonstrated to delay butyrate release to more distal regions of the small intestine, where effects on the intestine and microbiota would be more pronounced that in the anterior intestine [28]. A lower FCR during the starter period, trends for reduced FCR from 0 to 29 d, heavier carcass weights at processing, and, most notably, significant improvements in total breast meat weight and yield of 36 g and 0.5 percentage units, respectively, reflected a benefit of feeding BP to broilers in the current experiment.
It was hypothesized that the improved feed efficiency and carcass characteristics noted above could be partly explained by the histological and microbial analyses con-ducted at 15 d post-hatch. Although others have reported increased villi or microvilli length with butyric acid supplementation, ileal and jejunal histology was not influenced by any of the dietary treatments in the current study. Similarly, Levy et al. [29] conducted two trials in which approximately 100 to 450 mg/kg of the same form of butyrate as used in the current experiment was fed to broilers for 42 d and found no influence on duodenal, jejunal, or ileal histology at 21 or 35 d, except for a linear decrease in ileal villi height at 21 d. Nonetheless, the FCR was linearly improved with increasing butyric acid supplementation in both experiments by these authors. Microencapsulated sodium butyrate was also reported to reduce Clostridium perfringens colonization in the intestine and to alleviate the negative impacts of necrotic enteritis of broiler chickens in a previous study [30]. This supports the hypothesis that butyrate has potential to exert beneficial effects in chickens through mechanisms that might involve modulation of the intestinal microbiota. Interestingly, in the aforementioned experiment conducted by Levy et al. [29], all experimental diets contained BMD as an antibiotic to 35 d of age, indicating that improvements in the FCR achieved with microencapsulated calcium butyrate may not have been directly associated with alleviation of dysbiosis. Thus, further work is needed to elucidate the interactions of supplemental butyric acid with the intestinal microbiota in chickens.
The analysis of the jejunal microbiota revealed only a few taxa that were differentially abundant among the experimental groups. OD1, also known as Parcubacteria, was the only phylum affected by the feed additives in the current experiment. Specifically, phylum OD1 was significantly higher in both the PC and CS + BP groups as compared with NC. However, the implication of this change in OD1 in the chicken microbiota is unclear, as there is no previous report on the association of the phylum OD1 with chickens.
The Bacillus direct-fed microbial evaluated in this experiment has previously been shown to inhibit pathogens of poultry, especially Clostridium species. Moreover, Ba-cillus-DFM have been widely studied in broiler chickens using necrotic enteritis challenge models with very promising results in the reduction of intestinal Clostridium perfringens proliferation and alleviation of its negative impacts [5,6,8,31,32]. However, significant reductions in C. perfringens were not observed in the CS or CS + BP groups as compared to the NC or other groups in the current experiment. The genus SMB53, which belongs to the family Clostridiaceae, was found to be significantly lower in the CS and PC groups as compared to NC. SMB53 is a poorly known genus, but it was identified as a major member in the intestine of pigs [33]. In addition, the genus Sporanaerobacter, which belongs to the family Tissierellales, was shown to be significantly lower in the CS, CS + BP, and PC groups as compared with NC. It was interesting to note that the relative abundance of the genus Sporanaerobacter showed a significant negative correlation with fat pad weight and yield as well as a positive correlation with hot and chilled carcass yields.
Microbiota analyses also showed that alpha diversity of the jejunal microbiota increased significantly in the CS + BP group as compared with NS and CS. Considering the significant reduction in the FCR in the CS + BP group as compared with NC during the same period, this indicates that the increased alpha diversity may be at least partially related to improved feed conversion. This observation is also reflected in the significant negative correlation (r = −0.22) between Shannon index and FCR during 0–15 days.
In this study, a live spike-in control strain was also employed to perform QMP analysis using a subset of the samples in addition to conventional RMP analysis using 16S rRNA gene sequencing. If microbial load varies substantially among samples, RMP data will hamper attempts to link unique microbiota features to associated groups. As an example, a previous study used a QMP approach to identify microbial load as a key driver of observed microbiota alterations in patients with Crohn’s disease, which was not detected by the RMP method [34]. In the current study, it was demonstrated that the use of L. xyli CTM is a convenient and reliable way to perform QMP for chicken gut microbiotas. Our QMP data revealed considerable variations in total bacterial load, up to 24-fold differences among the samples. However, our QMP data failed to detect any significantly differential taxa that could not be captured by RMP data. One of the reasons might be the use of a subset of all the samples used for RMP analysis, which introduced its own sampling bias. However, our finding that there is a substantial variation in total bacterial load in jejunal samples of broiler chickens suggests the potential advantage of using QMP in future studies of chicken gut microbiotas. To our knowledge, this is the first study in which a QMP approach was used to study the gut microbiota in chickens or any other production animal species.
In conclusion, the data reported herein support the notion that mechanisms of in-feed antibiotics and alternative compounds to replace some of their beneficial effects can be difficult to study without inducing environmental or disease stress beyond that provided by used litter and standard rearing conditions. Nonetheless, encapsulated calcium butyrate did improve processing characteristics in the absence of changes in intestinal histology or major microbial shifts during the starter period or sustained effects on live growth performance. A few notable changes in the jejunal microbiota occurred due to dietary treatment, including changes in alpha and beta diversities, particularly for the CS + BP group in comparison with the NC group. However, the potential mechanistic link between the changes in jejunal microbiota and other parameters in growth performance or carcass characteristics remain unclear. This warrants future studies under more stressful rearing conditions, where the beneficial effects of the alternatives to antibiotics would have more profound positive impacts on the performance and gut microbiota in broilers.
Supplementary Materials
The following supporting information can be downloaded at: https://www.mdpi.com/article/10.3390/poultry2010008/s1, Figure S1. Microbiota profiles of the 8 jejunal samples spiked with L. xyli (106 CFU per 200 mg) presented in (A) relative microbiota profiles (RMP) and (B) quantitative microbiota profiles (QMP), Figure S2. Microbiota profiles of 8 selected jejunal samples to which L. xyli (106 CFU) was spiked into 50, 100 or 200 mg sample. (A) Relative microbiota profile (RMP) and (B) Quantitative microbiota profile (QMP), Figure S3. The scatterplot matrices created by JMP Genomics that show the significant correlations between the parameters in growth performance (0–15 d) and carcass characteristics, and microbiota parameters (selected alpha diversity indices, observed OTUs and Shannon index, and beta diversity index based on weighted UniFrac distance in reference to NC). Nonparametric correlation analyses were conducted using (A) Spearman, (B) Kendall and (C) Hoeffding correlation tests. Symbols for the treatment groups: NC (open square), PC (closed square), CS (red circle), BP (blue circle), and CS + BP (purple circle), Figure S4. The scatterplot matrices created by JMP Genomics that show the significant correlations between the parameters in carcass characteristics and the relative abundance of the genus Sporanaerobacter. Nonparametric correlation analyses were conducted using Spearman test. Symbols for the treatment groups: NC (open square), PC (closed square), CS (red circle), BP (blue circle), and CS + BP (purple circle); Table S1. Summary of the jejunal samples used for 16S microbiota analysis, Table S2. Summary of the taxonomic groups in jejunal samples that showed significant difference among the treatment groups based on different datasets.
Author Contributions
Conceptualization and Project Administration: Y.M.K. and S.J.R.; Live Animal Experimentation: A.G.M., C.R. and S.J.R.; Laboratory and Data Analysis: B.A., A.G.M. and C.R.; Writing and Editing: B.A., Y.M.K. and S.J.R. All authors have read and agreed to the published version of the manuscript.
Funding
This study was supported in part by a grant from Kemin Industries (Des Moines, IA, USA) as well as by the University of Arkansas System Division of Agriculture (Fayetteville, AR, USA).
Institutional Review Board Statement
All live animal procedures were approved by the University of Arkansas Institutional Animal Care and Use Committee (Protocol #17088).
Data Availability Statement
MiSeq sequencing data for 16S microbiota analysis in this study is available on the NCBI Sequence Read Archive under BioProject number PRJNA929304.
Acknowledgments
The authors would like to acknowledge the support of Alissa Jourdan (Kemin Industries; Des Moines, IA, USA) throughout the project, including manuscript review, and particularly in obtaining the L. xyli CTM strain in collaboration with the Institute for Life Science Entrepreneurship (ILSE, Union, NJ, USA) to use as a novel spike-in control for the microbiota analyses. The authors also thank the Arkansas High-Performance Computing Center (AHPCC), the University of Arkansas, for their computational support.
Conflicts of Interest
The authors declare no conflict of interest.
References
- Mottet, A.; Tempio, G. Global Poultry Production: Current State and Future Outlook and Challenges. Worlds Poult. Sci. J. 2017, 73, 245–256. [Google Scholar] [CrossRef]
- Alexandratos, N.; Bruinsma, J. World Agriculture Towards 2030/2050: The 2012 Revision; FAO: Rome, Italy, 2012. [Google Scholar]
- Dibner, J.J.; Richards, J.D. Antibiotic Growth Promoters in Agriculture: History and Mode of Action. Poult. Sci. 2005, 84, 634–643. [Google Scholar] [CrossRef] [PubMed]
- Huyghebaert, G.; Ducatelle, R.; van Immerseel, F. An Update on Alternatives to Antimicrobial Growth Promoters for Broilers. Vet. J. 2011, 187, 182–188. [Google Scholar] [CrossRef] [PubMed]
- Jayaraman, S.; Thangavel, G.; Kurian, H.; Mani, R.; Mukkalil, R.; Chirakkal, H. Bacillus Subtilis PB6 Improves Intestinal Health of Broiler Chickens Challenged with Clostridium Perfringens-Induced Necrotic Enteritis. Poult. Sci. 2013, 92, 370–374. [Google Scholar] [CrossRef]
- Jayaraman, S.; Das, P.P.; Saini, P.C.; Roy, B.; Chatterjee, P.N. Use of Bacillus Subtilis PB6 as a Potential Antibiotic Growth Promoter Replacement in Improving Performance of Broiler Birds. Poult. Sci. 2017, 96, 2614–2622. [Google Scholar] [CrossRef]
- Jerzsele, A.; Szeker, K.; Csizinszky, R.; Gere, E.; Jakab, C.; Mallo, J.J.; Galfi, P. Efficacy of Protected Sodium Butyrate, a Protected Blend of Essential Oils, Their Combination, and Bacillus Amyloliquefaciens Spore Suspension against Artificially Induced Necrotic Enteritis in Broilers. Poult. Sci. 2012, 91, 837–843. [Google Scholar] [CrossRef]
- Teo, A.Y.; Tan, H.-M. Evaluation of the Performance and Intestinal Gut Microflora of Broilers Fed on Corn-Soy Diets Supplemented with Bacillus Subtilis PB6 (CloSTAT). J. Appl. Poult. Res. 2007, 16, 296–303. [Google Scholar] [CrossRef]
- Liu, J.D.; Lumpkins, B.; Mathis, G.; Williams, S.M.; Fowler, J. Evaluation of Encapsulated Sodium Butyrate with Varying Releasing Times on Growth Performance and Necrotic Enteritis Mitigation in Broilers. Poult. Sci. 2019, 98, 3240–3245. [Google Scholar] [CrossRef]
- Bedford, A.; Yu, H.; Squires, E.J.; Leeson, S.; Gong, J. Effects of Supplementation Level and Feeding Schedule of Butyrate Glycerides on the Growth Performance and Carcass Composition of Broiler Chickens. Poult. Sci. 2017, 96, 3221–3228. [Google Scholar] [CrossRef]
- Aviagen. Broiler Management Handbook; Aviagen: Huntsville, AL, USA, 2018. [Google Scholar]
- Aviagen. Ross 708: Broiler Nutrition Specifications; Aviagen: Huntsville, AL, USA, 2014. [Google Scholar]
- Iji, P.A.; Saki, A.; Tivey, D.R. Body and Intestinal Growth of Broiler Chicks on a Commercial Starter Diet. 1. Intestinal Weight and Mucosal Development. Br. Poult. Sci. 2001, 42, 505–513. [Google Scholar] [CrossRef]
- Adhikari, B.; Kwon, Y.M. Characterization of the Culturable Subpopulations of Lactobacillus in the Chicken Intestinal Tract as a Resource for Probiotic Development. Front. Microbiol. 2017, 8, 1389. [Google Scholar] [CrossRef] [PubMed]
- Caporaso, J.G.; Kuczynski, J.; Stombaugh, J.; Bittinger, K.; Bushman, F.D.; Costello, E.K.; Fierer, N.; Peña, A.G.; Goodrich, J.K.; Gordon, J.I. QIIME Allows Analysis of High-Throughput Community Sequencing Data. Nat. Methods 2010, 7, 335–336. [Google Scholar] [CrossRef] [PubMed]
- Aronesty, E. Ea-Utils: Command-Line Tools for Processing Biological Sequencing Data. 2011. Available online: https://bioweb.pasteur.fr/packages/pack@ea-utils@1.1.2-806 (accessed on 12 January 2023).
- Rognes, T.; Flouri, T.; Nichols, B.; Quince, C.; Mahé, F. VSEARCH: A Versatile Open Source Tool for Metagenomics. PeerJ 2016, 4, E2584. [Google Scholar] [CrossRef] [PubMed]
- Bolyen, E.; Rideout, J.R.; Dillon, M.R.; Bokulich, N.A.; Abnet, C.; Al-Ghalith, G.A.; Alexander, H.; Alm, E.J.; Arumugam, M.; Asnicar, F. QIIME 2: Reproducible, Interactive, Scalable, and Extensible Microbiome Data Science. Nat. Biotechnol. 2019, 37, 852–857. [Google Scholar] [CrossRef] [PubMed]
- Mandal, S.; van Treuren, W.; White, R.A.; Eggesbø, M.; Knight, R.; Peddada, S.D. Analysis of Composition of Microbiomes: A Novel Method for Studying Microbial Composition. Microb. Ecol. Health Dis. 2015, 26, 27663. [Google Scholar] [CrossRef] [PubMed]
- Anderson, M.J. Permutational Multivariate Analysis of Variance (PERMANOVA). In Wiley Statsref: Statistics Reference Online; John Wiley & Sons, Ltd.: Hoboken, NJ, USA, 2014; pp. 1–15. [Google Scholar]
- Lozupone, C.; Lladser, M.E.; Knights, D.; Stombaugh, J.; Knight, R. UniFrac: An Effective Distance Metric for Microbial Community Comparison. ISME J. 2011, 5, 169–172. [Google Scholar] [CrossRef] [PubMed]
- Vázquez-Baeza, Y.; Pirrung, M.; Gonzalez, A.; Knight, R. EMPeror: A Tool for Visualizing High-Throughput Microbial Community Data. Gigascience 2013, 2, 2047–2217X. [Google Scholar] [CrossRef]
- Panda, A.K.; Rao, S.V.; Raju, M.; Sunder, G.S. Effect of Butyric Acid on Performance, Gastrointestinal Tract Health and Carcass Characteristics in Broiler Chickens. Asian-Australas J. Anim. Sci. 2009, 22, 1026–1031. [Google Scholar] [CrossRef]
- Leeson, S.; Namkung, H.; Antongiovanni, M.; Lee, E.H. Effect of Butyric Acid on the Performance and Carcass Yield of Broiler Chickens. Poult. Sci. 2005, 84, 1418–1422. [Google Scholar] [CrossRef]
- Antongiovanni, M.; Buccioni, A.; Petacchi, F.; Leeson, S.; Minieri, S.; Martini, A.; Cecchi, R. Butyric Acid Glycerides in the Diet of Broiler Chickens: Effects on Gut Histology and Carcass Composition. Ital. J. Anim. Sci. 2007, 6, 19–25. [Google Scholar] [CrossRef]
- Bedford, A.; Gong, J. Implications of Butyrate and Its Derivatives for Gut Health and Animal Production. Anim. Nutr. 2018, 4, 151–159. [Google Scholar] [CrossRef] [PubMed]
- Liu, H.; Wang, J.; He, T.; Becker, S.; Zhang, G.; Li, D.; Ma, X. Butyrate: A Double-Edged Sword for Health? Adv. Nutr. 2018, 9, 21–29. [Google Scholar] [CrossRef] [PubMed]
- Smith, D.J.; Barri, A.; Herges, G.; Hahn, J.; Yersin, A.G.; Jourdan, A. In Vitro Dissolution and in Vivo Absorption of Calcium [1-14C] Butyrate in Free or Protected Forms. J. Agric. Food Chem. 2012, 60, 3151–3157. [Google Scholar] [CrossRef] [PubMed]
- Levy, A.W.; Kessler, J.W.; Fuller, L.; Williams, S.; Mathis, G.F.; Lumpkins, B.; Valdez, F. Effect of Feeding an Encapsulated Source of Butyric Acid (ButiPEARL) on the Performance of Male Cobb Broilers Reared to 42 d of Age. Poult. Sci. 2015, 94, 1864–1870. [Google Scholar] [CrossRef] [PubMed]
- Song, B.; Li, H.; Wu, Y.; Zhen, W.; Wang, Z.; Xia, Z.; Guo, Y. Effect of Microencapsulated Sodium Butyrate Dietary Supplementation on Growth Performance and Intestinal Barrier Function of Broiler Chickens Infected with Necrotic Enteritis. Anim. Feed Sci. Technol. 2017, 232, 6–15. [Google Scholar] [CrossRef]
- Whelan, R.A.; Doranalli, K.; Rinttilä, T.; Vienola, K.; Jurgens, G.; Apajalahti, J. The Impact of Bacillus Subtilis DSM 32315 on the Pathology, Performance, and Intestinal Microbiome of Broiler Chickens in a Necrotic Enteritis Challenge. Poult. Sci. 2019, 98, 3450–3463. [Google Scholar] [CrossRef]
- Hernandez-Patlan, D.; Solis-Cruz, B.; Pontin, K.P.; Hernandez-Velasco, X.; Merino-Guzman, R.; Adhikari, B.; López-Arellano, R.; Kwon, Y.M.; Hargis, B.M.; Arreguin-Nava, M.A. Impact of a Bacillus Direct-Fed Microbial on Growth Performance, Intestinal Barrier Integrity, Necrotic Enteritis Lesions, and Ileal Microbiota in Broiler Chickens Using a Laboratory Challenge Model. Front. Vet. Sci. 2019, 6, 108. [Google Scholar] [CrossRef]
- Crespo-Piazuelo, D.; Migura-Garcia, L.; Estellé, J.; Criado-Mesas, L.; Revilla, M.; Castelló, A.; Muñoz, M.; García-Casco, J.M.; Fernández, A.I.; Ballester, M. Association between the Pig Genome and Its Gut Microbiota Composition. Sci. Rep. 2019, 9, 1–11. [Google Scholar] [CrossRef]
- Vandeputte, D.; Kathagen, G.; D’hoe, K.; Vieira-Silva, S.; Valles-Colomer, M.; Sabino, J.; Wang, J.; Tito, R.Y.; de Commer, L.; Darzi, Y. Quantitative Microbiome Profiling Links Gut Community Variation to Microbial Load. Nature 2017, 551, 507–511. [Google Scholar] [CrossRef]
Disclaimer/Publisher’s Note: The statements, opinions and data contained in all publications are solely those of the individual author(s) and contributor(s) and not of MDPI and/or the editor(s). MDPI and/or the editor(s) disclaim responsibility for any injury to people or property resulting from any ideas, methods, instructions or products referred to in the content. |
© 2023 by the authors. Licensee MDPI, Basel, Switzerland. This article is an open access article distributed under the terms and conditions of the Creative Commons Attribution (CC BY) license (https://creativecommons.org/licenses/by/4.0/).