Individual and Combined Effects of a Direct-Fed Microbial and Calcium Butyrate on Growth Performance, Intestinal Histology and Gut Microbiota of Broiler Chickens
Abstract
1. Introduction
2. Materials and Methods
2.1. Broiler Husbandry and Dietary Treatments
2.2. Broiler Live Performance and Processing Yields
2.3. Intestinal Histology
2.4. Statistical Analysis of Performance, Processing, and Histology Data
2.5. Microbiota Analyses
3. Results
3.1. Growth Performance, Processing Characteristics, and Histology
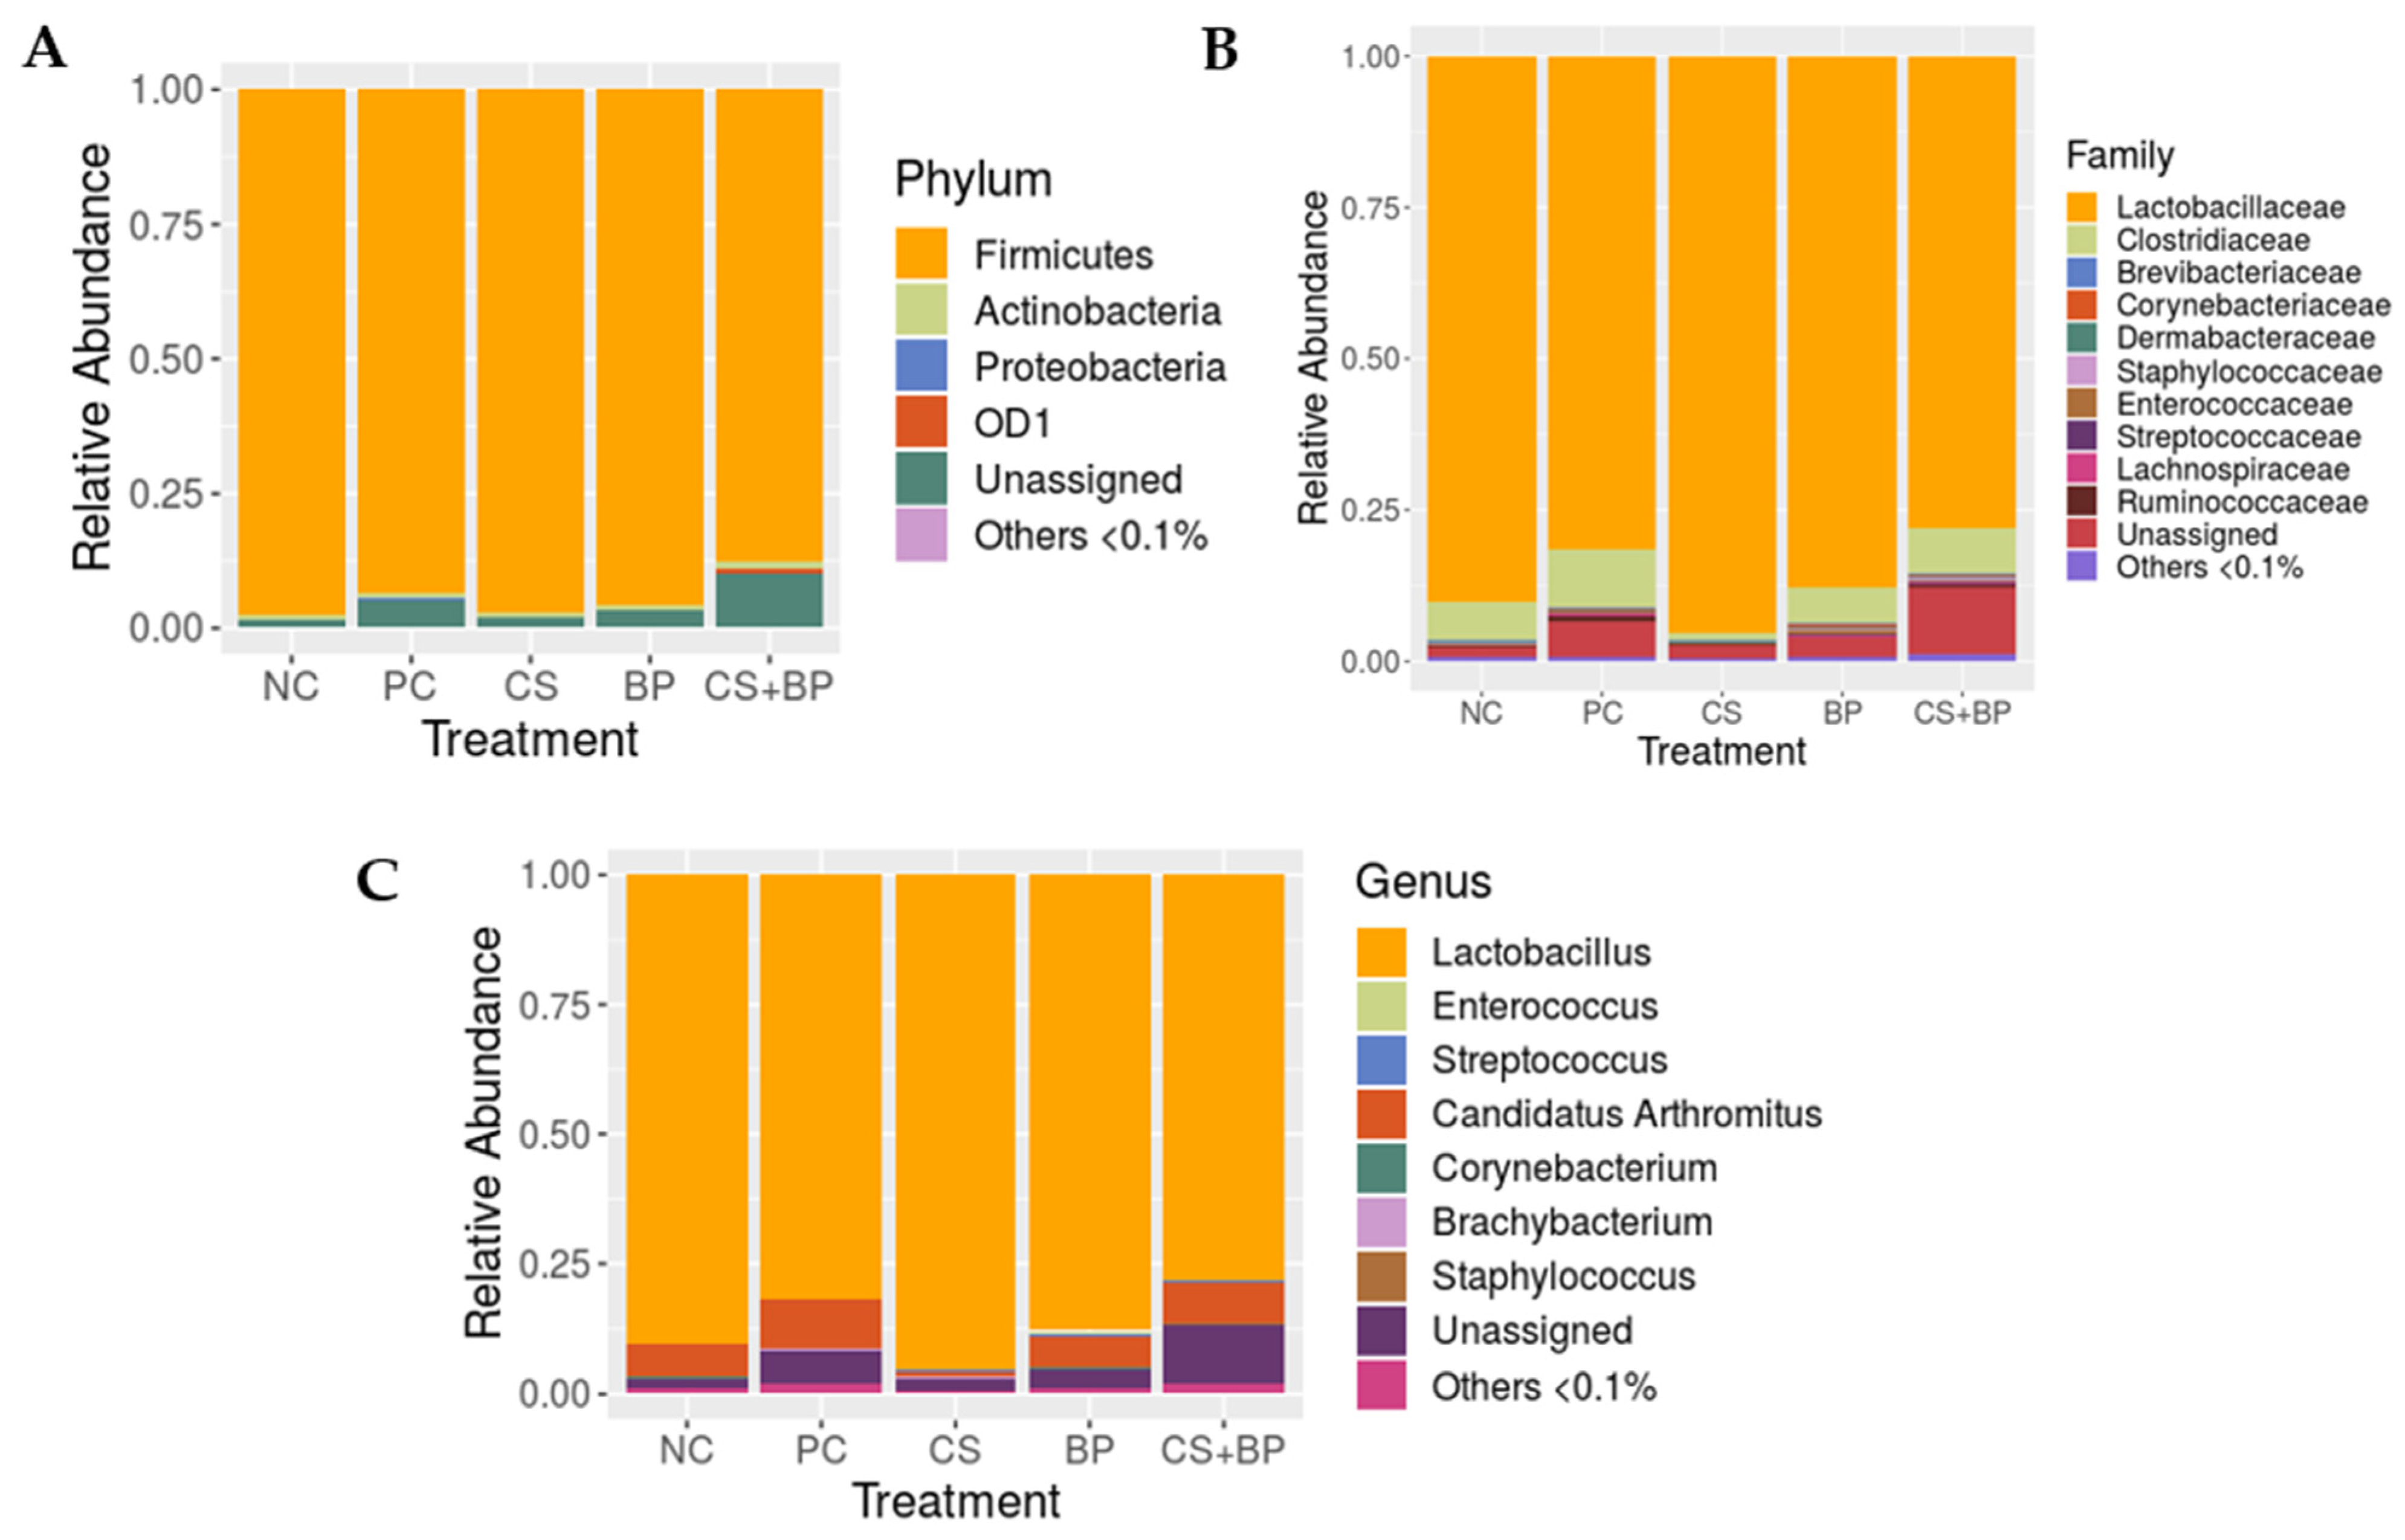
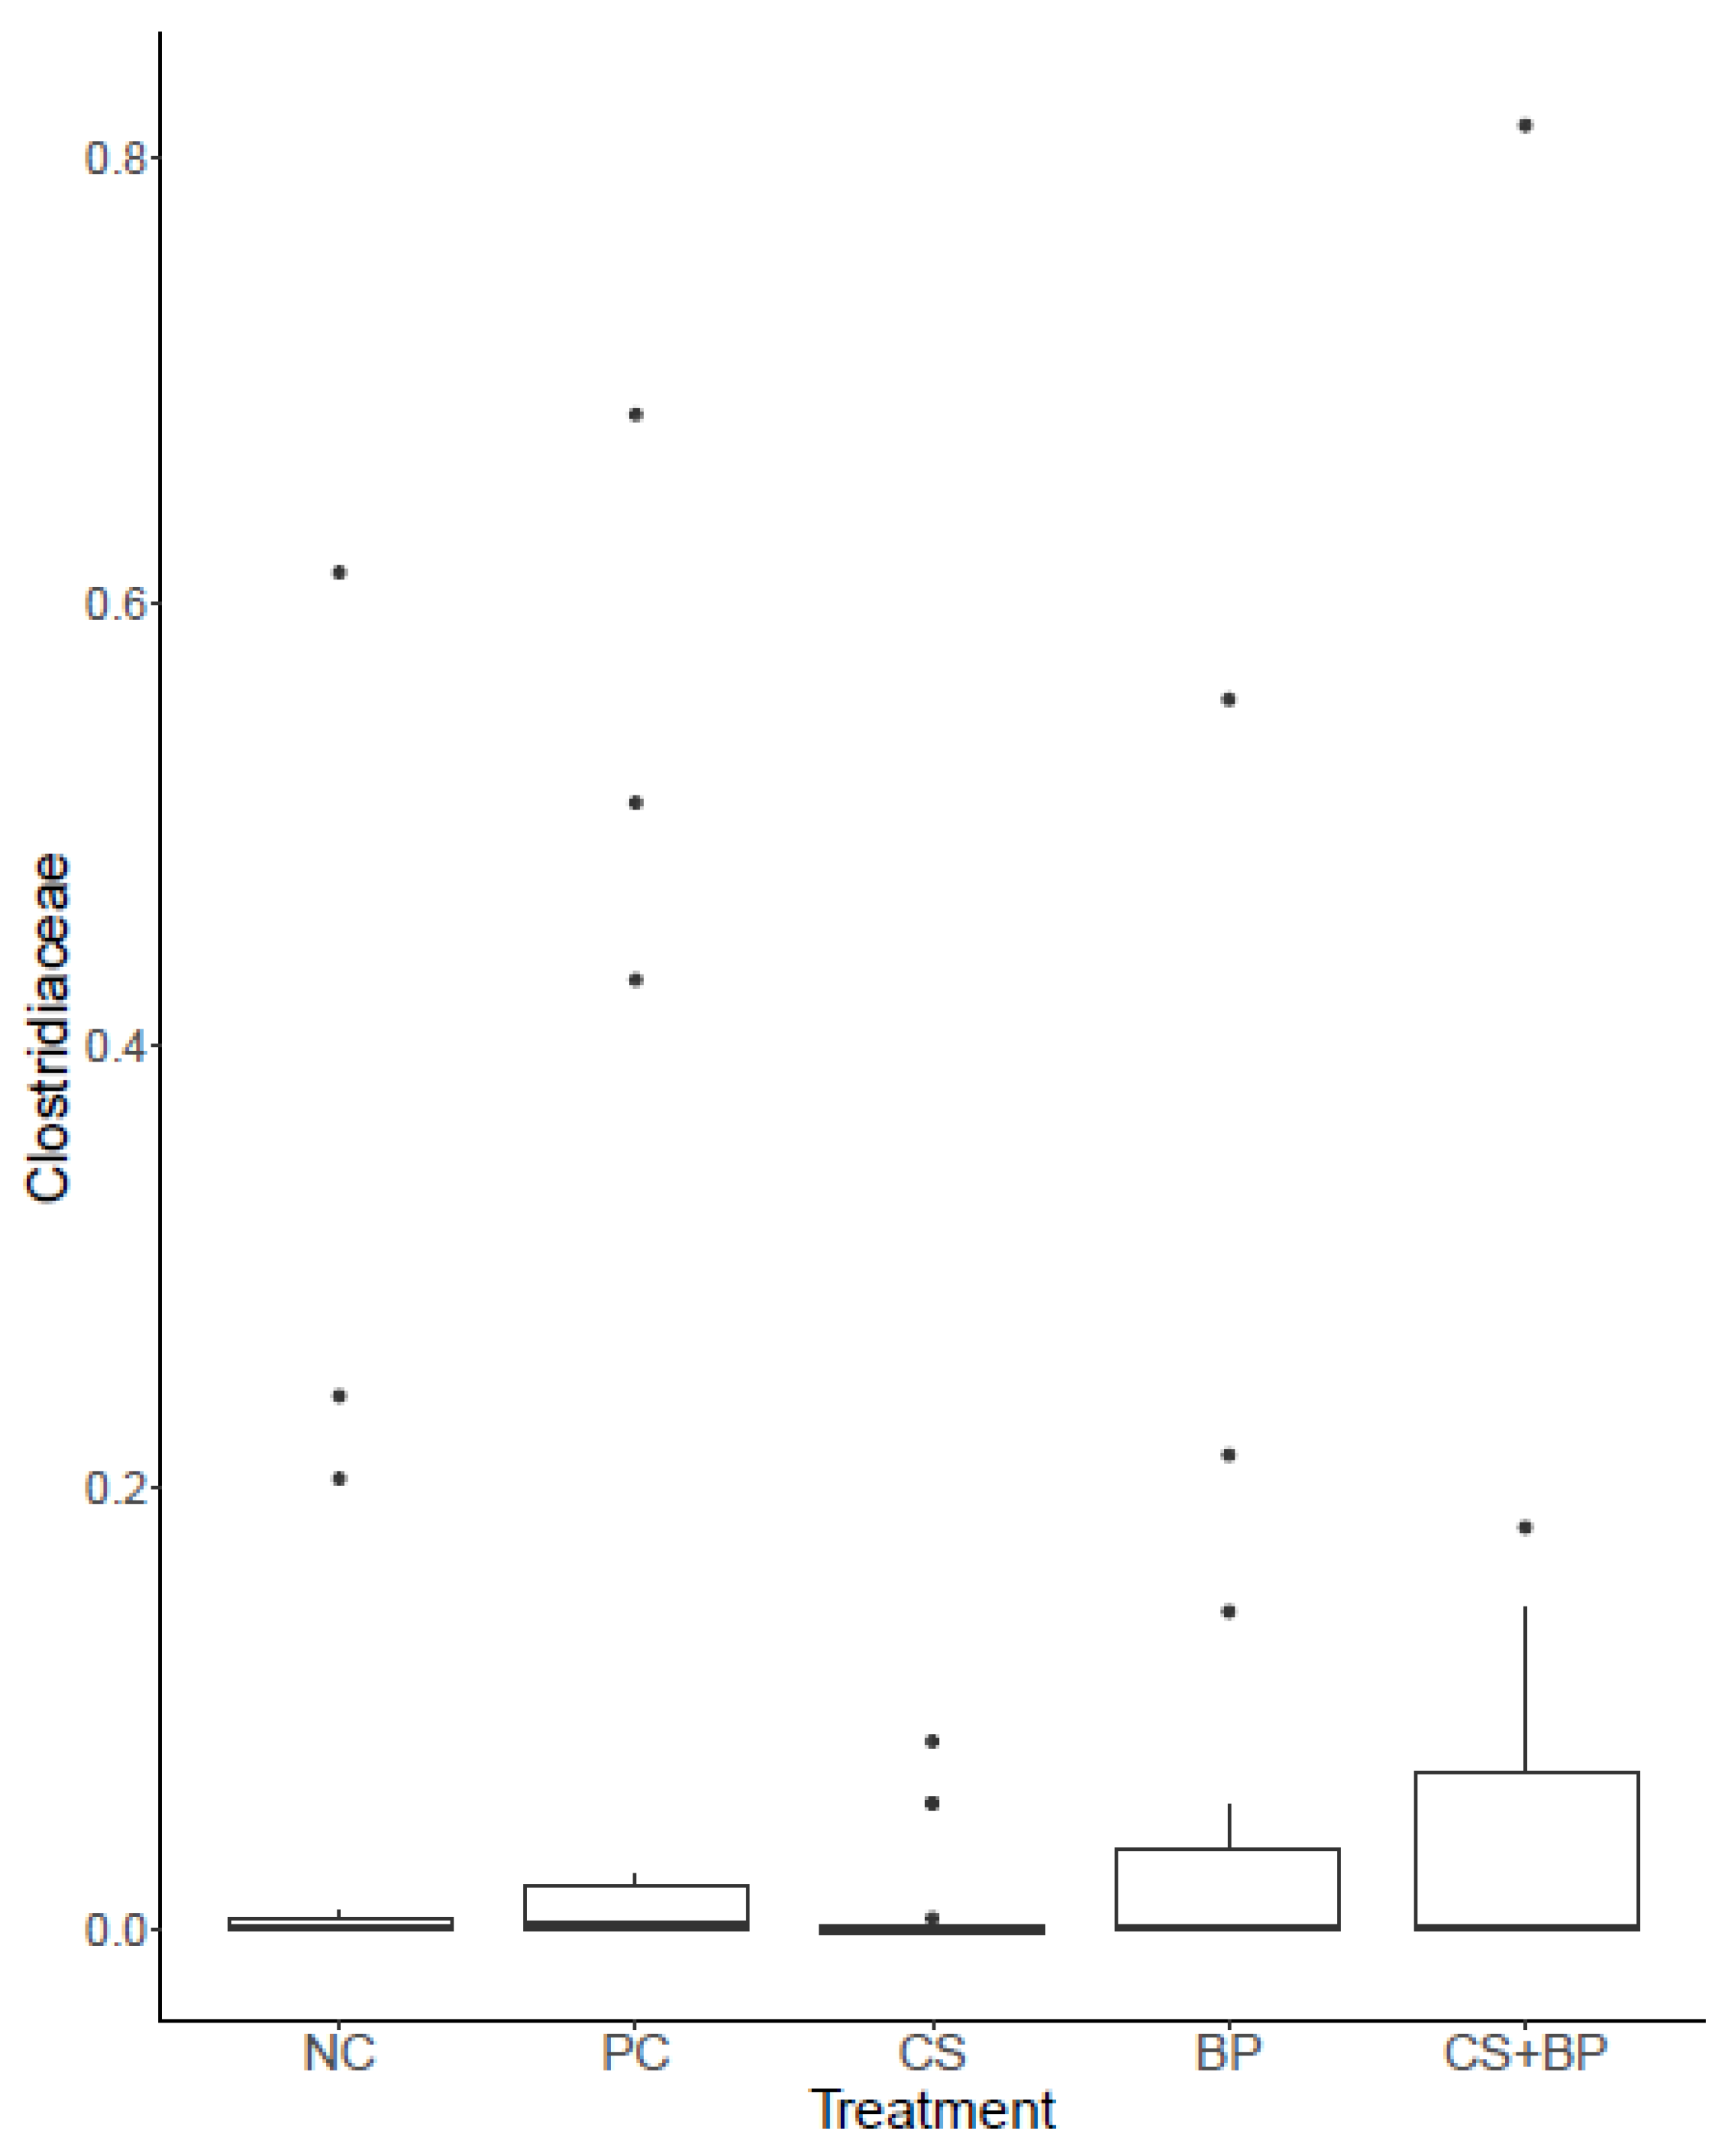
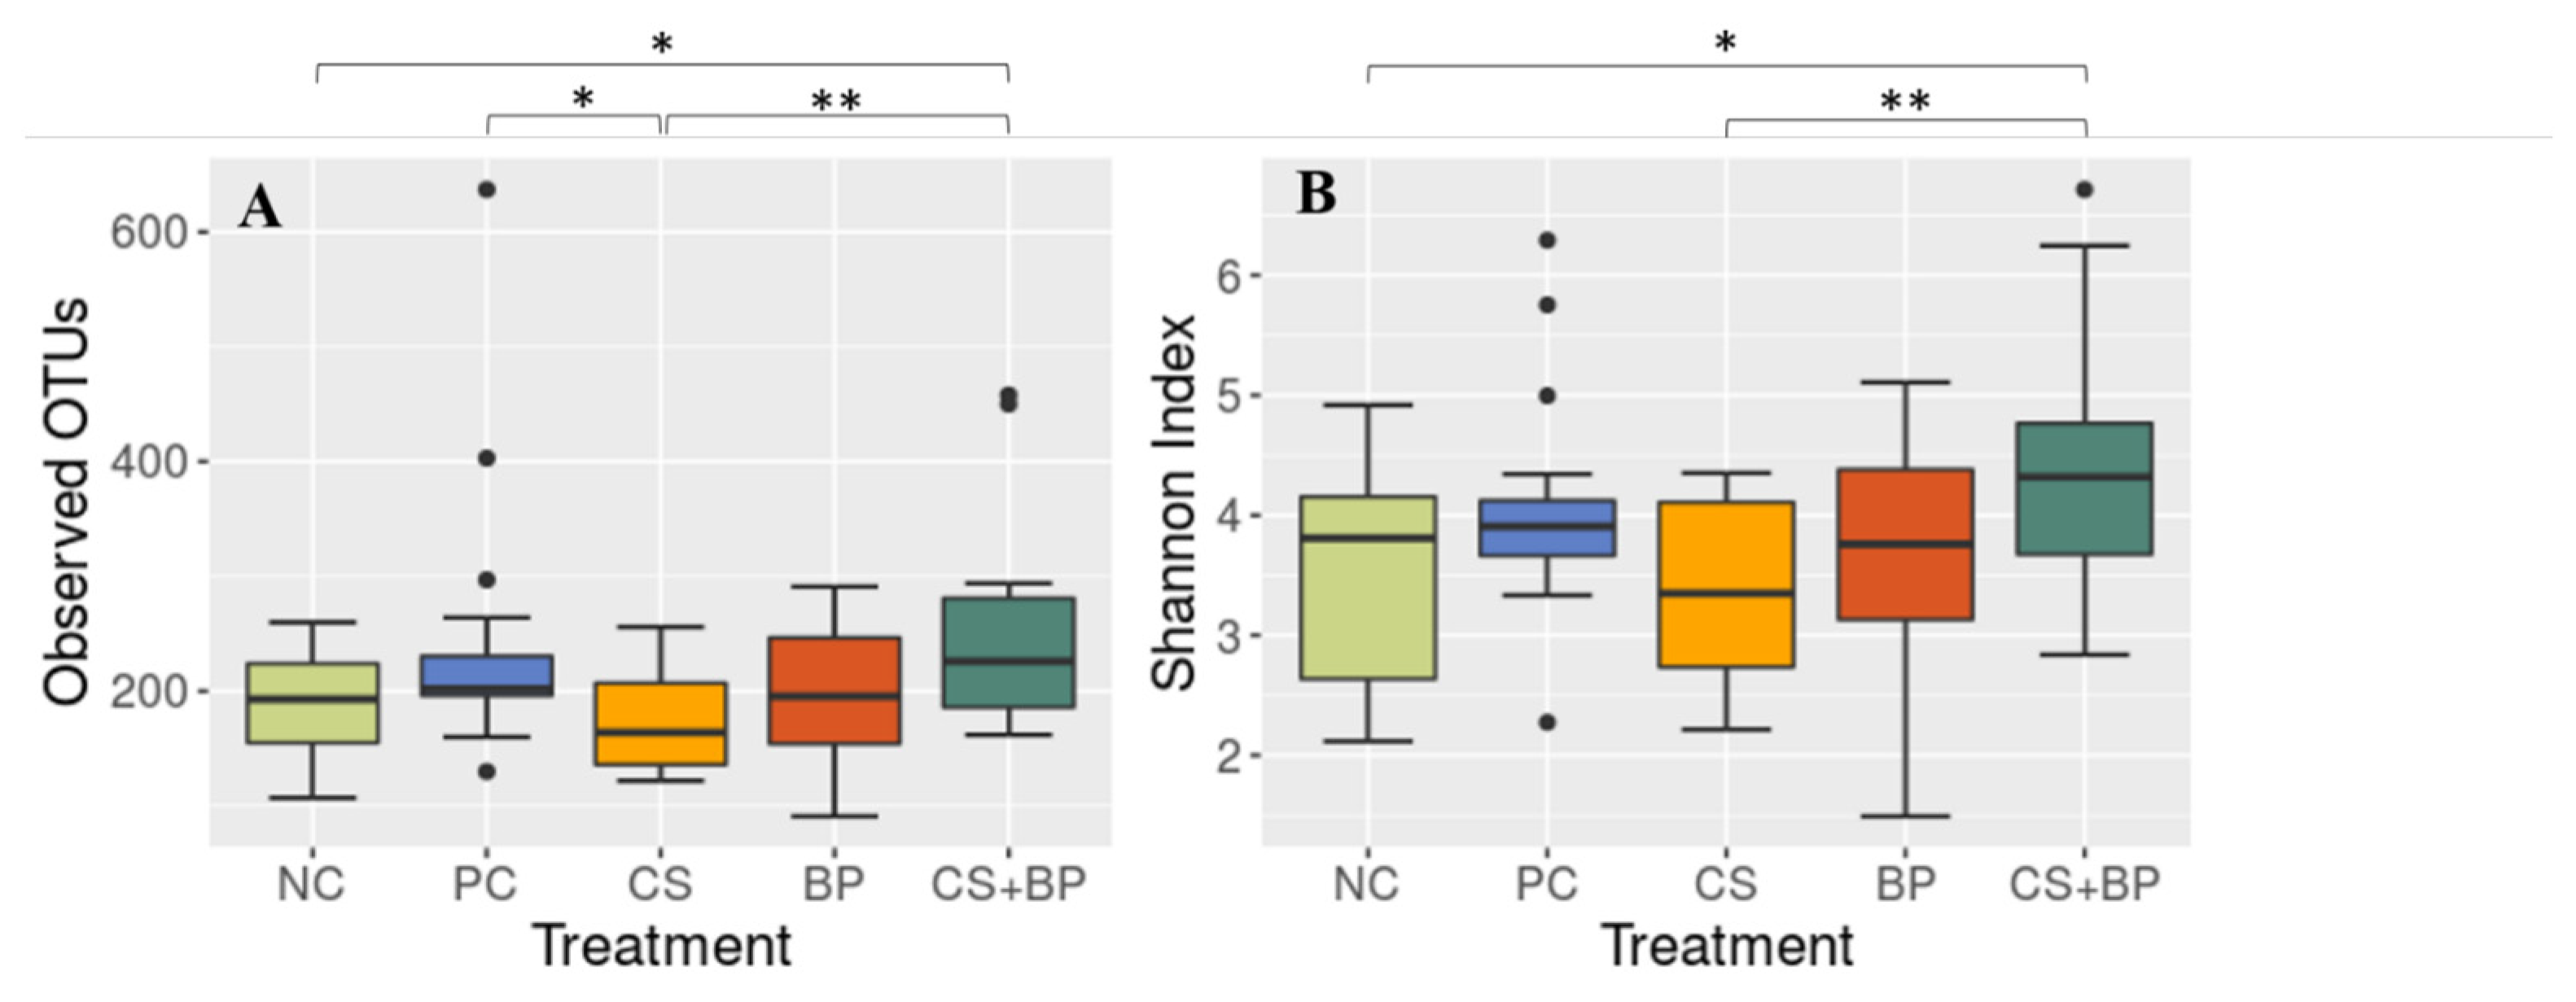
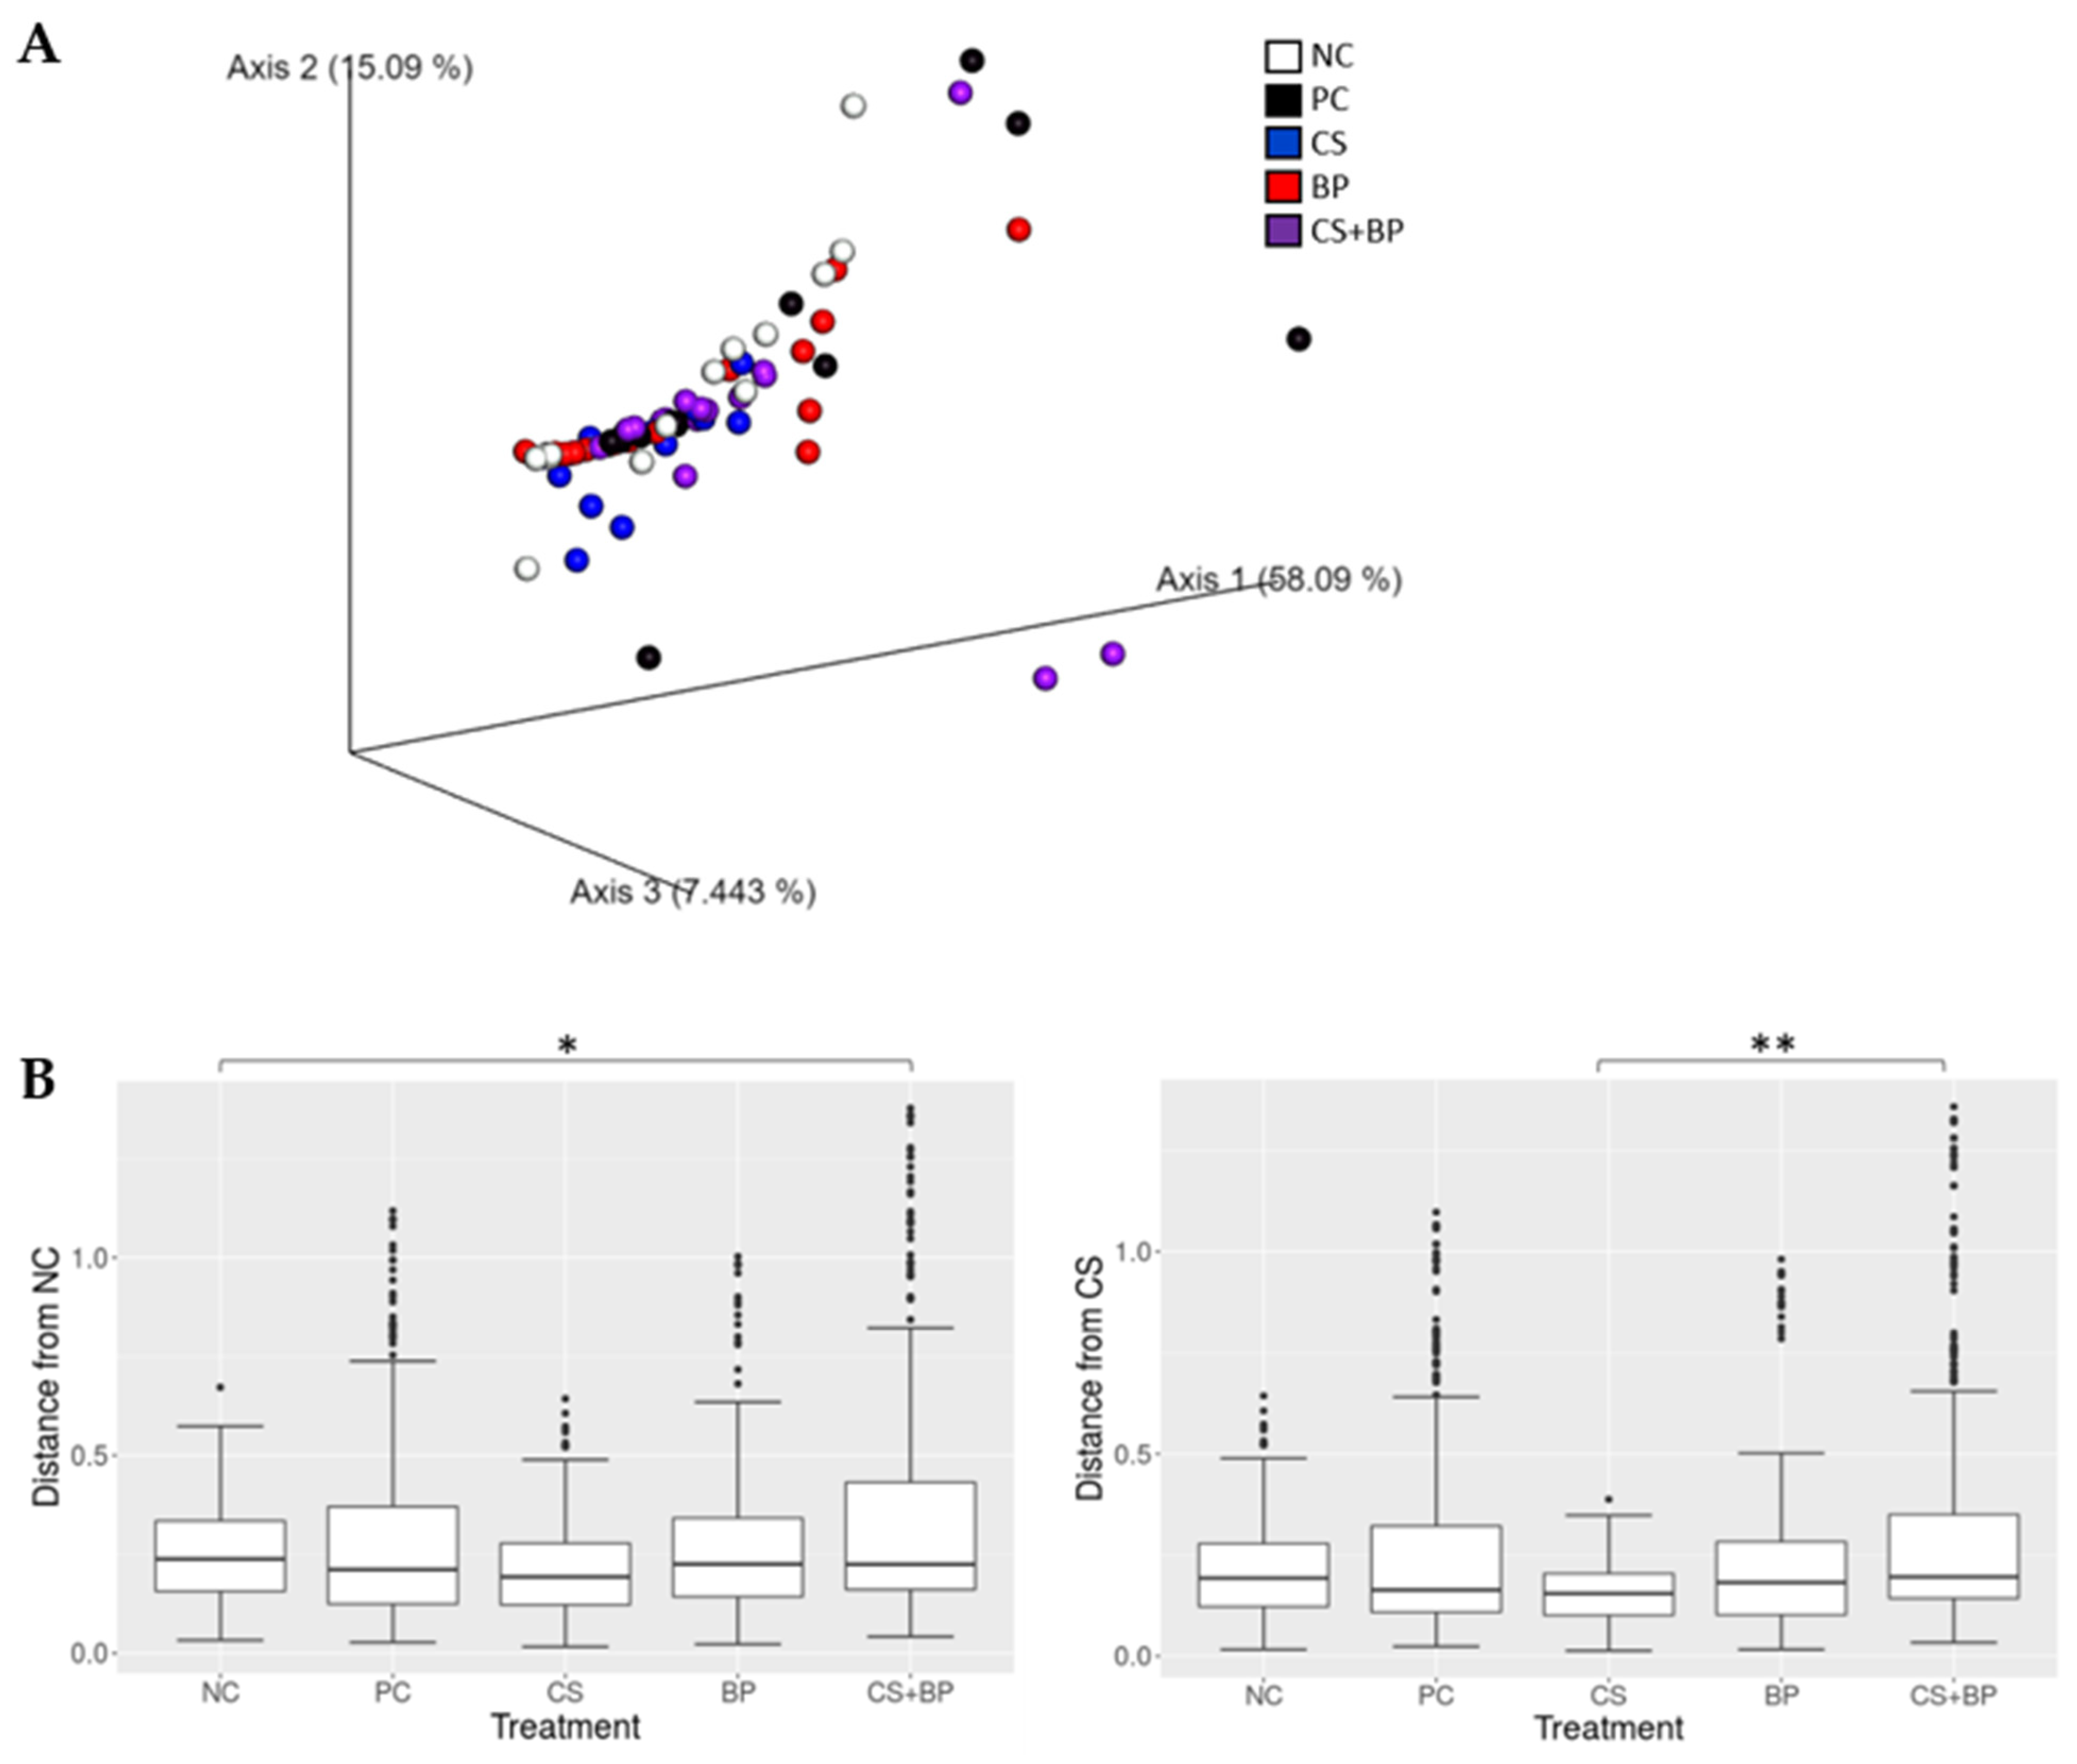
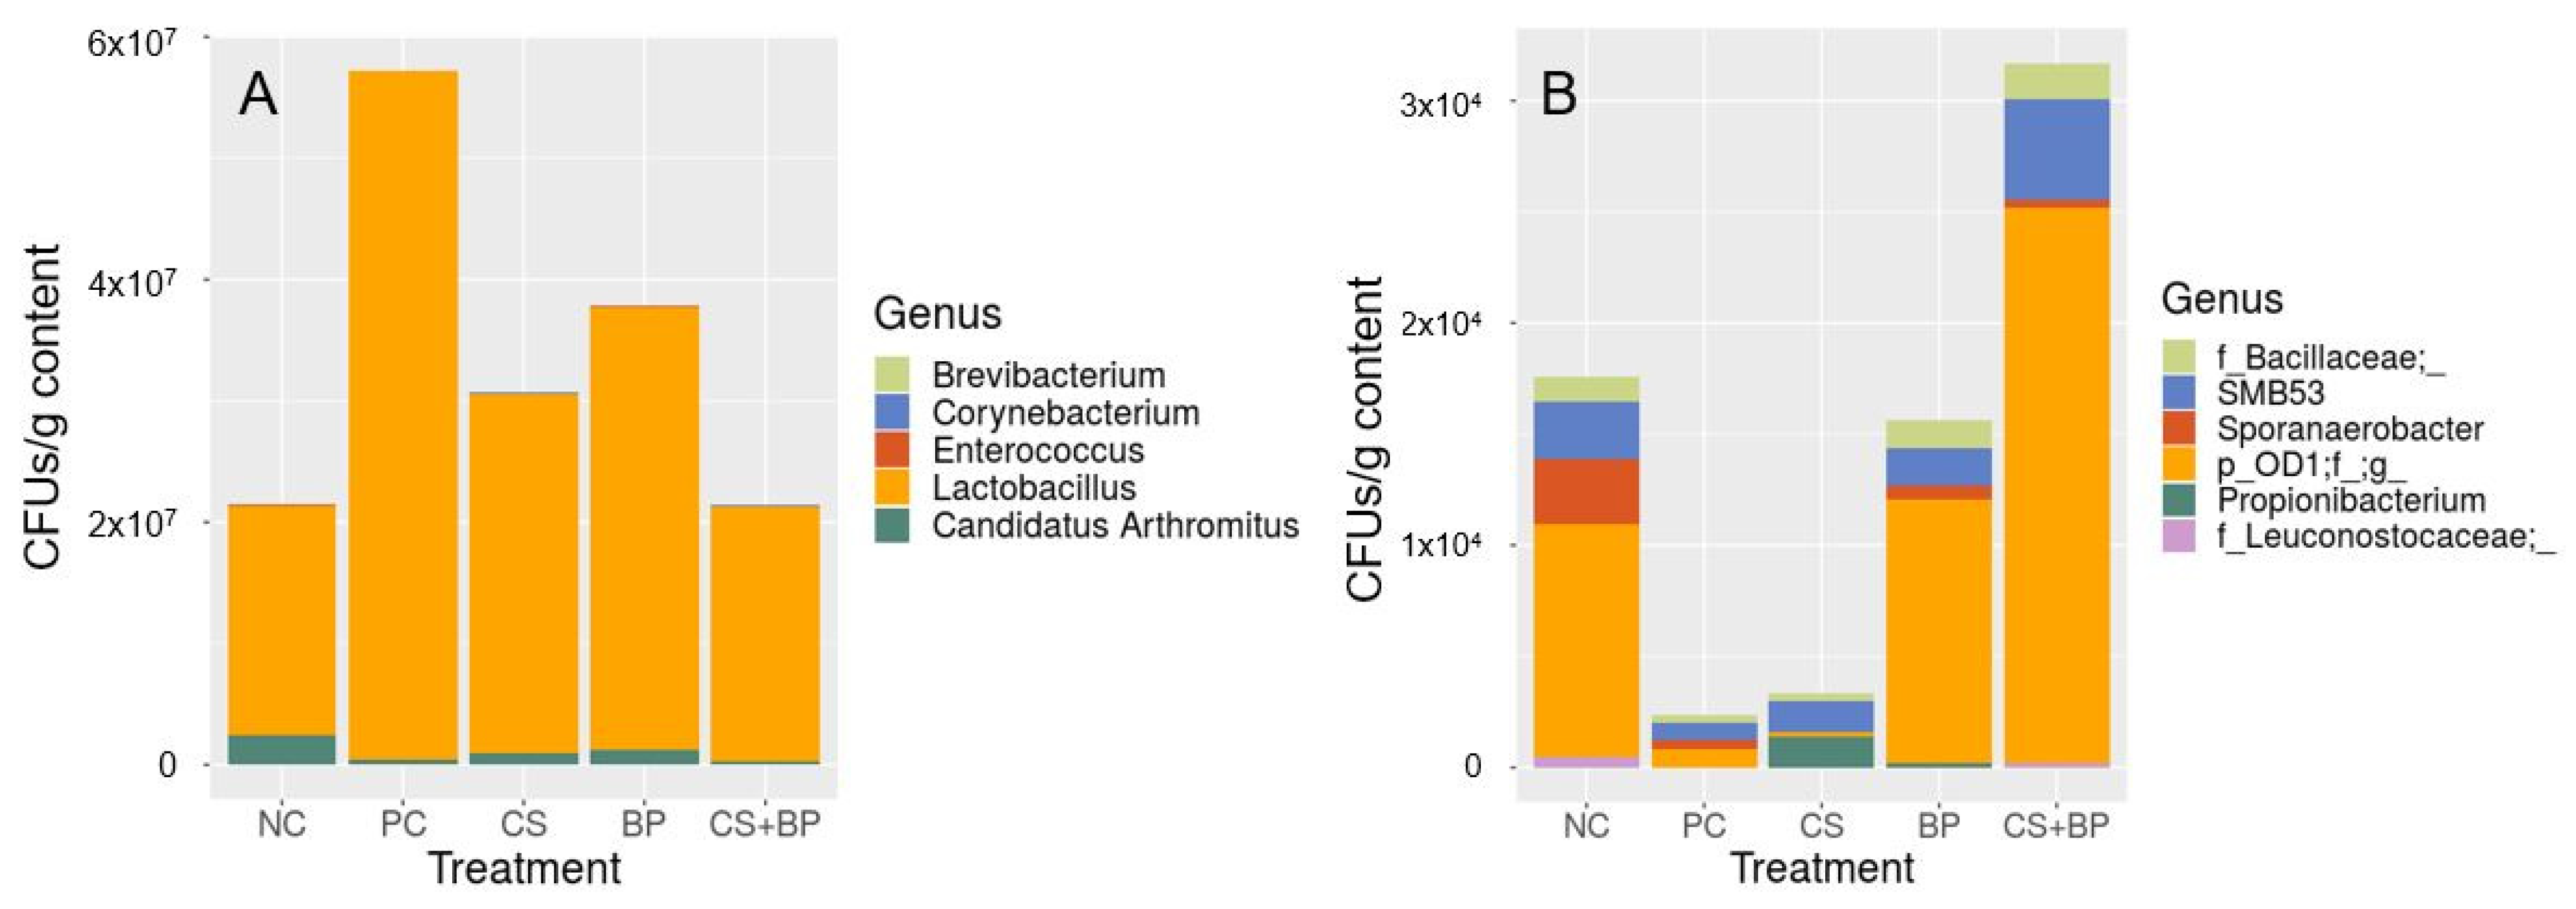
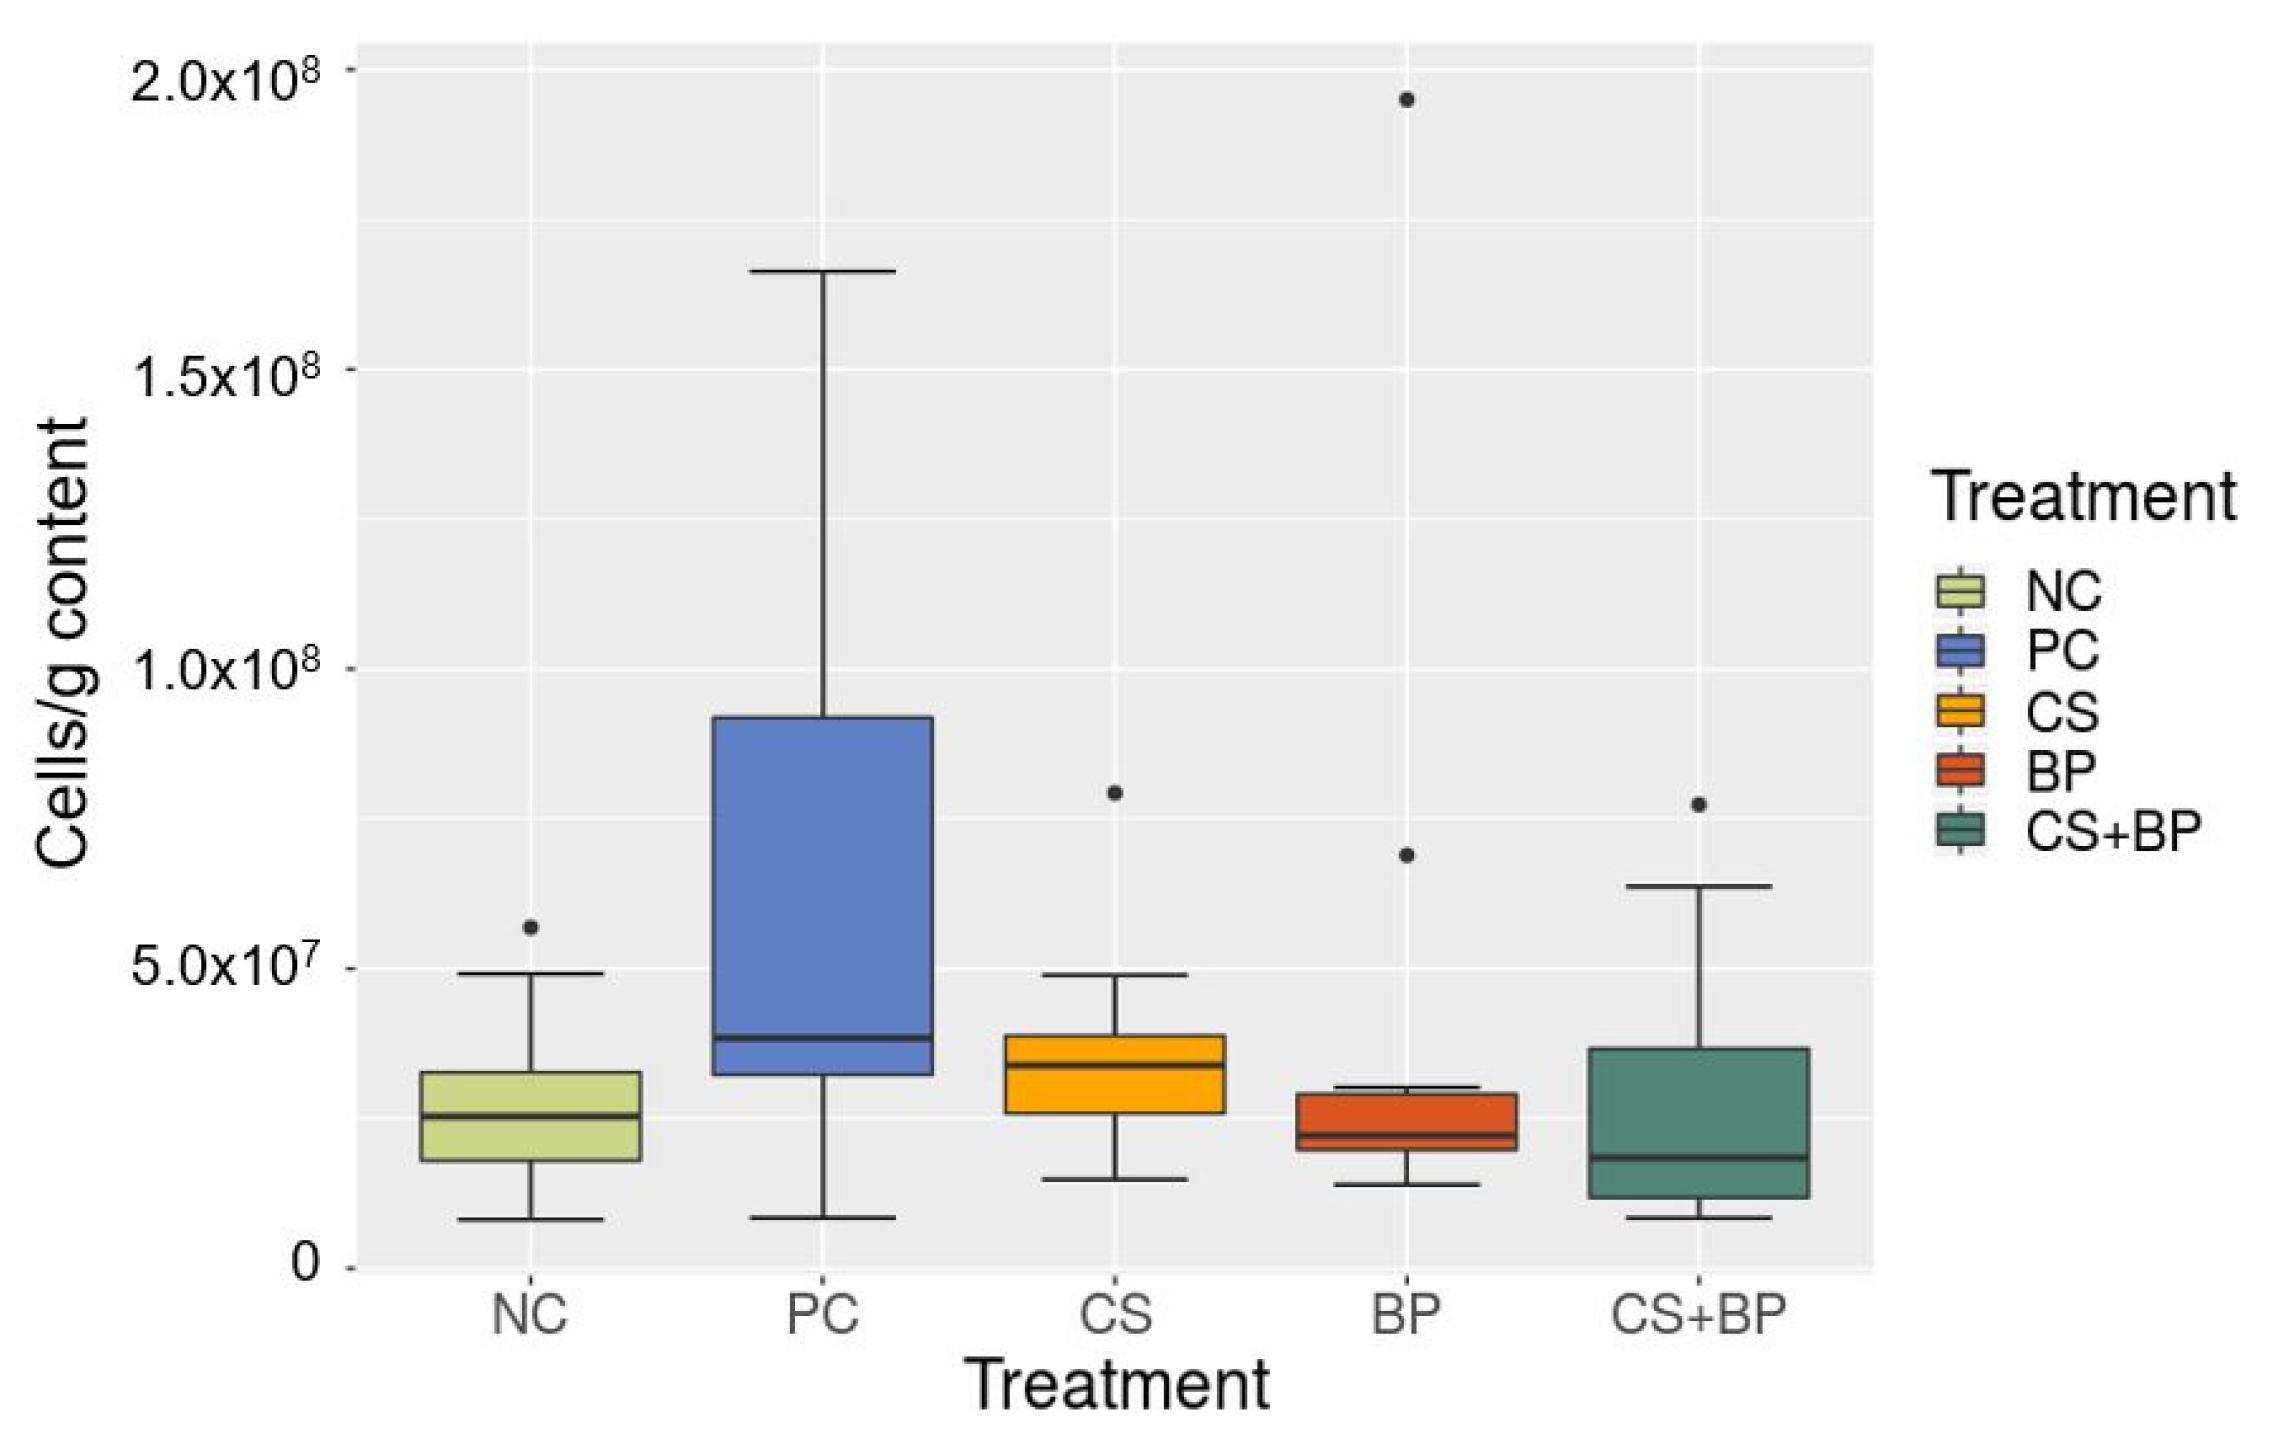
3.2. Microbiota Analysis
3.3. Correlation between Parameters in Broilers (Growth and Processing) and Gut Microbiota
4. Discussion
Supplementary Materials
Author Contributions
Funding
Institutional Review Board Statement
Data Availability Statement
Acknowledgments
Conflicts of Interest
References
- Mottet, A.; Tempio, G. Global Poultry Production: Current State and Future Outlook and Challenges. Worlds Poult. Sci. J. 2017, 73, 245–256. [Google Scholar] [CrossRef]
- Alexandratos, N.; Bruinsma, J. World Agriculture Towards 2030/2050: The 2012 Revision; FAO: Rome, Italy, 2012. [Google Scholar]
- Dibner, J.J.; Richards, J.D. Antibiotic Growth Promoters in Agriculture: History and Mode of Action. Poult. Sci. 2005, 84, 634–643. [Google Scholar] [CrossRef] [PubMed]
- Huyghebaert, G.; Ducatelle, R.; van Immerseel, F. An Update on Alternatives to Antimicrobial Growth Promoters for Broilers. Vet. J. 2011, 187, 182–188. [Google Scholar] [CrossRef] [PubMed]
- Jayaraman, S.; Thangavel, G.; Kurian, H.; Mani, R.; Mukkalil, R.; Chirakkal, H. Bacillus Subtilis PB6 Improves Intestinal Health of Broiler Chickens Challenged with Clostridium Perfringens-Induced Necrotic Enteritis. Poult. Sci. 2013, 92, 370–374. [Google Scholar] [CrossRef]
- Jayaraman, S.; Das, P.P.; Saini, P.C.; Roy, B.; Chatterjee, P.N. Use of Bacillus Subtilis PB6 as a Potential Antibiotic Growth Promoter Replacement in Improving Performance of Broiler Birds. Poult. Sci. 2017, 96, 2614–2622. [Google Scholar] [CrossRef]
- Jerzsele, A.; Szeker, K.; Csizinszky, R.; Gere, E.; Jakab, C.; Mallo, J.J.; Galfi, P. Efficacy of Protected Sodium Butyrate, a Protected Blend of Essential Oils, Their Combination, and Bacillus Amyloliquefaciens Spore Suspension against Artificially Induced Necrotic Enteritis in Broilers. Poult. Sci. 2012, 91, 837–843. [Google Scholar] [CrossRef]
- Teo, A.Y.; Tan, H.-M. Evaluation of the Performance and Intestinal Gut Microflora of Broilers Fed on Corn-Soy Diets Supplemented with Bacillus Subtilis PB6 (CloSTAT). J. Appl. Poult. Res. 2007, 16, 296–303. [Google Scholar] [CrossRef]
- Liu, J.D.; Lumpkins, B.; Mathis, G.; Williams, S.M.; Fowler, J. Evaluation of Encapsulated Sodium Butyrate with Varying Releasing Times on Growth Performance and Necrotic Enteritis Mitigation in Broilers. Poult. Sci. 2019, 98, 3240–3245. [Google Scholar] [CrossRef]
- Bedford, A.; Yu, H.; Squires, E.J.; Leeson, S.; Gong, J. Effects of Supplementation Level and Feeding Schedule of Butyrate Glycerides on the Growth Performance and Carcass Composition of Broiler Chickens. Poult. Sci. 2017, 96, 3221–3228. [Google Scholar] [CrossRef]
- Aviagen. Broiler Management Handbook; Aviagen: Huntsville, AL, USA, 2018. [Google Scholar]
- Aviagen. Ross 708: Broiler Nutrition Specifications; Aviagen: Huntsville, AL, USA, 2014. [Google Scholar]
- Iji, P.A.; Saki, A.; Tivey, D.R. Body and Intestinal Growth of Broiler Chicks on a Commercial Starter Diet. 1. Intestinal Weight and Mucosal Development. Br. Poult. Sci. 2001, 42, 505–513. [Google Scholar] [CrossRef]
- Adhikari, B.; Kwon, Y.M. Characterization of the Culturable Subpopulations of Lactobacillus in the Chicken Intestinal Tract as a Resource for Probiotic Development. Front. Microbiol. 2017, 8, 1389. [Google Scholar] [CrossRef] [PubMed]
- Caporaso, J.G.; Kuczynski, J.; Stombaugh, J.; Bittinger, K.; Bushman, F.D.; Costello, E.K.; Fierer, N.; Peña, A.G.; Goodrich, J.K.; Gordon, J.I. QIIME Allows Analysis of High-Throughput Community Sequencing Data. Nat. Methods 2010, 7, 335–336. [Google Scholar] [CrossRef] [PubMed]
- Aronesty, E. Ea-Utils: Command-Line Tools for Processing Biological Sequencing Data. 2011. Available online: https://bioweb.pasteur.fr/packages/pack@ea-utils@1.1.2-806 (accessed on 12 January 2023).
- Rognes, T.; Flouri, T.; Nichols, B.; Quince, C.; Mahé, F. VSEARCH: A Versatile Open Source Tool for Metagenomics. PeerJ 2016, 4, E2584. [Google Scholar] [CrossRef] [PubMed]
- Bolyen, E.; Rideout, J.R.; Dillon, M.R.; Bokulich, N.A.; Abnet, C.; Al-Ghalith, G.A.; Alexander, H.; Alm, E.J.; Arumugam, M.; Asnicar, F. QIIME 2: Reproducible, Interactive, Scalable, and Extensible Microbiome Data Science. Nat. Biotechnol. 2019, 37, 852–857. [Google Scholar] [CrossRef] [PubMed]
- Mandal, S.; van Treuren, W.; White, R.A.; Eggesbø, M.; Knight, R.; Peddada, S.D. Analysis of Composition of Microbiomes: A Novel Method for Studying Microbial Composition. Microb. Ecol. Health Dis. 2015, 26, 27663. [Google Scholar] [CrossRef] [PubMed]
- Anderson, M.J. Permutational Multivariate Analysis of Variance (PERMANOVA). In Wiley Statsref: Statistics Reference Online; John Wiley & Sons, Ltd.: Hoboken, NJ, USA, 2014; pp. 1–15. [Google Scholar]
- Lozupone, C.; Lladser, M.E.; Knights, D.; Stombaugh, J.; Knight, R. UniFrac: An Effective Distance Metric for Microbial Community Comparison. ISME J. 2011, 5, 169–172. [Google Scholar] [CrossRef] [PubMed]
- Vázquez-Baeza, Y.; Pirrung, M.; Gonzalez, A.; Knight, R. EMPeror: A Tool for Visualizing High-Throughput Microbial Community Data. Gigascience 2013, 2, 2047–2217X. [Google Scholar] [CrossRef]
- Panda, A.K.; Rao, S.V.; Raju, M.; Sunder, G.S. Effect of Butyric Acid on Performance, Gastrointestinal Tract Health and Carcass Characteristics in Broiler Chickens. Asian-Australas J. Anim. Sci. 2009, 22, 1026–1031. [Google Scholar] [CrossRef]
- Leeson, S.; Namkung, H.; Antongiovanni, M.; Lee, E.H. Effect of Butyric Acid on the Performance and Carcass Yield of Broiler Chickens. Poult. Sci. 2005, 84, 1418–1422. [Google Scholar] [CrossRef]
- Antongiovanni, M.; Buccioni, A.; Petacchi, F.; Leeson, S.; Minieri, S.; Martini, A.; Cecchi, R. Butyric Acid Glycerides in the Diet of Broiler Chickens: Effects on Gut Histology and Carcass Composition. Ital. J. Anim. Sci. 2007, 6, 19–25. [Google Scholar] [CrossRef]
- Bedford, A.; Gong, J. Implications of Butyrate and Its Derivatives for Gut Health and Animal Production. Anim. Nutr. 2018, 4, 151–159. [Google Scholar] [CrossRef] [PubMed]
- Liu, H.; Wang, J.; He, T.; Becker, S.; Zhang, G.; Li, D.; Ma, X. Butyrate: A Double-Edged Sword for Health? Adv. Nutr. 2018, 9, 21–29. [Google Scholar] [CrossRef] [PubMed]
- Smith, D.J.; Barri, A.; Herges, G.; Hahn, J.; Yersin, A.G.; Jourdan, A. In Vitro Dissolution and in Vivo Absorption of Calcium [1-14C] Butyrate in Free or Protected Forms. J. Agric. Food Chem. 2012, 60, 3151–3157. [Google Scholar] [CrossRef] [PubMed]
- Levy, A.W.; Kessler, J.W.; Fuller, L.; Williams, S.; Mathis, G.F.; Lumpkins, B.; Valdez, F. Effect of Feeding an Encapsulated Source of Butyric Acid (ButiPEARL) on the Performance of Male Cobb Broilers Reared to 42 d of Age. Poult. Sci. 2015, 94, 1864–1870. [Google Scholar] [CrossRef] [PubMed]
- Song, B.; Li, H.; Wu, Y.; Zhen, W.; Wang, Z.; Xia, Z.; Guo, Y. Effect of Microencapsulated Sodium Butyrate Dietary Supplementation on Growth Performance and Intestinal Barrier Function of Broiler Chickens Infected with Necrotic Enteritis. Anim. Feed Sci. Technol. 2017, 232, 6–15. [Google Scholar] [CrossRef]
- Whelan, R.A.; Doranalli, K.; Rinttilä, T.; Vienola, K.; Jurgens, G.; Apajalahti, J. The Impact of Bacillus Subtilis DSM 32315 on the Pathology, Performance, and Intestinal Microbiome of Broiler Chickens in a Necrotic Enteritis Challenge. Poult. Sci. 2019, 98, 3450–3463. [Google Scholar] [CrossRef]
- Hernandez-Patlan, D.; Solis-Cruz, B.; Pontin, K.P.; Hernandez-Velasco, X.; Merino-Guzman, R.; Adhikari, B.; López-Arellano, R.; Kwon, Y.M.; Hargis, B.M.; Arreguin-Nava, M.A. Impact of a Bacillus Direct-Fed Microbial on Growth Performance, Intestinal Barrier Integrity, Necrotic Enteritis Lesions, and Ileal Microbiota in Broiler Chickens Using a Laboratory Challenge Model. Front. Vet. Sci. 2019, 6, 108. [Google Scholar] [CrossRef]
- Crespo-Piazuelo, D.; Migura-Garcia, L.; Estellé, J.; Criado-Mesas, L.; Revilla, M.; Castelló, A.; Muñoz, M.; García-Casco, J.M.; Fernández, A.I.; Ballester, M. Association between the Pig Genome and Its Gut Microbiota Composition. Sci. Rep. 2019, 9, 1–11. [Google Scholar] [CrossRef]
- Vandeputte, D.; Kathagen, G.; D’hoe, K.; Vieira-Silva, S.; Valles-Colomer, M.; Sabino, J.; Wang, J.; Tito, R.Y.; de Commer, L.; Darzi, Y. Quantitative Microbiome Profiling Links Gut Community Variation to Microbial Load. Nature 2017, 551, 507–511. [Google Scholar] [CrossRef]

| Ingredient, % as-Fed | Starter 0 to 15 d | Grower 15 to 29 d | Finisher 29 to 47 d |
|---|---|---|---|
| Corn | 52.999 | 56.684 | 62.194 |
| Soybean meal | 36.874 | 31.667 | 24.330 |
| Distillers dried grains with solubles | 4.000 | 5.000 | 7.000 |
| Poultry fat | 2.542 | 3.370 | 3.505 |
| Limestone | 1.211 | 1.170 | 1.117 |
| Dicalcium phosphate | 1.005 | 0.803 | 0.478 |
| Salt | 0.395 | 0.394 | 0.391 |
| DL-methionine | 0.280 | 0.229 | 0.235 |
| L-lysine HCl | 0.148 | 0.150 | 0.223 |
| L-threonine | 0.073 | 0.058 | 0.072 |
| Trace mineral premix 1 | 0.100 | 0.100 | 0.100 |
| Vitamin premix 2 | 0.100 | 0.100 | 0.100 |
| Se premix (0.06%) | 0.020 | 0.020 | 0.020 |
| Choline chloride (60%) | 0.050 | 0.050 | 0.030 |
| Phytase 3 | 0.038 | 0.038 | 0.038 |
| Antioxidant 4 | 0.018 | 0.018 | 0.018 |
| Coccidiostat 5 | 0.050 | 0.050 | 0.050 |
| Inert filler 6 | 0.100 | 0.100 | 0.100 |
| Calculated composition, % unless noted otherwise | |||
| AME, kcal/kg | 3,035 | 3,125 | 3,200 |
| CP | 23.00 | 21.00 | 18.50 |
| Digestible Lys | 1.20 | 1.08 | 0.970 |
| Digestible TSAA | 0.89 | 0.80 | 0.76 |
| Digestible Thr | 0.80 | 0.72 | 0.65 |
| Ca | 0.96 | 0.88 | 0.76 |
| Available P | 0.48 | 0.44 | 0.38 |
| Item | n | 15 d BW, kg | BWG, kg | FI, kg | FCR, kg:kg |
|---|---|---|---|---|---|
| One-way ANOVA | |||||
| NC | 10 | 0.489 | 0.446 | 0.549 | 1.236 a |
| PC | 10 | 0.501 | 0.459 | 0.547 | 1.195 b |
| CS | 10 | 0.502 | 0.459 | 0.552 | 1.192 b |
| BP | 10 | 0.505 | 0.463 | 0.548 | 1.188 b |
| CS + BP | 10 | 0.496 | 0.454 | 0.540 | 1.193 b |
| SEM | 0.0047 | 0.0047 | 0.0057 | 0.0093 | |
| p-value | 0.153 | 0.138 | 0.701 | 0.0034 | |
| Two-way ANOVA with PC group removed | |||||
| Main effect of CS | |||||
| Without CS | 20 | 0.497 | 0.455 | 0.548 | 1.212 a |
| With CS | 20 | 0.499 | 0.455 | 0.546 | 1.192 b |
| SEM | 0.0035 | 0.0035 | 0.0042 | 0.0067 | |
| Main effect of BP | |||||
| Without BP | 20 | 0.495 | 0.453 | 0.550 | 1.214 a |
| With BP | 20 | 0.500 | 0.459 | 0.544 | 1.190 b |
| SEM | 0.0035 | 0.0035 | 0.0060 | 0.0066 | |
| p-values | |||||
| CS | 0.729 | 0.650 | 0.687 | 0.046 | |
| BP | 0.302 | 0.250 | 0.289 | 0.015 | |
| CS × BP | 0.036 | 0.039 | 0.363 | 0.014 | |
| Item | n | 29 d BW, kg | BWG, kg | FI, kg | FCR, kg:kg |
|---|---|---|---|---|---|
| One-way ANOVA | |||||
| NC | 10 | 1.517 | 1.475 | 2.084 | 1.434 |
| PC | 10 | 1.540 | 1.499 | 2.072 | 1.422 |
| CS | 10 | 1.524 | 1.481 | 2.079 | 1.441 |
| BP | 10 | 1.543 | 1.501 | 2.093 | 1.427 |
| CS + BP | 10 | 1.545 | 1.503 | 2.069 | 1.406 |
| SEM | 0.0157 | 0.0158 | 0.0208 | 0.0112 | |
| p-value | 0.637 | 0.622 | 0.929 | 0.260 | |
| Two-way ANOVA with PC group removed | |||||
| Main effect of CS | |||||
| Without CS | 20 | 1.530 | 1.488 | 2.089 | 1.431 |
| With CS | 20 | 1.534 | 1.492 | 2.074 | 1.424 |
| SEM | 0.0116 | 0.0116 | 0.0149 | 0.0081 | |
| Main effect of BP | |||||
| Without BP | 20 | 1.520 | 1.478 | 2.082 | 1.438 |
| With BP | 20 | 1.544 | 1.502 | 2.081 | 1.417 |
| SEM | 0.0116 | 0.0116 | 0.0149 | 0.0081 | |
| p-values | |||||
| CS | 0.808 | 0.798 | 0.494 | 0.547 | |
| BP | 0.158 | 0.154 | 0.974 | 0.078 | |
| CS × BP | 0.879 | 0.892 | 0.659 | 0.255 | |
| Item | n | 47 d BW, kg | BWG, kg | FI, kg | FCR, kg:kg |
|---|---|---|---|---|---|
| One-way ANOVA | |||||
| NC | 10 | 2.907 | 2.865 | 4.995 | 1.805 |
| PC | 10 | 2.949 | 2.907 | 4.993 | 1.806 |
| CS | 10 | 2.952 | 2.910 | 4.961 | 1.809 |
| BP | 10 | 2.961 | 2.919 | 5.104 | 1.814 |
| CS + BP | 10 | 2.971 | 2.929 | 5.033 | 1.799 |
| SEM | 0.0406 | 0.0406 | 0.1005 | 0.0144 | |
| p-value | 0.834 | 0.832 | 0.877 | 0.960 | |
| Two-way ANOVA with PC group removed | |||||
| Main effect of CS | |||||
| Without CS | 20 | 2.934 | 2.892 | 5.048 | 1.809 |
| With CS | 20 | 2.962 | 2.920 | 4.999 | 1.805 |
| SEM | 0.0300 | 0.0300 | 0.0724 | 0.0098 | |
| Main effect of BP | |||||
| Without BP | 20 | 2.930 | 2.888 | 4.977 | 1.807 |
| With BP | 20 | 2.966 | 2.924 | 5.069 | 1.807 |
| SEM | 0.0300 | 0.0300 | 0.0723 | 0.0098 | |
| p-values | |||||
| CS | 0.526 | 0.521 | 0.635 | 0.724 | |
| BP | 0.394 | 0.392 | 0.370 | 0.993 | |
| CS × BP | 0.682 | 0.688 | 0.867 | 0.495 | |
| Item | n | Hot Carcass | Hot Fat Pad | Chilled Carcass | |||
|---|---|---|---|---|---|---|---|
| Weight, g | Yield, % | Weight, g | Yield, % | Weight, g | Yield, % | ||
| One-way ANOVA | |||||||
| NC | 10 | 2,214 | 76.5 | 39.5 | 1.37 | 2,265 | 78.3 |
| PC | 10 | 2,306 | 76.8 | 42.4 | 1.41 | 2,359 | 78.5 |
| CS | 10 | 2,238 | 76.3 | 41.9 | 1.43 | 2,292 | 78.1 |
| BP | 10 | 2,273 | 76.7 | 40 | 1.35 | 2,328 | 78.5 |
| CS + BP | 10 | 2,289 | 76.4 | 42.4 | 1.42 | 2,337 | 78 |
| SEM | 28.2 | 0.2 | 1.93 | 0.067 | 29.1 | 0.2 | |
| p-value | 0.158 | 0.456 | 0.728 | 0.898 | 0.177 | 0.291 | |
| Two-way ANOVA with PC group removed | |||||||
| Main effect of CS | |||||||
| Without CS | 20 | 2,243 | 76.6 | 39.8 | 1.36 | 2,296 | 78.4 |
| With CS | 20 | 2,263 | 76.3 | 43 | 1.42 | 2,315 | 78.1 |
| SEM | 20.3 | 0.14 | 1.19 | 0.045 | 20.9 | 0.14 | |
| Main effect of BP | |||||||
| Without BP | 20 | 2,226 | 76.39 | 40.7 | 1.4 | 2,278 | 78.2 |
| With BP | 20 | 2,281 | 76.53 | 42.1 | 1.38 | 2,333 | 78.3 |
| SEM | 20.3 | 0.139 | 1.19 | 0.045 | 20.9 | 0.14 | |
| p-values | |||||||
| CS | 0.49 | 0.239 | 0.058 | 0.317 | 0.543 | 0.128 | |
| BP | 0.065 | 0.492 | 0.424 | 0.789 | 0.076 | 0.678 | |
| CS × BP | 0.892 | 0.948 | 0.578 | 0.987 | 0.776 | 0.420 | |
| Item | n | Breast | Tenders | Total Breast | Wings | Leg Quarters | |||||
|---|---|---|---|---|---|---|---|---|---|---|---|
| Weight, g | Yield, % | Weight, g | Yield, % | Weight, g | Yield, % | Weight, g | Yield, % | Weight, g | Yield, % | ||
| One-way ANOVA | |||||||||||
| NC | 10 | 675 b | 23.3 b | 143 | 5.0 | 818 b | 28.3 ab | 219 | 7.6 | 622 | 21.7 |
| PC | 10 | 731 a | 24.3 a | 147 | 4.9 | 878 a | 29.2 a | 228 | 7.6 | 635 | 21.1 |
| CS | 10 | 680 b | 23.3 b | 143 | 4.9 | 822 b | 28.2 b | 222 | 7.6 | 620 | 21.2 |
| BP | 10 | 712 ab | 24.0 ab | 145 | 4.9 | 857 ab | 28.9 ab | 225 | 7.6 | 630 | 21.2 |
| CS + BP | 10 | 707 ab | 23.3 ab | 149 | 5.0 | 855 ab | 28.5 ab | 227 | 7.6 | 643 | 21.5 |
| SEM | 10.2 | 0.23 | 2.2 | 0.05 | 12.1 | 0.24 | 3.3 | 0.08 | 9.2 | 0.171 | |
| p-value | 0.002 | 0.014 | 0.347 | 0.798 | 0.003 | 0.023 | 0.237 | 0.993 | 0.398 | 0.117 | |
| Two-way ANOVA with PC group removed | |||||||||||
| Main effect of CS | |||||||||||
| Without CS | 20 | 693 | 23.7 | 144 | 4.9 | 838 | 28.6 | 222 | 7.6 | 626 | 21.5 |
| With CS | 20 | 693 | 23.5 | 146 | 4.9 | 839 | 28.4 | 224 | 7.6 | 632 | 21.3 |
| SEM | 7.4 | 0.147 | 1.6 | 0.04 | 8.5 | 0.152 | 2.3 | 0.054 | 5.95 | 0.111 | |
| Main effect of BP | |||||||||||
| Without BP | 20 | 678 a | 23.3 a | 143 | 4.9 | 820 a | 28.2 a | 220 | 7.6 | 621 | 21.4 |
| With BP | 20 | 709 b | 23.8 b | 146 | 4.9 | 856 b | 28.7 b | 226 | 7.6 | 636 | 21.3 |
| SEM | 7.41 | 0.15 | 1.60 | 0.04 | 8.5 | 0.152 | 2.3 | 0.054 | 6.0 | 0.111 | |
| p-values | |||||||||||
| CS | 0.999 | 0.339 | 0.454 | 0.985 | 0.928 | 0.340 | 0.473 | 0.891 | 0.495 | 0.368 | |
| BP | 0.004 | 0.030 | 0.134 | 0.954 | 0.005 | 0.032 | 0.071 | 0.709 | 0.081 | 0.648 | |
| CS × BP | 0.608 | 0.294 | 0.467 | 0.219 | 0.796 | 0.493 | 0.852 | 0.943 | 0.386 | 0.020 | |
| Item | n | Villi Height | Crypt Depth | Ratio 2 | Apical Villi Width | Basal Villi Width | Surface Area |
|---|---|---|---|---|---|---|---|
| One-way ANOVA | |||||||
| NC | 10 | 593 | 130 | 4.7 | 95 | 123 | 64,328 |
| PC | 10 | 597 | 134 | 4.6 | 95 | 123 | 64,997 |
| CS | 10 | 586 | 145 | 4.3 | 106 | 124 | 67,455 |
| BP | 10 | 596 | 156 | 4.0 | 106 | 125 | 69,120 |
| CS + BP | 10 | 608 | 141 | 4.6 | 101 | 122 | 67,808 |
| SEM | 18.3 | 7.5 | 0.23 | 4.1 | 5.5 | 3,294 | |
| p-value | 0.926 | 0.129 | 0.291 | 0.113 | 0.998 | 0.808 | |
| Two-way ANOVA with PC group removed | |||||||
| Main effect of CS | |||||||
| Without CS | 20 | 588 | 143 | 4.4 | 99 | 122 | 66,327 |
| With CS | 20 | 593 | 143 | 4.4 | 105 | 124 | 67,944 |
| SEM | 11.3 | 5.6 | 0.14 | 3.1 | 3.63 | 2,353 | |
| Main effect of BP | |||||||
| Without BP | 20 | 589 | 137 | 4.5 | 100 | 123 | 65,862 |
| With BP | 20 | 592 | 149 | 4.3 | 103 | 123 | 68,409 |
| SEM | 11.1 | 5.5 | 0.13 | 3.1 | 3.56 | 2,305 | |
| p-values | |||||||
| CS | 0.761 | 0.996 | 0.959 | 0.173 | 0.721 | 0.616 | |
| BP | 0.833 | 0.136 | 0.272 | 0.550 | 0.983 | 0.432 | |
| CS × BP | 0.452 | 0.051 | 0.052 | 0.216 | 0.818 | 0.640 | |
| Item | n | Villi Height | Crypt Depth | Ratio 2 | Apical Villi Width | Basal Villi Width | Surface Area |
|---|---|---|---|---|---|---|---|
| One-way ANOVA | |||||||
| NC | 10 | 593 | 130 | 4.7 | 95 | 123 | 64,410 |
| PC | 10 | 598 | 135 | 4.6 | 95 | 123 | 65,078 |
| CS | 10 | 586 | 146 | 4.3 | 106 | 124 | 67,536 |
| BP | 10 | 586 | 154 | 4.1 | 105 | 123 | 67,055 |
| CS + BP | 10 | 608 | 141 | 4.5 | 101 | 122 | 67,889 |
| SEM | 17.7 | 7.5 | 0.23 | 3.9 | 5.3 | 3,224 | |
| p-value | 0.890 | 0.159 | 0.287 | 0.119 | 1.000 | 0.919 | |
| Two-way ANOVA with PC group removed | |||||||
| Main effect of CS | |||||||
| Without CS | 20 | 593 | 143 | 4.4 | 99 | 121 | 65,332 |
| With CS | 20 | 593 | 144 | 4.4 | 105 | 124 | 68,002 |
| SEM | 12.5 | 5.4 | 0.13 | 3.0 | 3.6 | 2,372 | |
| Main effect of BP | |||||||
| Without BP | 20 | 589 | 138 | 4.5 | 100.6 | 123 | 65,973 |
| With BP | 20 | 597 | 148 | 4.3 | 102.9 | 122 | 67,361 |
| SEM | 12.2 | 5.24 | 0.13 | 2.91 | 3.5 | 2,316 | |
| p-values | |||||||
| CS | 0.984 | 0.893 | 0.915 | 0.146 | 0.558 | 0.421 | |
| BP | 0.676 | 0.164 | 0.280 | 0.580 | 0.818 | 0.673 | |
| CS × BP | 0.680 | 0.061 | 0.051 | 0.223 | 0.647 | 0.890 | |
Disclaimer/Publisher’s Note: The statements, opinions and data contained in all publications are solely those of the individual author(s) and contributor(s) and not of MDPI and/or the editor(s). MDPI and/or the editor(s) disclaim responsibility for any injury to people or property resulting from any ideas, methods, instructions or products referred to in the content. |
© 2023 by the authors. Licensee MDPI, Basel, Switzerland. This article is an open access article distributed under the terms and conditions of the Creative Commons Attribution (CC BY) license (https://creativecommons.org/licenses/by/4.0/).
Share and Cite
Adhikari, B.; Myers, A.G.; Ruan, C.; Kwon, Y.M.; Rochell, S.J. Individual and Combined Effects of a Direct-Fed Microbial and Calcium Butyrate on Growth Performance, Intestinal Histology and Gut Microbiota of Broiler Chickens. Poultry 2023, 2, 63-81. https://doi.org/10.3390/poultry2010008
Adhikari B, Myers AG, Ruan C, Kwon YM, Rochell SJ. Individual and Combined Effects of a Direct-Fed Microbial and Calcium Butyrate on Growth Performance, Intestinal Histology and Gut Microbiota of Broiler Chickens. Poultry. 2023; 2(1):63-81. https://doi.org/10.3390/poultry2010008
Chicago/Turabian StyleAdhikari, Bishnu, Alyson G. Myers, Chuanmin Ruan, Young Min Kwon, and Samuel J. Rochell. 2023. "Individual and Combined Effects of a Direct-Fed Microbial and Calcium Butyrate on Growth Performance, Intestinal Histology and Gut Microbiota of Broiler Chickens" Poultry 2, no. 1: 63-81. https://doi.org/10.3390/poultry2010008
APA StyleAdhikari, B., Myers, A. G., Ruan, C., Kwon, Y. M., & Rochell, S. J. (2023). Individual and Combined Effects of a Direct-Fed Microbial and Calcium Butyrate on Growth Performance, Intestinal Histology and Gut Microbiota of Broiler Chickens. Poultry, 2(1), 63-81. https://doi.org/10.3390/poultry2010008


