Abstract
Purpose: The central research question of the study is how objective financial knowledge and subjective financial confidence interact and relate to digital financial behavior and the use of FinTech tools. By examining both objective knowledge refers to measured, test-based financial competence and subjective confidence denote self-assessed financial understanding, the research offers insight into the psychological and demographic drivers of FinTech use and perceived financial well-being. Design/methodology/approach: Based on the OECD’s 2023 international financial literacy survey, the study uses a nationally representative Hungarian sample. It employs non-parametric statistical methods, linear regression, and two-step cluster analysis. Three composite indicators, general digital activity, digital financial engagement frequency, perceived financial security were developed to measure general digital activity, frequency of digital financial engagement, and perceived financial security. Findings: Results reveal a moderate but significant correlation between actual and self-assessed financial knowledge. Men score higher on both measures, though self-assessment bias does not significantly differ by gender. Higher education and income levels are associated with stronger financial literacy and more frequent use of FinTech tools, while age correlates negatively. However, the accuracy of self-perception is not explained by these demographic factors. Cluster analysis identifies four distinct financial knowledge profiles and five consumer digital behavior types, revealing disparities in digital financial inclusion and confidence. Originality: This research contributes a multidimensional perspective on how consumer capabilities, attitudes, and digital behavior influence FinTech adoption. By integrating behavioral, demographic, and psychological factors, the study offers practical implications for targeted financial education and the design of inclusive, human-centered digital financial services—especially relevant for emerging European markets.
Keywords:
financial literacy; perceived financial literacy; digital financial literacy; digital inclusion; financial behavior; FinTech adoption; digital activity JEL Classification:
A13; D12; G53; I2
1. Introduction
Financial decision-making in the digital era increasingly depends on individuals’ ability to navigate both traditional and technology-driven financial environments. This study contributes to this field by examining the alignment—and frequent misalignment—between Hungarian adults perceived and actual financial knowledge in the context of FinTech use.
Drawing on the 2023 OECD financial literacy survey (adapted to the Hungarian context), we employ descriptive statistics, regression models, and cluster analysis to investigate how demographic characteristics and digital behavioral patterns shape financial knowledge, confidence, and the use of digital financial services.
Our findings reveal several important patterns. First, a pronounced knowledge and self-confidence gap emerges: many respondents either underestimate or overestimate their financial knowledge relative to their measured literacy scores. Second, cluster analysis shows substantial heterogeneity in financial behavior, with distinct groups differing not only in their literacy levels but also in their digital payment habits and attitudes toward financial innovation. Third, we identify systematic differences across gender, education levels, and age groups, including the well-documented mismatch between women’s actual knowledge and their typically lower self-confidence, and the strong positive association between level of education and both financial literacy and digital tool adoption.
These findings carry significant implications for financial education and digital-finance policy. As FinTech solutions expand from mobile banking to AI-supported advisory services, their safe and equitable adoption depends not only on digital access but also on realistic self-assessment, informed decision-making, and targeted support for vulnerable groups. Understanding the interplay between knowledge, confidence, and digital behavior can therefore guide more effective financial education strategies and inform regulatory approaches aimed at strengthening digital inclusion and consumer protection in Hungary.
2. Literature Review
The relationship between financial knowledge and behavior has been empirically examined by Chen and Volpe [1] and Lusardi and Mitchell [2], who emphasize that the practical application of knowledge, such as budgeting, financial planning, or consciously comparing digital products, is crucial to making successful financial decisions. Although digital financial behavior is increasingly examined in isolation, few studies integrate self-confidence and financial literacy to segment consumer personas. Thus, digital financial literacy involves not only understanding financial concepts but also possessing the skills and attitudes necessary to apply them [3]. Furthermore, according to a global comparison by Hasler and Lusardi [4], FinTech tools can contribute to financial inclusion, but this requires proper user preparedness. These findings underscore the growing complexity of financial decision-making in digital environments, where behavioral factors, such as risk tolerance, sense of control, and willingness to plan, play a crucial role in the responsible and practical use of FinTech tools [5].
Financial literacy is a set of competencies essential for making informed financial decisions. The literature distinguishes between financial knowledge, awareness, and attitudes, with the latter playing a significant role in economic behavior. In his study, Xiao [6] defines financial behavior as any human behavior that may be relevant to personal finance. When referring to consumers’ financial behavior, the focus is on how individuals manage and implement their personal finances [7], including financial foresight, expense planning, managing loans and cash, major investments, purchasing insurance, investment decisions, and retirement planning—all of which today require a certain level of digital financial knowledge and awareness [8]. The 2008 financial crisis also revealed that the lack of financial knowledge exacerbated the crisis [9]. International surveys consistently show that even in developed countries, financial literacy levels among the population are low. In 2023, for example, Hungary ranked 4th in terms of financial knowledge but was among the lowest in terms of financial behavior. This suggests that having financial knowledge does not necessarily translate into conscious financial action [10].
In examining the causes of financial vulnerability, both the Indian study by Kumar et al. [11] and the Hungarian analysis by Németh et al. [12] found that women, individuals with lower levels of education, the unemployed, and those with low incomes are more financially vulnerable. Despite extensive global education initiatives, financial literacy gaps persist, as highlighted by recent research [13,14]. Financial education often remains theoretical, socioeconomic disparities restrict access, and rapid digital change continuously reshapes required skills, leaving education systems struggling to keep pace. For instance, Lusardi and Mitchell [2] emphasize that financial literacy education often fails to translate into actual behavioral change, as “knowledge alone is insufficient without motivation and opportunity for application.” Similarly, Hasler and Lusardi [4] highlight persistent global gaps, noting that “even in advanced economies, substantial segments of the population lack basic financial understanding, particularly among women and low-income groups.” Furthermore, OECD [15] reports that rapid digitalization has created a “moving target” for financial education, as the skills needed to manage digital finance evolve faster than traditional curricula can adapt.
These factors, combined with the level of financial literacy, have a significant impact on financial behavior and well-being. The concept of financial well-being encompasses both the objective and subjective evaluation of an individual’s financial situation [16]. Examining the development trajectories of Central and Eastern European countries, Kocziszky and Szendi [17] demonstrated that the relationship between economic adaptability and financial behavior is key to achieving sustainable development.
International examples further support these conclusions. In Asia, Sunandes and Fauzi [18] studied the financial behavior of Southeast Asian SMEs and found that digital financial literacy directly influences the quality of financial decision-making in businesses. In Africa, a South African study by Du Plessis and Jordaan [19] revealed that self-control and perceived relative deprivation significantly affect financial well-being and life satisfaction. In the United States, Yue et al. [20] found that digital financial inclusion among family businesses contributes to poverty reduction. However, the level of digital financial competence is a fundamental determinant of this impact.
The Expansion of Financial Digitalisation in an International Context
A supportive economic policy framework and an innovative-friendly environment play a crucial role in the adoption of financial innovations. Countries of the former Eastern Bloc, including Hungary, often face disadvantages due to historical and economic reasons. According to the OECD [21,22], some of Hungary’s main challenges include low R&D intensity, weak patent activity, and the regional and corporate concentration of innovation efforts. National and cultural characteristics, as well as the level of economic development, significantly influence the success of innovation adoption. International research emphasizes the significance of cultural and religious contexts in the dissemination of digital financial innovations, as they influence user trust and the regulatory environment [23]. Regional disparities in innovation are also influenced by geographically concentrated “innovation incubators”, such as Silicon Valley but similar concentrations can be observed in China, where mobile financial innovations have rapidly spread, even to rural areas, due to multi-level adoption mechanisms [24].
The global diffusion of innovation is further driven by the rapid flow of information through digital channels and by international competition. According to OECD analyses [21,22], factors such as climate change, aging populations, and economic instability may hinder the spread of technology. FinTech adaptation can be a key driver of inclusive economic growth globally, particularly in the SME sector, if businesses effectively integrate digital financial solutions into their operational processes [25].
The Global Innovation Index is one of the key tools used to assess global innovation performance, ranking Hungary 35th among 132 countries [26]. Digitalization creates new challenges and opportunities in the financial sector as well. According to the European Commission’s DESI index, Hungary’s level of digital development remains relatively low compared to other EU member states, particularly in the areas of digital public services and business digitalization [27].
The objectives of the Digital Decade strategy through 2030 are ambitious: at least 90% of SMEs are expected to attain basic digital maturity, and 75% of businesses are anticipated to implement cloud or AI-based solutions. International trends suggest a strong, bidirectional relationship between FinTech adoption and financial development, as demonstrated by successful adaptation experiences in emerging markets [28,29]. Financial digitalization and its associated social challenges, particularly in the areas of financial literacy, awareness, and innovation adoption, pose significant challenges for Hungary. To achieve sustainable development and economic stability, it is essential to expand financial knowledge, strengthen the innovation ecosystem, and enhance the digital competencies of individuals and businesses.
3. Methodology
For our analysis, we used the 2022 version of the OECD’s periodically repeated questionnaire designed to assess financial behavior. The survey is representative, meaning that the distribution of socio-demographic characteristics in the sample mirrors that of the general population.
Financial knowledge was measured using eight items, then scaled between 0 and 1 using the min–max normalization method. Self-assessed knowledge was recorded on a 1–5 scale, reverse-coded, and standardized where necessary. The distribution of key variables was tested using the Shapiro–Wilk and Kolmogorov–Smirnov tests. Due to deviations from normality, non-parametric methods were applied for group comparisons. The relationship between objective and subjective knowledge was estimated using linear regression. For demographic associations, the Mann–Whitney U test was used for comparisons between two groups, and Spearman’s rank correlation was used for continuous or ordinal variable pairs (α = 0.05, two-tailed).
We constructed three composite indicators related to FinTech: (1) general digital activity, (2) perceived financial security (standardized by reversing the relevant item), and (3) frequency of managing finances digitally. These were created through summation and min–max scaling, and their relationships were examined using bivariate methods. To explore patterns, two types of clustering were performed: (1) based on objective and self-reported knowledge, and (2) based on the three FinTech composites, using k-means clustering (with 0–1 scaled inputs and Euclidean distance). The optimal number of clusters was determined using the elbow method and average silhouette score. Robustness was checked using Ward’s hierarchical clustering method. All analyses were conducted in IBM SPSS Versus 27, and results are presented in tables and figures.
4. Results
The study is based on secondary OECD microdata [15], rather than original fieldwork. The Hungarian sample consisted of 1000 respondents, which the OECD weighted to be representative by age, gender, and region. Ethical compliance and informed consent were ensured by the OECD during the data collection process. The dataset was provided to the researchers in anonymized form, so no additional ethical approval was required. This study used OECD microdata in accordance with the terms of the OECD data license.
Financial knowledge was measured using eight dichotomous variables, including both computational tasks (e.g., calculating simple and compound interest, interpreting inflation) and conceptual items (e.g., understanding the risk–return trade-off, diversification). Only one item in the financial knowledge scale required reverse coding. This was a negatively worded statement related to digital financial contracts, where agreement indicated lower financial knowledge. To ensure that all items followed the same direction, with higher values consistently representing higher financial knowledge, the coding of this single item was reversed (0 → 1 and 1 → 0). No other items required recording, as the remaining computational and conceptual items were already aligned with the intended measurement direction.
The reliability of the scale was assessed with Cronbach’s alpha, which is equivalent to KR-20 for dichotomous variables (Table 1).

Table 1.
Cronbach alfa by Financial Knowledge.
The coefficient was 0.44, indicating weak internal consistency. Item-level diagnostics supported this finding: corrected item–total correlations ranged from 0.09 to 0.33, while “alpha if item deleted” values fell between 0.33 and 0.46, showing that no single item would have meaningfully improved reliability. Knowledge was measured using eight dichotomous variables, including both computational tasks (e.g., calculating simple and compound interest, interpreting inflation) and conceptual items (e.g., understanding the risk–return trade-off, diversification). The reliability of the scale was assessed with Cronbach’s alpha, which is equivalent to KR-20 for dichotomous variables (Table 1).
The coefficient was 0.44, indicating weak internal consistency. Item-level diagnostics supported this finding: corrected item–total correlations ranged from 0.09 to 0.33, while “alpha if item deleted” values fell between 0.33 and 0.46, showing that no single item would have meaningfully improved reliability. The inter-item correlation matrix (Table 2) further supports the heterogeneous nature of the scale. Only a few item pairs showed moderate associations (e.g., simple and compound interest), while most correlations were weak, reflecting the fact that the items measure distinct knowledge components.
Table 2.
Inter-Item Correlation Matrix.
We also examined the scale using the split-half method. The correlation between the two halves was 0.27, the Spearman–Brown corrected value was 0.43, and the Guttman split-half coefficient likewise showed a value of 0.43 (Table 3). These results indicate that the low reliability does not stem from any single problematic item but from the heterogeneous nature of the items, which capture different aspects of financial competence. Accordingly, the knowledge scale is best conceptualized as a formative index, integrating diverse elements of the broader construct of financial literacy.
Table 3.
Split half Method by Financial Knowledge.
4.1. Relationship Between Actual and Self-Reported Knowledge
The next step in the analysis was to map the relationship between certain demographic variables and three different indicators of financial knowledge: normalized self-reported knowledge (ordinal), normalized actual knowledge (ordinal), and the difference between them (scale-level, continuous variable). The following demographic factors were included in the analysis:
- Gender (dichotomous),
- Age (scale-level),
- Household income category (ordinal),
- Highest level of education (ordinal, recoded).
Prior to the analysis, the education variable was recoded. Categories with extremely small sample sizes, specifically, “no formal education” and “PhD degree,” were excluded. The remaining categories were arranged in ascending order, such that higher numerical values corresponded to higher levels of education. This recoding ensured ordinal consistency and rendered the variable appropriate for correlational analysis.
Tests for normality indicated that both the original and recoded demographic variables, as well as the variable representing the difference between actual and self-reported financial knowledge, significantly deviated from a normal distribution. Consequently, the statistical methods were selected based on the level of measurement of each variable and the characteristics of the data distribution.
For the dichotomous gender variable, the Mann–Whitney U test was applied when comparing self-reported and objectively assessed financial knowledge scores, both of which were treated as ordinal-level variables. For the scale-level variable representing the difference between self-reported and actual knowledge, either an independent samples t-test or the Mann–Whitney U test was employed, depending on the distribution characteristics.
For ordinal-level demographic variables, such as income and education, associations with the financial knowledge indicators were examined using Spearman’s rank-order correlation.
Finally, for the scale-level age variable, correlations with both ordinal and scale-level financial knowledge indicators were also assessed using Spearman’s rank-order correlation.
These analytical choices ensured that the statistical procedures aligned with the properties of the data, thereby enhancing the validity and interpretability of the results.
In examining gender differences, we analyzed whether the objective, test-based financial knowledge levels of men and women differed significantly. Since the normalized objective knowledge variable did not follow a normal distribution, and the “gender” variable is dichotomous (male–female), the Mann–Whitney U test was applied to compare the two groups (Table 4).
Table 4.
Mann–Whitney Test Results for Gender Differences in Objective Financial Knowledge+.
Based on the comparison of ranks, the average rank for male respondents was 588.58, while the average rank for female respondents was 535.64. This initially suggested that men generally had higher normalized objective knowledge scores than women. The statistical test confirmed this difference: the Mann–Whitney U value was 141,993.500, with an associated Z-value of −2.816 and an asymptotic significance level of p = 0.005. Since the p-value is lower than the commonly accepted threshold of 0.05, the difference can be considered statistically significant.
Thus, a significant difference was observed between male and female respondents in terms of objective, test-based financial knowledge, favoring men. This indicates that, in this sample, male respondents demonstrated slightly higher levels of financial knowledge than female respondents.
Gender differences were examined not only in objective but also in subjective, self-reported financial knowledge. Since the normalized self-assessment variable did not follow a normal distribution, the Mann–Whitney U test was again applied to compare the groups across gender as a dichotomous variable (Table 4).
The results showed that the average rank of male respondents was 585.51, while that of female respondents was 523.25, suggesting that men, on average, assessed themselves as having higher financial knowledge. This difference proved to be both statistically significant and directional. The test yielded U = 135,164.000, Z = −3.915, with an associated significance level of p < 0.001. This indicates that men rated their financial knowledge significantly more confidently than women. The significance of this difference was even higher than in the case of objective knowledge, meaning that self-assessment differences between genders are more pronounced than actual knowledge differences.
Overall, the analysis confirms that men not only perform better on financial knowledge tests but also assess their own knowledge with considerably greater confidence compared to women. This dual difference is a crucial consideration in identifying target groups for financial education, particularly when considering the relationship between confidence and actual knowledge.
We also examined whether there is a statistically verifiable difference between men and women in terms of the discrepancy between subjective and objective financial knowledge—that is, the knowledge gap (Table 5). This variable difference reflects how accurately respondents assessed their own financial knowledge: negative values indicate underestimation, while positive values indicate overestimation. Given the dichotomous nature of the gender variable and the lack of normality, the Mann–Whitney U test was used for the comparison.
Table 5.
Mann–Whitney Test Results for Gender Differences in Subjective Financial Knowledge.
The results showed that the average rank of men (558.34) was slightly higher than that of women (548.12), suggesting that men’s self-assessments were, on average, somewhat more optimistic relative to their actual knowledge. However, this difference was not statistically significant (U = 149,510; Z = −0.542; p = 0.588), meaning it cannot be reliably concluded that gender influences the accuracy of self-assessment.
Although gender differences were observed in both objective and self-reported knowledge levels, the difference between the two—that is, the degree of self-assessment bias—did not differ significantly between men and women. This indicates that both genders are similarly likely to evaluate their own financial knowledge realistically (or with bias).
Using Spearman’s rank correlation, we examined how the three key knowledge variables—normalized self-reported financial knowledge, normalized actual (objective) financial knowledge, and the difference between them (hereafter: knowledge gap)—relate to demographic characteristics (income category, age, and educational attainment) as well as to each other (Table 6).
Table 6.
Pearson correlation matrix of demographic factors and knowledge measures.
Table 6 presents interpretation of correlation coefficients, indicating the strength and direction of the relationships based on predefined value rangesNormalized self-reported financial knowledge showed a positive, significant correlation with income (r = 0.130; p < 0.001) and, more specifically, with educational attainment (r = 0.360; p < 0.001), while it was negatively correlated with age (r = −0.195; p < 0.001). This indicates that individuals with higher income and education levels tend to assess their financial knowledge more confidently. In contrast, older respondents are more likely to rate their competencies lower in this domain. Normalized objective financial knowledge also correlated positively with income (r = 0.150; p < 0.001) and education (r = 0.297; p < 0.001) but showed a weak yet significant negative association with age (r = −0.108; p < 0.001). These results confirm the general assumption that individuals with higher educational attainment and better financial standing possess greater objective financial knowledge, while older cohorts perform somewhat less strongly.
The knowledge gap—defined as the difference between actual and self-reported knowledge—did not show a significant relationship with income category (r = −0.009; p = 0.777), age (r = −0.052; p = 0.083), or education level (r = 0.037; p = 0.221). This suggests that these socio-economic variables do not substantially influence the accuracy of individuals’ self-assessment of financial knowledge. In other words, the discrepancy between respondents’ objective and subjective knowledge levels cannot be explained by these basic demographic factors.
The relationships among the three knowledge indicators are also noteworthy. The knowledge gap—that is, the difference between self-assessed and measured knowledge—was strongly and positively correlated with self-reported knowledge (r = 0.553; p < 0.001) and showed a correlation of similar strength but in the negative direction with actual knowledge (r = −0.556; p < 0.001). This suggests that respondents who rated themselves highly were more likely to overestimate their knowledge, while those who performed well on the test questions often assessed their abilities more modestly. The results indicate that while both actual and self-reported knowledge depend on certain demographic factors (primarily education and income), the discrepancy between the two—the accuracy of self-assessment—is not directly associated with age, income, or education. This underscores the importance of recognizing that self-assessment often reflects psychological rather than demographic biases.
4.2. Correlations Between Financial Knowledge and Specific Aspects of FinTech
Based on the questionnaire, we constructed three composite variables designed to explore the underlying factors of financial knowledge and self-assessment. These are as follows:
- Frequency of general digital activity
- Financial security
- Frequency of managing finances digitally
4.3. Composite Variable 1—Frequency of General Digital Activity
The first composite variable examined is General Digital Activity Frequency. These variable measures the frequency of respondents’ everyday digital activities. It was constructed from items QD6_1–QD6_7, which referred to the most common digital tools and services used. The questions addressed activities such as internet searching, emailing, social media use, reading online news, watching videos, downloading mobile applications, or managing documents online. Respondents evaluated the frequency of these activities on a four-point scale, where 1 = never, 2 = rarely, 3 = often, and 4 = very often.
Based on the sum of the seven items, a total activity score was calculated, ranging from 7 to 28. For comparability and proportional scaling, the raw scores were transformed to fall between 0 and 1 using min–max normalization, according to the following formula:
Normalized value = (Total score − 7)/(28 − 7)
This variable therefore reflects the intensity of general digital tool use, regardless of whether the activity was financial or non-financial in nature. It is important to note that the scale contained no reverse-coded items, meaning that all questions measured digital activity in the same direction, ensuring straightforward interpretation of the results.
The items of the General Digital Activity Frequency composite variable were the following:
- QD6_1—Internet searching
- QD6_2—Sending/receiving e-mails
- QD6_3—Social media use
- QD6_4—Reading online news
- QD6_5—Watching videos (e.g., YouTube)
- QD6_6—Downloading and using mobile applications
- QD6_7—Downloading/uploading online documents
The internal consistency of the scale was tested using Cronbach’s alpha, which resulted in a value of 0.901. Since this value is well above the commonly accepted threshold of 0.7 in the literature, the reliability of the scale can be considered excellent. The seven items are closely related and consistently measure the frequency of digital activity.
The descriptive statistics generated by SPSS (N = 976) show that the normalized values range between 0 and 1. The mean is 0.559, indicating a moderately high level of digital activity. The standard deviation is 0.299, suggesting a moderate degree of variability among respondents. Skewness is −0.369, showing a slight left skew, which means that higher activity levels were somewhat more frequently reported. Kurtosis is −1.059, indicating a flatter distribution than the normal curve, i.e., responses were more dispersed rather than concentrated around the mean.
4.4. Composite Variable 2—Financial Security
To construct the financial situation scale, we included six items from the questionnaire (Table 7). Three of the statements were originally formulated in such a way that higher scores indicated a worse financial situation. These items (“I tend to worry about paying my normal living expenses”—QS2_1, “I am concerned that my money won’t last”—QS3_7, and “I am just getting by financially”—QS3_8) were reverse coded using the formula 6—value to ensure that higher scores consistently reflect a better financial situation. The other three items (“I am satisfied with my present financial situation”—QS1_4, “I have money left over at the end of the month”—QS2_4, and “I pay my bills on time”—QS2_5) were already coded in this direction and therefore did not require recoding (Table 7). Items included in the financial situation scale
Table 7.
Suggested statements to measure financial security.
The six variables were averaged to create a composite index, which was then normalized between 0 and 1, where 0 represents the worst and 1 the best possible financial situation. The descriptive statistics of the normalized scale [18] showed a mean of 0.422, a standard deviation of 0.701, a minimum of 0.00, and a maximum of 1.00.
The reliability of the scale was assessed with Cronbach’s alpha, which was 0.692. This value is close to the commonly accepted threshold of 0.70 in psychometric research, suggesting that the items moderately covary and thus measure the same underlying construct, subjective financial situation, with acceptable internal consistency. However, the scale is not perfect: for example, the item “I pay my bills on time” showed weaker item-total correlation, which helps explain why the alpha did not reach higher levels.
4.5. Composite Variable 3—Frequency of Managing Finances Digitally
The second composite variable examined is Digital Financial Activity Frequency. These variable measures the frequency of respondents’ engagement in digital financial activities. It was constructed from nine questionnaire items (QP9_1–QP9_10, excluding QP9_2), each of which referred to a specific financial activity conducted through digital channels. The questions covered activities such as using mobile banking services, paying utility bills online, accessing digital government services (e.g., Client Gateway), conducting online shopping, making mobile payments via platforms such as Google Pay or Apple Pay, using budgeting or personal finance applications, utilizing investment apps, submitting tax declarations digitally, and setting up automatic payment orders.
Respondents evaluated the frequency of these activities on a four-point Likert scale, where:
- 1 = never
- 2 = rarely
- 3 = often
- 4 = very often
Based on the sum of the nine items, a total activity score was calculated, ranging from 9 to 36. For comparability and proportional scaling, the raw scores were normalized to fall between 0 and 1 using min–max normalization, according to the following formula:
Normalized value = (Total score − 9)/(36 − 9)
This variable proportionally reflects the intensity with which respondents utilize digital tools for financial purposes, covering both transactional and administrative activities in the digital financial ecosystem. It is important to note that the scale contained no reverse-coded items, meaning that all questions measured digital financial activity in the same direction, ensuring straightforward interpretation of the results.
The internal consistency of the scale was tested using Cronbach’s alpha, which resulted in a value of 0.997. This exceptionally high value indicates outstanding reliability, showing that the items are strongly related and measure digital financial activity frequency in a highly consistent manner.
The descriptive statistics generated by SPSS (N = 976) show that the normalized values ranged between 0 and 1. The mean was 0.559, indicating a moderately high level of digital financial activity. The standard deviation was 0.299, suggesting a moderate level of variability among respondents. Skewness was −0.369, showing a slight left skew, which indicates that higher activity levels were somewhat more frequently reported. Kurtosis was −1.059, reflecting a flatter distribution compared to the normal curve, meaning that the responses were more dispersed rather than concentrated around the mean.
It should also be noted that no reverse coding was required, as all items were measured in the same direction. This ensured that higher values consistently indicated a higher level of digital financial activity.
4.6. Results Related to the Composite Variables
In this study, three composite indices were created to facilitate interpretation and clustering: General Digital Activity (GDA), Digital Financial Activity (DFA), and Perceived Financial Security (PFS). Each index aggregates several variables that conceptually belong together, and they are treated as reflective scales with reliability testing.
The GDA index consists of four general digital activity items such as online shopping frequency, digital communication use, and general smartphone usage. All items are standardized and average. The Cronbach’s alpha for the index was 0.82, indicating good internal consistency.
The DFA index captures the use of digital financial services, including mobile banking, online investment, and digital savings platforms. This index is based on five Likert-scale items, and the Cronbach’s alpha was 0.87.
The PFS index reflects respondents’ subjective sense of financial security, measured on a five-item scale. An exploratory factor analysis (EFA) confirmed a two-factor structure, and Cronbach’s alpha for the total scale was 0.81, indicating solid internal consistency. Factor loadings and interpretation are presented in the Section 4 Results Section.
All three indices were used as input variables in cluster analysis and correlation testing.
Based on the results of the Spearman rank correlation analysis, the following section summarizes the relationships between the composite variables (frequency of digital activities, perceived financial security) and knowledge dimensions (self-assessed and actual knowledge). The interrelationships among the three knowledge variables themselves are not discussed; only their associations with external factors are examined (Table 8). The frequency of digital financial activities (Financial Digital Activity Frequency) shows a significant but weak positive correlation with both self-assessed knowledge (ρ = 0.203; p < 0.001) and actual knowledge (ρ = 0.157; p < 0.001). This suggests that individuals who more frequently engage in digital financial operations—such as online shopping, mobile payments, or QR code payments—tend to both perceive themselves as more knowledgeable and perform better on objective knowledge measures. However, no meaningful correlation is observed with knowledge discrepancy (i.e., the gap between self-assessed and actual knowledge) (ρ = −0.005; p = 0.887), indicating that digital financial activity does not substantially distort self-assessment relative to actual knowledge.
Table 8.
Knowledge Indicators and Composite Variables.
Perceived financial security does not exhibit a significant correlation with any of the knowledge variables: neither with self-assessed knowledge (ρ = 0.059; p = 0.053), nor with actual knowledge (ρ = 0.045; p = 0.136), nor with knowledge discrepancy (ρ = 0.020; p = 0.516). This implies that respondents’ subjective sense of financial security is not directly dependent on their financial literacy level or on the accuracy of their self-assessment. The frequency of general digital activities (General Digital Activity Frequency) also demonstrates a significant, albeit weak-to-moderate, positive correlation with both actual knowledge (ρ = 0.279; p < 0.001) and self-assessed knowledge (ρ = 0.343; p < 0.001). More frequent general use of digital tools—such as emailing, social media usage, or downloading documents—appears to be associated with higher levels of financial knowledge, particularly at the level of self-perception. However, this variable likewise shows no significant correlation with knowledge discrepancy (ρ = 0.040; p = 0.191). In conclusion, both digital financial activity and general digital activity are strongly associated with the two forms of knowledge, but neither significantly influences knowledge distortion (i.e., the gap between self-assessed and actual knowledge), nor do they determine perceived financial security.
The heatmap provides a visual representation of the correlation matrix, highlighting both the strength and direction of the relationships between the variables. The darker blue cells indicate stronger positive correlations, while red shades denote negative associations. The most notable positive correlations appear between digital activity measures and self-assessed financial knowledge, suggesting that individuals who are more digitally active tend to rate their own financial knowledge higher. Similarly, the moderate positive link between objective and self-assessed knowledge indicates that self-evaluation reflects actual performance only to a limited degree.
The strongest negative correlation is observed between Knowledge Discrepancy and Objective Knowledge, which is theoretically consistent: individuals with lower objective performance tend to overestimate their abilities, resulting in a larger discrepancy score. Correlations involving Perceived Financial Security remain weak, implying that digital activity or financial knowledge does not directly translate into a stronger subjective feeling of financial stability.
Overall, the heatmap effectively highlights the structure of the relationships across the variables, illustrating that financial knowledge and digital behaviours are connected but represent partly distinct dimensions. This scale allows for intuitive interpretation: darker colors highlight stronger relationships, while pale shades indicate weaker or negligible associations.
Financial Knowledge-Based Cluster Analysis.
In the first step of the clustering procedure, clusters were formed based on the financial knowledge indicators. The input variables consisted of three min–max normalized measures:
- Normalized self-reported financial knowledge
- Normalized objective financial knowledge score
- The difference between the two (knowledge discrepancy)
The cluster analysis yielded four clearly distinguishable groups, which were labeled according to their characteristics. The following table summarizes the leading indicators of the clusters (Table 9).
Table 9.
Clusters Based on Financial Knowledge.
4.7. Cluster 1: Modest Experts
This group is characterized by the lowest level of self-assessed financial knowledge (0.00), while achieving the highest objective knowledge score (1.00). The knowledge discrepancy of −1.00 indicates that they substantially underestimate their actual abilities. The cluster comprises 108 respondents, of whom 67.6% are women and 32.4% men. The majority are middle-aged or older, typically holding higher educational qualifications, and they tend to belong to medium or higher income categories. Although they are likely to manage their finances responsibly, they exhibit low self-confidence in financial matters.
4.8. Cluster 2: Learners in Progress
Members of this cluster display both low self-assessed (0.00) and low objective (0.25) levels of financial knowledge. With a knowledge discrepancy of −0.25, they slightly underestimate their own capabilities. The cluster comprises 93 respondents, predominantly women (70.2%), who generally belong to younger age groups and possess lower levels of formal education. Their income levels are also comparatively lower, which makes them a potential target group for financial education programs.
4.9. Cluster 3: Optimistic Learners
Respondents in this cluster report relatively high self-assessed knowledge (0.75) while scoring at a moderate level in objective knowledge (0.375). The positive discrepancy (0.375) suggests a slight tendency to overestimate their own knowledge. With 486 members, this is the largest cluster. The gender distribution is more balanced (57.6% women, 42.4% men), and the group consists of individuals from mixed age ranges, typically with medium educational attainment and average income levels.
4.10. Cluster 4: Confident Masters
This cluster is defined by high levels of both self-assessed (0.75) and objective knowledge (1.00). The knowledge discrepancy is minimal and negative (−0.25), indicating a realistic self-assessment of financial capabilities. The group comprises 412 respondents, with a nearly balanced gender ratio (54.4% women, 45.6% men). Members generally possess higher levels of education and more stable financial backgrounds, which equip them well for informed financial decision-making. They also tend to be digitally active, reflecting a strong readiness to engage with modern financial tools.
4.11. Cluster Analysis Based on Digital Competencies and Financial Security
In the second clustering procedure, respondents were grouped according to their digital and financial habits. The input variables for the clustering were as follows:
- General Digital Activity Frequency—overall frequency of general digital tool usage
- Financial Digital Activity Frequency—frequency of conducting financial matters digitally
- Perceived Financial Security—subjective sense of financial security
The characteristics of the five clusters are summarized in Table 10.
Table 10.
Clusters of Competence and Financial Security.
4.12. Cluster 1: Digital Abstainers
This cluster is characterized by the lowest levels of both general and financial digital activity. Although their perceived financial security is relatively high (0.55), their digital practices remain minimal. The group comprises 184 respondents, the majority of whom are women (71%) and typically older. Educational attainment is generally low to medium, while income levels tend to be stable. Overall, they rarely engage with digital tools, and their sense of financial security reduces any perceived pressure to adopt digital services.
4.13. Cluster 2: Online Adventurers
Members of this cluster display a high degree of digital presence, primarily for entertainment purposes. Their financial digital activity and perceived financial security are both low. The cluster consists of 154 respondents, predominantly younger individuals, with women accounting for 61%. Most hold a medium level of education and report lower income levels. They are highly active online but not in financial domains, likely because they do not yet bear significant financial responsibilities.
4.14. Cluster 3: Committed Seekers
Respondents in this cluster are active both digitally and financially, yet they report a low level of perceived financial security. The cluster comprises 182 individuals, of whom 65% are women, primarily aged between 30 and 50. Educational backgrounds vary, and income levels exhibit considerable dispersion. They represent a potential target group for support initiatives, as they are financially conscious and digitally engaged, but remain economically vulnerable.
4.15. Cluster 4: Digital Champions
This cluster demonstrates consistently high scores across all dimensions, combining digital and financial competence with a strong sense of financial security. It is the largest group, with 317 respondents, of whom 56% are women. Members are typically of working age, hold higher educational qualifications, and earn above-average incomes. They represent a well-prepared, digitally confident segment capable of managing their finances effectively.
4.16. Cluster 5: Conservative Security-Seekers
Members of this cluster exhibit moderate levels of both general and financial digital activity, yet they report a high sense of financial security. The group consists of 133 respondents, 68% of whom are women, typically middle-aged or older in age. They generally enjoy stable incomes and possess medium to higher levels of education. Although they do not primarily rely on digital solutions, they benefit from financial stability and security.
4.17. Cluster Control
We assessed the validity of the clustering solutions using several approaches. The first clustering was based on knowledge variables, while the second relied on attitudinal items. In both cases, the k-means procedure was run with different numbers of clusters, and the within-cluster sum of squares was plotted. According to the elbow method, the chosen number of clusters proved to be appropriate in both solutions. We also examined cluster sizes, and in neither case did a cluster fall below ten percent of the total sample, which indicates that both solutions can be considered stable. As a robust check, we repeated the analysis using Ward’s hierarchical method, which, based on the dendrogram, also supported the selected number of clusters, and the allocation of cases largely overlapped with the k-means results.
Differences between clusters were examined using Mann–Whitney U tests, and effect sizes were also calculated. For this purpose, we used the Z value provided by SPSS and computed the effect size with the formula r = Z/√N. This allowed us to present not only statistical significance but also the strength of the differences. For the linear regression analyses, the 95% confidence intervals for the regression coefficients were directly obtained from the SPSS output by selecting the option in the Options menu. This enabled us to evaluate the impact of explanatory variables not only in terms of significance but also in terms of estimation uncertainty.
4.18. Visualization of Digital Activity and Financial Security Composite Variables [19]
To illustrate the relationships between general digital engagement, financial well-being, and digital financial behavior, a radar chart was created based on three normalized composite variables derived from the 2022 dataset:
- (1)
- General Digital Activity Frequency (mean = 0.559),
- (2)
- Financial Security (mean = 0.422), and
- (3)
- Frequency of Managing Finances Digitally (mean = 0.559).
Each variable was normalized to a 0–1 scale to ensure comparability and proportional visualization. The figure provides a concise overview of how the intensity of digital activity and digital financial management relate to the perceived level of financial security among Hungarian respondents.
The radar chart reveals a clear contrast between digital activity and perceived financial well-being. Both General Digital Activity Frequency and Frequency of Managing Finances Digitally share the same mean value (0.559), indicating that in 2022, Hungarian respondents displayed a moderately high level of engagement with digital technologies in both everyday and financial contexts (Figure 1).
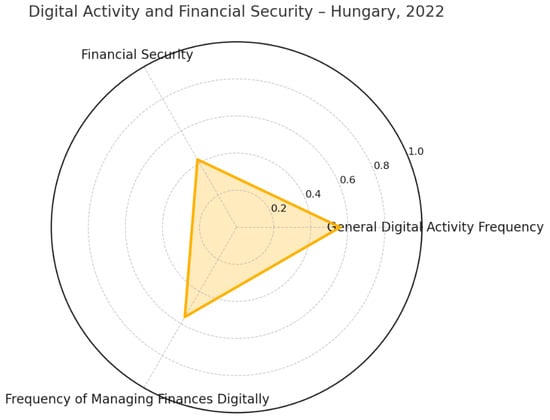
Figure 1.
Radar Chart of the Composite Variables [19]. Source: Author’s own compilation based on SPSS output and the 2022 survey data. The visualization was prepared with technical assistance from OpenAI ChatGPT 5.0 [20].
By comparison, the Financial Security index has a considerably lower mean (0.422), suggesting that active digital participation does not necessarily coincide with a stronger sense of economic stability. This asymmetry underscores the gap between technological adaptation and subjective financial well-being.
Once the 2026 survey results become available, a follow-up radar chart will allow for longitudinal comparison. Should any questionnaire items change, relative positioning will be interpreted within the technological context of the given year, thereby maintaining methodological consistency over time.
5. Discussion
The findings of this study are consistent with international literature, which highlights that the relationship between financial literacy and the use of FinTech tools is a complex and multi-layered phenomenon shaped by several mediating factors, such as digital skills, trust, and sociodemographic characteristics [30,31].
Evidence from numerous countries indicates that higher levels of financial literacy are strongly correlated with a greater adoption of FinTech. In the United States and Canada, for example, individuals with more substantial financial knowledge are more likely to use digital wallets, mobile banking services, and robo-advisor systems [32]. Similarly, a large-scale study spanning 50 countries across Latin America, Africa, and Asia found that financial literacy and FinTech adoption directly contribute to improved financial inclusion and broader social development [31].
In Asia, particularly in Japan, digital financial literacy plays a crucial role among the aging population, as it helps reduce technological resistance and build trust in digital financial services [33]. In India and other South Asian countries, Hasan et al. [34] demonstrated that, in rural populations, financial literacy is the strongest predictor of FinTech usage, even more so than access itself.
In Africa, one of the main drivers of FinTech development is the parallel rise of financial and digital literacy. According to Sam-Abugu’s [35] study in Nigeria, the use of FinTech tools alone does not guarantee financial well-being if it is not accompanied by sufficient financial knowledge and awareness. Unlike findings from the U.S. context [32], Hungarian respondents showed little difference in assessment accuracy across gender. While our results indicate that male respondents generally achieve higher financial literacy scores, this difference should not be interpreted solely as a reflection of cognitive or knowledge-based disparities. Socialization processes, cultural norms, and gender stereotypes are likely to play a significant role in shaping these outcomes.
Prior research suggests that men are more often encouraged to develop financial autonomy and risk-taking behavior, whereas women are typically socialized toward security-oriented and cautious financial attitudes [2]. Furthermore, gender stereotypes may contribute to systematic differences between actual knowledge and self-assessed competence. Women often tend to underestimate their financial knowledge even when their objective literacy levels are comparable to those of men. This divergence between knowledge and confidence may help explain part of the observed gender gap in both financial literacy and digital financial behavior in the FinTech environment.
Similar results were reported by Zaimovic et al. [36] in Bosnia, showing that digital financial literacy plays a full mediating role between professional experience and FinTech adoption.
In Brazil, the expansion of digital payment systems, such as PIX has been driven by easy accessibility and targeted financial education programs [10]. In the United States, Aristei and Gallo [37] found that individuals with higher levels of objective financial knowledge are less inclined to rely exclusively on fully automated advisory services, instead preferring hybrid solutions that combine human advice with technological support.
Based on these results, it is evident that for Hungary, the adaptation of international experiences can be beneficial on several levels:
- Integrated education—developing financial and digital literacy in parallel through practice-oriented programs.
- Targeted support—reaching rural and disadvantaged communities with tailored training initiatives.
- Building trust—strengthening knowledge of cybersecurity and data protection to encourage the adoption of FinTech solutions.
6. Conclusions
This study aimed to analyze the population’s level of financial knowledge and self-assessment, with particular attention to the relationships and discrepancies between the two. Our study extends the insights of OECD’s international financial literacy surveys by providing a context-specific, multidimensional analysis on a nationally representative Hungarian sample. While OECD reports primarily offer descriptive cross-country comparisons, this research explores cross-relationships between objective, test-based financial competence (including calculation ability) and self-assessed financial confidence, examining how demographic characteristics and digital behavioral patterns moderate their alignment. By integrating three composite indicators, general digital activity, frequency of digital financial engagement, and perceived financial security, the analysis links financial literacy to digital practices and subjective well-being, offering a more nuanced understanding of financial inclusion in the digital age. This approach delivers policy-relevant, country-specific insights that can support targeted financial education, enhance digital competence, and promote more inclusive FinTech adoption.
Participants’ Accordingly, the knowledge scale is best conceptualized as a formative index, integrating diverse elements of the broader construct of financial literacy. both objectively (through a test-based assessment) and subjectively (through self-report). The results revealed that, although a detectable relationship exists between the two measures, the overlap is far from complete; in many cases, individuals assess their own competence differently from their actual performance. This research highlights that while digital financial activity correlates with literacy, it does not distort self-perception-pointing to a rational engagement pattern in Hungary. Possible explanations for this include distrust toward financial topics, social expectations, or differences in self-confidence.
Gender comparisons showed that male respondents generally achieved higher scores on the objective test questions and rated their own knowledge more highly than women. However, this dual advantage was not associated with a greater degree of self-assessment bias, as both men and women were equally likely to over- or underestimate their own knowledge. This suggests that the accuracy of self-perception is not determined by gender, but rather by other, likely psychological factors. Educational platforms might integrate personalized confidence calibration modules to reduce knowledge overestimation.
The effects of demographic variables were primarily observable in both objective and self-assessed knowledge levels. Higher educational attainment and better financial status were associated with stronger financial knowledge and higher self-assessment. By contrast, older respondents tended to achieve lower test scores and evaluated their own abilities more modestly. Nevertheless, the discrepancy between actual and perceived knowledge could not be explained by these basic demographic factors, implying that the accuracy of self-assessment is not necessarily a function of social status or age.
The study also highlighted that digital tool usage, both for general and financial purposes was positively related to financial knowledge. Individuals who frequently engage in digital financial activities, such as using mobile banking or conducting transactions online, tend to be more knowledgeable in financial matters and display greater confidence in their self-assessment. At the same time, the extent of digital activity alone does not distort self-assessment, meaning that it does not lead to a systematic misjudgment of one’s knowledge level.
Perceived financial security, however, showed no substantial association with either actual knowledge or self-assessment. This suggests that the sense of material stability does not necessarily rely on objective financial knowledge, nor does it influence individuals’ self-perceptions in this domain.
Cluster analysis, based on the identified knowledge measures, revealed four distinct knowledge profiles. One group consists of individuals with excellent financial knowledge who nonetheless underestimate their own competence. Another group shows both low objective knowledge and low self-assessment, making them a particularly justified target for financial education. In addition, some slightly overestimate themselves, as well as a group that combines genuinely high knowledge levels with strong self-confidence. The latter can be considered the best prepared for making sound financial decisions.
Clustering based on digital habits and financial security provides further nuances. Some respondents rarely use digital tools, yet they feel financially secure, most likely due to their age or wealth. Others primarily use digital technology for entertainment purposes, while a third group actively exploit digital opportunities but still feel financially insecure. The most favorable position is held by those who are confident, knowledgeable, and technologically adept across all dimensions.
The findings suggest that improving financial knowledge cannot be limited to the transfer of information alone. Equally important is to address the accuracy of self-assessment, to strengthen digital competencies, and to design educational approaches tailored to the needs of specific target groups. Through the complex interplay of distorted self-assessment, gender differences, and digital tool usage, the development of financial awareness emerges as a multifaceted yet significant societal challenge. Future research should build on the present findings by exploring more deeply the mechanisms underlying the observed “knowledge–confidence gap.” Subsequent studies could examine the psychological and cognitive foundations of self-assessment biases, such as overconfidence or underconfidence, and their role in shaping digital financial behavior. A finer-grained analysis of these factors may help clarify why individuals with similar levels of objective financial literacy display markedly different behavioral patterns in FinTech contexts.
The results of the research provide practical guidance for policymakers, educational professionals, and financial service providers in improving financial awareness and digital inclusion. The study highlights that there is often a discrepancy between objective financial knowledge and subjective self-assessment, which justifies the development of more targeted financial education programs.
Integrating the development of digital competencies into financial education can promote safer and more confident use of FinTech solutions, especially among groups with lower levels of digital activity.
A practical implication of the research is that future developments should focus on creating integrated, human-centered digital financial solutions that are accessible to various demographic groups. This may contribute to the formation of a more inclusive, conscious, and stable financial ecosystem that supports both digital participation and a sense of financial security.
Moreover, extending the analysis to include cross-cultural or longitudinal perspectives could illuminate how socialization processes, cultural norms, and gendered expectations evolve over time and influence financial decision-making in digital environments. Integrating qualitative approaches—such as interviews or experimental designs—could also provide richer insight into the subjective dimensions of financial self-perception. Finally, future research may consider developing targeted interventions or educational programs aimed at reducing the confidence–knowledge mismatch, particularly among demographic groups identified as more susceptible to self-assessment distortions. Such investigations would not only extend the theoretical implications of our study but also offer practical guidance for improving digital financial inclusion and literacy.
Author Contributions
Conceptualization, E.N.; Methodology, S.M.S. and S.J.; Validation, E.N.; Formal analysis, S.J.; Resources, E.N.; Data curation, S.M.S.; Writing—original draft, E.N.; Writing—review & editing, S.J. and E.N.; Supervision, E.N. All authors have read and agreed to the published version of the manuscript.
Funding
This research received no external funding.
Institutional Review Board Statement
Not applicable.
Informed Consent Statement
Not applicable.
Data Availability Statement
All data generated or analyzed are included in the published article. The raw data supporting the conclusion of this article will be made available by the authors, without undue reservation. The raw anonymized data can be provided by emailing the primary author.
Conflicts of Interest
The authors declare that they have no known competing financial interests or personal relationships that could have appeared to influence the work reported in this paper.
References
- Chen, H.; Volpe, R.P. Gender differences in personal financial literacy among college students. Financ. Serv. Rev. 2002, 11, 289–307. [Google Scholar]
- Lusardi, A.; Mitchell, O.S. How Ordinary Consumers Make Complex Economic Decisions: Financial Literacy and Retirement Readiness; National Bureau of Economic Research Working Paper No. 15350; National Bureau of Economic Research: Cambridge, MA, USA, 2017. [Google Scholar] [CrossRef]
- Hasler, A.; Lusardi, A. The Gender Gap in Financial Literacy: A Global Perspective; Global Financial Literacy Excellence Center: Stanford, CA, USA, 2019. [Google Scholar]
- Vaish, A. Evaluating the impact and outreach of financial literacy programs under India’s National Strategy for Financial Education (NSFE), 2020–2025. Int. J. Innov. Stud. Econ. Manag. 2025, 4, 320–335. [Google Scholar]
- Goyal, K.; Kumar, S. Financial literacy: A systematic review and bibliometric analysis. Int. J. Consum. Stud. 2021, 45, 80–105. [Google Scholar] [CrossRef]
- Xiao, J.J. Applying behavior theories to financial behavior. In Handbook of Consumer Finance Research; Xiao, J.J., Ed.; Springer: New York, NY, USA, 2010; pp. 69–81. [Google Scholar] [CrossRef]
- Mathur, A. Managing personal finance. J. Consum. Aff. 1989, 23, 199–214. [Google Scholar] [CrossRef]
- Sharma, V.; Kumar, R.; Sood, K. The influence of financial socialization, financial self-efficacy, and self-control on financial well-being: Does personal financial management behavior mediate the relationship? J. Knowl. Econ. 2025, 1–31. [Google Scholar] [CrossRef]
- Sahlman, W.A. Management and the Financial Crisis (We Have Met the Enemy and He Is Us); Harvard Business School Working Paper, No. 09-036; Harvard Business School: Boston, MA, USA, 2009. [Google Scholar]
- OECD. Financial Literacy and the Digital Transformation of Financial Services; OECD Publishing: Paris, France, 2023. [Google Scholar]
- Kumar, P.; Ahlawat, P.; Deveshwar, A.; Yadav, M. Do villagers’ financial socialization, financial literacy, financial attitude, and financial behavior predict their financial well-being? Evidence from an emerging India. J. Fam. Econ. Issues 2024, 46, 802–820. [Google Scholar] [CrossRef]
- Németh, E.; Zsótér, B.; Béres, D. A pénzügyi sérülékenység jellemzői a magyar lakosság körében az OECD 2018-as adatainak tükrében. Pénzügyi Szle./Public Financ. Q. 2020, 65, 281–308. [Google Scholar] [CrossRef]
- Abdallah, W.; Tfaily, F.; Harraf, A. The impact of digital financial literacy on financial behavior: Customers’ perspective. Compet. Rev. Int. Bus. J. 2025, 35, 347–370. [Google Scholar] [CrossRef]
- Ozili, P. Financial inclusion in banking: A literature review and future research directions. Mod. Financ. 2025, 3, 91–109. [Google Scholar] [CrossRef]
- Bontadini, F.; Filippucci, F.; Jona Lasinio, C.S.; Nicoletti, G.; Saia, A. Digitalisation of Financial Services, Access to Finance and Aggregate Economic Performance; OECD Economics Department Working Papers, 1818; OECD Publishing: Paris, France, 2024. [Google Scholar]
- Dehnad, K.; Jamkarani, R.G. Analytical investigation in the evolution of financial literacy and financial behavior: A bibliometric approach. Adv. Financ. Innov. 2022, 3, 153–190. [Google Scholar] [CrossRef]
- Kocziszky, G.; Szendi, D. Analysis of the expected development paths of Central-Eastern European countries between 2022 and 2025. Soc. Econ. 2023, 45, 437–459. [Google Scholar] [CrossRef]
- Sunandes, A.; Fauzi, M.R. Trends and transformations in financial behavior of SMEs in Southeast Asia: A bibliometric review. Asian J. Appl. Bus. Manag. 2025, 4, 206–223. [Google Scholar] [CrossRef]
- Du Plessis, L.; Jordaan, Y. Consumer spending self-control, financial well-being and life satisfaction: The moderating effect of relative deprivation from consumers holding debt. Int. J. Bank Mark. 2025, 43, 1779–1803. [Google Scholar] [CrossRef]
- Yue, Z.; Wang, C.; Hong, H. Inclusive development of digital finance, family entrepreneurship and poverty reduction effect. Int. Entrep. Manag. J. 2025, 21, 9. [Google Scholar] [CrossRef]
- OECD. OECD Science, Technology and Innovation Outlook 2018: Adapting to Technological and Societal Disruption (Summary in Hungarian); Retrieved 15 November 2023; OECD Publishing: Paris, France, 2018. [Google Scholar]
- OECD. Digital Innovation: Seizing Policy Opportunities; Retrieved 15 November 2023; OECD Publishing: Paris, France, 2019. [Google Scholar]
- Suswanto, R.E.; Wahyudi, I. Bridging faith and innovation: A systematic literature review of Islamic FinTech adoption patterns and regulatory frameworks (2020–2024). Muamalatuna J. Islam. Econ. Bus. 2025, 17, 1–22. [Google Scholar] [CrossRef]
- Assimakopoulos, D.; Carayannis, E.G.; Zeng, C. Digital financial inclusion through mobile finance innovation in rural China: Cases from a multi-level study at the base of the pyramid. J. Knowl. Econ. 2025, 1–23. [Google Scholar] [CrossRef]
- Gillani, S.A.; Alvi, A.R.; Ahmad, H.; Gillani, S.A. FinTech adoption for SMEs: Innovation and opportunities worldwide. In FinTech for SMEs; IGI Global: Palmdale, PA, USA, 2025; pp. 23–42. [Google Scholar]
- WIPO. Global Innovation Index 2023; World Intellectual Property Organization: Geneva, Switzerland, 2023. Available online: https://www.wipo.int/global_innovation_index (accessed on 24 August 2025).
- European Commission. Digital Economy and Society Index 2022. 2022. Available online: https://digital-strategy.ec.europa.eu/en/policies/desi (accessed on 9 November 2023).
- Saleem, S.; Zeb, S. The impact of FinTech adoption on financial development: A systematic literature review. J. Bus. Manag. Rev. 2025, 6, 331–345. [Google Scholar]
- Khatib, S.F.A.; Mustafa, Z.; Abbas, A.F. Digital transformation and financial sustainability. In Handbook of Research on Global Challenges for Improving Public Services and Government Operations; IGI Global: Palmdale, PA, USA, 2025; pp. 1–20. [Google Scholar]
- Aftab, R.; Fazal, A.; Andleeb, R. Behavioral biases and FinTech adoption: Investigating the role of financial literacy. Acta Psychol. 2025, 257, 105065. [Google Scholar] [CrossRef] [PubMed]
- Asongu, S.A.; Odhiambo, N.M. Financial literacy, FinTech adoption and inclusive development in developing countries. J. Econ. Stud. 2023, 50, 910–930. [Google Scholar]
- Yoshino, N.; Morgan, P.J. Financial literacy and FinTech adoption in Japan: Evidence from the elderly population. Asian Dev. Rev. 2024, 41, 75–98. [Google Scholar]
- Hasan, M.; Noor, T.; Gao, J.; Usman, M. Rural consumers’ financial literacy and access to FinTech services. J. Knowl. Econ. 2023, 14, 780–804. [Google Scholar] [CrossRef]
- Prabhakaran, S. Analysing the nexus between financial literacy and FinTech adoption: A multi-country analysis. Invest. Manag. Financ. Innov. 2023, 20, 22–35. [Google Scholar] [CrossRef]
- Sam-Abugu, C. FinTech innovation and financial literacy: A catalyst for rural financial inclusion in Nigeria. Rev. Dev. Econ. 2025, 29, 112–130. [Google Scholar] [CrossRef]
- Zaimovic, A.; Omanovic, A.; Dedovic, L.; Zaimovic, T. The effect of business experience on fintech behavioural adoption among MSME managers: The mediating role of digital financial literacy and its components. Future Bus. J. 2025, 11, 26. [Google Scholar] [CrossRef]
- Aristei, D.; Gallo, M. Financial literacy, robo-advising, and the demand for human financial advice: Evidence from Italy. arXiv 2025, arXiv:2505.20527. [Google Scholar] [CrossRef]
Disclaimer/Publisher’s Note: The statements, opinions and data contained in all publications are solely those of the individual author(s) and contributor(s) and not of MDPI and/or the editor(s). MDPI and/or the editor(s) disclaim responsibility for any injury to people or property resulting from any ideas, methods, instructions or products referred to in the content. |
© 2025 by the authors. Licensee MDPI, Basel, Switzerland. This article is an open access article distributed under the terms and conditions of the Creative Commons Attribution (CC BY) license (https://creativecommons.org/licenses/by/4.0/).