
Modeling the Current Suitable Habitat Range of the Yellow-Bellied Gecko (Hemidactylus flaviviridis Rüppell, 1835) in Iran †


Abstract
1. Introduction
2. Materials and Methods
2.1. Occurrence Points
2.2. Data Collection
2.3. Species Distribution Model
3. Results
3.1. Model Performance
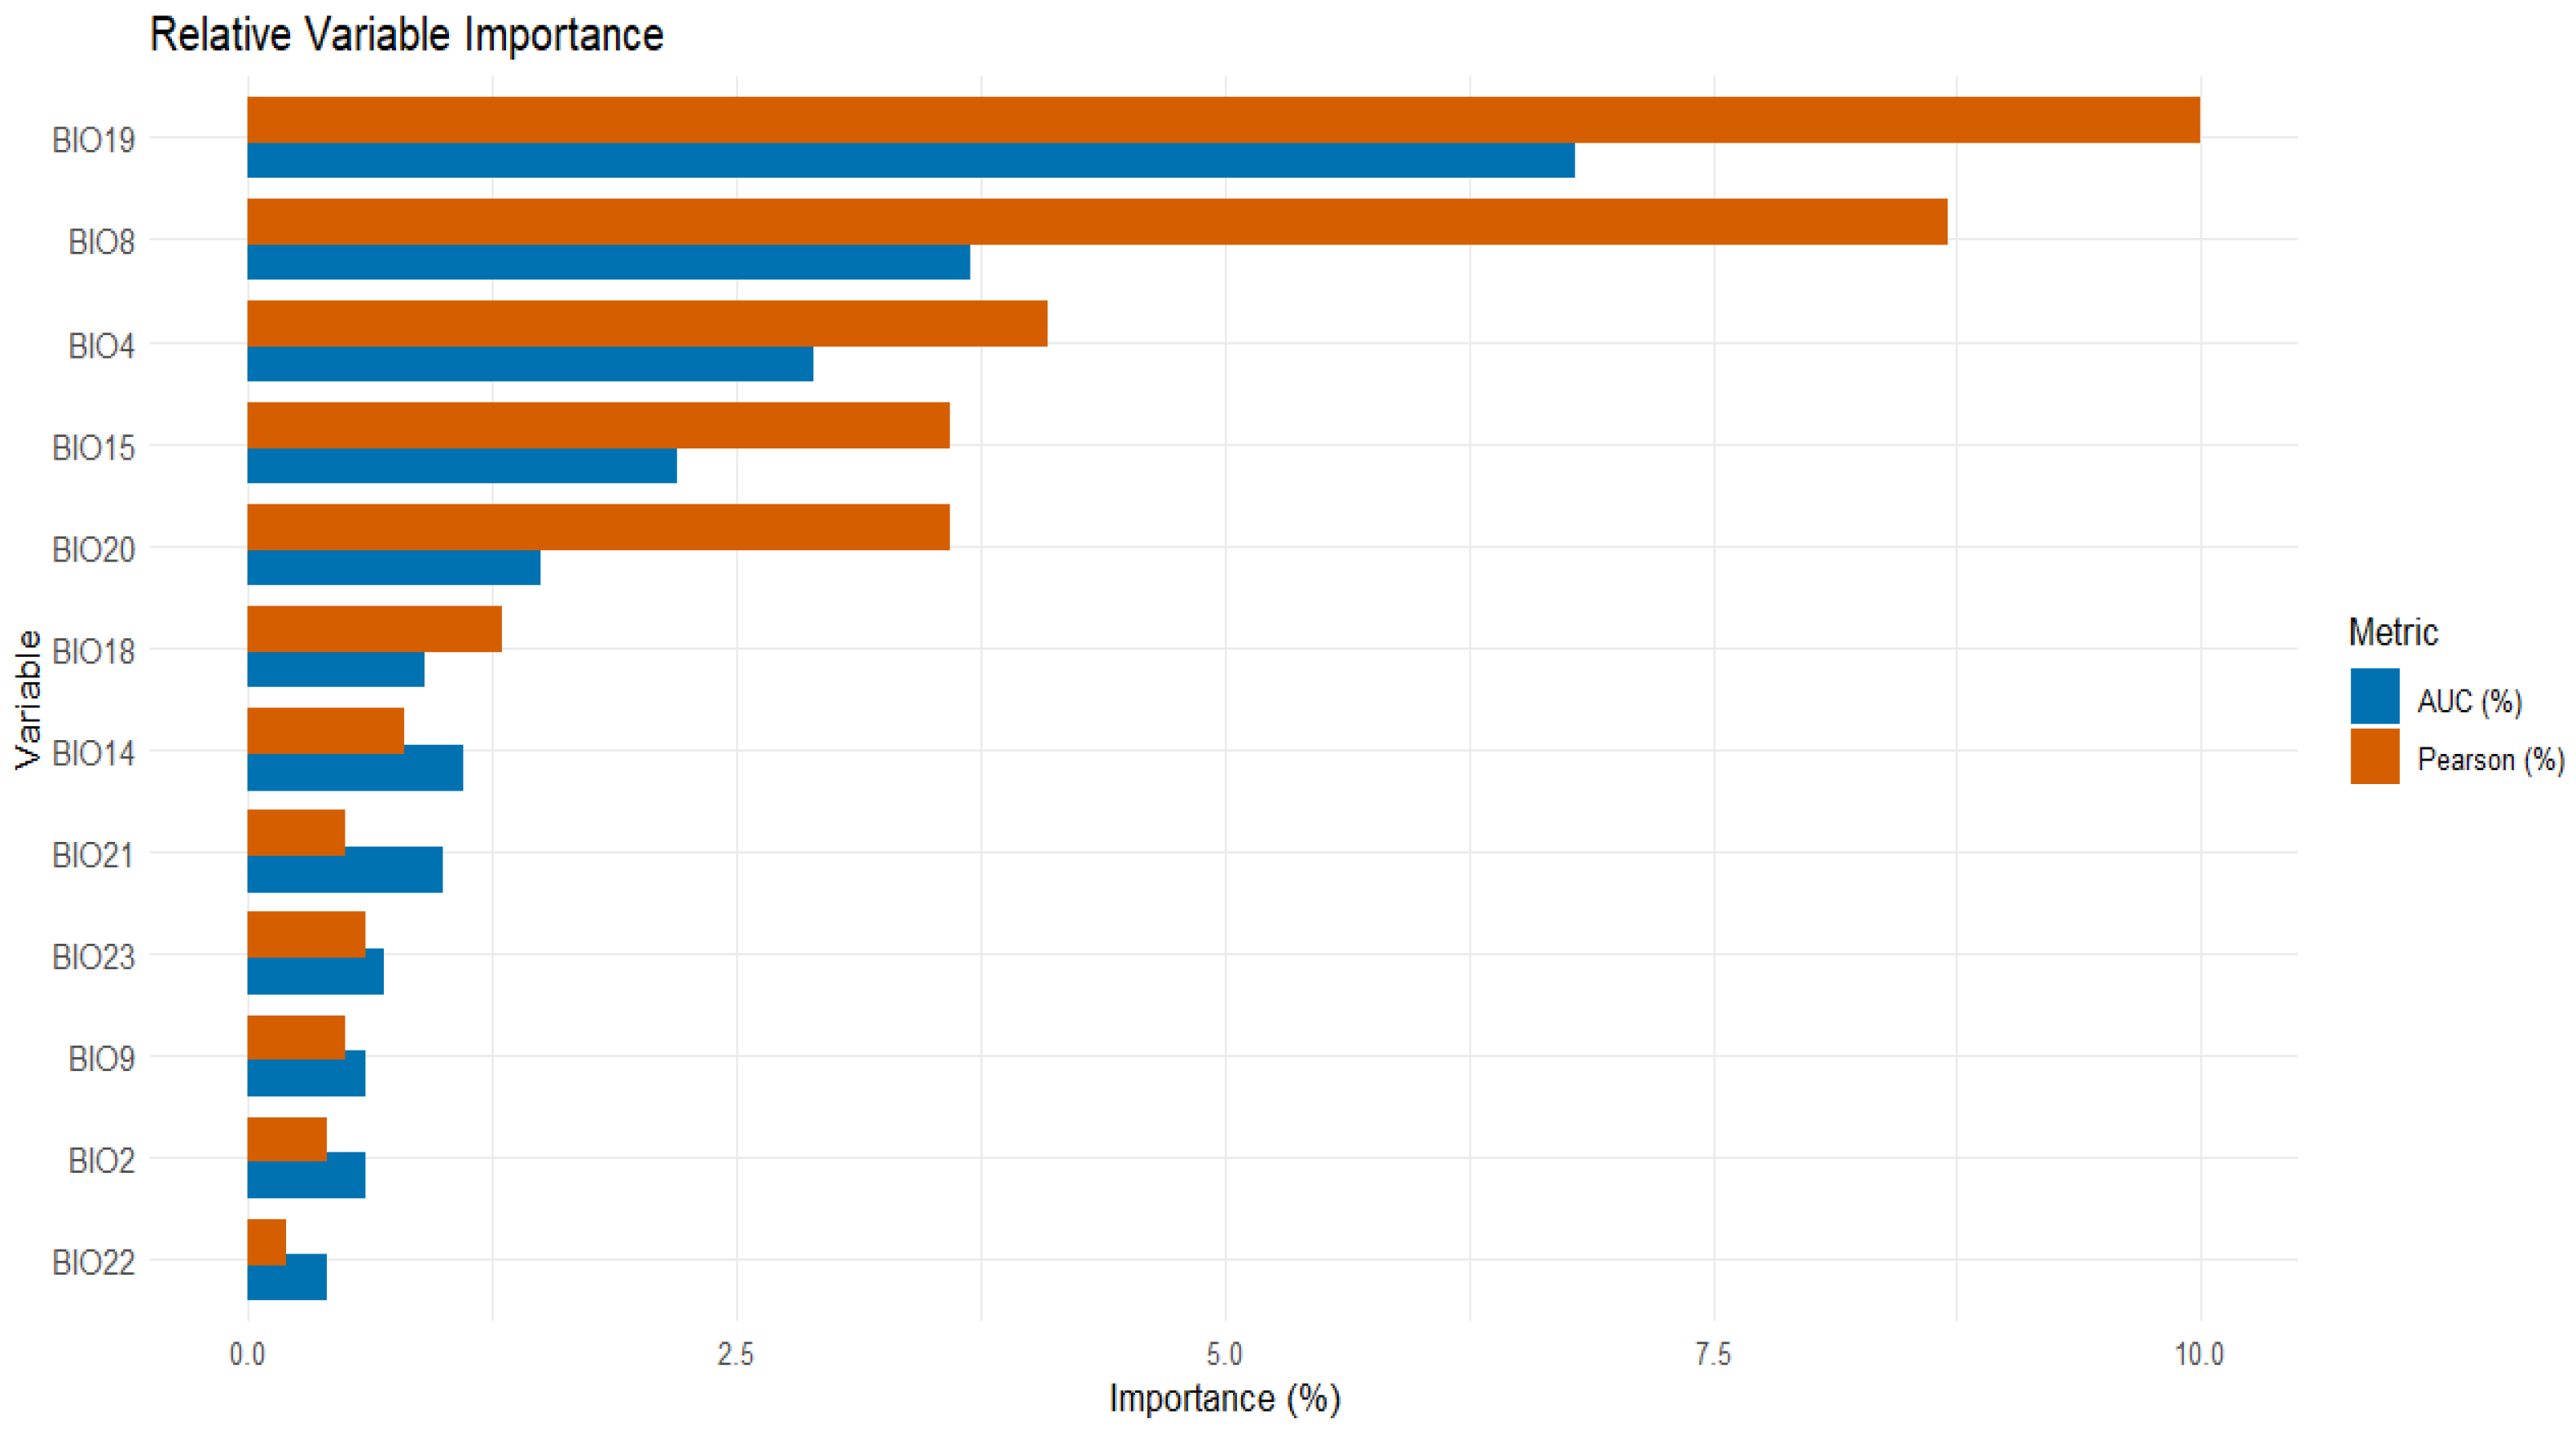
3.2. Relative Variable Contribution
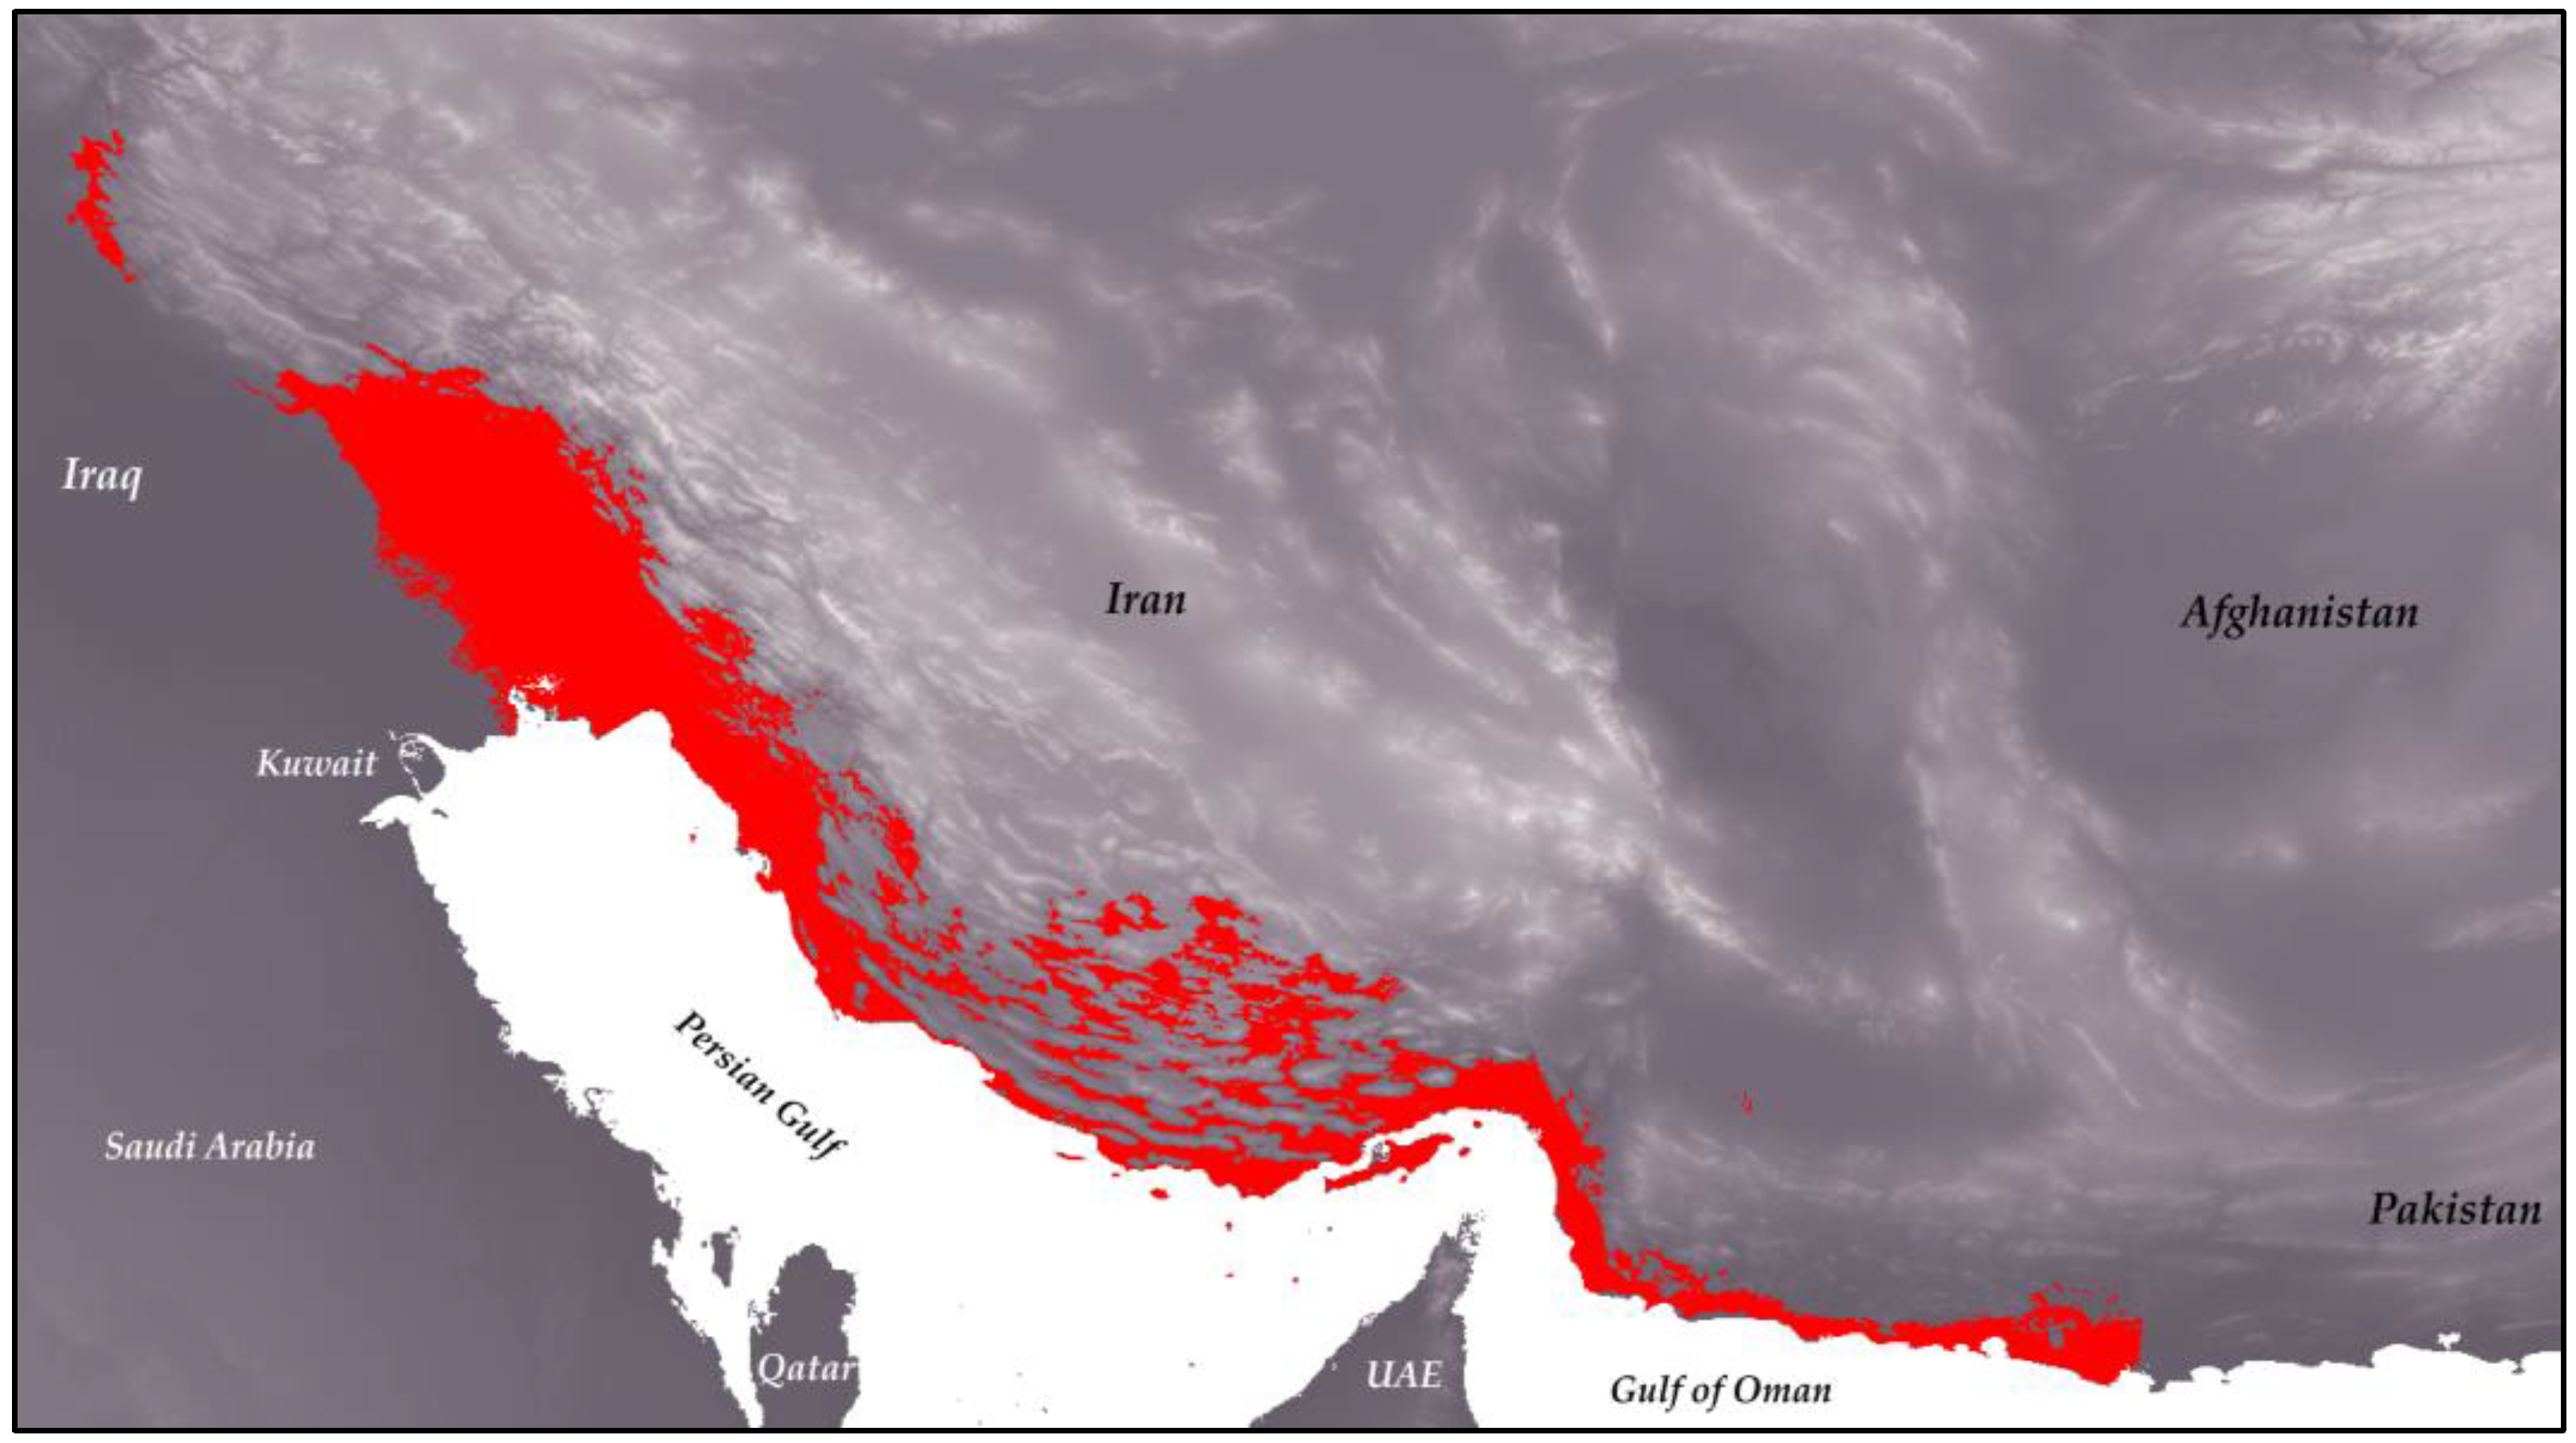
3.3. Ensemble Prediction
4. Discussion
Author Contributions
Funding
Institutional Review Board Statement
Informed Consent Statement
Data Availability Statement
Conflicts of Interest
References
- Kondratyeva, A.; Knapp, S.; Durka, W.; Kühn, I.; Vallet, J.; Machon, N.; Martin, G.; Motard, E.; Grandcolas, P.; Pavoine, S. Urbanization Effects on Biodiversity Revealed by a Two-Scale Analysis of Species Functional Uniqueness vs. Redundancy. Front. Ecol. Evol. 2020, 8, 73. [Google Scholar] [CrossRef]
- Aronson, M.F.J.; Nilon, C.H.; Lepczyk, C.A.; Parker, T.S.; Warren, P.S.; Cilliers, S.S.; Goddard, M.A.; Hahs, A.K.; Herzog, C.; Katti, M.; et al. Hierarchical Filters Determine Community Assembly of Urban Species Pools. Ecology 2016, 97, 2952–2963. [Google Scholar] [CrossRef] [PubMed]
- Rehbein, J.A.; Watson, J.E.M.; Lane, J.L.; Sonter, L.J.; Venter, O.; Atkinson, S.C.; Allan, J.R. Renewable Energy Development Threatens Many Globally Important Biodiversity Areas. Glob. Change Biol. 2020, 26, 3040–3051. [Google Scholar] [CrossRef] [PubMed]
- Prakash, S.; Verma, A. Anthropogenic Activities and Biodiversity Threats. Int. J. Biol. Innov. 2022, 4, 94–103. Available online: https://ssrn.com/abstract=4048276 (accessed on 24 September 2024). [CrossRef]
- Perrings, C.; Halkos, G. Agriculture and the Threat to Biodiversity in Sub-Saharan Africa. Environ. Res. Lett. 2015, 10, 095015. [Google Scholar] [CrossRef]
- Garcia, R.A.; Cabeza, M.; Rahbek, C.; Araújo, M.B. Multiple Dimensions of Climate Change and Their Implications for Biodiversity. Science 2014, 344, 1247579. [Google Scholar] [CrossRef]
- Trew, B.T.; Maclean, I.M.D. Vulnerability of Global Biodiversity Hotspots to Climate Change. Glob. Ecol. Biogeogr. 2021, 30, 768–783. [Google Scholar] [CrossRef]
- Habibullah, M.S.; Din, B.H.; Chong, C.W.; Radam, A. Tourism and Biodiversity Loss: Implications for Business Sustainability. Procedia Econ. Financ. 2016, 35, 166–172. [Google Scholar] [CrossRef]
- Cripps, G.; Gardner, C.J. Human Migration and Marine Protected Areas: Insights from Vezo Fishers in Madagascar. Geoforum 2016, 74, 49–62. [Google Scholar] [CrossRef]
- Elith, J.; Leathwick, J.R. Species Distribution Models: Ecological Explanation and Prediction Across Space and Time. Annu. Rev. Ecol. Evol. Syst. 2009, 40, 677–697. [Google Scholar] [CrossRef]
- Austin, M. Species Distribution Models and Ecological Theory: A Critical Assessment and Some Possible New Approaches. Ecol. Model. 2007, 200, 1–19. [Google Scholar] [CrossRef]
- Barbet-Massin, M.; Rome, Q.; Villemant, C.; Courchamp, F. Can Species Distribution Models Really Predict the Expansion of Invasive Species? PLoS ONE 2018, 13, e0193085. [Google Scholar] [CrossRef] [PubMed]
- Ebrahimi, E.; Ranjbaran, Y.; Sayahnia, R.; Ahmadzadeh, F. Assessing the climate change effects on the distribution pattern of the Azerbaijan Mountain Newt (Neurergus crocatus). Ecol. Complex. 2022, 50, 100997. [Google Scholar] [CrossRef]
- Li, X.; Wang, Y. Applying various algorithms for species distribution modelling. Integr. Zool. 2012, 8, 124–135. [Google Scholar] [CrossRef]
- Fois, M.; Cuena-Lombraña, A.; Fenu, G.; Bacchetta, G. Using species distribution models at local scale to guide the search of poorly known species: Review, methodological issues and future directions. Ecol. Model. 2018, 385, 124–132. [Google Scholar] [CrossRef]
- Noori, S.; Zahiri, R.; Yusefi, G.H.; Rajabizadeh, M.; Hawlitschek, O.; Rakhshani, E.; Husemann, M.; Rajaei, H. Patterns of Zoological Diversity in Iran—A Review. Diversity 2024, 16, 621. [Google Scholar] [CrossRef]
- Anderson, S.C. The Lizards of Iran. Contribution to Herpetology, 15; SSAR: Oxford, OH, USA, 1999; 442p. [Google Scholar]
- Mahendra, B.C. Sexual dimorphism in the Indian House-gecko Hemidactylus flaviviridis Ruppel. Curr. Sci. Bangalore 1935, 4, 178–179. [Google Scholar]
- Anderson, J. A Contribution to the Herpetology of Arabia: With A Preliminary List of the Reptiles and Batrachians of Egypt; R.H. Porter: London, UK, 1896; 122p. [Google Scholar]
- Gholamifard, A.; Rastegar-Pouyani, N. Distribution of Hemidactylus geckos (Reptilia: Gekkonidae) in Fars Province, Southern Iran. Amphib. Reptile Conserv. 2011, 5, 1–6. [Google Scholar]
- Moghbeli Mehni, M. The Species Diversity of Lizards in Anbarabad City, Located in Southeastern Kerman Province. Master’s Thesis, Shahid Bahonar University of Kerman, Kerman, Iran, 2016. [Google Scholar]
- Hosseinzadeh, M.S.; Aliabadian, M.; Rastegar-Pouyani, E. Predicting Geographical Distribution of Invasive Species, Hemidactylus flaviviridis Ruppell, 1840 in Current and Future Time in Iran Using Species Distribution Modeling. J. Anim. Res. 2016, 28, 431–440. [Google Scholar]
- GBIF Secretariat. Hemidactylus flaviviridis Rüppell, 1835. In Global Biodiversity Information Facility Backbone Taxonomy; Checklist dataset. 2023. Available online: https://www.gbif.org/dataset/d7dddbf4-2cf0-4f39-9b2a-bb099caae36c (accessed on 30 July 2024).
- Zizka, A.; Silvestro, D.; Andermann, T.; Azevedo, J.; Ritter, C.D.; Edler, D.; Farooq, H.; Herdean, A.; Ariza, M.; Scharn, R.; et al. CoordinateCleaner: Standardized cleaning of occurrence records from biological collection databases. Methods Ecol. Evol. 2019, 10, 744–751. [Google Scholar] [CrossRef]
- Fick, S.E.; Hijmans, R.J. WorldClim 2: New 1km spatial resolution climate surfaces for global land areas. Int. J. Climatol. 2017, 37, 4302–4315. [Google Scholar] [CrossRef]
- Kim, J.H. Multicollinearity and misleading statistical results. Korean J. Anesthesiol. 2019, 72, 558–569. [Google Scholar] [CrossRef] [PubMed]
- R Core Team. R: A Language and Environment for Statistical Computing; R Foundation for Statistical Computing: Vienna, Austria, 2024; Available online: https://www.R-project.org/ (accessed on 10 July 2024).
- Naimi, B.; Araújo, M.B. sdm: A reproducible and extensible R platform for species distribution modelling. Ecography 2016, 39, 368–375. [Google Scholar] [CrossRef]
- Breiman, L. Random Forests. Mach. Learn. 2001, 45, 5–32. [Google Scholar] [CrossRef]
- Phillips, S.J.; Anderson, R.P.; Schapire, R.E. Maximum entropy modeling of species geographic distributions. Ecol. Model. 2005, 190, 231–259. [Google Scholar] [CrossRef]
- Cortes, C.; Vapnik, V. Support-vector networks. Mach. Learn. 1995, 20, 273–297. [Google Scholar] [CrossRef]
- McCullagh, P. Generalized linear models. Eur. J. Oper. Res. 1984, 16, 285–292. [Google Scholar] [CrossRef]
- Liu, C.; Newell, G.; White, M. On the selection of thresholds for predicting species occurrence with presence-only data. Ecol. Evol. 2015, 6, 337–348. [Google Scholar] [CrossRef]
- Jiménez-Valverde, A.; Lobo, J.M. Threshold criteria for conversion of probability of species presence to either–or presence–absence. Acta Oecologica 2007, 31, 361–369. [Google Scholar] [CrossRef]
- Fawcett, T. An introduction to ROC analysis. Pattern Recognit. Lett. 2006, 27, 861–874. [Google Scholar] [CrossRef]
- Allouche, O.; Tsoar, A.; Kadmon, R. Assessing the accuracy of species distribution models: Prevalence, kappa and the true skill statistic (TSS). J. Appl. Ecol. 2006, 43, 1223–1232. [Google Scholar] [CrossRef]
- Bellard, C.; Cassey, P.; Blackburn, T.M. Alien species as a driver of recent extinctions. Biol. Lett. 2016, 12, 20150623. [Google Scholar] [CrossRef] [PubMed]
- Manchester, S.J.; Bullock, J.M. The impacts of non-native species on UK biodiversity and the effectiveness of control. J. Appl. Ecol. 2000, 37, 845–864. [Google Scholar] [CrossRef]
- Pyšek, P.; Hulme, P.E.; Simberloff, D.; Bacher, S.; Blackburn, T.M.; Carlton, J.T.; Dawson, W.; Essl, F.; Foxcroft, L.C.; Genovesi, P.; et al. Scientists' warning on invasive alien species. Biol. Rev. 2020, 95, 1511–1534. [Google Scholar] [CrossRef]
- Santicchia, F.; Wauters, L.A.; Tranquillo, C.; Villa, F.; Dantzer, B.; Palme, R.; Preatoni, D.; Martinoli, A. Invasive alien species as an environmental stressor and its effects on coping style in a native competitor, the Eurasian red squirrel. Hormones Behav. 2022, 140, 105127. [Google Scholar] [CrossRef]


| Variables | Description | Variables | Description |
|---|---|---|---|
| BIO1 | Annual Mean Temperature | BIO13 | Precipitation of Wettest Month |
| BIO2 * | Mean Diurnal Range (Mean of Monthly (Max Temp − Min Temp)) | BIO14 * | Precipitation of Driest Month |
| BIO3 | Isothermality (BIO2/BIO7) (×100) | BIO15 * | Precipitation Seasonality (Coefficient of Variation) |
| BIO4 * | Temperature Seasonality (Standard Deviation ×100) | BIO16 | Precipitation of Wettest Quarter |
| BIO5 | Max Temperature of Warmest Month | BIO17 | Precipitation of Driest Quarter |
| BIO6 | Min Temperature of Coldest Month | BIO18 * | Precipitation of Warmest Quarter |
| BIO7 | Temperature Annual Range (BIO5–BIO6) | BIO19 * | Precipitation of Coldest Quarter |
| BIO8 * | Mean Temperature of Wettest Quarter | BIO20 * | Digital Elevation Model (Height Above Sea Level, m) |
| BIO9 * | Mean Temperature of Driest Quarter | BIO21 * | Slope of the Terrain |
| BIO10 | Mean Temperature of Warmest Quarter | BIO22 * | Direction of the Terrain |
| BIO11 | Mean Temperature of Coldest Quarter | BIO23 * | Normalized Difference Vegetation Index |
| BIO12 | Annual Precipitation |
| Algorithm | AUC | TSS |
|---|---|---|
| Random Forest (RF) | 0.99 | 0.94 |
| Maximum Entropy (Maxent) | 0.98 | 0.91 |
| Support Vector Machine (SVM) | 0.99 | 0.95 |
| Generalized Linear Model (GLM) | 0.89 | 0.79 |
Disclaimer/Publisher’s Note: The statements, opinions and data contained in all publications are solely those of the individual author(s) and contributor(s) and not of MDPI and/or the editor(s). MDPI and/or the editor(s) disclaim responsibility for any injury to people or property resulting from any ideas, methods, instructions or products referred to in the content. |
© 2024 by the authors. Licensee MDPI, Basel, Switzerland. This article is an open access article distributed under the terms and conditions of the Creative Commons Attribution (CC BY) license (https://creativecommons.org/licenses/by/4.0/).
Share and Cite
Ghasemian Sorboni, S.; Hadipour, M.; Ghasemian Sorboni, N. Modeling the Current Suitable Habitat Range of the Yellow-Bellied Gecko (Hemidactylus flaviviridis Rüppell, 1835) in Iran. Biol. Life Sci. Forum 2024, 39, 1. https://doi.org/10.3390/blsf2024039001
Ghasemian Sorboni S, Hadipour M, Ghasemian Sorboni N. Modeling the Current Suitable Habitat Range of the Yellow-Bellied Gecko (Hemidactylus flaviviridis Rüppell, 1835) in Iran. Biology and Life Sciences Forum. 2024; 39(1):1. https://doi.org/10.3390/blsf2024039001
Chicago/Turabian StyleGhasemian Sorboni, Saman, Mehrdad Hadipour, and Narina Ghasemian Sorboni. 2024. "Modeling the Current Suitable Habitat Range of the Yellow-Bellied Gecko (Hemidactylus flaviviridis Rüppell, 1835) in Iran" Biology and Life Sciences Forum 39, no. 1: 1. https://doi.org/10.3390/blsf2024039001
APA StyleGhasemian Sorboni, S., Hadipour, M., & Ghasemian Sorboni, N. (2024). Modeling the Current Suitable Habitat Range of the Yellow-Bellied Gecko (Hemidactylus flaviviridis Rüppell, 1835) in Iran. Biology and Life Sciences Forum, 39(1), 1. https://doi.org/10.3390/blsf2024039001