Article

Monochromatic Light Management for Bioeconomic Production of Metabolites in the Soil Microalga Pleurastrum insigne


by
Aleksandr Yakoviichuk
1,2,*,
Irina Maltseva
1,
Angelika Kochubey
1,
Svetlana Cherkashyna
1,
Ekaterina Lysova
1,
Evilina Sheludko
1,
Maxim Kulikovskiy
2,
Yevhen Maltsev
2 and
Svetlana Maltseva
2
1
Faculty of Natural Sciences, Melitopol State University, 272312 Melitopol
2
K.A. Timiryazev Institute of Plant Physiology RAS, IPP RAS, 127276 Moscow, Russia
*
Author to whom correspondence should be addressed.
Phycology 2026, 6(3), 85; https://doi.org/10.3390/phycology6030085
Submission received: 2 July 2026 / Revised: 26 July 2026 / Accepted: 28 July 2026 / Published: 1 August 2026
(This article belongs to the Special Issue Development of Algal Biotechnology, Second Edition)

Abstract

Microalgae represent a promising raw material for the bioeconomy and biotechnology. One of the key factors regulating their metabolism is light. However, the traditional approach to cultivation, aimed at maximising biomass productivity due to high lighting intensity, contradicts the principles of energy efficiency. In addition, the responses of soil microalgae to the spectral composition of light remain poorly understood, which creates a gap in fundamental knowledge. The Pleurastrum insigne CAMU MZ–Ch4 soil strain is a potent producer of valuable compounds. Physico-chemical and instrumental analysis, including spectrophotometric, chromatographic and gravimetric techniques, were used to determine the productive and biochemical parameters of the strain. It was shown that blue and red light with intensities of 90 and 150 µmol m−2 s−1 are optimal in absolute terms for the growth and CO2 biofixation, green light for the accumulation of pigments and antioxidants, and low-intensity red light is the most energy efficient for the synthesis of lipids and other metabolites. Based on calculations of product-specific energy intensity, it was demonstrated that the “more light = more product” strategy increases metabolite energy intensity. Maximum bioeconomic efficiency (the minimum cost of electricity to produce a unit of a metabolite) is achieved with low intensity of red and blue light.

1. Introduction

Microalgae are a promising biotechnological resource due to their high productivity, adaptability, and ability to synthesise a wide range of valuable compounds [1]. One of the key factors regulating the growth and metabolism of microalgae is light; the spectral composition, intensity, and other parameters of light are a convenient tool for managing the production of target metabolites [2,3].
Traditionally, the biotechnological approach involves achieving maximum productivity by increasing lighting intensity [4]. However, this approach does not account for the non-linearity of the culture’s light intensity response [5], since beyond the intensity optimum, growth slows down due to photoinhibition, while energy costs continue to rise. Techno-economic analysis shows that energy costs for lighting account for up to 50% of production costs and constitute the main contributor to the production carbon footprint [6,7]. This conflicts with the principles of a sustainable bioeconomy, and the growing carbon footprint negates the fundamental strategy of biotechnology (environmental friendliness). Thus, maximum product output is not equivalent to minimum production cost, and more often than not, it contradicts the principles of ecological friendliness in biotechnology. In conditions where environmental efficiency is becoming a critical parameter, production technologies need to shift from maximum productivity to a strategy for optimising the energy efficiency of the entire process, ensuring a negative or neutral carbon balance [8,9]. In this context, managing the spectral composition of light could be a promising approach to reducing energy consumption while maintaining the high productivity of target compounds. In the long term, this could also provide an additional benefit related to the absorption of carbon dioxide biotechnological applications of microalgae aimed at producing valuable metabolites and absorbing CO2 have recently attracted considerable interest and are actively being investigated [10,11,12,13].
In their studies, Maltsev et al. [2] and Huang et al. [3] reported that many types of microalgae achieve optimal growth under combined illumination with an emphasis on the red and blue spectral regions at intensities in the range of 26–1500 µmol m−2 s−1. It is known that the optimal light level varies depending on the species of microalgae. At the same time, to date, there have been no universal and clear dependencies in the scientific literature between lighting conditions, growth rates, and the biochemical composition of the biomass. The results of various experiments indicate a species-specific reaction to light, and the accumulation of specific valuable metabolite, triggered by certain lighting parameters [2,14,15,16]. Moreover, the vast majority of research focuses on aquatic organisms—freshwater and marine species of microalgae [2,3,14]. Despite active study of the influence of light on aquatic microalgae [2,14], currently, limited information is available regarding the effect of monochromatic light and its intensity on biomass accumulation, lipid, and carotenoid content in a range of microalgae [2,3]. Some studies contain information on the accumulation of α-tocopherol [17], ascorbic acid [18,19], and polyphenolic compounds [18,20] by microalgae in various lighting conditions. At the same time, the responses of soil microalgae—organisms adapted to aphotic (deep soil horizons, caves) or to extreme light conditions (soil surface with high insolation)—remain practically unexplored [21,22]. The soil environment, especially the upper soil horizon, is characterised by significant fluctuations in temperature, humidity, and exposure to high-intensity light, in water conditions these factors are relatively stable [22]. Consequently, soil microalgae have developed a special photophysiological strategy for survival under stress. Their survival in these habitats depends on a number of protective mechanisms, including the accumulation of compounds that protect against ultraviolet radiation [23], the formation of stable life stages such as akinetes or zygospores [24], and the secretion of extracellular substances [25], which create a moistened microenvironment. Moreover, some soil isolates exhibit exceptional resistance to photodamage, enabling active photosynthesis at light levels that are high for aquatic microalgae [26]. This combination of protective and reparative strategies determines a high-stress tolerance strategy in soil strains, rather than the biomass accumulation and growth usually observed in planktonic species, and suggests that they can support vital functions across a wide range of light intensities. This creates a significant knowledge deficit, since the mechanisms of light adaptation and metabolic response in this ecological group may differ fundamentally from those known for aquatic species, especially since the existing data on the effect of monochromatic light on microalgae are often contradictory [2,3,14,16]. This deficit in fundamental knowledge limits the development of resource-saving cultivation technologies for this ecological group, and further underscores the need for research in this direction.
Chlorococcum/Pleurastrum Chodat are one of the largest genera of green algae. Among the Pleurastrum species, there are both aquatic and soil species. The soil species Pleurastrum insigne Chodat 1894 (formerly Chlorococcum oleofaciens) is well-studied at both the ultrastructural and molecular levels. It is characterised by its ability to accumulate large quantities of oils, its great biotechnological potential, and its potential to serve as a model for assessing the effectiveness of changes in cultivation conditions to obtain biomass with a maximum content of valuable metabolites [27,28]. Research data on the Pleurastrum insigne CAMU MZ–Ch4 soil strain indicate its high biotechnological value for lipid, vitamin, and carotenoid production, as well as for carbon dioxide biosequestration [27,28,29].
This work aimed to study the effects of the spectral composition and intensity of monochromatic light on the growth, metabolic profile, CO2 biofixation and metabolites production energy efficiencyof Pleurastrum insigne CAMU MZ–Ch4. Addressing these objectives will help characterise the mechanisms of light regulation of metabolism in a representative soil microalga, lay the foundation for extrapolating the obtained patterns to other organisms in this ecological group, and propose energy-efficient strategies for light-controlled, targeted biotechnological synthesis of valuable compounds, in line with the principles of a sustainable bioeconomy.

2. Materials and Methods

2.1. Microalgal Material

The strain Pleurastrum insigne (formerly Chlorococcum oleofaciens) MZ–Ch4 was isolated from forest litter in the oakwood of the Samara Forest (N 48°39′30.44″, E 35°39′2.17″). The strain was deposited in the Culture and Barcode Collection of Microalgae and Cyanobacteria “Algabank” (WDCM1318) at the K.A. Timiryazev Institute of Plant Physiology RAS and the Collection of Algae at Melitopol State University CAMU (WDCM1158) as perpetually transferred pure cultures. Photos and molecular studies of the strain were presented earlier [30]. The strain is stored at 15.0 ± 2.0 °C in vials illuminated by white diodes at 120 lx with a 16:8 h (light/dark) light cycle in BBM (Table 1) [31]. A culture in the exponential phase was used for the experiments. For this purpose, 10.0 mL Pleurastrum insigne was inoculated in 150.0 mL of fresh BBM. After 5 days of growth, this culture was introduced into experimental media.

2.2. Experimental Design

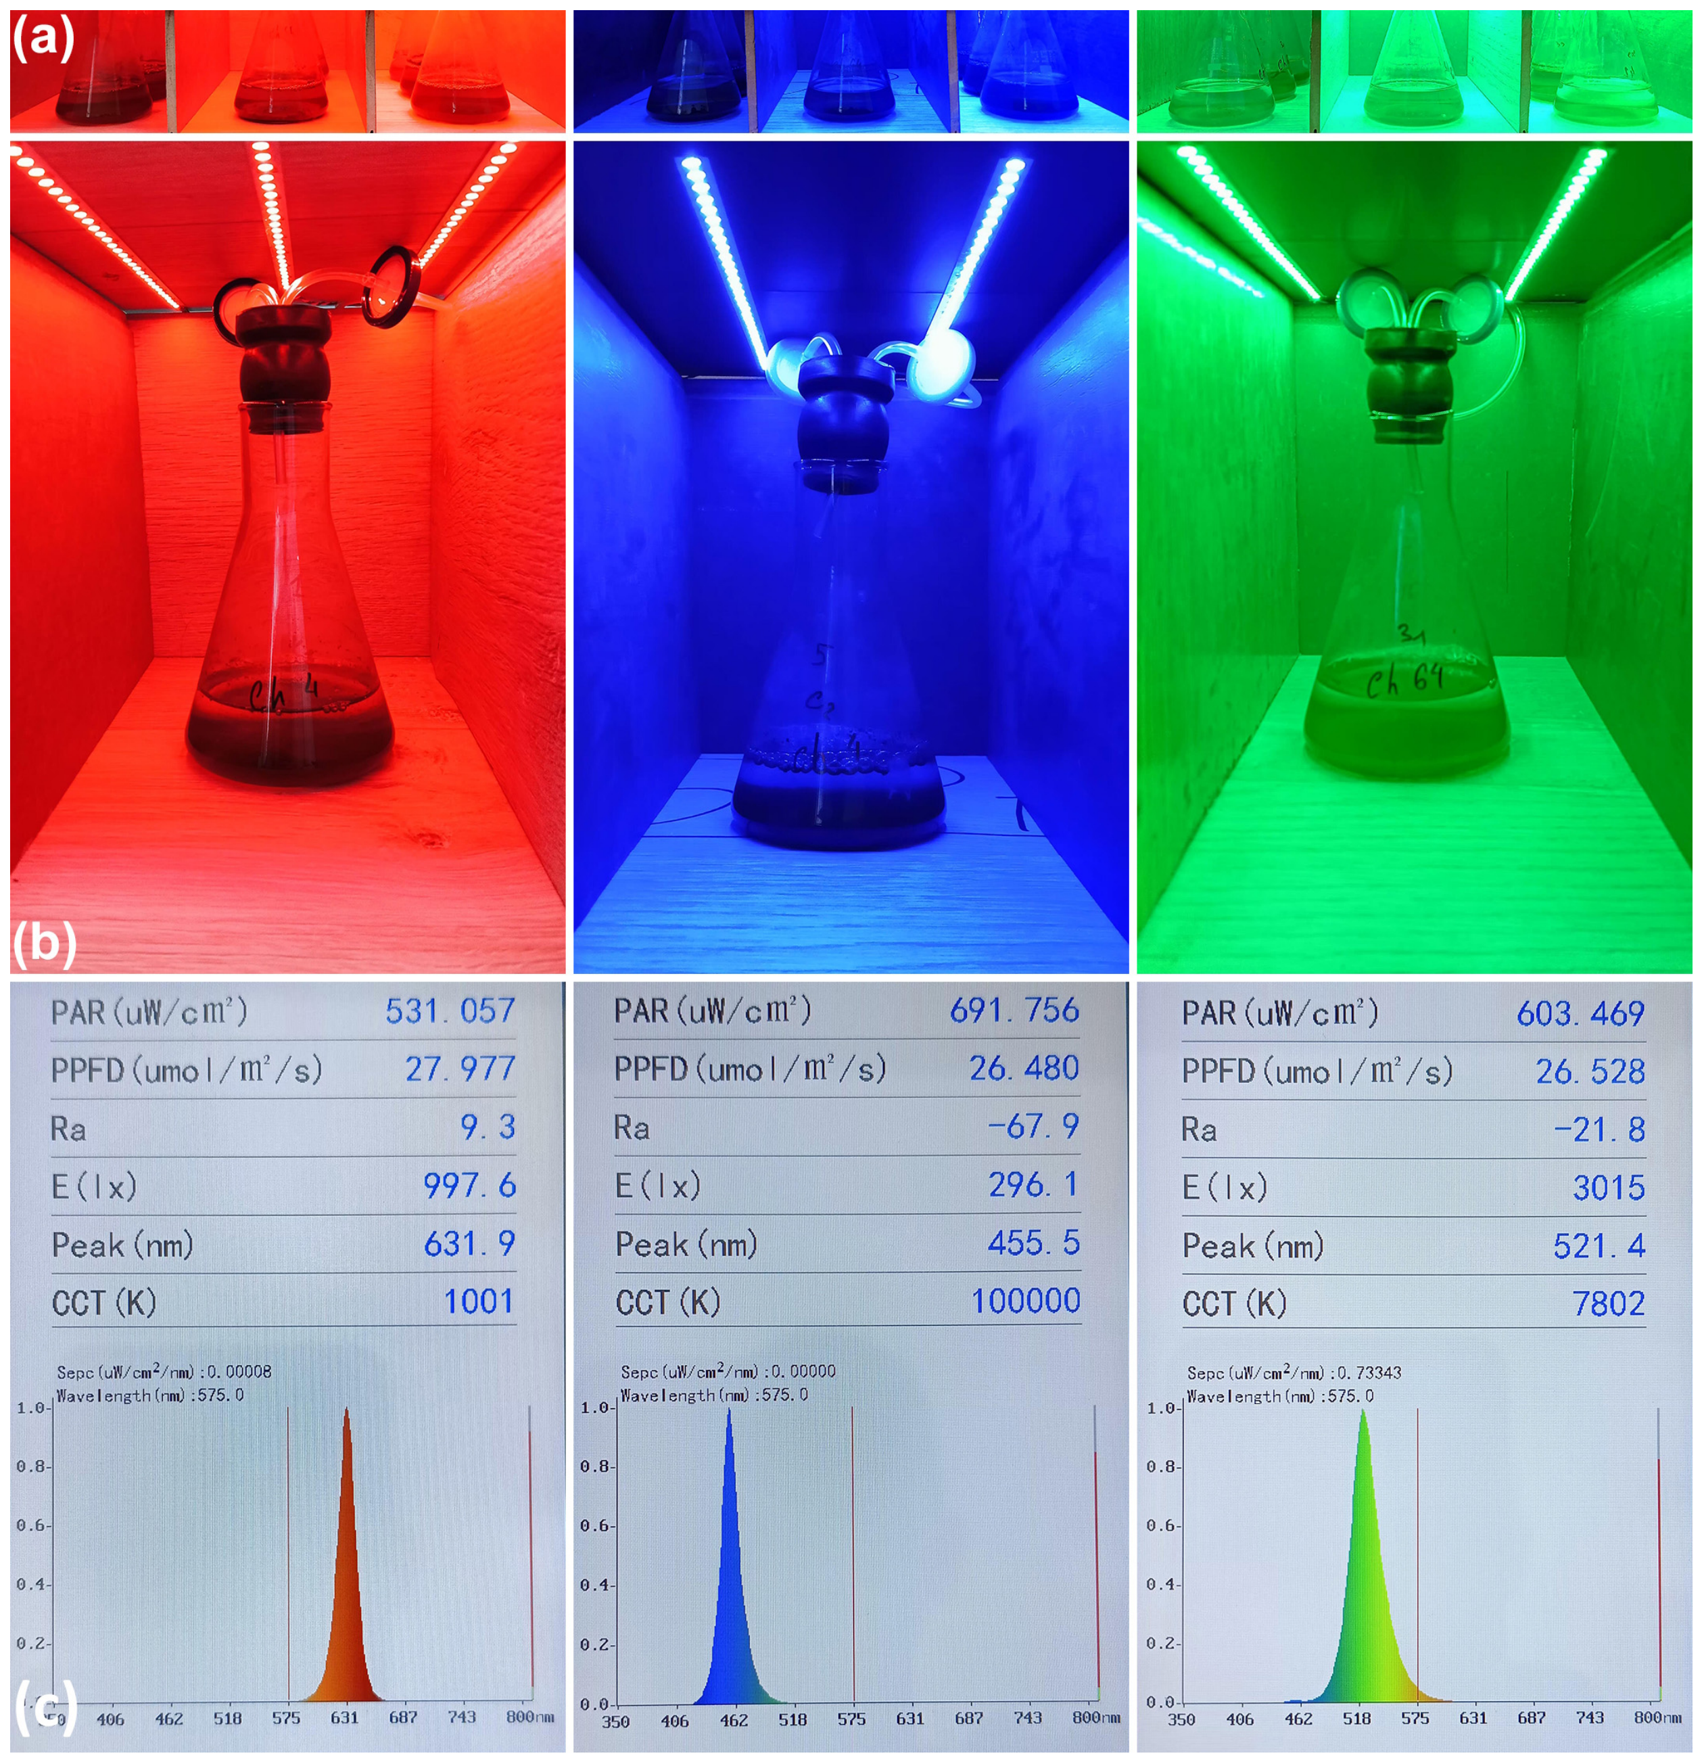
As reactors, we used flat-bottomed 250 mL flasks with sealed lids and a system that ensures consistent composition of the gas–air mixture in the flask (Figure 1a,b). For this, a sealed cap was used, to which an inlet tube from the compressor was connected via a filter, as well as an outlet tube (also through a filter) to prevent excessive pressure from building up inside the flask.
The Hailea ACO-308 aquarium compressor (Hailea, Chaozhou, China) supplied air for cell culture aeration. The air was delivered through a 4 mm inner-diameter tube at 0.1 L min−1. The air was taken from a constantly ventilated room. The carbon dioxide volume fraction in the air was maintained at 540–557 ppm. The carbon dioxide volume fraction in the air was monitored using an AZ7752 gas analyser (AZ Instrument, Taichung, Taiwan). To prevent bacterial contamination of the culture, we used a bacterial ventilation filter (GSV, Rosignano Solvay, Italy) with a 40 mm diameter (pore size 0.22 µm). The filter was located in the gap between the compressor and the tube and at the reactor outlet. The strain was grown at 23.0 ± 2.0 °C. The light intensity was 26–150 µmol m−2 s−1, and the lighting mode was 16:8 (light/dark) (Figure 1c). The light intensity was measured using the HOPOOCOLOR OHSP-350P lighting analyser (Hangzhou HOPOOCOLOR Light and Colour Technology Co., Ltd., Hangzhou, China). Cell cultures were cultivated with constant shaking at 60 rpm using a KJ-201 BD orbital shaker (Pioway Medical Lab Equipment, Nanjing, China). To assess the growth and biochemical characteristics of the strain, it was grown in Erlenmeyer flasks containing 150.0 mL of BBM, with a volume of 250.0 mL, at 23.0 ± 2.0 °C. The initial cell concentration was 2.89 × 10⁵ cells mL−1. Cell concentrations were measured with a C100 (RWD Life Science, Shenzhen, China).
To set up the experiment, an experimental design was developed, according to which 9 experimental cultivation regimes were formed for the strain (Table 2). The intensities were selected based on the literature data [2], which indicate that they are optimal for the growth of most representatives of green microalgae. The experimental group cultivated at 26 µmol m−2 s−1 was considered the control. The choice as control a low light intensity (26 µmol m−2 s−1) to assess the effect of the spectral composition is due to this value being located on the linear (light-limiting) section of the photosynthetic light curve, where the speed of the process is directly proportional to the number of absorbed photons and light limits the process. While the range of 90–150 µmol m−2 s−1 is often considered as the optimum for growth [2] and corresponds to the zone of light saturation, in which the rate of photosynthesis is limited by the maximum rate of Ru-bisCO carboxylation or the rate of RuBP regeneration, rather than the arrival of photons [32], high light intensities can cause activation of non-photochemical quenching and photoinhibition [32], which negates the effects of changes in spectral composition. Accordingly, cultivation at 26 µmol m−2 s−1 ensures maximum sensitivity of the culture to spectral shifts, whereas in bright light this effect is masked by saturation of the electron transport chain and Rubisco limitation. Thus, using the light-limiting mode as a control paired with the optimum (90–150 µmol m−2 s−1) allows you to compare the effect of the test factor, minimising the influence of competing physiological limitations.
LED strips were used as light sources, with their density and distribution frequency within the lightproof box arranged to achieve the required light intensity. Additionally, dimmers were used to maintain the necessary PPFD. The LED strips were powered by a Corsair CX 550 ATX power supply with a 550 W output and an 80+ Bronze efficiency rating.

2.3. Growth Assessment and Rate of CO2 Biofixation

The growth was followed for 20 days. Microalgae growth was estimated by measuring dry weight (DW). The measured dry weight is expressed in g L−1.
Biomass productivity (P, g L−1 day−1) was estimated using the following equation:
P (g L−1 day−1) = (x2 − x1) (t2 − t1)−1
where x2 (g L−1) is the concentration of the biomass at the end of the cultivation time t2 (day), and x1 (g L−1) is the concentration of the biomass at the beginning of the cultivation time t1 (day) [33].
The rate of CO2 biofixation (F, g CO2 L−1 day−1) was calculated for biomass productivity (P) according to the equation [33]:
F (g CO2 L−1 day−1) = 1.88 P
where P is the productivity of biomass (g L−1 day−1).

2.4. Biochemical Parameters Measured

Detailed analytical procedures for the measurement of chlorophyll a (Chl a), chlorophyll b (Chl b), total carotenoids (including more and less polar fractions), lipids, proteins, ascorbic acid (AscA), phenolic compounds (PhenCs), and α-tocopherol (α-Toc) are described in the Supplementary Materials (Supplement).

2.4.1. Chlorophyll a, b, and Carotenoid Content Measured

The measurements of Chl a, Chl b, Car, MPCar and LPCar were carried out using an extraction-photometric method [34]. The extraction of pigments from microalgae was carried out with 80.0% acetone. The absorption intensity of the pigment extract was analysed on the spectrophotometer Ulab 102 (Ulab, Nanjing, China) at the following wavelengths: 663.4, 646.6 and 440.5 nm, which corresponds to the absorption maximum for Chl a, Chl b and Car. Calculations were carried out according to the following formulas:
Chl a = 12.25 E663,6 − 2.55 E646,6 (µg mL−1)
Chl b = 20.31 E646,6 − 4.91 E663,6 (µg mL−1)
Chl a + b = 17.76 E646.6 + 7.34 E663.6 (µg mL−1)
Car = 4.69 E440.5 − 0.267 Chl a + b (µg mL−1)
Next, we mixed the above acetone extract with 2.5 mL of hexane, stirred, and left in the dark until the phase separation. The upper phase contains less polar compounds dissolved in hexane, and the lower phase contains more polar compounds dissolved in acetone. The lower fraction was collected separately, and optical density measurements were performed at 440.5, which corresponds to the maximum absorption of more polar carotenoids (MPCar). We evaporated the upper hexane fraction in vacuum and dissolved the dry residue with 80% acetone, destroying chlorophyll molecules by adding 50 µL of 12.5% HCl solution. Next, we measured the absorption at 470, which is the main absorption maxima of less polar carotenoids (LPCar.). To calculate the concentrations, we used the equations below:
MPCar = 4.69 E440.5 − 0.267Chl a + b (µg mL−1)
LPCar = (1000 E470 − 4.28 E665.4 − 4.78 E653.4)/164 (µg mL−1)
The content of pigments was expressed in mg g−1 of dry biomass.

2.4.2. Lipids, Protein, Ascorbic Acid, Phenolic Compounds and α-Tocopherol Content Measurement

The determination of the total lipid content was carried out by the gravimetric method. A hexane-propane-2-ol mixture at a volume ratio of 3:2 was used for lipid extraction [35]. The extract was poured into a preweighted sample bottle, and a glass with precipitation was washed twice with hexane. The extracts were combined and evaporated under vacuum at 60 °C. The dry lipid fraction was weighed and expressed in mg g−1 DW.
For protein content determination we used Olson’s protocol [36], which is based on the bicinchoninic method. The calibration curve was constructed according to the standard solution of bovine serum albumin (Thermo Scientific, Waltham, MA, USA). The proteine content was expressed in mg g−1 DW.
The phenolic compound (PhenC) content of the samples was determined according to the Folin–Chocalteu colorimetric method according to a protocol described by Vazquez et al. [37]. The optical density of the solution was then measured at 760 nm on the ULab 102 spectrophotometer. The total phenolic compounds content was quantified with a calibration curve obtained using a standard galic acid solution (Merck, Darmstadt, Germany) in the concentration range of 1 to 20 mg L−1. The concentration is expressed in galic acid equivalents mg at 1.0 g of DW (GAE mg/g−1 DW).
The method of Kampfenkel et al. in the Zuffellato-Ribas et al. modification [38] was used to determine the content of ascorbic acid. The optical density of the solution was then measured using a 525 nm. A calibration curve was used to quantify the optical density (mg g−1 DW). The standard used was a calibration solution made of crystalline ascorbic acid (Supelco, Darmstadt, Germany).
The content of α-tocopherol in biomass was determined by reverse-phase HPLC using a Chromatron-1411 liquid chromatograph (JSC Labtech, Moscow, Russia) with a UV spectrophotometric detector. We described the definition algorithm in detail in our previous work [39]. For the quantitative determination of α-tocopherol, the calibration curve method was used, which was constructed based on the height and area of peaks obtained by chromatography of calibration solutions with a final concentration of 10–100 μg mL−1. Calibration solutions were prepared by diluting a standard solution obtained by diluting α-tocopherol from a Merck kit (Millipore, Billerica, MA, USA) in methanol, with an initial concentration of 1 mg mL−1. The concentration was expressed in μg per g DW.

2.5. LED Electro-Physical Parameters, Bioeconomy Effect Calculation and Control of the Cultivation Media Parameters

To calculate the content of metabolites per unit volume of biomass (Ci), the following formula was used:
Ci (mg L−1) = MDW B
where MDW is the metabolite content per gram of dry biomass (mg g−1 DW), and B is the culture biomass density (g L−1).
The power consumption (P) was calculated in accordance with Ohm’s law [40] for a circuit section using the formula (for a standard resistive load):
P = U I
where U is the voltage across the LED strip, V; I is the current consumed by the LED strip, A.
The power consumption, considering the efficiency of the power supply unit (Pη), was calculated using the formula:
Pη (W h−1) = P η−1 0.01
where P is the power consumed by the LED strip, W; η is the efficiency factor, which, in accordance with the 80+ Bronze certificate for the selected power supply, is 82%; 0.01 is the coefficient for converting percentages to part of a unit.
The power consumed over 20 days of cultivation (Pw) was calculated using the formula:
Pw (kW h−1) = Pη ∑T
where ∑T is the total illumination time over 20 days under a 16/8 photoperiod, h.
The energy required to obtain 1 g of metabolite (Pg) was calculated using the formula:
Pg (kW h−1 g−1) = Pw (Ci k)−1
where Pw is the power consumed over 20 days of cultivation, kW h−1; Ci is the substance concentration, g L−1; k—is the conversion factor for converting mg L−1 to g L−1 (103) and µg L−1 to g L−1 (106).
The parameters of the cultivation medium (concentration of dissolved oxygen (O2), hydrogen index (pH), and content of dissolved salts (Salts) in the initial BBM were determined using an AZ-86031 water-quality multimonitor (AZ Instrument, Taiwan).

2.6. Data Analysis

Statistics obtained in the Microsoft Excel version 1903 software using single-factor dispersion analysis (ANOVA) [41]. The reliability of the differences between the indicators was assessed using the Tukey–Kramer post hoc test. Differences at p ≤ 0.05 were considered statistically significant. In all experiments, we used 3 biological and 5 technical replicates.

3. Results

3.1. Biomass and Growth Rate

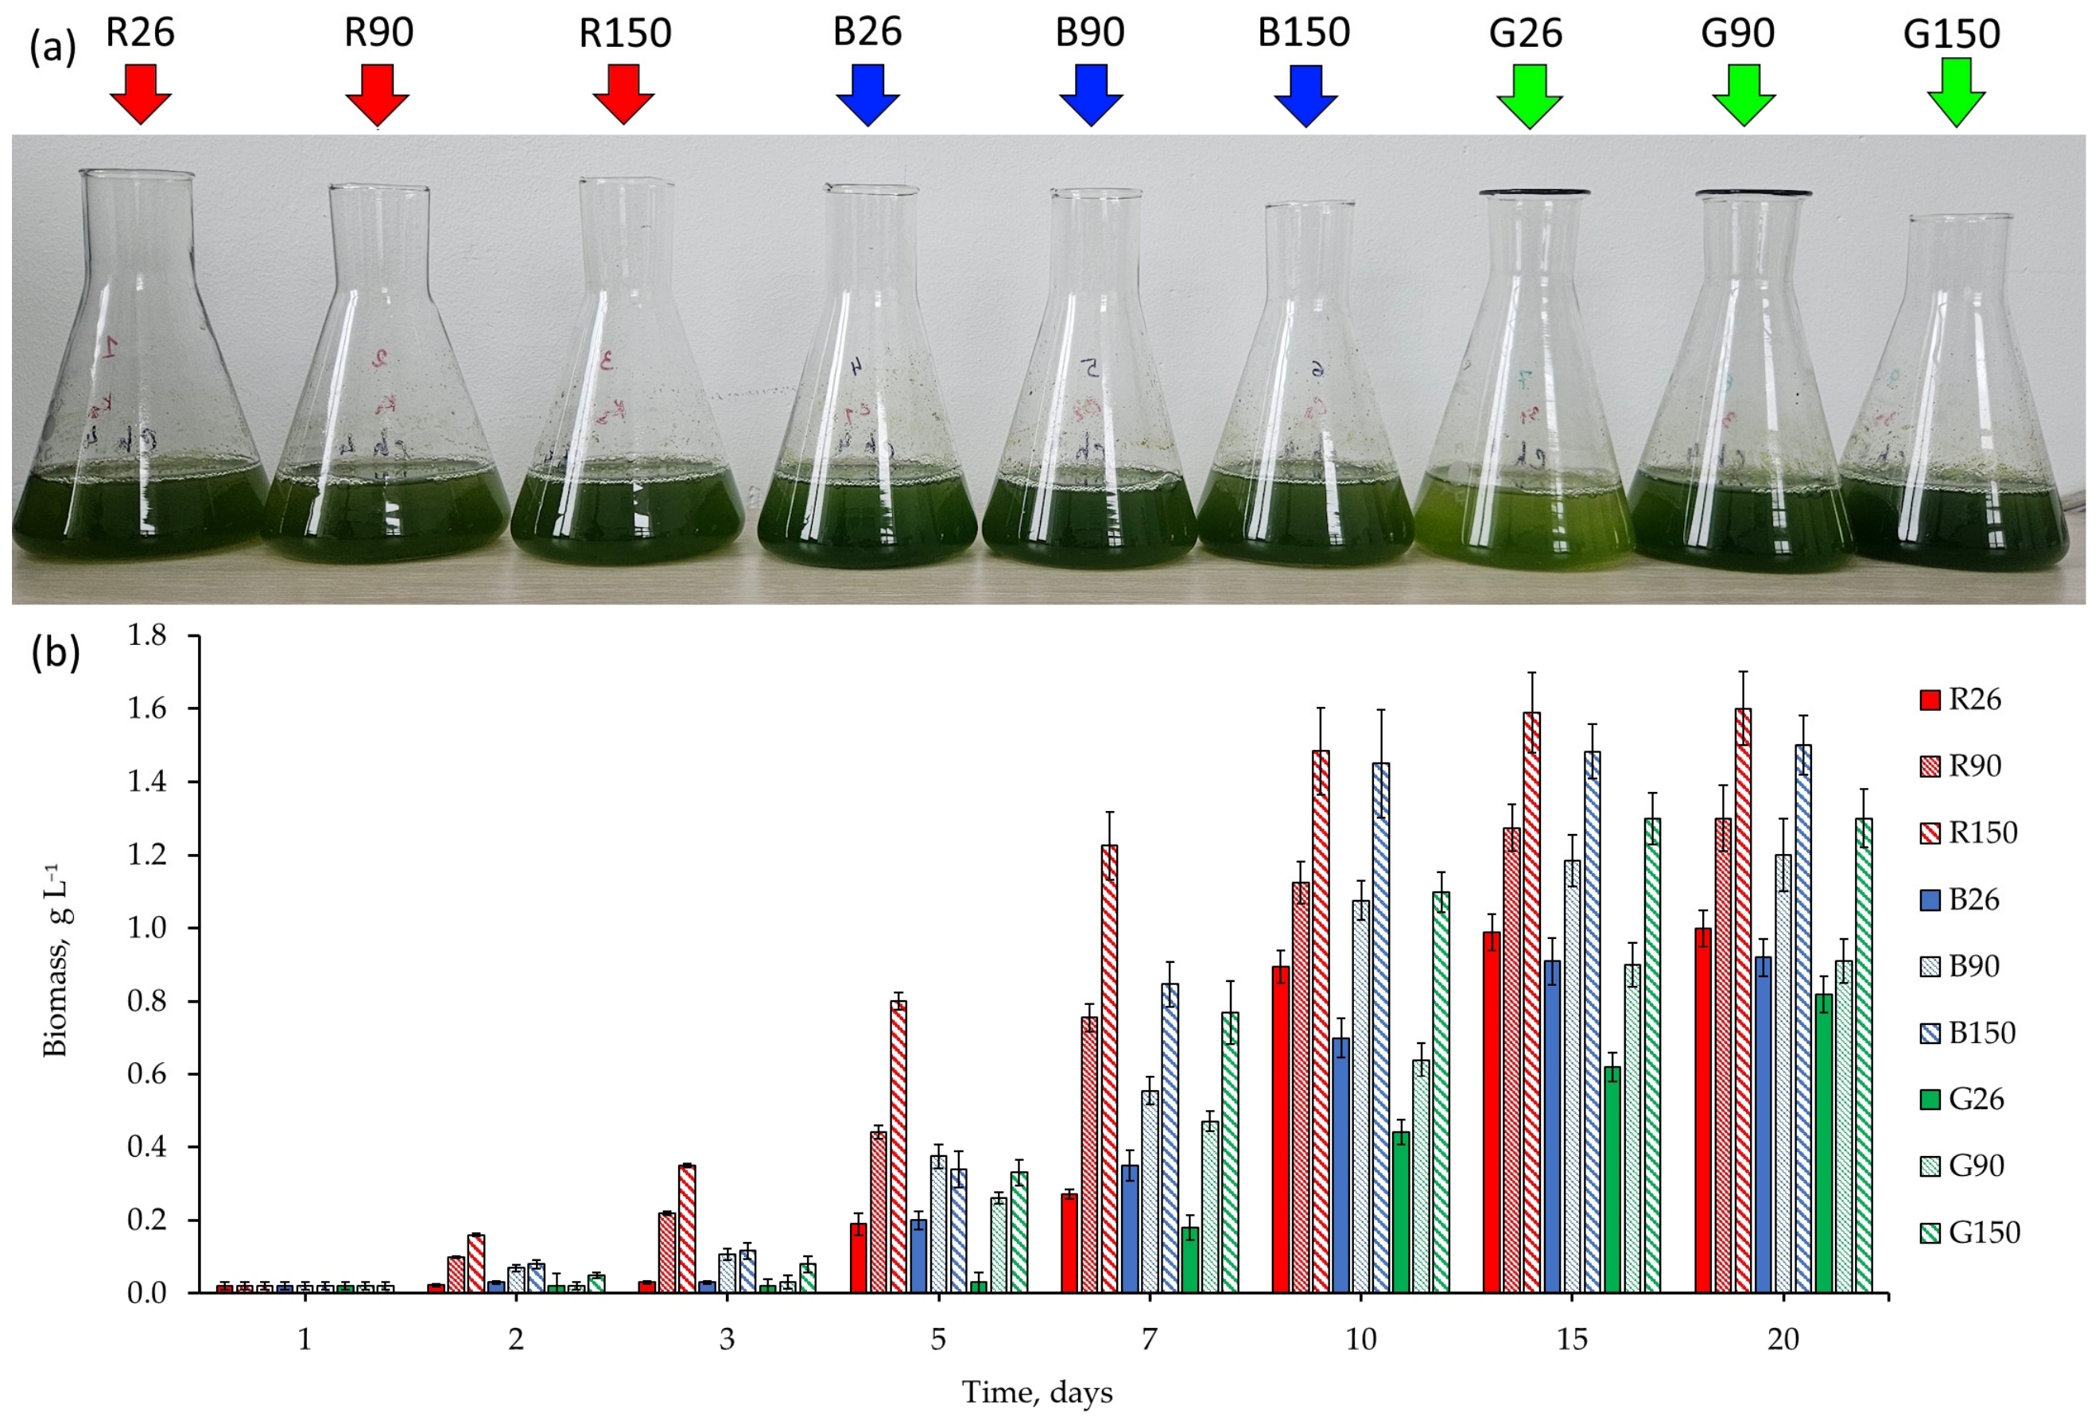
The growth kinetics of the strain Pleurastrum insigne CAMU MZ–Ch4 demonstrated a clear dependence on the spectral composition and intensity of light (Figure 2).
Cultures of Pleurastrum insigne CAMU MZ–Ch4 reached the stationary phase by day 15 under red and blue light at all intensities tested (26, 90, and 150 µmol m−2 s−1). Under green light, the culture only reached the stationary phase by this time at the 150 µmol m−2 s−1. At lower PPFDs (26 and 90 µmol m−2 s−1), biomass growth continued until day 20.
The lag phase duration varied with the conditions. When exposed to red and blue light with an intensity of 26 µmol m−2 s−1, the duration of the lag phase was 3 days, and at intensities of 90 and 150 µmol m−2 s−1 for only 1 day. When exposed to green light, the lag phase lasted for 5 days at 26 µmol m−2 s−1, 3 days at 90 µmol m−2 s−1, and 1 day at 150 µmol m−2 s−1.
The highest growth rates for red and blue light occurred during the first 1–2 days at high intensities (90 and 150 µmol m−2 s−1), shifting to days 3–5 at 26 µmol m−2 s−1. For green light, the peak growth rate occurred on days 3–5 at intensities of 90 and 150 µmol m−2 s−1, while at 26 µmol m−2 s−1, it remained on the linear segment of the growth curve from day 5 to day 7.
A comparison of biomass accumulation between spectra showed the most significant differences in the red–green and blue–green pairs during the early growth stages (days 3–5), where the difference reached 6.7 to 7.3 times at 26 and 90 µmol m−2 s−1. By day 15, significant differences persisted mainly between green light and the other spectra.

3.2. Biomass Productivity

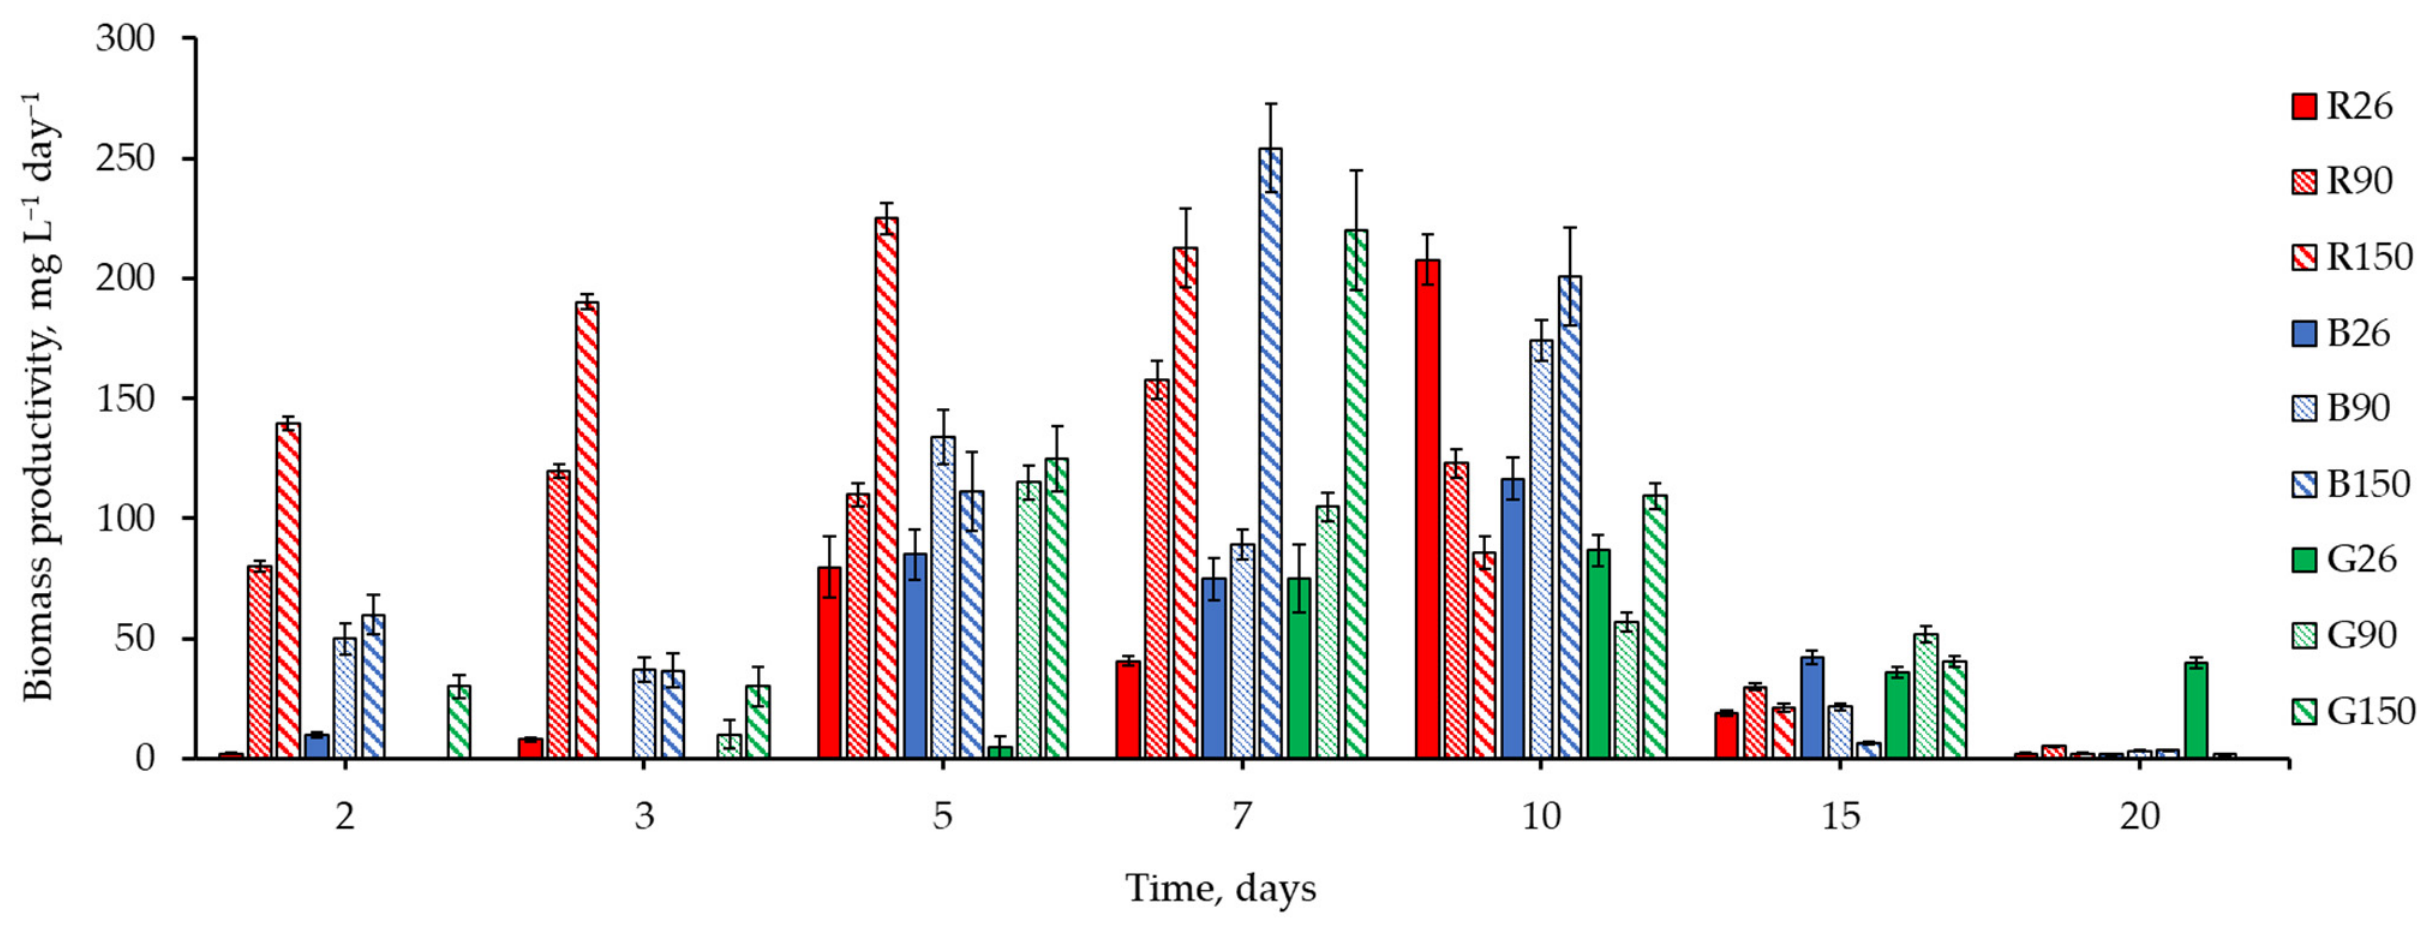
The biomass productivity of the Pleurastrum insigne CAMU MZ–Ch4 strain varied significantly depending on the spectral composition (red, blue, and green) and light intensity (26, 90, and 150 µmol m−2 s−1) (Figure 3). In all experimental variants, the specific growth rate peaked between days 5 and 10 of cultivation, which corresponds to the exponential growth phase. We recorded the maximum productivity (254.3 ± 20.5 mg L−1 day−1) on day 7 under blue light at an intensity of 150 µmol m−2 s−1. However, this value did not differ statistically from those obtained under red (212.7 ± 16.2 mg L−1 day−1) and green (220.0 ± 24.8 mg L−1 day−1) light at the same intensity.
By days 15–20, productivity under all light regimes decreased to minimum values, indicating the culture’s transition to the stationary growth phase. Overall, blue and red light provided higher peak productivity values compared to green light at equal intensities.
The optimal intensities of red, blue, and green light for Pleurastrum insigne CAMU MZ–Ch4 differed. An increase in PPFD from 90 to 150 µmol m−2 s−1 did not lead to a significant increase in productivity and, in some cases, even decreased it. This indicated an approach to the threshold of light saturation.
The obtained data confirmed the non-linear nature of the dependence of growth on light conditions and emphasised the need for precise selection of the light spectrum and intensity to maximise biomass yield.

3.3. CO2 Biofixation

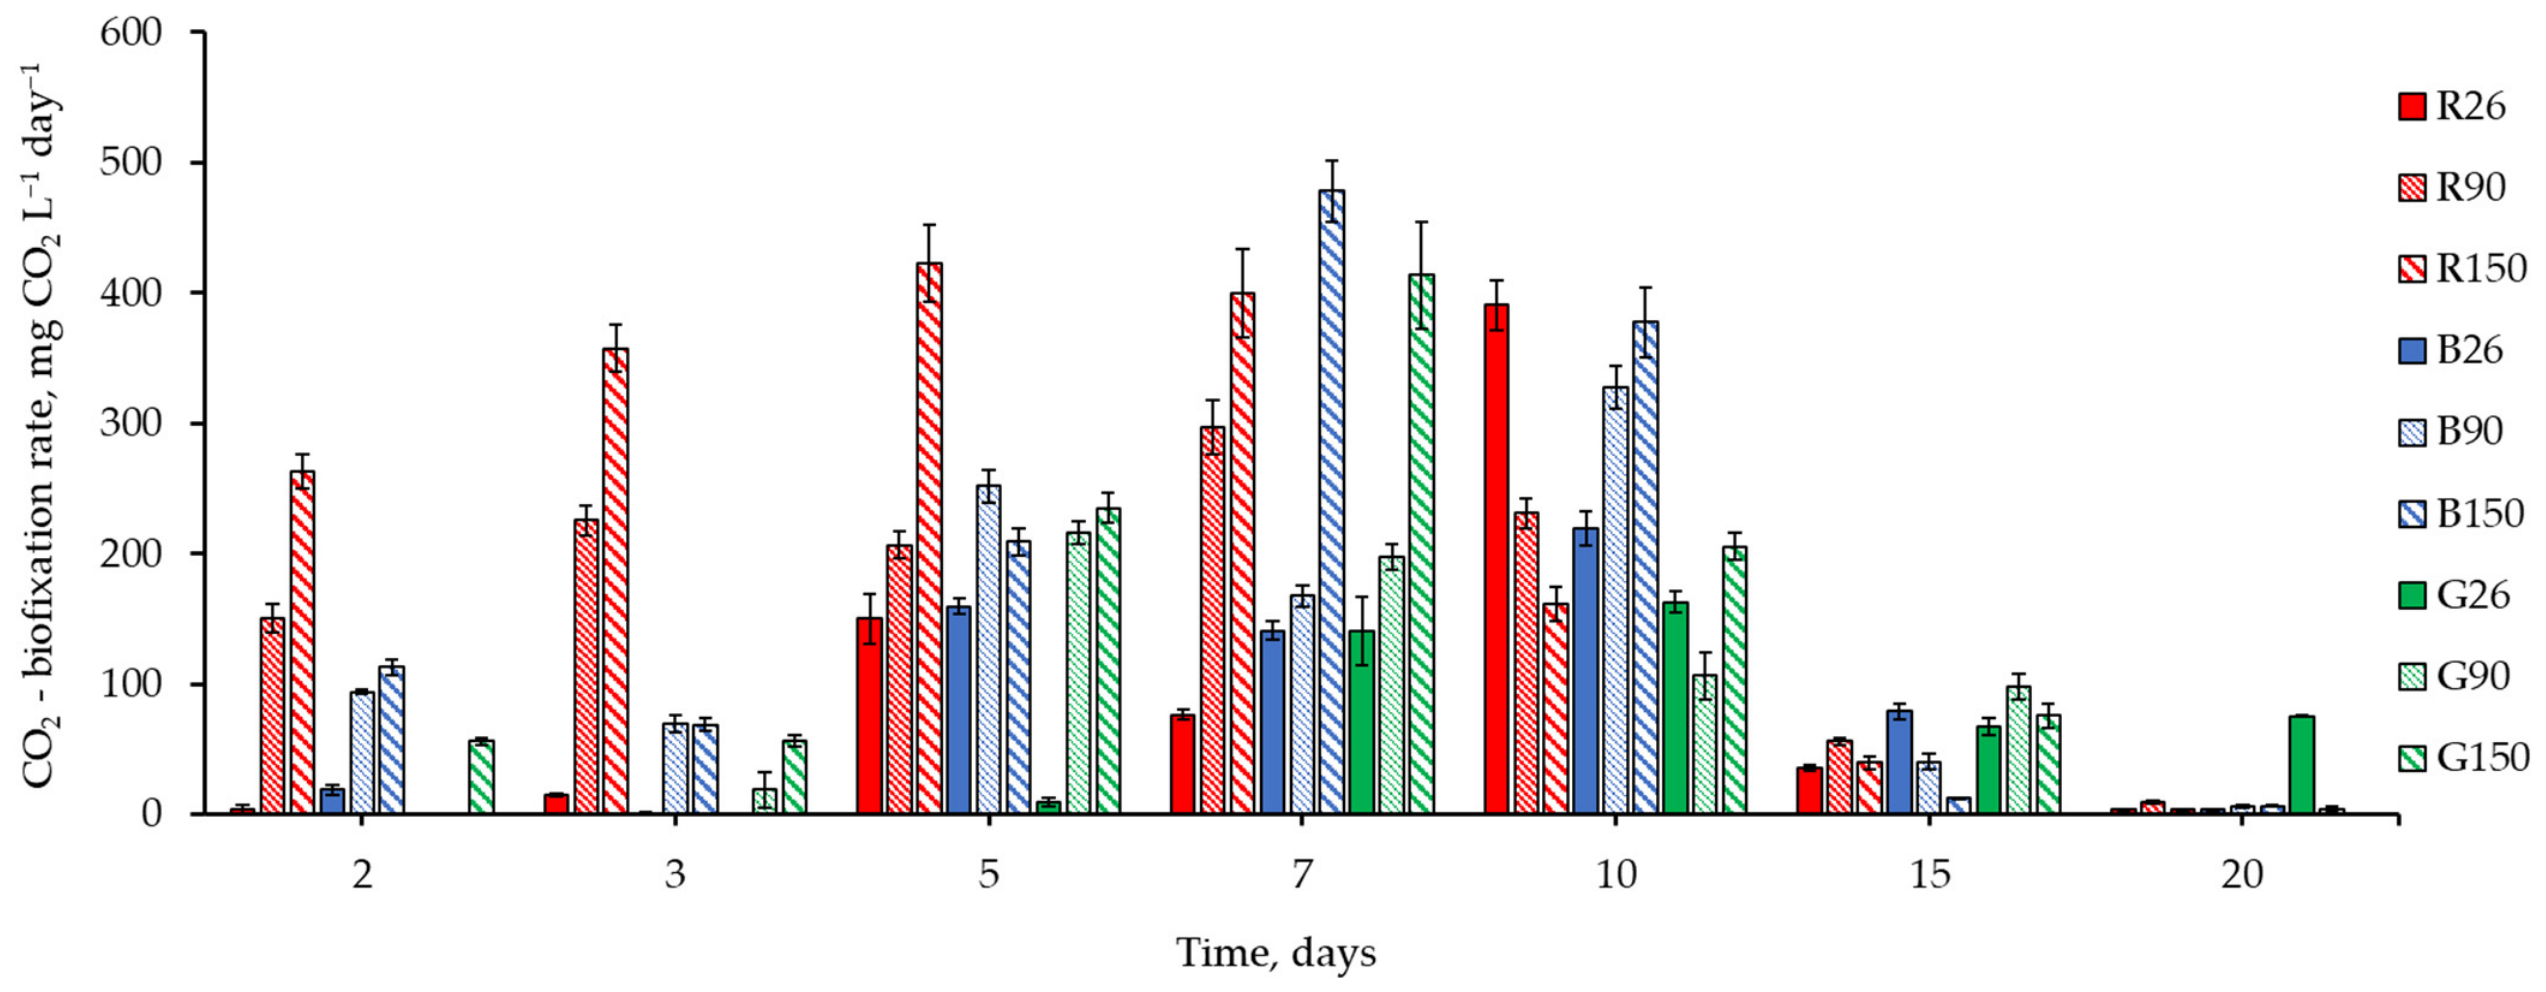
The intensity of photosynthetic CO2 fixation by the strain Pleurastrum insigne CAMU MZ–Ch4 demonstrated a pronounced dependence on the spectral composition and intensity of illumination (Figure 4).
During the experiment, the CO2 biofixation rate varied widely—from 3.8 to 478.1 mg CO2 L−1 day−1. The maximum values were recorded at high light intensity (150 µmol m−2 s−1) and were 423.0 ± 29.6 mg CO2 L−1 day−1 for red light, reached on the 5th day of cultivation, and 478.1 ± 23.9 mg CO2 L−1 day for blue light on the 7th day; for green, the peak value of 413.6 ± 41.4 mg CO2 L−1 day−1 was also recorded on the 7th day.
Analysis of the variability of the CO2 absorption rate before reaching the maximum showed that the most stable dynamics is characteristic of a high-intensity red light (150 µmol m−2 s−1), where the values fluctuated in a relatively narrow range (262.9–423.0 mg CO2 L−1 day−1). In contrast, the greatest variability occurred under low-intensity red light (26 µmol m−2 s−1), where the fixation rate spanned two orders of magnitude (3.8–390.6 mg CO2 L−1 day−1). Other light regimes exhibited much smaller fluctuations.
For most conditions, a clear peak in CO2 fixation appeared between days 5 and 10, coinciding with the culture’s active exponential growth phase. By days 15–20, the bio-fixation rate in all variants dropped to minimal or near-zero levels, indicating a transition to the stationary growth phase, where net biomass gain and CO2 uptake slow down.
Low-intensity red light (26 µmol m−2 s−1) produced the most prolonged and pronounced CO2 biofixation peak. With increasing light intensity (90, 150 µmol m−2 s−1), the peak absorption rate increased, but the peak itself became more acute and short-lived. Blue light showed a similar effect to red light on the kinetics of biofixation, but provided one of the highest values of the biofixation rate, especially at high intensity (150 µmol m−2 s−1). Green light consistently resulted in the lowest biofixation rates across all intensities.
The most efficient photosynthetic CO2 fixation occurred under medium and high blue- and red-light intensities (90, 150 µmol m−2 s−1) during exponential growth (days 5–10). Green light was the least effective for stimulating photosynthesis and CO2 biofixation in this strain, which was consistent with its weak absorption by the main photosynthetic pigments. The data confirmed the relationship between the growth rate (biomass productivity) and the rate of CO2 biofixation, since their peaks coincided in time.
To maximise the Pleurastrum insigne CAMU MZ–Ch4 strain sequestration potential of the cultivation under blue or red light with an intensity of 90–150 µmol m−2 s−1, the use of green light for the purpose of fixing CO2 is impractical.

3.4. Chlorophyll a, b, and Carotenoid Content

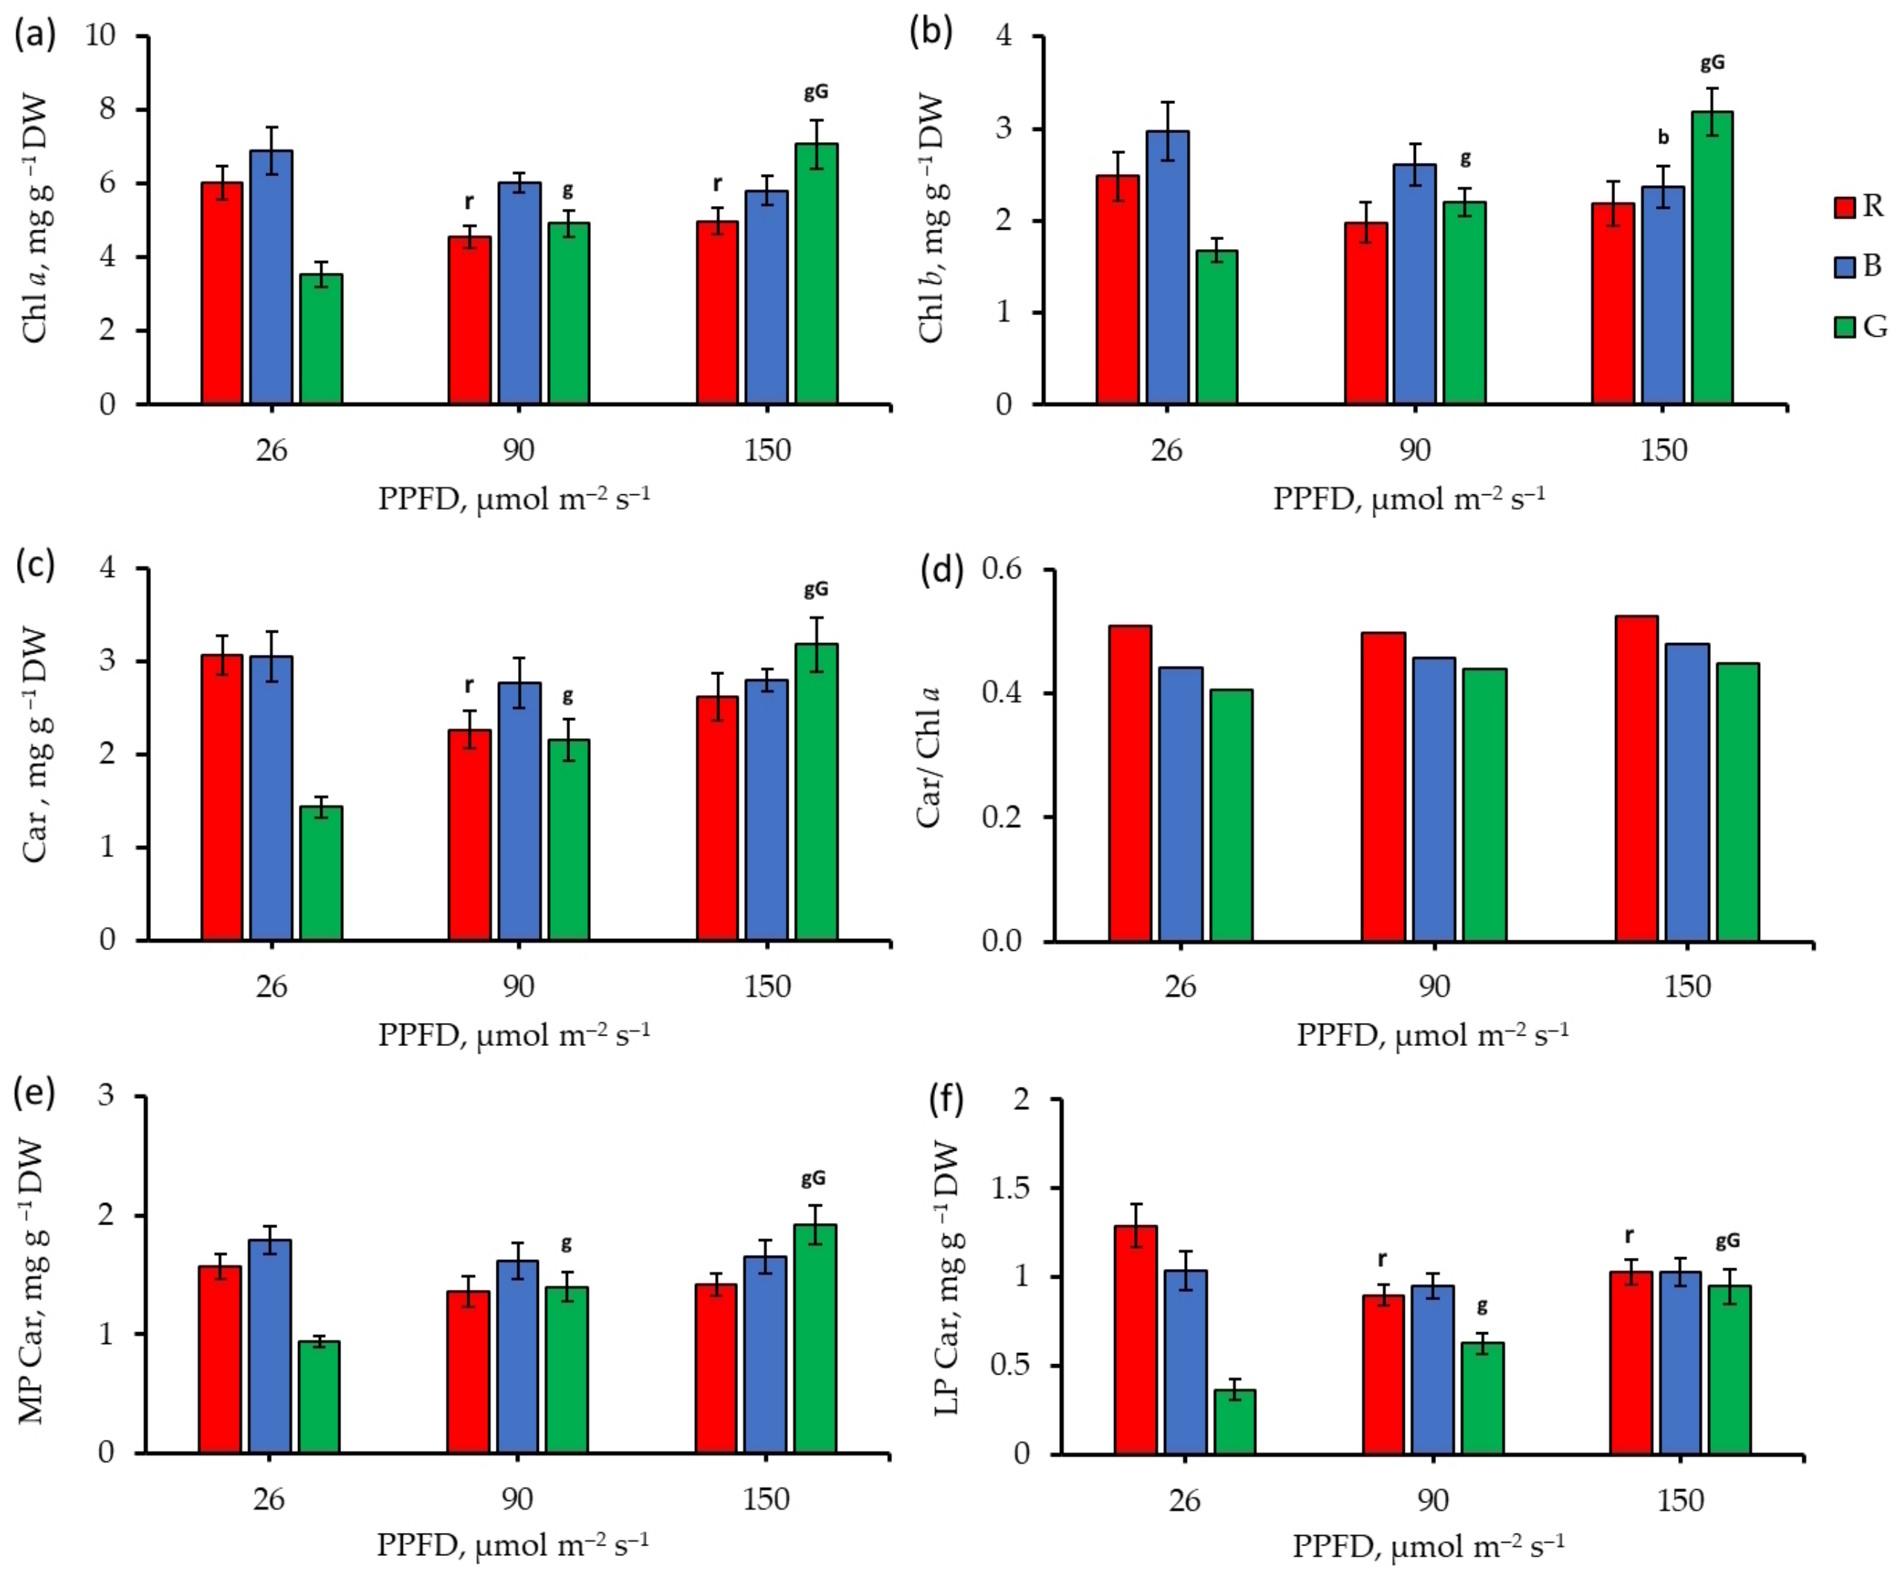
The photosynthetic apparatus of the strain Pleurastrum insigne CAMU MZ–Ch4 responded differently to changes in PPFD under various spectral light compositions. Under red light at an intensity of 90 µmol m−2 s−1, the Chl a content decreased by 24.3%, and at an intensity of 150 µmol m−2 s−1, it decreased by 17.4% relative to the control (Figure 5a). An increase in the intensity of blue light did not cause significant differences in the content of Chl a relative to intensity 26 µmol m−2 s−1. Exposure to green light with an intensity of 90 µmol m−2 s−1 initiated an increase in concentration by 40%, and at 150 µmol m−2 s−1 by 117.5%, relative to the group cultivated at an intensity of 26 µmol m−2 s−1. At 26 µmol m–2 s−1, the Chl a content under green light exposure was lower, by 1.7 and 2 times, compared to red and blue light, respectively. At 90 µmol m−2 s−1, the significant increase in Chl a concentration under blue light exposure, relative to red and green light, was 32.5% and 22.8%. Exposure to light at an intensity of 150 µmol m−2 s−1 caused a significant increase in Chl a content under green light compared to red light (42%); however, the R-B and B-G pairs showed no significant differences.
Red and blue light at intensities of 90 and 150 µmol m−2 s−1 did not cause significant changes in Chl b content relative to the group cultivated at 26 µmol m−2 s−1 (Figure 5b). In contrast, green light at 90 and 150 µmol m−2 s−1 increased Chl b content by 31% and 89.3%, respectively, compared to biomass grown at 26 µmol m−2 s−1. At the intensity of 26 µmol m−2 s−1, green light resulted in a Chl b content that was significantly lower—by 47.6% and 76.8%—than under red and blue light, respectively. At 90 µmol m−2 s−1, blue light produced a significantly higher Chl b content than red light, by 31.8%.
For Pleurastrum insigne CAMU MZ–Ch4, red light at 90 µmol m−2 s−1 significantly reduced the Car content by 35.2% compared to the group cultivated at 26 µmol m−2 s−1 (Figure 5c). Blue light at intensities 26–90 µmol m−2 s−1 and 26–150 µmol m−2 s−1 did not cause significant changes in Car concentration. The green light initiated an increase in the Car content in the biomass of Pleurastrum insigne CAMU MZ–Ch4 by 50% and 120.8% with an increase in intensity from 26 to 90 µmol m−2 s−1 and from 26 to 150 µmol m−2 s−1, respectively. At the intensity of 26 µmol m−2 s−1, green light led to a significantly lower Car concentration by 53.1% and 52.8% than red and blue light, respectively.
The content of MP Car in the biomass of Pleurastrum insigne CAMU MZ–Ch4 significantly increased under the influence of green light at intensities of 90 and 150 µmol m−2 s−1 by 1.5 and 2 times, respectively, relative to the group cultivated at 26 µmol m−2 s−1 (Figure 5d). Exposure to red and blue light did not cause significant changes with increasing light intensity. At 26 µmol m−2 s−1, the MP Car content under green light exposure was significantly lower compared to red and blue light by 40.1% and 47.5%, respectively. Exposure to light at an intensity of 90 µmol m−2 s−1 did not cause significant differences between R, B, and G. At an intensity of 150 µmol m−2 s−1, green light initiated a significant 35.2% increase in the MP Car content in the biomass of Pleurastrum insigne CAMU MZ–Ch4, relative to red light.
The content of the LP Car fraction in the biomass of Pleurastrum insigne CAMU MZ–Ch4 significantly decreased by 30.2% with an increase in red light intensity from 26 to 90 µmol m−2 s−1 (Figure 5e). Blue light did not cause significant changes in LP Car content with increasing intensity. Green light, however, initiated the accumulation of LP Car at 90 and 150 µmol m−2 s−1, increasing it by 70.3% and 156.8%, respectively, compared to the level at 26 µmol m−2 s−1. At the intensities of 26 and 90 µmol m−2 s−1, green light resulted in LP Car content that was 3.5 and 1.4 times lower than under red light, and 2.8 and 1.5 times lower than under blue light. At the highest intensity of 150 µmol m−2 s−1, the LP Car content showed no significant differences between the red, blue, and green light conditions.
The Car/Chl a ratio increased as the intensity of R, B, and G light increased (Figure 5f). At all intensity values, the Car/Chl a ratio varied in the order R > B > G.

3.5. Lipid Content

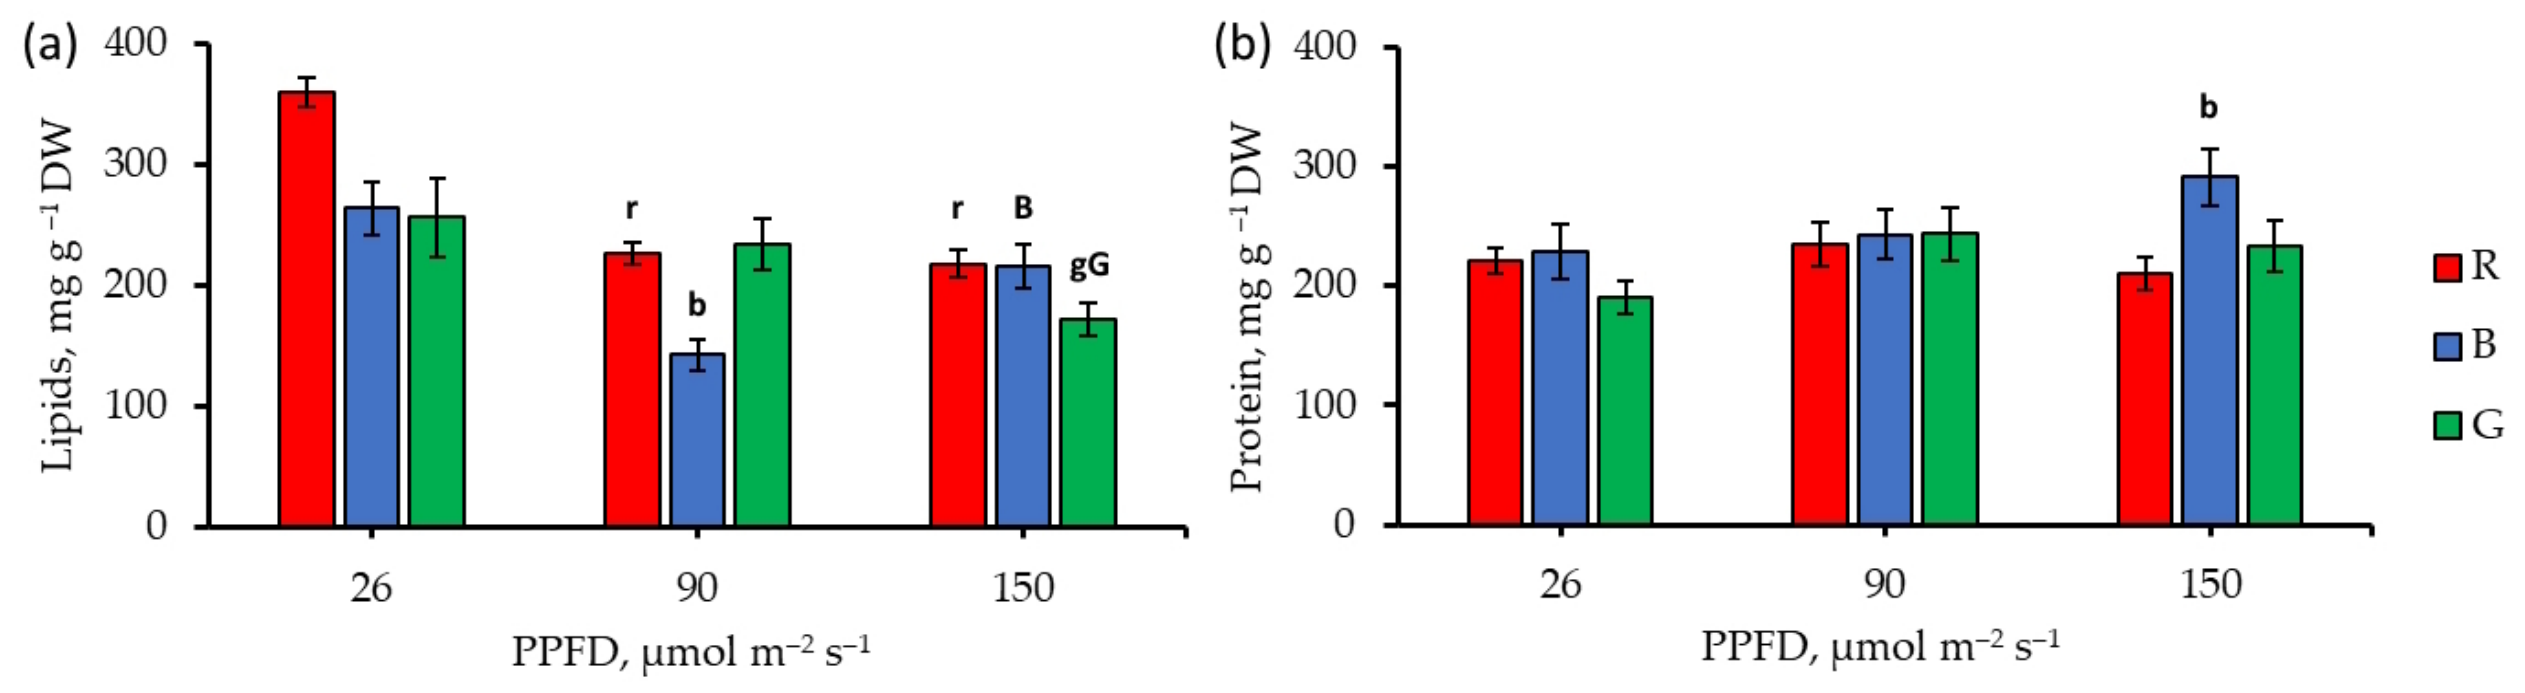
The lipid content in the biomass of the strain Pleurastrum insigne CAMU MZ–Ch4 demonstrated a pronounced dependence on the light spectrum and intensity (Figure 6).
Cultivation under red light at an intensity of 26 µmol m−2 s−1 yielded maximum lipid accumulation (360 mg g−1). With an increase in the intensity of red light to 90 and 150 µmol m−2 s−1, the lipid content decreased by 36.9% and 39.4%, respectively. When exposed to blue light with an intensity of 90 µmol m−2 s−1, the lipid content decreased from 264 to 143 mg g−1. When exposed to green light with an intensity of 150 µmol m−2 s−1, the lipid content decreases from 256 to 172 mg g−1.
A comparative analysis of spectra at the same intensity revealed several patterns. At intensity 26 µmol m−2 s−1, red light induced significantly higher lipid content (1.7 and 2 times higher than under blue and green light, respectively). At an intensity of 90 µmol m−2 s−1, the lipid concentration was minimal, 32.5% and 22.8% lower than under red and green light of the same intensity, respectively. At intensity 150 µmol m−2 s−1, the lipid concentration did not depend on the spectral composition of the light.
Thus, low-intensity red light was the most effective for stimulating lipogenesis in this strain. At high intensity, spectral specificity was absent.

3.6. Protein Content

When exposed to blue light with an intensity of 150 µmol m−2 s−1, the protein content increased by 27% relative to the control (Figure 6b). An increase in the intensity of red and green light did not cause significant differences in protein content.
When exposed to blue light with an intensity of 150 µmol m−2 s−1, the protein content was higher by 32.5% and 22.8% relative to exposure to red and green light. At other lighting intensities, the protein content did not differ depending on the spectral composition of the light. In general, the optimal conditions for initiating protein synthesis in the Pleurastrum insigne CAMU MZ–Ch4 strain were blue light at 150 µmol m−2 s−1.

3.7. Ascorbic Acid, Phenolic Compound and α-Tocopherol Content

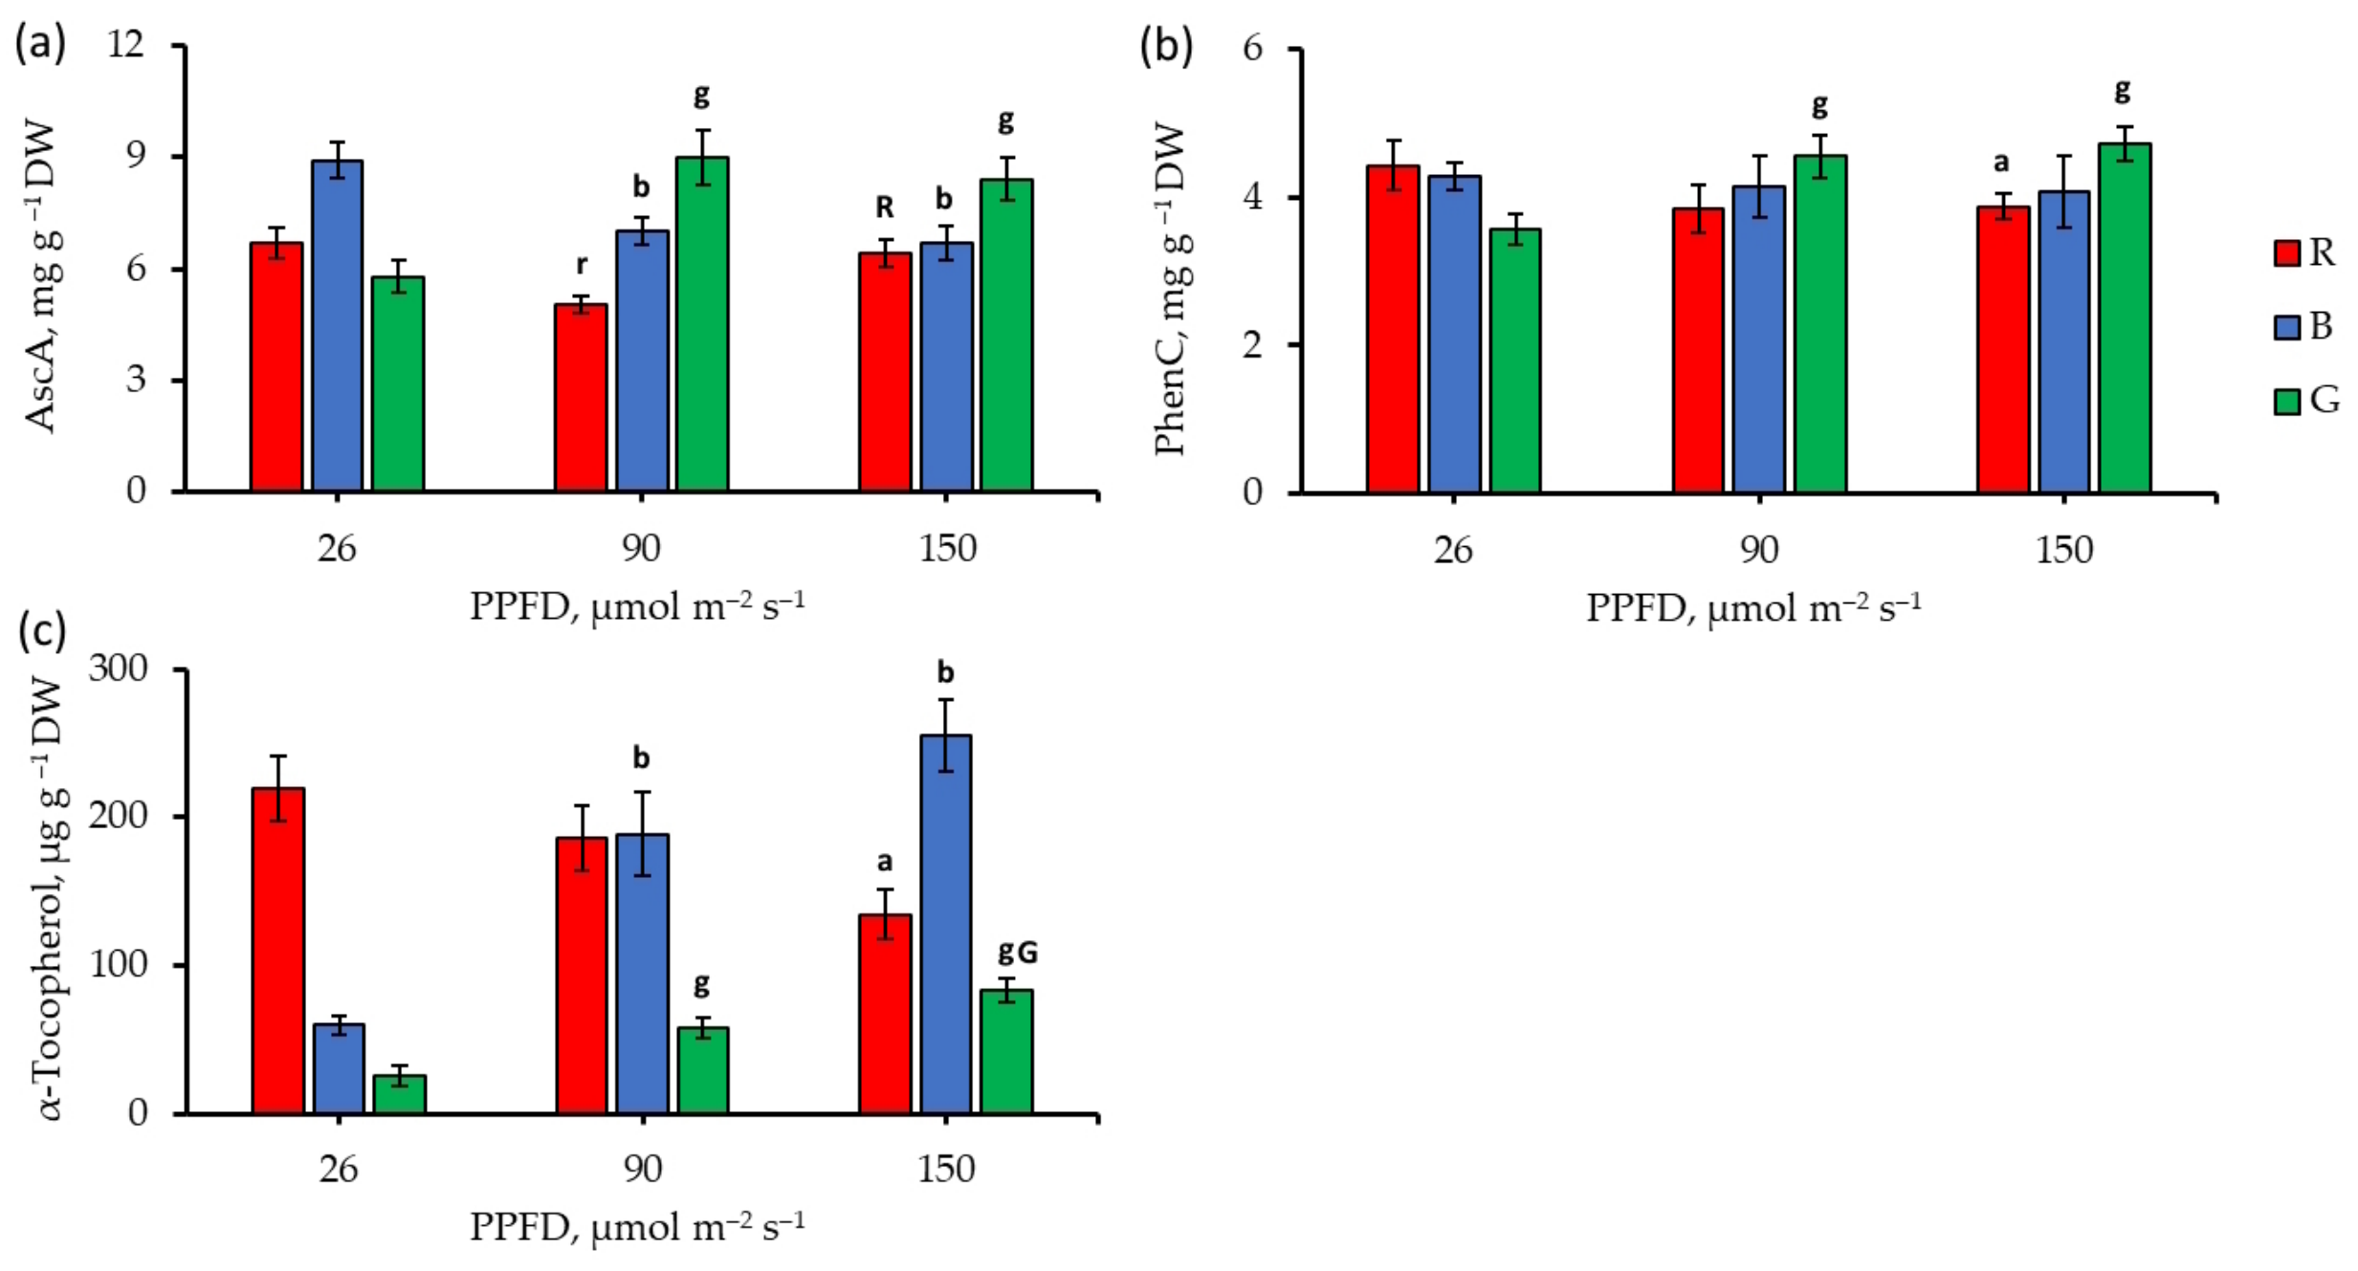
The ascorbic acid content in the cells varied with the light spectrum and intensity (Figure 7a).
An increase in the intensity of blue light to 90 µmol m−2 s−1 caused a decrease of 21.2%, at 150 µmol m−2 s−1 by 24.8% relative to 26 µmol m−2 s−1. Exposure to green light with an intensity of 90 µmol m−2 s−1 initiated an increase in concentration by 55%, and at 150 µmol m−2 s−1 by 44.8%, relative to the group cultivated at an intensity of 26 µmol m−2 s−1. Green light induced an increase in AscA content by 55% at 90 µmol m−2 s−1 and by 44.8% at 150 µmol m−2 s−1 compared to 26 µmol m−2 s−1.
A comparative analysis of the spectral effect of light showed that at 26 µmol m−2 s−1, the concentration of AscA was significantly higher in blue light relative to red and green light by 24.8% and 34.9%, respectively; at 90 µmol m−2 s−1, the maximum AscA content was in green light (by 78.0% and 28.1% higher than under red and blue lighting, respectively). At 150 µmol m−2 s−1, green light also maintained a significantly higher concentration of AscA compared to red light.
The content of phenolic compounds selectively responded to the spectral conditions (Figure 7b). An increase in the intensity of green light to 90 µmol m−2 s−1 caused a 27.5% increase, at 150 µmol m−2 s−1 by 32.2% relative to 26 µmol m−2 s−1. At 26 µmol m−2 s−1, the content of phenolic compounds decreased when exposed to red and blue light by 19.4% and 16.6%. At 90 µmol m−2 s−1, there was no significant difference between red, blue, and green light. At intensity 150 µmol m−2 s−1, green light caused a considerable increase in phenolic content, by 22% relative to red light.
The α-tocopherol content varied significantly with light spectrum and intensity (Figure 7c). The α-tocopherol content at an intensity of red light 150 µmol m−2 s−1 significantly decreased by 38.7% relative to 26 µmol m−2 s−1 (Figure 7c). An increase in the intensity of blue light to 90 µmol m−2 s−1 caused a 3.2 times increase in α-tocopherol, at 150 µmol m−2 s−1 by 4.3 times relative to 26 µmol m−2 s−1. Exposure to green light with an intensity of 90 µmol m−2 s−1 initiated an increase in the concentration of α-tocopherol by 130%, at 150 µmol m−2 s−1 by 229.2%, relative to the group cultivated at an intensity of 26 µmol m−2 s−1. At 26 µmol m−2 s−1, the α-tocopherol content was significantly higher when exposed to red light by 3.7 and 8.7 times relative to blue and green light. At 90 µmol m−2 s−1, the significant decrease in the concentration of α-tocopherol when exposed to green light, relative to red and blue, was 3.18 and 3.24 times, respectively. At intensity 150 µmol m−2 s−1, green light induced a decrease in α-tocopherol compared to red (by 1.6 times) and blue (by 3.1 times) light.
Thus, low-intensity red light was optimal for α-tocopherol accumulation. Blue and green light exhibited a stimulating effect only at higher intensities.

3.8. Bioeconomy Effect

To recalculate the bioeconomic efficiency of the cultivation parameters, we expressed the data for target metabolite content per unit culture volume (Table 3).
We have calculated the energy consumption of LED strips for each lighting mode (Table 4). The highest power consumption (24.05 Wh−1) was observed for red LED strips at a light intensity of 150 µmol m−2 s−1. With this consumption, the total electricity consumption for 20 days was 7.7 kWh−1. This value exceeded that under green and blue light of equal intensity by 1.72 and 3.03 times, respectively. The minimum energy consumption corresponded to blue LED strips at an intensity of 26 µmol m−2 s−1, which in total provided a power consumption of 0.95 kWh−1 over 20 days, while red and green LED strips consumed 1.4 and 1.3 times more energy at the same intensity.
Based on an analysis of power consumption data for LED light sources and the volumetric concentrations of target metabolites, we calculated the specific energy consumption for their production. The heat map (Table 5) shows the specific energy consumption for metabolite production. The cultivation process under red light at an intensity of 26 µmol m−2 s−1 yielded the minimum energy expenditure (kWh per gram of product) for both lipids and α-tocopherol. Energy costs in this mode were 9% and 38.8% lower than when using blue and green light of the same intensity, respectively. Blue light with an intensity of 26 µmol m−2 s−1 was most energy efficient for the synthesis of Chl a, Chl b, Car, protein, AscA and PhenC. Exposure to blue light of minimal intensity provided the best balance between the accumulation of target metabolites and the energy consumption for their production. Blue light with an intensity of 26 µmol m−2 s−1 provided the most profitable and environmentally friendly approach for the integrated use of biomass. Cultivation under green light was characterised by the highest specific energy consumption at low intensity (26 µmol m−2 s−1). Increasing the intensity of lighting led to a decrease in the energy efficiency of obtaining metabolites. Even when accounting for the average values of metabolite-specific energy intensity, green monochromatic light is not economically rational. The results confirmed that changing the spectrum and intensity of light allows not only redirecting metabolic pathways but also selecting the most economically advantageous conditions for obtaining certain valuable compounds.

4. Discussion

4.1. Biomass Growth and Productivity

For the Pleurastrum insigne CAMU MZ–Ch4 strain, biomass density and growth rate increased with increasing intensity of all monochromatic light types (red, blue, and green) throughout cultivation. The increase in productivity with increasing light intensity is consistent with most studies, but the increase is not unlimited, and as soon as the light intensity reaches a certain threshold, growth slows down due to saturation of the photoabsorption centre and photoinhibition [3]. This limit is quite variable, depending on the strain belonging to a particular taxonomic group, as proved by the example of a large sample of marine and freshwater microalgae, and the optimal intensity ranges from 60 µmol m−2 s−1 to 1500 µmol m−2 s−1 [2,3], with the maximum and minimum characteristic for marine strains Dunaliella salina (Chlorophyta) [42] and Microchloropsis salina (formerly Nannochloropsis salina) (Eustigmatophyceae) [43]. For most strains such as Chromochloris zofingiensis (formerly Chlorella zofingiensis), Chlorella vulgaris, Haematococcus lacustris (formerly Haematococcus pluvialis), Scenedesmus obliquus, Tetradesmus obliquus (formerly Scenedesmus obliquus) (Chlorophyta), the optimum light intensity is 150 µmol m−2 s−1 [3]. Soil strains in this aspect have been less studied. Still, Pleurastrum insigne CAMU MZ–Ch4, like microalgae-hydrobionts, accumulated maximum biomass at 150 µmol m−2 s−1. The strain Scenedesmus acuminatus (formerly Scenedesmus falcatus)KU.B1 had a high growth rate at an increase in light intensity from 100 to 1000 µmol m−2 s−1 [44]. From the point of view of the effect of the spectral composition of light on the final biomass density of the Pleurastrum insigne CAMU strain MZ–Ch4, it corresponded to the behaviour of many previously presented strains. Thus, according to the review [2] and the work of Marchese et al. [15], most strains of Botryococcus braunii, Chlorella vulgaris, Tetradesmus obliquus, Tetraselmis suecica (Chlorophyta), and Limnospira platensis (formerly Arthrospira platensis) (Cyanobacteriophyta), red light provides a higher biomass density relative to blue and green of the same intensity, as well as for Chlorella sp. [45]. However, for some species, Auxenochlorella pyrenoidosa (formerly Chlorella pyrenoidosa), Scenedesmus quadricaud, Tetradesmus obliquus (Chlorophyta), and Diacronema lutheri (Haptophyta), blue provides higher biomass density parameters relative to red and green, and only in the case of Porphyridium purpureum (formerly Porphyridium cruentum) (Rhodophyta) does green provide higher biomass density relative to red and blue, as well as the work of Huang et al. [3]. In the case of Phaeodactylum tricornutum (Bacillariophyta), cultivation of the strain with both red and blue light resulted in the same final biomass density in the culture [46]. Muriellopsis sp. MCH-35 [47], when exposed to red light during 8 cultivation days, also showed increased biomass density relative to blue light. It was also found for this strain that an increase in the intensity of blue light from 80 µmol m−2 s−1 to 350 µmol m−2 s−1 did not cause significant changes in the final biomass concentration; on the contrary, with an increase in the intensity of red light from 80 µmol m−2 s−1 to 350 µmol m−2 s−1, the biomass density increased by 2 to 2.5 times. In the case of Pleurastrum insigne CAMU MZ–Ch4, a significant increase in biomass density was found with an increase in the intensity of blue, red, and green light which is partially consistent with the data for Muriellopsis sp. MCH-35 [47]. Previously, Marchese et al. [15] reported that exposure to red and blue light enhances biomass accumulation, whereas green light has the opposite effect. A general analysis of the above information indicates significant variation in biomass growth characteristics when exposed to monochromatic light of a specific spectral composition, depending on other cultivation conditions.
The productivity parameters of Pleurastrum insigne CAMU MZ–Ch4 biomass varied depending on the spectral composition, intensity, and cultivation time (0.002–0.254 g L−1 day−1). The maximum productivity value was at an illumination intensity of 150 µmol m−2 s−1 for red, blue, and green light on the 7th day. Blue and red light yielded higher productivity values than green light at equal intensities. For comparison, Vadiveloo et al. [48] determined that blue light provided higher productivity values than red light for Nannochloropsis MUR 266 and Nannochloropsis MUR 267 (Eustigmatophyceae). For Nephroselmis sp. (Chlorophyta) [16], the light-stimulating effect varied with intensity. At 3000 lx, green and red light demonstrated productivity three times higher than at blue light. At 8000 lx, productivity is highest for blue light and the lowest for red, green light has an average stimulating effect. At 15,000 lx, the highest productivity of biomass is when exposed to green light, the intermediate value is blue, and the minimum productivity is typical for red light. Peak biomass productivity of Pleurastrum insigne CAMU MZ–Ch4 is in the range corresponding to highly productive representatives of green algae (Dunaliella sp. ABRIINW-SH33, Dunaliella sp. ABRIINW-CH2, Chlorella vulgaris FACHB-31, Auxenochlorella protothecoides—formerly Chlorella protothecoides (Chlorophyta), Spirulina sp. (Cyanobcateriophyta) LEB 18), or exceeds them, even when they are grown in an atmosphere with increased volume fractions of carbon dioxide [49], which makes Pleurastrum insigne CAMU MZ–Ch4 a potent object of biotechnology.
Differences in the productivity of Pleurastrum insigne CAMU MZ–Ch4 when exposed to R, B, and G light may be a complex reaction involving regulation at the level of photoreceptors, stress responses, and energy redistribution. Green light goes beyond the optimal absorption range and is a stress signal, probably caused by a lack of illumination. Its effect probably activates specific photoreceptors that activate the accumulation of secondary carotenoids and other cytoprotectors in microalgae cells [2,17]. On the contrary, red and blue light are effectively absorbed by photosystems and ensure carbon dioxide fixation and high biomass productivity [2,3,50,51]. In addition, differences in the production of new Pleurastrum insigne CAMU MZ–Ch4 biomass are also observed between these spectra, even at identical intensities. This may be due to the different effects of red and blue light on the cell cycle, where blue promotes the transition from G1 phase to S phase, and red promotes the transition from S phase to G2 phase [50], which may underlie differences in biomass accumulation established for the strain under study. Complex signalling networks play a key role in this regulation, in which photoreceptors such as phototropin and possibly others interact with transcription factors that control the expression of photoprotection and carbon metabolism genes [52]. In addition, regulation at the photoreceptor level usually occurs very quickly. Accordingly, differences in biomass productivity when exposed to light of different spectral composition, established as early as the 2nd day of Pleurastrum insigne CAMU MZ-Ch4 cultivation, primarily indicate this regulatory mechanism. Therefore, the differences established for Pleurastrum insigne CAMU MZ-Ch4 are the result of the regulation of light metabolism, where green light activates the cell’s defence mechanisms against stress, reducing biomass productivity, while red and blue light, on the contrary, increase its productivity.

4.2. Chlorophyll a, b, and Carotenoid Content

Light quality represents a fundamental abiotic factor regulating the growth and development of photosynthetic organisms [53,54]. Light is a crucial source for plant photosynthesis and autotrophic growth. Chl a and Chl b are the main pigments of the light-harvesting complex with maximum absorption in the red and blue ranges, which determines the high potential of red and blue light as a source of photosynthetic energy [55].
The spectral composition and light intensity differ in the content of photosynthetic pigments and in the efficiency of photosynthesis among microalgal representatives [56,57,58]. Zhao et al. [58], using Dunaliella salina as an example, found that blue and red light increase photosynthetic efficiency. The rate of light absorption by chlorophylls in algal cells is higher when exposed to blue and red light than to green light, which is associated with a decrease in light energy dissipation and an increase in the photochemical efficiency of chlorophyll. Li et al. [59] also found that Dunaliella salina MACC/C43 cells absorb more photons in the blue part of the spectrum than in the red. When the efficiency of photosynthesis changes, the quantitative composition of pigments and the structure of the photosynthetic apparatus may change. Previously, Songserm et al. [44] and Hotos et al. [60] established an increase in the concentration of Chl a and Chl b for Scenedesmus acuminatus and Dunaliella salina with an increase in light intensity in the range of 100–1000 and 40–160 µmol m−2 s−1, respectively. In another study, Chauhan et al. [56], using the example of Micractinium pusillum (Chlorophyta), found that a change in the intensity of white light from 50 to 350 µmol m−2 s−1 causes an increase in the concentration of total chlorophyll and a further increase to 650 µmol m−2 s−1 already reduces it. As previously established by Songserm and co-authors [44] for Scenedesmus acuminatus KU.B1, such a decrease is associated with a reduction in photosynthetic efficiency when the light intensity exceeds a certain value.
Monochromatic light, unlike full-spectrum light, has a more specific effect. Thus, for Pleurastrum insigne CAMU MZ–Ch4, we found a significant increase in the concentration of Chl a and Chl b only as the PPFD of green light increased. Such a mechanism may be a compensatory response, similar to rearrangements in response to a lack of illumination, since green light falls outside the absorption peaks of the primary photosynthetic pigments. In addition, the nature of the chlorophyll ratio in the biomass of Pleurastrum insigne CAMU MZ–Ch4 changed at different intensities of monochromatic light of various types (R, B, G). The Chl a and Chl b content was higher when exposed to green light, which is comparable to the results for Dunaliella salina cultivated at 8000 lx light intensity R, B, G [60]. Similarly, Dunaliella salina, when cultivated at a light intensity of 40 µmol m−2 s−1, had the highest content of Chl a and Chl b when exposed to blue light, and the lowest content of green light [58], which is comparable to our results for Pleurastrum insigne CAMU MZ–Ch4 cultivated at 26 µmol m−2 s−1. Although Hamouda et al. [45] established that for Chlorella sp. at a light intensity of 35 µmol m−2 s−1, the content of Chl a and Chl b is maximal when exposed to red light, and minimal under blue light. The same patterns Nezhad and Mansouri [57] established for Dunaliella salina, Li et al. [59] established for Dunaliella salina MACC/C43 (120 µmol m−2 s−1) and Dong et al. [46] established for Phaeodactylum tricornutum (65 µmol m−2 s−1), but the latter is a diatom with other photosynthetic pigments.
The carotenoid content of Pleurastrum insigne CAMU MZ–Ch4 also varied depending on the intensity and spectral composition of the light. Carotenoids perform several key functions in microalgal cells, including ensuring photoabsorption, photoprotection, and energy transfer, as well as providing antioxidant protection [61]. Accordingly, the quantitative and qualitative composition of carotenoids in a microalgal cell varies depending on the characteristics of the lighting source [14]. Previously, some researchers reported an increase in the carotenogenic effect of several strains (Micractinium pusillum, Scenedesmus acuminatus, and Dunaliella salina) as the intensity of white light increased [44,56,60]. The effect of monochromatic (red, blue, and green) light in the intensity ranges from 3000 to 15,000 lx also causes an increase in the carotenoid content in the biomass of Nephroselmis sp. [16]. On the contrary, Diaz-MacAdoo et al. [47] note a decrease in the carotenoid content in the biomass of Muriellopsis sp. by 37.5% and 33.3% for blue and red light, respectively, with an increase in intensity from 80 to 350 µmol m−2 s−1.
Monochromatic red and blue light at 26 µmol m−2 s−1 have a comparable carotenogenic effect, which is higher than green light in the biomass of Pleurastrum insigne CAMU MZ–Ch4. A similar effect of light exposure was established by Hamouda et al. [45] for Chlorella sp. at 35 µmol m−2 s−1, and by Zhao et al. [58] for Dunaliella salina at 40 µmol m−2 s−1. Previously, Zhao et al. [58] noted that at low intensity of blue and red light, Dunaliella salina has a strongly reduced expression of the LUT5 and ABA2 genes responsible for β-carotene degradation, and Li et al. [59], using the example of Dunaliella salina HG-01, found that when exposed to red and blue light with an intensity of 50 µmol m−2 s−1 the transcripts involved in carotenoid metabolism are activated, which enhances their biosynthesis. As a result, there are no significant changes in the concentration of β-carotene between exposure to blue and red light, which is consistent with our data for Pleurastrum insigne CAMU MZ–Ch4 at 26 µmol m−2 s−1. However, low-intensity green light probably increases gene expression in Pleurastrum insigne CAMU MZ–Ch4 aimed at β-carotene degradation, leading to a decrease in the total amount of carotenoids in the LP Car fraction, which contains β-carotene. Also, when the intensity increases to 90 µmol m−2 s−1 in the biomass of Pleurastrum insigne CAMU MZ–Ch4, the carotenogenic effect shifts towards blue light, as in the case of Dunaliella salina [57]. Also, for the Pleurastrum insigne CAMU MZ–Ch4 strain, we observed a carotenogenic effect of green light at 150 µmol m−2 s−1, similar to that of the Chlorella sp. but at an intensity of 35 µmol m−2 s−1 [45]. In other studies, Li et al. [59] found increased carotenoid content in Dunaliella salina biomass cultivation when exposed to red light relative to blue.
Analysing the above data, it becomes clear that the qualitative and quantitative composition of photosynthetic pigments follows specific patterns within a relatively narrow range of light intensity. In the case of monochromatic light, for most microalgae, it is the intensity that has a more pronounced effect on the nature of the accumulation of pigments in the photosynthetic apparatus than its spectral composition. However, the variety of units of measurement for concentrations, conditions, modes and duration of cultivation, variations in light intensity, ecological groups, and strains does not allow us to unambiguously establish the patterns of accumulation of photosynthetic pigments depending on the intensity and composition of the spectrum.

4.3. CO2—Biofixation

The Pleurastrum insigne CAMU strain MZ–Ch4 provided peak CO2 absorption rates at maximum illumination intensity. The strain had the maximum CO2 absorption intensity when exposed to red light; CO2 biofixation when exposed to blue and green light was significantly lower. Increased absorption of carbon dioxide when exposed to red light is consistent with a general increase in biomass growth, which Li et al. [62] associate with the activation of specific photoreceptors by red light, and Wongsnansilp and Khamcharoen [55] with an increase in carbonic anhydrase activity under the influence of red light.
The rate of CO2 fixation for representatives of green microalgae is 120–1100 mg·L−1·day−1 [49]. This indicator for Pleurastrum insigne CAMU MZ–Ch4 in our experiment corresponds to these indicators. For comparison, Chlorella vulgaris demonstrates record values (up to 6240 mg·L−1·day−1), but only with a CO2-enriched (2–6.5% by volume) gas mixture and with an optimal nutrient composition [49]. At the same time, the CO2 fixation rate of the studied strain is more than four times higher than that reported for Cc. littorale (82 mg CO2 L−1 day−1) under similar conditions [63].
The rate of CO2 utilisation depends on the type of algae, cultivation conditions, including CO2 concentration, temperature, pH, and, particularly, the light regime [49,63,64]. Our data also indicate the dependence of CO2 uptake on the spectral composition of light. Thus, the optima of monochromatic illumination for Pleurastrum insigne CAMU MZ–Ch4 identified by us will ensure an increase in the efficiency of biological carbon capture technologies when using this strain in biotechnology.

4.4. Lipid Content

The issue of initiation or inhibition of lipogenesis in microalgal cells with a change in light intensity remains controversial. The content of lipids and the direction of their transformation vary greatly depending on the range of intensity, spectral composition of light, cultivation mode, as well as on the specific features of microalgae [2,14]. As noted by Li et al. [65], the induction of lipid biosynthesis can occur in response to both increases and decreases in light intensity, which creates a certain contradiction.
On the one hand, increasing the intensity of white light often leads to lipid accumulation. Many scientists have described the effects of lipid accumulation with increasing light intensity in the following strains: Chlorella sp. [66], Micractinium pusillum (Chlorophyta) [56], Chlorella sp. and Nannochloropsis sp. (Eustigmatophyceae) [67], as well as Limnospira maxima (Cyanobacteriophyta) [68]. The accumulation of lipids during increased light flux is associated with the accumulation of lipophilic cytoprotectors in fats capable of inactivating ROS, shielding the light-harvesting complex, protecting it from photodamage [69], as well as accumulating excess energy in the form of lipids to protect the cell from photochemical damage [47].
On the other hand, data demonstrate the opposite trend. For the same species, Diacronema lutheri and Chlorella sp., other studies have recorded a decrease in lipid content under high light intensities [66,67]. Presumably, such an inversion is associated with exceeding a species-specific intensity threshold, which triggers photoinhibition and leads to a general suppression of metabolism, including lipid biosynthesis [64,70].
The accumulation of lipids at low light intensity is associated with the cell’s response to the low availability of an energy source for autotrophic metabolism. This reaction is accompanied by a restructuring of cellular metabolism to optimise energy supply and accumulation of high-energy compounds [65,71,72]. We also observed this phenomenon for Pleurastrum insigne CAMU MZ–Ch4, in which the lipid content was maximal at an intensity of 26 µmol m−2 s−1, which is consistent with data for other species such as Dunaliella tertiolecta (Chlorophyta) and Thalassiosira gravida (formerly Thalassiosira rotula) (Bacillariophyta) [73].
However, as the intensity of monochromatic light increases, the regulation of lipogenesis by light exhibits a complex, spectrally dependent pattern. In our study of Pleurastrum insigne CAMU MZ–Ch4, lipid content decreased under the influence of blue and red light at 90 µmol m−2 s−1, as well as green light at 150 µmol m−2 s−1, compared to the low-intensity variant. The decrease in lipid content is likely associated with exceeding the species-specific threshold of light intensity, which triggers processes of metabolic inhibition, including lipid biosynthesis [64,70]. At the same time, at high intensity, blue light, on the contrary, stimulated lipogenesis in Pleurastrum insigne CAMU MZ–Ch4, which may be due to the mechanism of dissipating excess blue light energy through the activation of lipid biosynthesis [47]. A similar reaction was observed in Chlamydomonas reinhardtii (Chlorophyta) exposed to red–orange and blue light [65].
According to the literature, lipid content varies significantly with the spectral composition of the light. For example, unlike Pleurastrum insigne CAMU MZ–Ch4 in the biomass of Nephroselmis sp. (Chlorophyta), blue light increases the lipid content [16], but only in a specific range of intensity. At the same time, green light elicits a similar response in these strains, in which lipid concentration decreases with increasing light intensity. Green light with an intensity of 150 µmol m−2 s−1 demonstrates a lipogenic effect compared to red and blue light for the Pleurastrum insigne CAMU strain MZ–Ch4, which corresponds to the reaction of Chlorella sp. effects of monochromatic light of various spectral compositions [45]. Possible reasons for such variability are species-specific, spectrally sensitive regulation of key enzymes of lipid metabolism [65] and the indirect effect of light through changes in nutrient assimilation, biosynthesis of signalling molecules, and CO2 fixation kinetics [62]. The latter is confirmed by the work of Kim et al. [66], in which increasing light intensity led to a decrease in lipid content at both low (0.04% v/v) and high (3% v/v) CO2 concentrations in Chlorella sp. At the same time, studies demonstrate opposite or other patterns. For example, Chlorella vulgaris and Nannochloropsis sp. blue light had a more pronounced lipogenic effect compared to red [48], while in Pleurastrum insigne, the effect of blue light under similar conditions was either comparable to red or lower, and for Tetradesmus obliquus at an intensity of 150 µmol m−2 s−1, differences in lipid content under the influence of red, blue, and green light were statistically insignificant (21.7–24.7%) [74].
Thus, the accumulation of lipids in microalgae in response to light is determined by a complex interaction of its intensity, spectral composition, and specific features of metabolic pathways, which emphasises the lack of a universal pattern.
Our data on Pleurastrum insigne CAMU MZ–Ch4 confirm that, at the same intensity but different spectral composition, light exerts a differential effect on lipid accumulation. However, a comparative analysis of the literature reveals both similarities and significant differences in the responses of different species. Therefore, spectrally dependent lipogenesis in microalgae does not follow a single rule. The observed interspecific differences are probably due to the taxonomic specificity of photoreceptor systems and to differences in the regulation of metabolic pathways involved in lipid synthesis.
The comparative analysis shows that the studied Pleurastrum insigne CAMU strain MZ–Ch4 demonstrates a high biotechnological potential. When cultured under low-intensity red light, this strain exhibits a high lipid content (up to 35%), comparable to or superior to other strains reported in the literature subjected to similar light manipulations [14]. This ability to efficiently perform lipogenesis in conditions of low energy consumption makes Pleurastrum insigne CAMU MZ–Ch4 a promising object for the development of sustainable biotechnologies that meet the principles of bioeconomic: the production of valuable products with minimal energy consumption and reduction in the carbon footprint.

4.5. Protein Content

Changes in the content of the main cellular components, lipids and proteins, in response to light conditions reflect the redistribution of resources between structural, energy, and functional pools. In the vast majority of cultivation scenarios, full-spectrum light causes a decrease in protein content with increasing light intensity, which has been established for several strains as follows: Limnospira maxima (600–1000 µmol m−2 s−1), Chlorella vulgaris (600–800 µmol m−2 s−1) [68], Chlorella sp. (50–900 µmol m−2 s−1) [66], and Micractinium pusillum (50–650 µmol m−2 s−1) [56].
However, when using monochromatic light, this observation is less unambiguous and species-specific. For example, in Nephroselmis sp., red, blue, and green light increased protein content with increasing intensity [16]. In contrast, Rivkin [73] found the opposite trend for Dunaliella tertiolecta (Chlorophyta) and Thalassiosira gravida (Bacillariophyta).
At an intensity of 150 µmol m−2 s−1, blue light enhanced proteinogenesis in Pleurastrum insigne CAMU strain MZ–Ch4, like Chlamydomonas reinhardtii [65] and Nephroselmis sp. [16]. Red light did not cause significant changes in protein content across the studied intensity range, including in Chlamydomonas reinhardtii [65]. In contrast to the data of Abomohra et al. [74] and Nezhad and Mansouri [57], green light, unlike blue light, did not have a proteinogenic effect in the biomass of the Pleurastrum insigne CAMU MZ–Ch4 strain.
The observed metabolic rearrangements are probably associated with light acclimation, during which the photosynthetic apparatus is optimised (including the synthesis of specific pigments and reaction centre proteins) for specific spectral conditions [65].
It should be noted that, within the framework of the present study, no direct correlation was found between the increase in biomass density and protein accumulation in the strain Pleurastrum insigne CAMU MZ–Ch4. This result is consistent with the observations of Nagappan and Kumar [75], who also did not find a correlation between protein content and biomass during the cultivation of Dunaliella tertiolecta, Dunaliella salina, Mychonastes homosphaera (formerly Chlorella minutissima), and Desmodesmus sp. MCC34 (Chlorophyta); however, they did establish a pronounced positive correlation between this parameter and carbohydrate content. This phenomenon may indicate a shift in metabolic fluxes towards the synthesis of alternative storage compounds, primarily polysaccharides, which is particularly characteristic of representatives of the division Chlorophyta [76]. This assumption is consistent with the fact that the standard BBM is initially nitrogen-limited (0.04 g L−1), and further depletion of this element likely occurs during culture growth. Under nitrogen deficiency conditions, protein biosynthesis becomes impossible, whereas metabolic pathways aimed at producing more energy-favourable compounds from available substrates (CO2) are activated [76]. Similar observations were made by Nagappan and Kumar [75], who demonstrated that nitrogen limitation in the medium can increase the polysaccharide content in biomass by up to 1.5 times, with their absolute content reaching up to 30% of dry weight. This effect is also likely observed for the studied strain Pleurastrum insigne CAMU MZ–Ch4. Furthermore, it is known that increased light intensity, as well as exposure to the blue and red spectral ranges, induce the biosynthesis of polysaccharides [76]. This fact may serve as an additional explanation for the absence of a direct correlation between biomass density growth and protein content: as light intensity increases, the nitrogen available for protein synthesis becomes depleted, while excess carbon is channelled into reserve carbohydrates rather than into nitrogen-containing compounds. Thus, the metabolic mechanisms underlying species-specific and spectrum-dependent shifts in the balance of lipids and proteins require further in-depth research to identify universal principles and taxonomic features of regulation.

4.6. Ascorbic Acid, Phenolic Compound and α-Tocopherol Content

Information on the effect of monochromatic light on the content of vitamins and vitamin-like substances is practically absent. At the same time, information on the effect of white light on the vitamin content in microalgal cells is also limited to a few separate and rather phylogenetically scattered studies [17,18,19,20]. Vitamins in microalgal cells more often perform protective functions; ascorbic acid (vitamin C), α-tocopherol (vitamin E), and phenolic compounds (vitamin P) scavenge ROS [77]. Thus, α-tocopherol (vitamin E) is a fat-soluble compound that accumulates in the thylakoid membranes of microalgae. α-Tocopherol is produced by photosynthesis and acts as an antioxidant, donating a hydrogen atom and an electron to a free radical [39]. Ascorbic acid is a water-soluble compound synthesised by plants that exhibits antioxidant properties [78,79]. Ascorbic acid is a key antioxidant that provides photosynthetic processes by neutralising chloroplast hydrogen peroxide synthesised in the Mehler reaction [80]. Phenolic compounds also act as a tool to counteract free radicals by terminating the sequence of chain reactions in lipid peroxidation [44].
The results on the influence of light spectrum and intensity on the accumulation of α-tocopherol in the studied strain Pleurastrum insigne CAMU MZ–Ch4 are consistent with the known species-specificity of this process, identified for other microalgae. For Pleurastrum insigne CAMU MZ–Ch4, an increase in the intensity of red light from 26 to 150 µmol m−2 s−1 significantly reduced the α-tocopherol content. At the same time, exposure to blue and green light stimulated α-tocopherol synthesis, with higher light intensity increasing the effect. This may be due to the fact that α-tocopherol is an effective neutralizer of ROS [77], while blue light with high photon energy stimulates ROS production. Accordingly, the increased content of α-tocopherol under high-intensity blue illumination appears to reflect a protective mechanism aimed at ROS detoxification and the maintenance of cellular homeostasis. In one study, the authors noted that the strains Nannochloropsis oceanica (Eustigmatophyceae) NIVA 2/03 and Rhodomonas salina (Cryptophyceae) also efficiently synthesised α-tocopherol under green light [17].
Moreover, the peak concentrations of α-tocopherol achieved in the experiment with monochromatic light (219.4–255.3 µg g−1 DW) correspond to the previously established concentration range for Pleurastrum insigne CAMU MZ–Ch4 (65–680 µg g−1 DW) under white light illumination and are typical for green microalgae in general [27,28,80].
The spectral characteristics and light intensity had a significant effect on the content of ascorbic acid and phenolic compounds in the cells of the Pleurastrum insigne CAMU strain MZ–Ch4. An increase in the intensity of blue and red light, unlike green, caused a decrease in the concentration of AscA. The content of PhenC increased only with higher green-light intensity. Thus, exposure to blue light on diatom Skeletonema marinoi (Bacillariophyta) CCMP 2092 biomass caused an increase in AscA concentration with an increase in intensity from 150 to 500 µmol m−2 s−1, followed by a decrease at 800 µmol m−2 s−1 [18]. These differences are due to differences in the utilisation of blue light, which, in turn, may be related to the different photoabsorption activity of another predominant type of carotenoid and chlorophylls, responsible for light absorption in the blue–green part of the spectrum, in diatoms compared to Chlorophyta. The dynamics of PheC under the influence of blue light in the Pleurastrum insigne CAMU strain MZ–Ch4 also differed from those in Skeletonema marinoi and Scenedesmus acuminatus. The content of PheC in the same Skeletonema marinoi CCMP 2092 increased with an increase in blue-light intensity from 150 µmol m−2 s−1 to 300 µmol m−2 s−1, followed by a decrease and stabilisation at 500 µmol m−2 s−1 and 800 µmol m−2 s−1 [18]. For Scenedesmus acuminatus KU.B1, concentrations of phenolic compounds decreased with increasing blue-light intensity from 100 to 500 and 1000 µmol m−2 s−1 [44]. In our study, increasing the intensity of blue light did not cause changes in the content of phenolic compounds in the biomass of Pleurastrum insigne CAMU MZ–Ch4.
A comparative analysis of the effects of the spectral composition of light showed that at an intensity of 26 µmol m−2 s−1, the AscA content in the biomass of Pleurastrum insigne CAMU MZ–Ch4 is higher when exposed to blue light relative to red. At an intensity of 90 µmol m−2 s−1 and 150 µmol m−2 s−1, green light had a more pronounced stimulating effect of AscA accumulation in the biomass of Pleurastrum insigne CAMU MZ–Ch4 relative to blue and red light. For phenolic compounds, the dependence of concentration on the spectrum for Pleurastrum insigne CAMU MZ–Ch4 also changed with intensity as follows: at low intensity, green light was the least effective; at a high intensity, green light stimulated the accumulation of PheC relative to red light. The absence of differences between red and blue light in the accumulation of PheC in the studied Pleurastrum insigne CAMU strain MZ–Ch4 is consistent with the data for the green alga Coelastrella sp. BGV, in whose biomass the content of polyphenolic compounds under the influence of blue and blue–red light at 150 µmol m−2 s−1 did not differ [20]. Smerilli et al. [18] noted that blue light at an intensity of 300 µmol m−2 s−1 increased the concentration of phenolic compounds relative to red light in the diatom Skeletonema marinoi CCMP 2092. Similarly, in the case of the diatoms Chaetoceros muelleri and Thalassiosira weissflogii, cultivation in a reactor made of blue plastic initiated an increase in the content of phenolic compounds relative to a reactor made of colourless glass, with intensities of 87 and 114 µmol m−2 s−1, respectively [81]. This increase may be related to the activation of cryptochrome-dependent biosynthetic pathways sensitive to blue light [82]. The concentrations of AscA and PheC established for the studied strain are in the middle of the range typical for microalgae: AscA—0.06–18.79 mg g−1 [27,80], PheC—0.2–58.1 GAE mg g−1.
In general, the accumulation of key antioxidants (α-tocopherol, AscA, and PheC) in the biomass of the microalga Pleurastrum insigne CAMU MZ–Ch4 is a complex process, dependent on the spectral composition and intensity of light, with the observed patterns being distinctly species-specific. The obtained data demonstrate both similarities with the responses of other microalgae and unique responses. The interaction of the “spectrum-intensity” factors determines the nonlinear dynamics of metabolite accumulation, which underscores the importance of precise optimisation of light conditions for targeted biosynthesis. The identified features, such as the effectiveness of green light for the accumulation of AscA and PheC at elevated intensities, as well as the lack of response of PheC to blue light, expand the understanding of the regulation of antioxidant systems in green microalgae and point to the involvement of species-specific photoreceptor systems and signal transduction mechanisms. Overall, the results of the work indicate a significant potential for managing the light regime as a tool for the directed regulation of the antioxidant profile of Pleurastrum insigne CAMU MZ–Ch4 biomass.

4.7. Bioeconomic Effect

Traditionally, the profitability assessment of biotechnological processes using microalgae strains is based on parameters such as growth rate, biomass accumulation, and the concentration of the target metabolite [83]. Approaches to optimising the light regime often follow the same logic: increasing light intensity usually leads to higher productivity, final culture density, and stimulates the synthesis of protective compounds (which are often the target products) [4].
However, this strategy does not account for fundamental differences, such as the cultural response to increased lighting intensity. While the accumulation of the target product can increase linearly or exponentially, the relationship between the growth rate and the final biomass yield is nonlinear. As techno-economic analyses show, this creates a conflict between operational efficiency at the cultivation stage and the overall economic and environmental efficiency of the process, as energy consumption for lighting becomes a dominant cost item and a source of carbon footprint [6,9]. It is known that the greatest environmental impact and cost in biotechnological production are associated with the cultivation stage, especially with energy supply [7], when cultivating microalgae in photobioreactors, electricity costs can account for up to 50% of total expenses [6]. In this case, the high energy intensity of the biotechnological process can offset the environmental benefits of production. Therefore, to achieve sustainability, strategies aimed at optimising the energy efficiency of light use, rather than simply increasing its intensity, are necessary [8].
In this regard, an alternative strategy—cultivation at moderate, energy-saving light intensities—may prove to be more economically and environmentally justified. Accordingly, biotechnological approaches in each specific case, for each strain or target product, require a systematic technical and economic analysis that shifts the focus from increasing the yield of the target product or biomass to optimising the entire production process [8,84].
To determine the most economically and environmentally beneficial cultivation regimes for the Pleurastrum insigne CAMU MZ–Ch4 strain, we applied the criterion of specific energy intensity of production, expressed in kWh−1 of electricity consumed per gram of the target metabolite obtained. This approach aligns with the concept proposed by Wijffels and Barbosa [84], according to which the key performance indicator of a biotechnological process should not be volumetric productivity, but energy efficiency.
The results of the analysis revealed a clear pattern: the highest bioeconomic efficiency (lowest specific energy consumption) for the majority of the studied metabolites of Pleurastrum insigne CAMU MZ–Ch4 corresponded to the minimum illumination intensity in the experiment (26 µmol m−2 s−1). At the same time, we established the spectral specificity of optimal conditions: for the accumulation of lipids and alpha-tocopherol, cultivation under low-intensity red light was the most effective. A blue light of the same intensity ensured maximum energy efficiency in obtaining Chl a, Chl b, Car, lipids, protein, and AscA. Comparative analysis showed that blue light was characterised by the highest, and green light by the lowest, efficiency in converting electrical energy (via light) into the yield of the target product.
Yes, according to the heat map, the energy costs for obtaining a unit of metabolite are high, but this is related to the laboratory scale of the process, which involves low initial biomass concentrations and culture medium volumes that limit the achievement of higher final biomass densities and the accumulation of final products in them.
In general, the obtained data clearly demonstrate that to ensure the bioeconomic efficiency of microalgae-based production, a compromise between productivity and energy consumption is necessary, which is confirmed by our research and the conclusions of Slegers et al. [9] regarding the existence of an optimal, rather than maximal, light intensity for minimising cost. Such approaches can significantly reduce total electricity costs on an industrial scale.

5. Conclusions

The results of the study demonstrate a complex dependence of the productive and biochemical parameters of the microalgal strain Pleurastrum insigne CAMU MZ–Ch4 on the spectral composition and intensity of illumination. We have established that there is no universal lighting mode that simultaneously ensures high productivity of biomass and target metabolites. Certain lighting conditions are necessary to obtain a certain metabolite. Using the example of Pleurastrum insigne CAMU MZ–Ch4, it was shown that exposure to blue and red light with intensities of 90 and 150 µmol m−2 s−1 is optimal for biomass accumulation and CO2 biofixation. At the same time, cultivation of the strain under red illumination of 26 µmol m−2 s−1 is the most energy efficient for lipid production. The accumulation of pigments, AscA, PhenC, and α-tocopherol is most effective when exposed to green light with an intensity of 150 µmol m−2 s−1, and the accumulation of protein when exposed to blue light of the same intensity.
Based on data on the specific energy intensity of metabolic products for Pleurastrum insigne CAMU MZ–Ch4, we have demonstrated that the concept of “more light = more biomass = more product” leads to an increase in energy costs against the background of a decrease in the efficiency of the biotechnological process. Based on the data obtained, as an alternative, we propose a strategy for evaluating the optimisation of the energy efficiency of obtaining a product by calculating its specific energy intensity using this approach for the Pleurastrum insigne CAMU MZ–Ch4 strain, we demonstrated that maximum bioeconomic efficiency is achieved at low blue- and red-light intensity.
The results of this work also confirm the high taxonomic specificity of the light regulation of microalgal metabolism, and for the first time, data on the effect of monochromatic light on the biochemical parameters of soil microalgae are presented. In general, considering our data and data available in the literature, this paper substantiates the need for a transition to intelligent, adaptive, and economically balanced cultivation strategies in which the light regime is selected for a specific target molecule, with the criterion of minimum specific energy intensity.

Supplementary Materials

The following supporting information can be downloaded at https://www.mdpi.com/article/10.3390/phycology6030085/s1. Supplementary materials contain detailed analytical procedures for determining the biochemical parameters studied in the manuscript.

Author Contributions

A.Y.: supervision, biochemical analysis. I.M.: conceptualization, data curation, writing—original draft. A.K.: methodology and formal analysis. S.C.: formal analysis, performed experiments. E.L.: investigation, visualisation. E.S.: formal analysis, performed experiments. M.K.: conceptualization. Y.M.: conceptualization, writing—original draft. S.M.: validation, writing—review and editing. All authors have read and agreed to the published version of the manuscript.

Funding

This publication is based on research carried out with financial support from the Russian Science Foundation (project number 25-14-00125, https://rscf.ru/project/25-14-00125/); the percentage contribution is 80%. The determination of carbon dioxide biofixation was maintained under the theme “Sequestration potential of microalgae and cyanobacteria of anthropogenically transformed ecosystems of the Zaporozhye region under conditions of increasing climate aridization” (FRRS-2024-0003; No. 124040100028-6); the percentage contribution was 10%. The isolation of the algal strain and the manuscript design were performed within the state assignment of the Ministry of Science and Higher Education of the Russian Federation (FFES-2024-0001; No. 124052200012-7); the percentage contribution was 10%.

Institutional Review Board Statement

Not applicable.

Informed Consent Statement

Not applicable.

Data Availability Statement

The original contributions presented in this study are included in the article/Supplementary Material. Further inquiries can be directed to the corresponding author.

Conflicts of Interest

The authors declare no conflicts of interest.

References

  1. Parmar, P.; Kumar, R.; Neha, Y.; Srivatsan, V. Microalgae as next generation plant growth additives: Functions, applications, challenges and circular bioeconomy-based solutions. Front. Plant Sci. 2023, 14, 1073546. [Google Scholar] [CrossRef] [Scilit] [PubMed]
  2. Maltsev, Y.; Maltseva, K.; Kulikovskiy, M.; Maltseva, S. Influence of Light Conditions on Microalgae Growth and Content of Lipids, Carotenoids, and Fatty Acid Composition. Biology 2021, 10, 1060. [Google Scholar] [CrossRef] [Scilit] [PubMed]
  3. Huang, X.; Wang, F.; Rehman, O.U.; Hu, X.; Zhu, F.; Wang, R.; Xu, L.; Cui, Y.; Huo, S. Influence of Light Regimes on Production of Beneficial Pigments and Nutrients by Microalgae for Functional Plant-Based Foods. Foods 2025, 14, 2500. [Google Scholar] [CrossRef] [Scilit] [PubMed]
  4. Markou, G.; Nerantzis, E. Microalgae for high-value compounds and biofuels production: A review with focus on cultivation under stress conditions. Biotechnol. Adv. 2013, 31, 1532–1542. [Google Scholar] [CrossRef] [Scilit] [PubMed]
  5. Masojídek, J.; Torzillo, G. Mass cultivation of freshwater microalgae. In Handbook of Microalgal Culture; Wiley-Blackwell: Malden, MA, USA, 2014; pp. 123–146. [Google Scholar] [CrossRef] [Scilit]
  6. Norsker, N.H.; Barbosa, M.J.; Vermuë, M.H.; Wijffels, R.H. Microalgal production—A close look at the economics. Biotechnol. Adv. 2011, 29, 24–27. [Google Scholar] [CrossRef] [Scilit] [PubMed]
  7. Quinn, J.C.; Davis, R. The potentials and challenges of algae as a source of biofuel: A review of the techno-economic, life cycle, and resource assessment modeling. Bioresour. Technol. 2015, 184, 444–452. [Google Scholar] [CrossRef] [Scilit] [PubMed]
  8. Zijffers, J.W.F.; Janssen, M.; Tramper, J.; Wijffels, R.H. Design process of an area-efficient photobioreactor. Mar. Biotechnol. 2008, 10, 404–415. [Google Scholar] [CrossRef] [Scilit] [PubMed]
  9. Slegers, P.M.; Lösing, M.B.; Wijffels, R.H.; van Straten, G.; van Boxtel, A.J. Scenario evaluation of open pond microalgae production. Algal Res. 2013, 2, 358–368. [Google Scholar] [CrossRef] [Scilit]
  10. Sreenikethanam, A.; Raj, S.; Banu J, R.; Gugulothu, P.; Bajhaiya, A.K. Genetic Engineering of Microalgae for Secondary Metabolite Production: Recent Developments, Challenges, and Future Prospects. Front. Bioeng. Biotechnol. 2022, 10, 836056. [Google Scholar] [CrossRef] [Scilit] [PubMed]
  11. Jawaid, M.; Khan, A. (Eds.) Sustainable Utilization of Carbon Dioxide: From Waste to Product, 1st ed.; Sustainable Materials and Technology; Springer Nature: Singapore, 2023; ISBN 978-981-99-2890-3. [Google Scholar] [CrossRef] [Scilit]
  12. Zhang, P.; Sun, Q.; Dong, Y.; Lian, S. Effects of Different Bicarbonate on Spirulina in CO2 Absorption and Microalgae Conversion Hybrid System. Front. Bioeng. Biotechnol. 2023, 10, 1119111. [Google Scholar] [CrossRef] [Scilit] [PubMed]
  13. Hassou, N.; Ahnyne, R.; Rahhal, R.; Errhif, A.; Gmouh, S. Biovalorization of Algae: An Ecological Approach to Soil Fertilization and Biological Enrichment. In Plant Pathology, Fungal Diversity, and Biotechnological Advances in Agriculture; Jamal Eddine, O., Daghor, L., Tilaoui, M., Chatoui, H., Eds.; Sustainable Landscape Planning and Natural Resources Management; Springer Nature: Cham, Switzerland, 2025; pp. 91–102. ISBN 978-3-031-97665-0. [Google Scholar]
  14. Esteves, A.F.; Gonçalves, A.L.; Vilar, V.J.P.; Pires, J.C.M. Is It Possible to Shape the Microalgal Biomass Composition with Operational Parameters for Target Compound Accumulation? Biotechnol. Adv. 2025, 79, 108493. [Google Scholar] [CrossRef] [Scilit] [PubMed]
  15. Marchese, A.; Lima, S.; Cosenza, A.; Giambalvo, F.; Scargiali, F. Effects of Light Quality Adjustment in Microalgal Cultivation: Flashing Light and Wavelength Shifts in Photobioreactor Design. Processes 2025, 13, 1159. [Google Scholar] [CrossRef] [Scilit]
  16. Sekri, I.; Guermazi, W.; El-khateeb, M.; Hotos, G.N.; Ayadi, H. The Effect of Colors and Light Intensity on the Growth and Biochemical Compounds of the Chlorophyceae Nephroselmis sp. J. Mar. Sci. Eng. 2025, 13, 1452. [Google Scholar] [CrossRef] [Scilit]
  17. Ljubic, A.; Holdt, S.L.; Jakobsen, J.; Bysted, A.; Jacobsen, C. Fatty Acids, Carotenoids, and Tocopherols from Microalgae: Targeting the Accumulation by Manipulating the Light during Growth. J. Appl. Phycol. 2021, 33, 2783–2793. [Google Scholar] [CrossRef] [Scilit]
  18. Smerilli, A.; Orefice, I.; Corato, F.; Gavalás Olea, A.; Ruban, A.V.; Brunet, C. Photoprotective and Antioxidant Responses to Light Spectrum and Intensity Variations in the Coastal Diatom Skeletonema marinoi. Environ. Microbiol. 2017, 19, 611–627. [Google Scholar] [CrossRef] [Scilit] [PubMed]
  19. Smerilli, A.; Balzano, S.; Maselli, M.; Blasio, M.; Orefice, I.; Galasso, C.; Sansone, C.; Brunet, C. Antioxidant and Photoprotection Networking in the Coastal Diatom Skeletonema marinoi. Antioxidants 2019, 8, 154. [Google Scholar] [CrossRef] [Scilit] [PubMed]
  20. Georgieva, Z.; Karcheva, Z.; Toshkova-Yotova, T.; Georgieva, A.; Toshkova, R.; Petrova, D.; Zhiponova, M.; Chaneva, G. Blue Light Enhances the Antioxidant, Antimicrobial, and Antitumor Potential of the Green Microalgae Coelastrella sp. BGV. Plants 2024, 13, 3295. [Google Scholar] [CrossRef] [Scilit] [PubMed]
  21. Ramakrishnan, B.; Maddela, N.R.; Venkateswarlu, K.; Megharaj, M. Potential of Microalgae and Cyanobacteria to Improve Soil Health and Agricultural Productivity: A Critical View. Environ. Sci. Adv. 2023, 2, 586–611. [Google Scholar] [CrossRef] [Scilit]
  22. Sushchenko, R.; Gaysina, L. Prospects for the Use of Algae and Cyanobacteria from Extreme Habitats of Kamchatka in Biotechnology. Appl. Biochem. Microbiol. 2025, 61, 472–486. [Google Scholar] [CrossRef] [Scilit]
  23. Karsten, U.; Holzinger, A. Green Algae in Alpine Biological Soil Crust Communities: Acclimation Strategies against Ultraviolet Radiation and Dehydration. Biodivers. Conserv. 2014, 23, 1845–1858. [Google Scholar] [CrossRef] [Scilit] [PubMed]
  24. Remias, D.; Procházková, L. Ecophysiology of the Conjugating Green Algae (Zygnematophyceae) with Emphasis on Semiterrestrial Habitats and Specialized Metabolic Compounds. Protoplasma 2026. [Google Scholar] [CrossRef] [Scilit] [PubMed]
  25. Laroche, C. Exopolysaccharides from Microalgae and Cyanobacteria: Diversity of Strains, Production Strategies, and Applications. Mar. Drugs 2022, 20, 336. [Google Scholar] [CrossRef] [Scilit] [PubMed]
  26. Treves, H.; Raanan, H.; Kedem, I.; Murik, O.; Keren, N.; Zer, H.; Berkowicz, S.M.; Giordano, M.; Norici, A.; Shotland, Y.; et al. The Mechanisms Whereby the Green Alga Chlorella Ohadii, Isolated from Desert Soil Crust, Exhibits Unparalleled Photodamage Resistance. New Phytol. 2016, 210, 1229–1243. [Google Scholar] [CrossRef] [Scilit] [PubMed]
  27. Maltseva, I.; Yakoviichuk, A.; Maltseva, S.; Cherkashina, S.; Kulikovskiy, M.; Maltsev, Y. Biochemical and Antioxidant Characteristics of Chlorococcum oleofaciens (Chlorophyceae, Chlorophyta) under Various Cultivation Conditions. Plants 2024, 13, 2413. [Google Scholar] [CrossRef] [Scilit] [PubMed]
  28. Yakoviichuk, A.V.; Kochubey, A.V.; Maltseva, I.; Matsyura, A.; Cherkashina, S.V.; Lysova, E.A. Biochemical and antioxidant characteristics of the soil strain Chlorococcum oleofaciens (Chlorophyceae, Chlorophyta) grown in light, dark and bicarbonate conditions. Acta Biol. Sib. 2025, 11, 411–447. [Google Scholar] [CrossRef]
  29. Cherkashina, S.V.; Maltseva, I.A.; Tsupa, K.A.; Yakoviichuk, A.V. Chlorococcum oleofaciens Carbon Dioxide Biofixation Potential Assessment (Chlorophyceae, Chlorophyta) Under Conditions of Nutritional Stress. Nat. Tech. Sci. 2024, 8, 63–71. (In Russian) [Google Scholar] [CrossRef] [Scilit]
  30. Maltsev, Y.I.; Konovalenko, T.V. New Finding of Green Algae with Potential for Algal Biotechnology, Chlorococcum Oleofaciens and Its Molecular Investigation. Regul. Mech. Biosyst. 2017, 8, 532–539. [Google Scholar] [CrossRef] [Scilit]
  31. Bischoff, H.W.; Bold, H.C. Phycological studies IV. In Some Soil Algae from Enchanted Rock and Related Algal Species; University of Texas Publication: Austin, TX, USA, 1963. [Google Scholar]
  32. Wang, X.; Shi, Q.; Liu, N.; Cao, J.; Huang, W. Light Intensity Dependence of CO2 Assimilation Is More Related to Biochemical Capacity Rather than Diffusional Conductance. Plants 2025, 14, 986. [Google Scholar] [CrossRef] [Scilit] [PubMed]
  33. Yakoviichuk, A.; Maltseva, I.; Kochubey, A.; Maltsev, Y.; Lysova, E.; Sheludko, E. Antioxidant Status and CO2 Biofixation of Chlorella Sp. Strain Under Sequential Photoautotrophic Cultivation with Aphotic Induction of Biotechnologically Valuable Compounds Accumulation. Phycology 2025, 5, 75. [Google Scholar] [CrossRef] [Scilit]
  34. Yang, C.-M.; Chang, K.-W.; Yin, M.-H.; Huang, H.-M. Methods for the Determination of the Chlorophylls and Their Derivatives. Taiwania 1998, 43, 116–122. [Google Scholar] [CrossRef] [PubMed]
  35. Hara, A.; Radin, N.S. Lipid Extraction of Tissues with a Low-Toxicity Solvent. Anal. Biochem. 1978, 90, 420–426. [Google Scholar] [CrossRef] [Scilit] [PubMed]
  36. Olson, B.J.S.C. Assays for Determination of Protein Concentration. Curr. Protoc. Pharmacol. 2016, 73, A.3A.1–A.3A.32. [Google Scholar] [CrossRef] [Scilit] [PubMed]
  37. Vazquez, L.; Armada, D.; Celeiro, M.; Dagnac, T.; Llompart, M. Evaluating the Presence and Contents of Phytochemicals in Honey Samples: Phenolic Compounds as Indicators to Identify Their Botanical Origin. Foods 2021, 10, 2616. [Google Scholar] [CrossRef] [Scilit] [PubMed]
  38. Zuffellato-Ribas, K.C.; Morini, S.; Picciarelli, P.; Mignolli, F. Extraction and Determination of Ascorbate and Dehydroascorbate from Apoplastic Fluid of Stem of Rooted and Non-Rooted Cuttings in Relation to the Rhizogenesis. Braz. J. Plant Physiol. 2010, 22, 123–129. [Google Scholar] [CrossRef] [Scilit]
  39. Maltseva, I.; Yakoviichuk, A.; Maltseva, S.; Cherkashina, S.; Kulikovskiy, M.; Maltsev, Y. Screening of Microalgal Strains with Elevated α-Tocopherol Levels and Antioxidant Capacity for Biotechnological Applications. Arch. Microbiol. 2026, 208, 358. [Google Scholar] [CrossRef] [Scilit] [PubMed]
  40. Tenny, K.M.; Keenaghan, M. Ohms Law. In StatPearls; StatPearls Publishing: Treasure Island, FL, USA, 2023. Available online: http://www.ncbi.nlm.nih.gov/books/NBK441875/ (accessed on 4 March 2026).
  41. Quinn, G.P.; Keough, M.J. Experimental Design and Data Analysis for Biologists, 2nd ed.; Cambridge University Press: Cambridge, UK, 2023; ISBN 9781139568173. [Google Scholar]
  42. Liyanaarachchi, V.C.; Nishshanka, G.K.S.H.; Premaratne, R.G.M.M.; Ariyadasa, T.U.; Nimarshana, P.H.V.; Malik, A. Astaxanthin Accumulation in the Green Microalga Haematococcus pluvialis: Effect of Initial Phosphate Concentration and Stepwise/Continuous Light Stress. Biotechnol. Rep. 2020, 28, e00538. [Google Scholar] [CrossRef] [Scilit] [PubMed]
  43. Van Wagenen, J.; Miller, T.W.; Hobbs, S.; Hook, P.; Crowe, B.; Huesemann, M. Effects of Light and Temperature on Fatty Acid Production in Nannochloropsis salina. Energies 2012, 5, 731–740. [Google Scholar] [CrossRef] [Scilit]
  44. Songserm, R.; Nishiyama, Y.; Sanevas, N. Light Influences the Growth, Pigment Synthesis, Photosynthesis Capacity, and Antioxidant Activities in Scenedesmus falcatus. Scientifica 2024, 2024, 1–12. [Google Scholar] [CrossRef] [Scilit] [PubMed]
  45. Hamouda, R.A.E.; Alhumairi, A.M.; El-Naggar, N.E.-A.; Hagagy, N. Influence of Different Colors with Light Regime on Chlorella sp., Biomass, Pigments, and Lipids Quantity and Quality. Green Process. Synth. 2025, 14, 20250076. [Google Scholar] [CrossRef] [Scilit]
  46. Dong, M.; Zhang, Y.; Yu, Q.; Liu, Q.; Zhou, X.; Jin, C. Regulation of Light Quality on Lipid Production, Biodiesel Quality, and Nutritional Quality of Phaeodactylum tricornutum. Aquac. Int. 2023, 31, 1231–1251. [Google Scholar] [CrossRef] [Scilit]
  47. Diaz-MacAdoo, D.; Mata, M.T.; Riquelme, C. Influence of Irradiance and Wavelength on the Antioxidant Activity and Carotenoids Accumulation in Muriellopsis sp. Isolated from the Antofagasta Coastal Desert. Molecules 2022, 27, 2412. [Google Scholar] [CrossRef] [Scilit] [PubMed]
  48. Vadiveloo, A.; Moheimani, N.R.; Cosgrove, J.J.; Bahri, P.A.; Parlevliet, D. Effect of Different Light Spectra on the Growth and Productivity of Acclimated Nannochloropsis sp. (Eustigmatophyceae). Algal Res. 2015, 8, 121–127. [Google Scholar] [CrossRef] [Scilit]
  49. Li, G.; Xiao, W.; Yang, T.; Lyu, T. Optimization and Process Effect for Microalgae Carbon Dioxide Fixation Technology Applications Based on Carbon Capture: A Comprehensive Review. C 2023, 9, 35. [Google Scholar] [CrossRef] [Scilit]
  50. Xin, K.; Guo, R.; Wang, X.; Yu, Z.; Mao, W.; Cheng, C.; Che, G.; Qian, L.; Cheng, J.; Yang, W.; et al. Photoautotrophic Growth and Cell Division of Euglena Gracilis with Mixed Red and Blue Wavelengths. Ind. Eng. Chem. Res. 2024, 63, 4746–4755. [Google Scholar] [CrossRef] [Scilit]
  51. Tetik, S.M.; Korkmazyiğit, M.; Nahırcıoğlu, A.; Ertit Taştan, B. Effects of Different Light Spectrums on Growth, Chlorophyll and CO2 Biofixation Capacity of Chlorella Sp. Cumhur. Sci. J. 2026, 47, 412–417. [Google Scholar] [CrossRef] [Scilit]
  52. Arend, M.; Yuan, Y.; Ruiz-Sola, M.Á.; Omranian, N.; Nikoloski, Z.; Petroutsos, D. Widening the Landscape of Transcriptional Regulation of Green Algal Photoprotection. Nat. Commun. 2023, 14, 2687. [Google Scholar] [CrossRef] [Scilit] [PubMed]
  53. Kochetova, G.V.; Avercheva, O.V.; Bassarskaya, E.M.; Zhigalova, T.V. Light Quality as a Driver of Photosynthetic Apparatus Development. Biophys. Rev. 2022, 14, 779–803. [Google Scholar] [CrossRef] [Scilit] [PubMed]
  54. Lv, X.; Zhao, S.; Chen, H.; Zhao, X. Effects of Light Qualities on the Growth and Photosynthetic Characteristics of Sorbus Tianschanica Rupr. Seedlings. PLoS ONE 2026, 21, e0354303. [Google Scholar] [CrossRef] [Scilit] [PubMed]
  55. Wongsnansilp, T.; Khamcharoen, M. The Effects of Red–Blue Light on the Growth and Astaxanthin Production of a Haematococcus pluvialis Strain Isolated from Southern Thailand. Appl. Microbiol. 2024, 4, 1745–1756. [Google Scholar] [CrossRef] [Scilit]
  56. Chauhan, D.; Sahoo, L.; Mohanty, K. Acclimation-Driven Microalgal Cultivation Improved Temperature and Light Stress Tolerance, CO2 Sequestration and Metabolite Regulation for Bioenergy Production. Bioresour. Technol. 2023, 385, 129386. [Google Scholar] [CrossRef] [Scilit] [PubMed]
  57. Ebrahim Nezhad, S.; Mansouri, H. Interactive Effects of Light Quality and Phytohormones on Growth and Biochemical Parameters in Dunaliella salina Culture in Dairy Wastewater. J. Appl. Phycol. 2025, 37, 4077–4089. [Google Scholar] [CrossRef] [Scilit]
  58. Zhao, T.; Li, Y.; Che, X.; Wu, H.; Ye, Y.; Fan, D.; Li, Z.; Zhao, Y.; Ye, W. Effects of Monochromatic LED Light Quality on Photosynthetic Capacity and Pigment Content in Dunaliella salina under Low Light Intensity. J. Appl. Phycol. 2025, 37, 1719–1734. [Google Scholar] [CrossRef] [Scilit]
  59. Li, Y.; Li, L.; Liu, J.; Qin, R. Light Absorption and Growth Response of Dunaliella under Different Light Qualities. J. Appl. Phycol. 2020, 32, 1041–1052. [Google Scholar] [CrossRef] [Scilit]
  60. Hotos, G.N. Quantity and Quality of Light on Growth and Pigment Content of Dunaliella sp. and Anabaena sp. Cultures and the Use of Their Absorption Spectra as a Proxy Method for Assessment. J. Mar. Sci. Eng. 2023, 11, 1673. [Google Scholar] [CrossRef] [Scilit]
  61. Sirohi, P.; Verma, H.; Singh, S.K.; Singh, V.K.; Pandey, J.; Khusharia, S.; Kumar, D.; Kaushalendra; Teotia, P.; Kumar, A. Microalgal Carotenoids: Therapeutic Application and Latest Approaches to Enhance the Production. Curr. Issues Mol. Biol. 2022, 44, 6257–6279. [Google Scholar] [CrossRef] [Scilit] [PubMed]
  62. Li, L.; Wu, Y.; Acheampong, A.; Huang, Q. Red light promotes autotrophic growth of Haematococcus pluvialis with improved carbonic anhydrase activity and CO2 utilization. Aquaculture 2023, 571, 739462. [Google Scholar] [CrossRef] [Scilit]
  63. Ho, S.-H.; Chen, C.-Y.; Lee, D.-J.; Chang, J.-S. Perspectives on Microalgal CO2-Emission Mitigation Systems—A Review. Biotechnol. Adv. 2011, 29, 189–198. [Google Scholar] [CrossRef] [Scilit] [PubMed]
  64. Ho, S.-H.; Chen, C.-Y.; Chang, J.-S. Effect of Light Intensity and Nitrogen Starvation on CO2 Fixation and Lipid/Carbohydrate Production of an Indigenous Microalga Scenedesmus obliquus CNW-N. Bioresour. Technol. 2012, 113, 244–252. [Google Scholar] [CrossRef] [Scilit] [PubMed]
  65. Li, X.; Huff, J.; Crunkleton, D.W.; Johannes, T.W. Light Intensity and Spectral Quality Modulation for Improved Growth Kinetics and Biochemical Composition of Chlamydomonas Reinhardtii. J. Biotechnol. 2023, 375, 28–39. [Google Scholar] [CrossRef] [Scilit] [PubMed]
  66. Kim, D.W.; Shin, W.-S.; Sung, M.-G.; Lee, B.; Chang, Y.K. Light Intensity Control as a Strategy to Improve Lipid Productivity in Chlorella sp. HS2 for Biodiesel Production. Biomass Bioenergy 2019, 126, 211–219. [Google Scholar] [CrossRef] [Scilit]
  67. Cheirsilp, B.; Torpee, S. Enhanced Growth and Lipid Production of Microalgae under Mixotrophic Culture Condition: Effect of Light Intensity, Glucose Concentration and Fed-Batch Cultivation. Bioresour. Technol. 2012, 110, 510–516. [Google Scholar] [CrossRef] [Scilit] [PubMed]
  68. Borella, L.; Sforza, E.; Bertucco, A. Effect of Residence Time in Continuous Photobioreactor on Mass and Energy Balance of Microalgal Protein Production. N. Biotechnol. 2021, 64, 46–53. [Google Scholar] [CrossRef] [Scilit] [PubMed]
  69. Solovchenko, A.E. Physiological Role of Neutral Lipid Accumulation in Eukaryotic Microalgae under Stresses. Russ. J. Plant Physiol. 2012, 59, 167–176. [Google Scholar] [CrossRef] [Scilit]
  70. Ozkan, A.; Rorrer, G.L. Effects of Light Intensity on the Selectivity of Lipid and Chitin Nanofiber Production during Photobioreactor Cultivation of the Marine Diatom Cyclotella sp. Algal Res. 2017, 25, 216–227. [Google Scholar] [CrossRef] [Scilit]
  71. Ran, W.; Wang, H.; Liu, Y.; Qi, M.; Xiang, Q.; Yao, C.; Zhang, Y.; Lan, X. Storage of Starch and Lipids in Microalgae: Biosynthesis and Manipulation by Nutrients. Bioresour. Technol. 2019, 291, 121894. [Google Scholar] [CrossRef] [Scilit] [PubMed]
  72. Li, X.; Manuel, J.; Slavens, S.; Crunkleton, D.W.; Johannes, T.W. Interactive Effects of Light Quality and Culturing Temperature on Algal Cell Size, Biomass Doubling Time, Protein Content, and Carbohydrate Content. Appl. Microbiol. Biotechnol. 2021, 105, 587–597. [Google Scholar] [CrossRef] [Scilit] [PubMed]
  73. Rivkin, R. Influence of Irradiance and Spectral Quality on the Carbon Metabolism of Phytoplankton I. Photosynthesis, Chemical Composition and Growth. Mar. Ecol. Prog. Ser. 1989, 55, 291–304. [Google Scholar] [CrossRef] [Scilit]
  74. Abomohra, A.E.-F.; Shang, H.; El-Sheekh, M.; Eladel, H.; Ebaid, R.; Wang, S.; Wang, Q. Night Illumination Using Monochromatic Light-Emitting Diodes for Enhanced Microalgal Growth and Biodiesel Production. Bioresour. Technol. 2019, 288, 121514. [Google Scholar] [CrossRef] [Scilit] [PubMed]
  75. Nagappan, S.; Kumar, G. Investigation of Four Microalgae in Nitrogen Deficient Synthetic Wastewater for Biorefinery Based Biofuel Production. Environ. Technol. Innov. 2021, 23, 101572. [Google Scholar] [CrossRef] [Scilit]
  76. Magnabosco, C.; Santaniello, G.; Romano, G. Microalgae: A Promising Source of Bioactive Polysaccharides for Biotechnological Applications. Molecules 2025, 30, 2055. [Google Scholar] [CrossRef] [Scilit] [PubMed]
  77. Yang, N.; Zhang, Q.; Chen, J.; Wu, S.; Chen, R.; Yao, L.; Li, B.; Liu, X.; Zhang, R.; Zhang, Z. Study on Bioactive Compounds of Microalgae as Antioxidants in a Bibliometric Analysis and Visualization Perspective. Front. Plant Sci. 2023, 14, 1144326. [Google Scholar] [CrossRef] [Scilit] [PubMed]
  78. Bhattarai, S.; Jha, D.K.; Balyan, S.; Zhen, S.; Pillai, S.S.; Patil, B.S. UV-B and Blue Light Supplementation Improves Tomato Quality and Antioxidant Dynamics: A Novel Approach for Sustainable Greenhouse Production. J. Agric. Food Res. 2025, 22, 102054. [Google Scholar] [CrossRef] [Scilit]
  79. Singh, L.A.; Kumari, P.; Kumar, P.; Yadav, A.; Bhardwaj, R.; Swapnil, P.; Meena, M. Microalgae-Derived Antioxidants and Antimicrobials: A Sustainable Approach for Natural Food Preservatives. Front. Sustain. Food Syst. 2025, 9, 1669731. [Google Scholar] [CrossRef] [Scilit]
  80. Del Mondo, A.; Smerilli, A.; Sané, E.; Sansone, C.; Brunet, C. Challenging Microalgal Vitamins for Human Health. Microb. Cell Factories 2020, 19, 201. [Google Scholar] [CrossRef] [Scilit] [PubMed]
  81. Hayd, L.A.H.; Anger, K.; Urzua, A. Growth, elemental and proximate biochemical composition of larval Amazon River prawn, Macrobrachium amazonicum, reared under different salinity conditions. Lat. Am. J. Aquat. Res. 2017, 45, 983–991. [Google Scholar] [CrossRef] [Scilit]
  82. Pech, R.; Volná, A.; Špunda, V.; Nezval, J. Blue Light as an Important Factor Increasing Plant Tolerance to Acute Photooxidative Stress. Environ. Exp. Bot. 2024, 226, 105923. [Google Scholar] [CrossRef] [Scilit]
  83. Richmond, A.; Hu, Q. (Eds.) Handbook of Microalgal Culture: Applied Phycology and Biotechnology; Wiley-Blackwell: Malden, MA, USA, 2013. [Google Scholar] [CrossRef] [Scilit]
  84. Wijffels, R.H.; Barbosa, M.J. An Outlook on Microalgal Biofuels. Science 2010, 329, 796–799. [Google Scholar] [CrossRef] [Scilit] [PubMed]
Figure 1. Flasks with biomass (a,b), and measurement of the spectral composition parameters of light under experimental conditions (c). Note: the parameters are given for groups cultivated under a photosynthetic photon flux density (PPFD) intensity of 26 ± 2 µmol m−2 s−1.
Phycology 06 00085 g001
Figure 2. Flasks containing biomass of Pleurastrum insigne CAMU MZ–Ch4 arranged in order of increasing monochromatic light intensity (a); biomass concentration under exposure to monochromatic light of different intensities (b). Note. Hereinafter, the letters R, B, and G represent red, blue, and green light, respectively, whereas the numerical subscripts (26, 90, and 150) specify the corresponding PPFD values (µmol m−2 s−1) (M ± SD, n = 5).
Phycology 06 00085 g002
Figure 3. Biomass productivity of Pleurastrum insigne CAMU MZ–Ch4 under the influence of monochromatic light of varying intensity. Note: (M ± SD, n = 5).
Phycology 06 00085 g003
Figure 4. CO2 biofixation by Pleurastrum insigne CAMU MZ–Ch4 biomass under the influence of monochromatic light of varying intensities.
Phycology 06 00085 g004
Figure 5. Content of Chl a (a), Chl b (b), Car (c), Car/Chl a (d), MPCar (e), LPCar (f) in the biomass of Pleurastrum insigne CAMU MZ–Ch4 under the influence of monochromatic light of different intensities on the 20th day of cultivation. Note. Here and in Figure 6 and Figure 7, the presence of a letter above the column of the diagram indicates that there are significant differences from the corresponding group. The difference is significant between groups at the level of p < 0.05. The groups are designated as follows: r—R26, b—B26, g—G26, R—R90, B—B90, G—G90 (M ± SD; n = 5).
Phycology 06 00085 g005
Figure 6. Content of lipids (a) and protein (b) in the biomass of Pleurastrum insigne CAMU MZ–Ch4 under the influence of monochromatic light of different intensities on the 20th day of cultivation.
Phycology 06 00085 g006
Figure 7. Content of AscA (a), PhenC (b), and α-tocopherol (c) in the biomass of Pleurastrum insigne CAMU MZ–Ch4 under exposure to monochromatic light of varying intensity on the 20th day of cultivation. Note: (M ± SD, n = 5).
Phycology 06 00085 g007
Table 1. Composition of the Bold’s Basal Medium (BBM) used in the experiment.
StockSubstanceConcentration,
g L−1
Amount Added to Medium,
mL L−1
1KH2PO417.510 mL
2CaCl2·2H2O251 mL
3MgSO4·7H2O751 mL
4NaNO31251 mL
5K2HPO4751 mL
6NaCl251 mL
7Na2EDTA·2H2O101 mL
KOH6.2
8FeSO4·7H2O4.981 mL
10H3BO311.50.7 mL
11 *MnCl2·4H2O1.811 mL
ZnSO4·7H2O0.222
Na2MoO4·2H2O0.390
CuSO4·5H2O0.079
Co(NO3)2·6H2O0.0494
H3BO35.72
Note. *—trace elements solution (for concentrations, see table above).
Table 2. Lighting parameters for the experimental groups.
GroupPPFD, µmol m−2 s−1Colour (Wavelength, nm)
R2626Red (631.9 ± 2)
R9090Red (631.9 ± 2)
R150150Red (631.9 ± 2)
B2626Blue (455 ± 2)
B9090Blue (455 ± 2)
B150150Blue (455 ± 2)
G2626Green (521.4 ± 2)
G9090Green (521.4 ± 2)
G150150Green (521.4 ± 2)
Table 3. The yield of valuable metabolites per litre of biomass (Ci, mg L−1) (M ± SD, n = 3).
R26R90R150B26B90B150G26G90G150
Chl a6 ± 0.55.9 ± 0.48 ± 0.66.2 ± 0.67.2 ± 0.38.7 ± 0.62.8 ± 0.35.4 ± 0.49.2 ± 0.8
Chl b2.5 ± 0.32.6 ± 0.33.5 ± 0.42.7 ± 0.33.1 ± 0.33.6 ± 0.31.3 ± 0.12.4 ± 0.24.1 ± 0.3
Car3.1 ± 0.23 ± 0.34.2 ± 0.42.7 ± 0.23.3 ± 0.34.2 ± 0.21.2 ± 0.12.4 ± 0.24.1 ± 0.4
MPCar1.6 ± 0.11.8 ± 0.22.3 ± 0.11.6 ± 0.11.9 ± 0.22.5 ± 0.20.8 ± 0.11.5 ± 0.12.5 ± 0.2
LPCar1.3 ± 0.11.2 ± 0.11.6 ± 0.10.9 ± 0.11.1 ± 0.11.5 ± 0.10.3 ± 0.10.7 ± 0.11.2 ± 0.1
Lipids360 ± 12.0295.1 ± 11.7348.8 ± 17.6237.6 ± 19.8171.6 ± 15.6324 ± 27204.8 ± 25.6257.4 ± 23.1223.6 ± 18.2
Protein221.6 ± 10.8306.3 ± 23.5336.8 ± 22.9206.6 ± 20.6292.3 ± 25437.4 ± 35.1152.7 ± 11.3268.1 ± 24303.4 ± 28.6
α-Toc0.219 ± 0.0220.241 ± 0.0280.215 ± 0.0260.054 ± 0.0060.226.2 ± 0.0340.383 ± 0.03750.02 ± 0.0050.064 ± 0.0080.108 ± 0.011
AscA6.7 ± 0.46.6 ± 0.310.3 ± 0.68 ± 0.48.4 ± 0.510.1 ± 0.74.6 ± 0.39.9 ± 0.810.9 ± 0.7
PhenC,4.4 ± 0.35 ± 0.46.2 ± 0.23.9 ± 0.25 ± 0.56.1 ± 0.72.9 ± 0.45 ± 0.36.1 ± 0.3
Table 4. Electrophysical and power parameters of the LED strip power supply circuit, as well as electricity consumed over 20 days under a 16/8 photoperiod.
GroupPPFD, µmol m−2 s−1U, VI, AP, WPη, Wh−1T, hPw, kWh−1
R262611.60.293.364.13201.31
R909011.61.0812.5315.283204.89
R15015011.61.719.7224.053207.7
B262611.60.212.442.983200.95
B909011.60.364.185.13201.63
B15015011.60.566.57.933202.54
G262611.60.273.133.823201.22
G909011.60.627.198.773202.81
G15015011.60.9911.48143204.48
Table 5. A heat map showing the specific energy intensity of producing a gram of metabolite under monochromatic illumination of varying intensities.
R26R90R150B26B90B150G26G90G150
Chl a, kW h−1 g−1178.3676.4792.0125.6184.5238.3353.7425.1399.7
Chl b, kW h−1 g−1433.51557.71809.2292.1427.1585.1745.2950.7888.6
Car, kW h−1 g−1350.21358.71505.3284.4402.4495.2869.4968.4888.6
Lipids, kW h−1 g−13.013.618.13.37.86.44.98.916.4
Protein, kW h−1 g−14.913.118.73.84.64.86.68.612.1
α-Tocopherol, kW h−1 g−14900.616,618.029,345.214,556.35913.45431.549,486.235,938.833,923.7
AscA, kW h−1 g−1160.5610.8613.497.4158.8207.0215.9232.7336.4
PhenC, kW h−1 g−1242.7801.11019.1202.7269.2340.7350.7459.7598.7
Note. The green colour gradient along the horizontal line indicates increasing energy intensity (kW h−1 g−1) for the production of the target metabolite.
Disclaimer/Publisher’s Note: The statements, opinions and data contained in all publications are solely those of the individual author(s) and contributor(s) and not of MDPI and/or the editor(s). MDPI and/or the editor(s) disclaim responsibility for any injury to people or property resulting from any ideas, methods, instructions or products referred to in the content.