Article

Alg-Flex, an Open-Source Raspberry Pi Acquisition System for a Photobioreactor

by
Nadia Samantha Zuñiga-Peña
1,
Alannah Harnden
2,
Norberto Hernandez-Romero
1,
Alexis Saldivar
2,3,
Salatiel Garcia-Nava
4,* and
Cristal Zuniga
2,5,*
1
Área Académica de Ingeniería y Arquitectura, Universidad Autónoma del Estado de Hidalgo, Mineral de la Reforma, Hidalgo 42184, Mexico
2
Department of Biology, San Diego State University, San Diego, CA 92182, USA
3
San Diego State University/University of California San Diego Joint Doctoral Program in Cell and Molecular Biology, San Diego, CA 92182, USA
4
Departamento de Eléctrica y Electrónica, Instituto Tecnológico de Pachuca, Pachuca, Hidalgo 42082, Mexico
5
Department of Energy, Great Lakes Bioenergy Research Center, San Diego State University, San Diego, CA 92182, USA
*
Authors to whom correspondence should be addressed.
Phycology 2026, 6(3), 96; https://doi.org/10.3390/phycology6030096
Submission received: 17 March 2026 / Revised: 21 August 2026 / Accepted: 26 August 2026 / Published: 1 September 2026
(This article belongs to the Special Issue Development of Algal Biotechnology, Second Edition)

Abstract

Microalgae biomanufacturing is a promising technology that converts carbon dioxide into valuable products. However, it faces limitations in scaling, online monitoring, and controlling biological variables. In photobioreactors, light intensity influences growth and operational efficiency. This study presents Alg-flex, a low-cost, open-source monitoring and control platform based on a Raspberry Pi 4. Alg-flex integrates sensors for light intensity regulation and real-time monitoring of pH, temperature, and dissolved oxygen, enabling data visualization and logging, while providing full portability without hardware modifications. These features offer broader applicability than conventional single-variable loggers. The hardware was obtained for under $1834 USD, approximately 4% of the average cost of similar commercial units. Its performance was evaluated during the cultivation of Haematococcus lacustris in a bubble column photobioreactor. The pH and temperature sensors were validated against certified benchtop probes over the operating range used in this study, yielding median errors below 1.5%. Under the tested conditions, bioreactor cultures showed approximately two-fold higher final optical density that was significantly different than flask cultures (p = 0.0333). These results confirm that growth dynamics in small-volume microalgal cultures may differ substantially from controlled photobioreactor systems. The affordability, reliability, and multi-reactor compatibility of Alg-flex support broader biomanufacturing applications beyond microalgae cultivation.

1. Introduction

A grand challenge facing humanity is supporting the growing human population through biomanufacturing [1]. Meeting this challenge will require identifying and developing innovative control systems for bioproduction. Photosynthetic organisms, including algae and cyanobacteria, can convert CO2 and light into commodities (e.g., carbohydrates, fuels, pigments, and plastics), representing an exciting potential for biomanufacturing [2,3,4]. Although microalgae employ light and atmospheric CO2 in a process similar to that of most green plants, they benefit from significantly faster growth rates and far greater flexibility in their growth conditions [5,6]. Given these trends, optimizing microalgal cultivation processes is a primary goal for increasing biomass productivity through process control and across scales [7]. Usually, microalgae are grown in different types of containers referred to as bioreactors (e.g., bottles, bubble columns, stirred tanks, flat plates, and raceway ponds). Multiple studies show how accurate, time-resolved autosampling and sensing (spectroscopic, NMR, dielectric, and soft sensors), integrated with advanced control, enable bioreactor optimization during changing growth stages and fluctuating environmental conditions [8,9].
The optimization of bioreactors then requires monitoring dynamic information as accurately as possible, along with physiological and metabolic responses across different growth stages under fluctuating conditions [10]. As a result, there is a need to accurately measure variables such as CO2, O2, pH, and temperature, as well as to collect data for active visualization, analysis, and control. This will result in data-driven decisions for successful process management [11]. This data is useful to better estimate life cycle assessments and the ultimate applicability of strains and processes. Usually, these manual measurements involve significant time consumption and effort, especially for measurements needed at short intervals to understand dynamics. For this reason, instrumentation and automation of data collection help reduce costs and time while enabling real-time visualization of variable behavior [12,13]. Additionally, manual control and data collection limit the number of biological replicates that can be performed at bench, pilot, and industrial scales [14]. The high demand for equipment supporting microalgae growth and high market costs have driven various workgroups to develop customized prototypes that perform the same tasks at lower cost. Bioreactors generally have a standard structure comprising three main aspects: culturing vessels, monitoring/data gathering, and control [15,16]. In these biological systems, the behavior of variables, such as the light applied to the bioreactor, can be controlled, resulting in effective biomass production while reducing the shading effect. Overall, this will remarkably enhance biomass generation [4,7]. For this reason, providing an optimal online environment for microalgae will maximize growth and reproduction, facilitating light-driven biomanufacturing, which, in combination with metabolic modeling and artificial intelligence tools, will result in robust processes.
Low-cost bioreactor instrumentation systems have been reported in the literature for different applications. For example, this includes the bioreactor developed to automatically monitor and record the internal temperature, demonstrating functionality comparable to commercial systems when high-cost alternatives are unavailable [17]. Similarly, a microalgae bioreactor designed for aquaculture applications incorporated sensors for measuring temperature, pH, and optical density [18]. These systems recently developed feature custom sensors and autosampling that when used, growth and biomass yields increase across vessel types, from the phenobottle to flat-plate photobioreactors [19,20,21]. Interestingly, LED illumination has been broadly used since fluorescent lamps can lead to excessive heat that negatively affected microalgae production; additionally, to mitigate cellular stress and simultaneously supply nutrients, pH regulation strategies based on CO2 injection have been implemented [22]. Other studies have focused on expanding monitoring capabilities. A pilot anaerobic biogas reactor was equipped with sensors whose data were automatically collected and stored in a database for subsequent analysis [23]. Likewise, the integration of 3D printing, a Raspberry Pi microcomputer, and “Pioreactor” hardware enabled fluorescence monitoring in a low-cost platform [24]. Unfortunately, all these systems did not provide real-time visualization of measurements or automated process control.
The novelty of the Alg-flex system lies in its role as an open-source, modular, flexible, and translatable platform for cultivating photosynthetic organisms. It combines low-cost assembly with widely available components, such as generic sensors; practical configurability of geometry and illumination; integrated sensing and automation for monitoring; and full documentation, facilitating replication and customization by future users. To the best of our knowledge, few open-source microalgae cultivation systems offer this holistic combination of adaptability, accessibility, integrated digital control, and full cost transparency. A bubble column configuration was selected as it is among the simplest and most prevalent open-source systems, owing to its low cost, lack of moving parts, and scalability. Nonetheless, limitations exist with residence-time distributions, circulation patterns, and mixing uniformity. In comparison, airlift photobioreactors address these challenges by introducing defined riser and downcomer regions, improving circulation and gas–liquid mass transfer, while lowering hydrodynamic stress, making airlift systems desirable for larger-scale microalgae cultivation. However, they have stricter geometry limitations, making modifications for rapid prototyping more challenging. Other systems, such as Taylor–Couette photobioreactors, rely on Taylor vortices to generate mechanical rotation between concentric cylinders, thereby improving control over mixing, light–dark cycling, and mass-transfer performance [25]. While these systems showcase enhanced microalgal productivity, they require rotating components, specialized configurations, increased maintenance, and higher energy consumption, all of which limit their accessibility and broader use. Thus, we can confidently say that Alg-flex is highly adaptable across those frameworks, prioritizing accessibility, reproducibility, and experimental flexibility, allowing users to compare cultivation strategies, illumination configurations, sensing approaches, and control algorithms at substantially lower complexity and cost.
Overall, in this work, we designed, built, implemented, and tested a bioreactor system that allows real-time monitoring of temperature, pH, and level variables in a bubble column. For this purpose, a small single-board computer, the Raspberry Pi, was chosen for its cost-effective, high-performance computing capabilities, multiple communication protocols compatible with most low-cost sensors available on the market, and the ability to integrate interfaces such as touchscreens, making it the first choice for Human–Machine Interface (HMI) development. Python 3.7, a high-level, general-purpose, open-source programming language, was selected because of its extensive scientific libraries, cross-platform compatibility, and broad community support, which facilitate rapid software development, maintenance, and future customization of the interface. Using this framework facilitates the adoption of the FAIR guiding principles by making the code, documentation, and experimental data openly accessible, reusable, and interoperable through standard file formats and publicly available repositories. Additionally, it allows for controlling the microalgal culture under different conditions of light intensity, spectrum, and frequency modulation. This capability will enable the development of dynamic operational strategies to increase biomass productivity and the production of valuable products. The low-cost monitoring and control system was built using readily available, low-cost devices. The device was used to perform biotic tests.

2. Materials and Methods

2.1. Development of an Acquisition System for a Bioreactor in a Production Line of Microalgae

This section describes the design, construction, and implementation of an automated data acquisition and control system for a photobioreactor used for microalgae cultivation. The system integrates sensors, actuators, and control software to continuously monitor key process variables during growth experiments.

2.1.1. Signal Conditioning

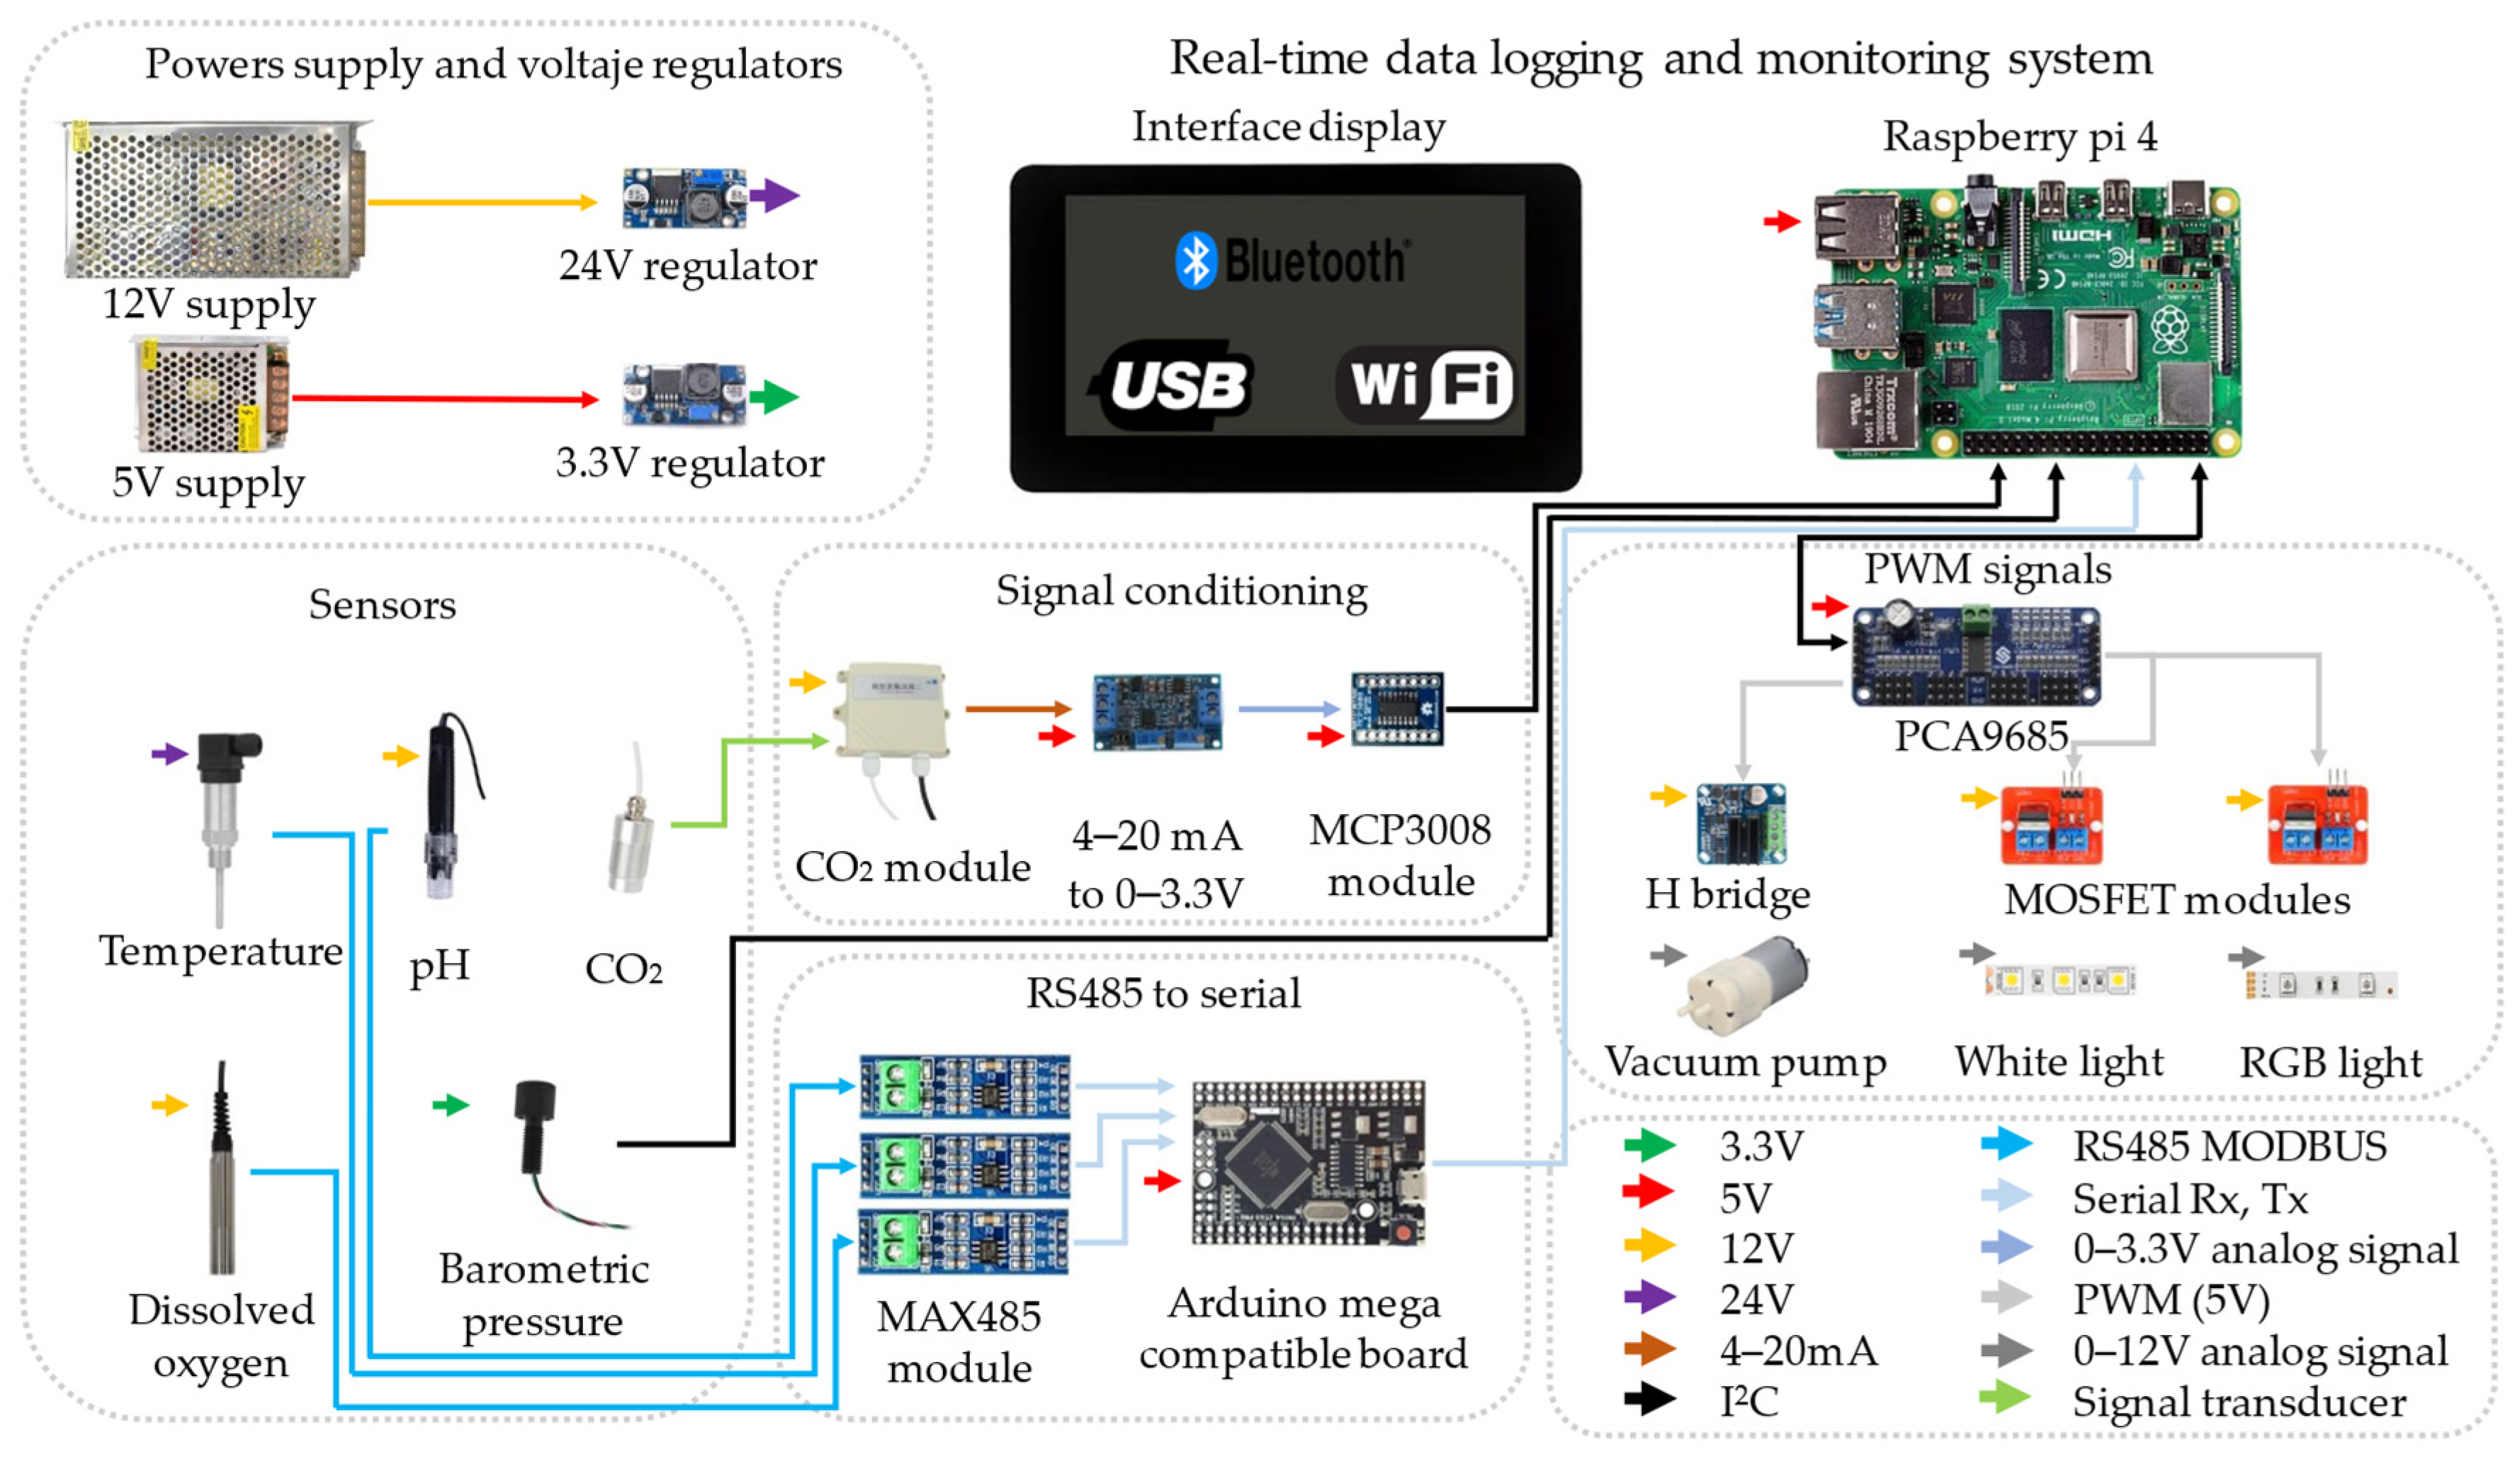
Microalgae cultivation must be carried out under adequate and controlled environments. One of the most important aspects is sensor selection, as it enables monitoring of parameter values [26]. The selection of each sensor feature determines the type of output signal and, consequently, the signal conditioning. The following describes the elements shown in the bioreactor connection diagram in Figure 1.

2.1.2. Power Supply and Voltage Regulators

In Alg-flex there are two power supplies: one at 12 V, which directly powers the DO and pH sensors, the H-bridge, and the MOSFET modules; the other, through a regulator, is stepped up to 24 V for the temperature sensor. The second power supply is 5 V and powers the Raspberry Pi 4 board, the signal conditioning modules, the PCA9685, and the Arduino Mega Compatible Board; afterward, a regulator steps the voltage down to 3.3 V to power the Barometric Pressure sensor. Finally, the interface display is powered by the Raspberry PI 4 board, and the energy consumption is calculated using Equation (1).
P o w e r ( k W h L ) = E l e c t r i c a l   c o n s u m p t i o n   ( k W ∗ h ) T e s t   v o l u m e   ( L )

2.1.3. Sensors

The system can automatically record sensor data at a maximum rate of one sample per second. Since the sensors use different measurement processes, their output signals vary, necessitating different signal acquisition methods, as described below. All sensors were selected for compatibility with the Raspberry Pi system, market availability, low cost, and a wide operating range. A description of the sensor sources and the materials used to develop Alg-flex is provided in Table 1. Supplementary Table S2 shows the temperature sensitivity and compensation characteristics of the sensors integrated into the Alg-flex system.
CO2: The range of gas-phase CO2 is 0 to 20%. To measure CO2, airflow from inside the bioreactor must be extracted, passed through the vacuum pump, and introduced into the CO2 module. The module delivers a 4 to 20 mA signal, which must be converted to 0 to 3 V for transmission to the Raspberry Pi 4 via the MCP3008 module. Given the nature of this sensor, its data has been largely excluded from the results and discussion.
pH: This sensor is necessary to measure the variable and subsequently control it. The sensor must come into direct contact with the solution to perform the measurement. The measuring range is 0 to 14 pH at an operating temperature of 0 to 60 °C. The signal must be converted from RS232 to serial by the MAX485 module and read with the Arduino-compatible board so that it can be sent and read by the Raspberry Pi 4. The pH sensor was calibrated using a two-point calibration method with reference calibration solutions (Thermo Fisher Scientific, New York, NY, USA). The pH of the calibration solution was 7.01 and 10.0 (see Supplementary Materials Figure S1). This calibration was selected because the expected pH during Haematococcus lacustris cultivation remained within the alkaline range (approximately pH 8.0–9.5), where a two-point calibration spanning the operating range provides accurate sensor performance.
Temperature: The bioreactor temperature was monitored and recorded. The measurement is performed by immersing the probe. The operating range is 0 to 100 °C. The signal must be converted with the MAX485 module from RS232 to serial, and then, using the Arduino-compatible board, it is sent to the Raspberry Pi 4.
Dissolved oxygen (O2): This parameter is measured through a fluorescent method. The measuring range is from 0 to 20 mg/L. The signals must be converted from RS232 to serial using a MAX485 and read by the Arduino-compatible board; they can then be received by the Raspberry Pi 4. The sensor was calibrated using a two-point method (O2/saturation and O2-free). For the saturation point, the sensor was calibrated in air. For the depletion point, a zero-oxygen solution was prepared (1% w/w Na2SO3). Data are ready to be processed using the preferred correction method as previously reported for other systems [27,28].
Fluid-level measuring: This measurement is necessary for subsequent control of bioreactor filling and draining. The liquid level was estimated using a Bar02 pressure sensor (Blue Robotics, Los Angeles, CA, USA) installed at the bottom of the cylindrical vessel. The sensor measures the hydrostatic pressure generated by the water column above it, which increases proportionally with the liquid height. Assuming a constant water density, the measured pressure can be converted into liquid height using the hydrostatic pressure relationship. Since the bioreactor has a fixed cylindrical geometry, the estimated height is directly related to the liquid volume, allowing continuous monitoring of the culture medium. This indirect measurement method provides a simple, non-invasive approach to monitoring the liquid level and compensating for evaporation-induced volume losses during long-term cultivation. The sensor provides a digital output signal, eliminating the need for signal conditioning before interfacing with the Raspberry Pi 4.

2.1.4. Lighting

The illumination system accounts for four neutral-white LED panels (27.68 × 11.68 cm), totaling 642 LEDs. These panels were positioned adjacent to the bioreactor column and in direct contact with the Alg-flex enclosure to maximize light exposure and promote a homogeneous irradiance distribution throughout the culture volume. The LEDs were powered via an H-bridge controlled by a PCA9685 PWM module, which communicated with the Raspberry Pi through the I2C interface. The lighting variable directly controlled by Alg-flex was the PWM duty cycle. In the experimental configuration, illumination could be adjusted from 0 to 100% duty cycle, corresponding to illuminance values ranging from approximately 1100 to 53,800 lx, as measured by a TASI TA8133 (Brand TRIPLETT, Taipei City, TWN) digital lux meter. Regulating light intensity is critical to prevent photoinhibition during early cultivation stages, when biomass concentration is low. Higher irradiance facilitates light penetration in dense cultures and enhances pigment accumulation [3,29]. Dynamic adjustment of illumination according to culture growth has also been proposed as a photonfluxostat strategy, in which photon supply is regulated to maintain controlled light-limited growth conditions throughout cultivation [30].
Due to the unavailability of a quantum sensor during the experiments, light intensity was measured in lux and subsequently converted to an estimated photosynthetic photon flux density (PPFD) to enable comparison with previous microalgae cultivation studies. PPFD, unlike illuminance, quantifies photon flux within the photosynthetically active radiation (PAR) region and is the preferred metric for photosynthetic applications. The relationship between lux and PPFD depends on the spectral power distribution of the light source, precluding a universal conversion. However, empirical studies indicate that broad-spectrum neutral-white LEDs exhibit relatively consistent lux-to-PPFD relationships, permitting reliable photon flux estimation when spectral measurements are unavailable. Sharakshane reported that 1000 lx corresponds to approximately 15 μmol photons m−2 s−1 for white LEDs, while Sugano et al. found that the conversion factor varies slightly with spectral characteristics but remains close to 14.5 µmol photons m−2 s−1 per 1000 lx for neutral-white LEDs [31,32].
Based on these empirical relationships, the maximum measured illuminance of 53,800 lx corresponds to an estimated PPFD of approximately 800–830 μmol photons m−2 s−1. Consequently, PPFD values reported in this study should be regarded as estimates derived from illuminance measurements rather than direct quantum sensor readings. The estimated PPFD is provided solely to facilitate comparison with the photosynthesis and microalgae cultivation literature, while the actual control variable in Alg-flex is the PWM duty cycle applied to the LED driver. In addition to constant illumination, the system can generate square-wave and sinusoidal light modulation with 2 s ON and 2 sOFF cycles. This approach has been shown to improve photosynthetic efficiency and biomass productivity in several microalgal species [33,34,35].
It should be noted that the reported PPFD corresponds to an estimate of the incident illumination at the reactor surface and not to the photon flux available throughout the culture. The internal light field is affected by culture depth, biomass concentration, absorption, scattering, and reactor geometry. Therefore, characterization of the spatial light distribution through depth-resolved measurements or radiative transfer modeling was beyond the scope of this study, whose primary objective was the development and validation of the Alg-flex monitoring and control platform.

2.1.5. Real-Time Data Logging and Monitoring System

A Raspberry Pi and a touchscreen were chosen for the Alg-flex system because of their lower cost than specialized data acquisition alternatives such as LabVIEW MyDAQ or MicroDAQ (National Istruments, Austin, TX, USA) and their flexibility compared with conventional Programmable Logic Controllers (PLCs) [36,37]. Unlike many commercial PLC-based platforms, the Raspberry Pi supports open-source software, multiple programming languages, and standard communication interfaces without requiring vendor-specific development environments. Furthermore, integrating a touchscreen enables the straightforward implementation of a Human–Machine Interface (HMI) for real-time visualization and control of the photobioreactor. The HMI developed in this work is open-source and was developed on a Raspberry Pi platform, which supports communication protocols commonly used in Industrial Internet of Things (IIoT) applications. Although remote cloud communication was not implemented in the present study, the hardware architecture is compatible with protocols such as MQTT and can be extended in future work to communicate with cloud platforms including AWS, Microsoft Azure, and Google Cloud [38]. Being a compact device, it allows the construction of lightweight, easy-to-handle modules with a low-power system for 24/7 operation. The system has a sampling frequency of 1 Hz. Compared to an Arduino board, it integrates a display and concurrent software process; therefore, in this case, the Arduino board is used only for communication between the sensors and the Raspberry Pi [36,37].

2.2. Software for Raspberry Pi and Arduino-Compatible Board

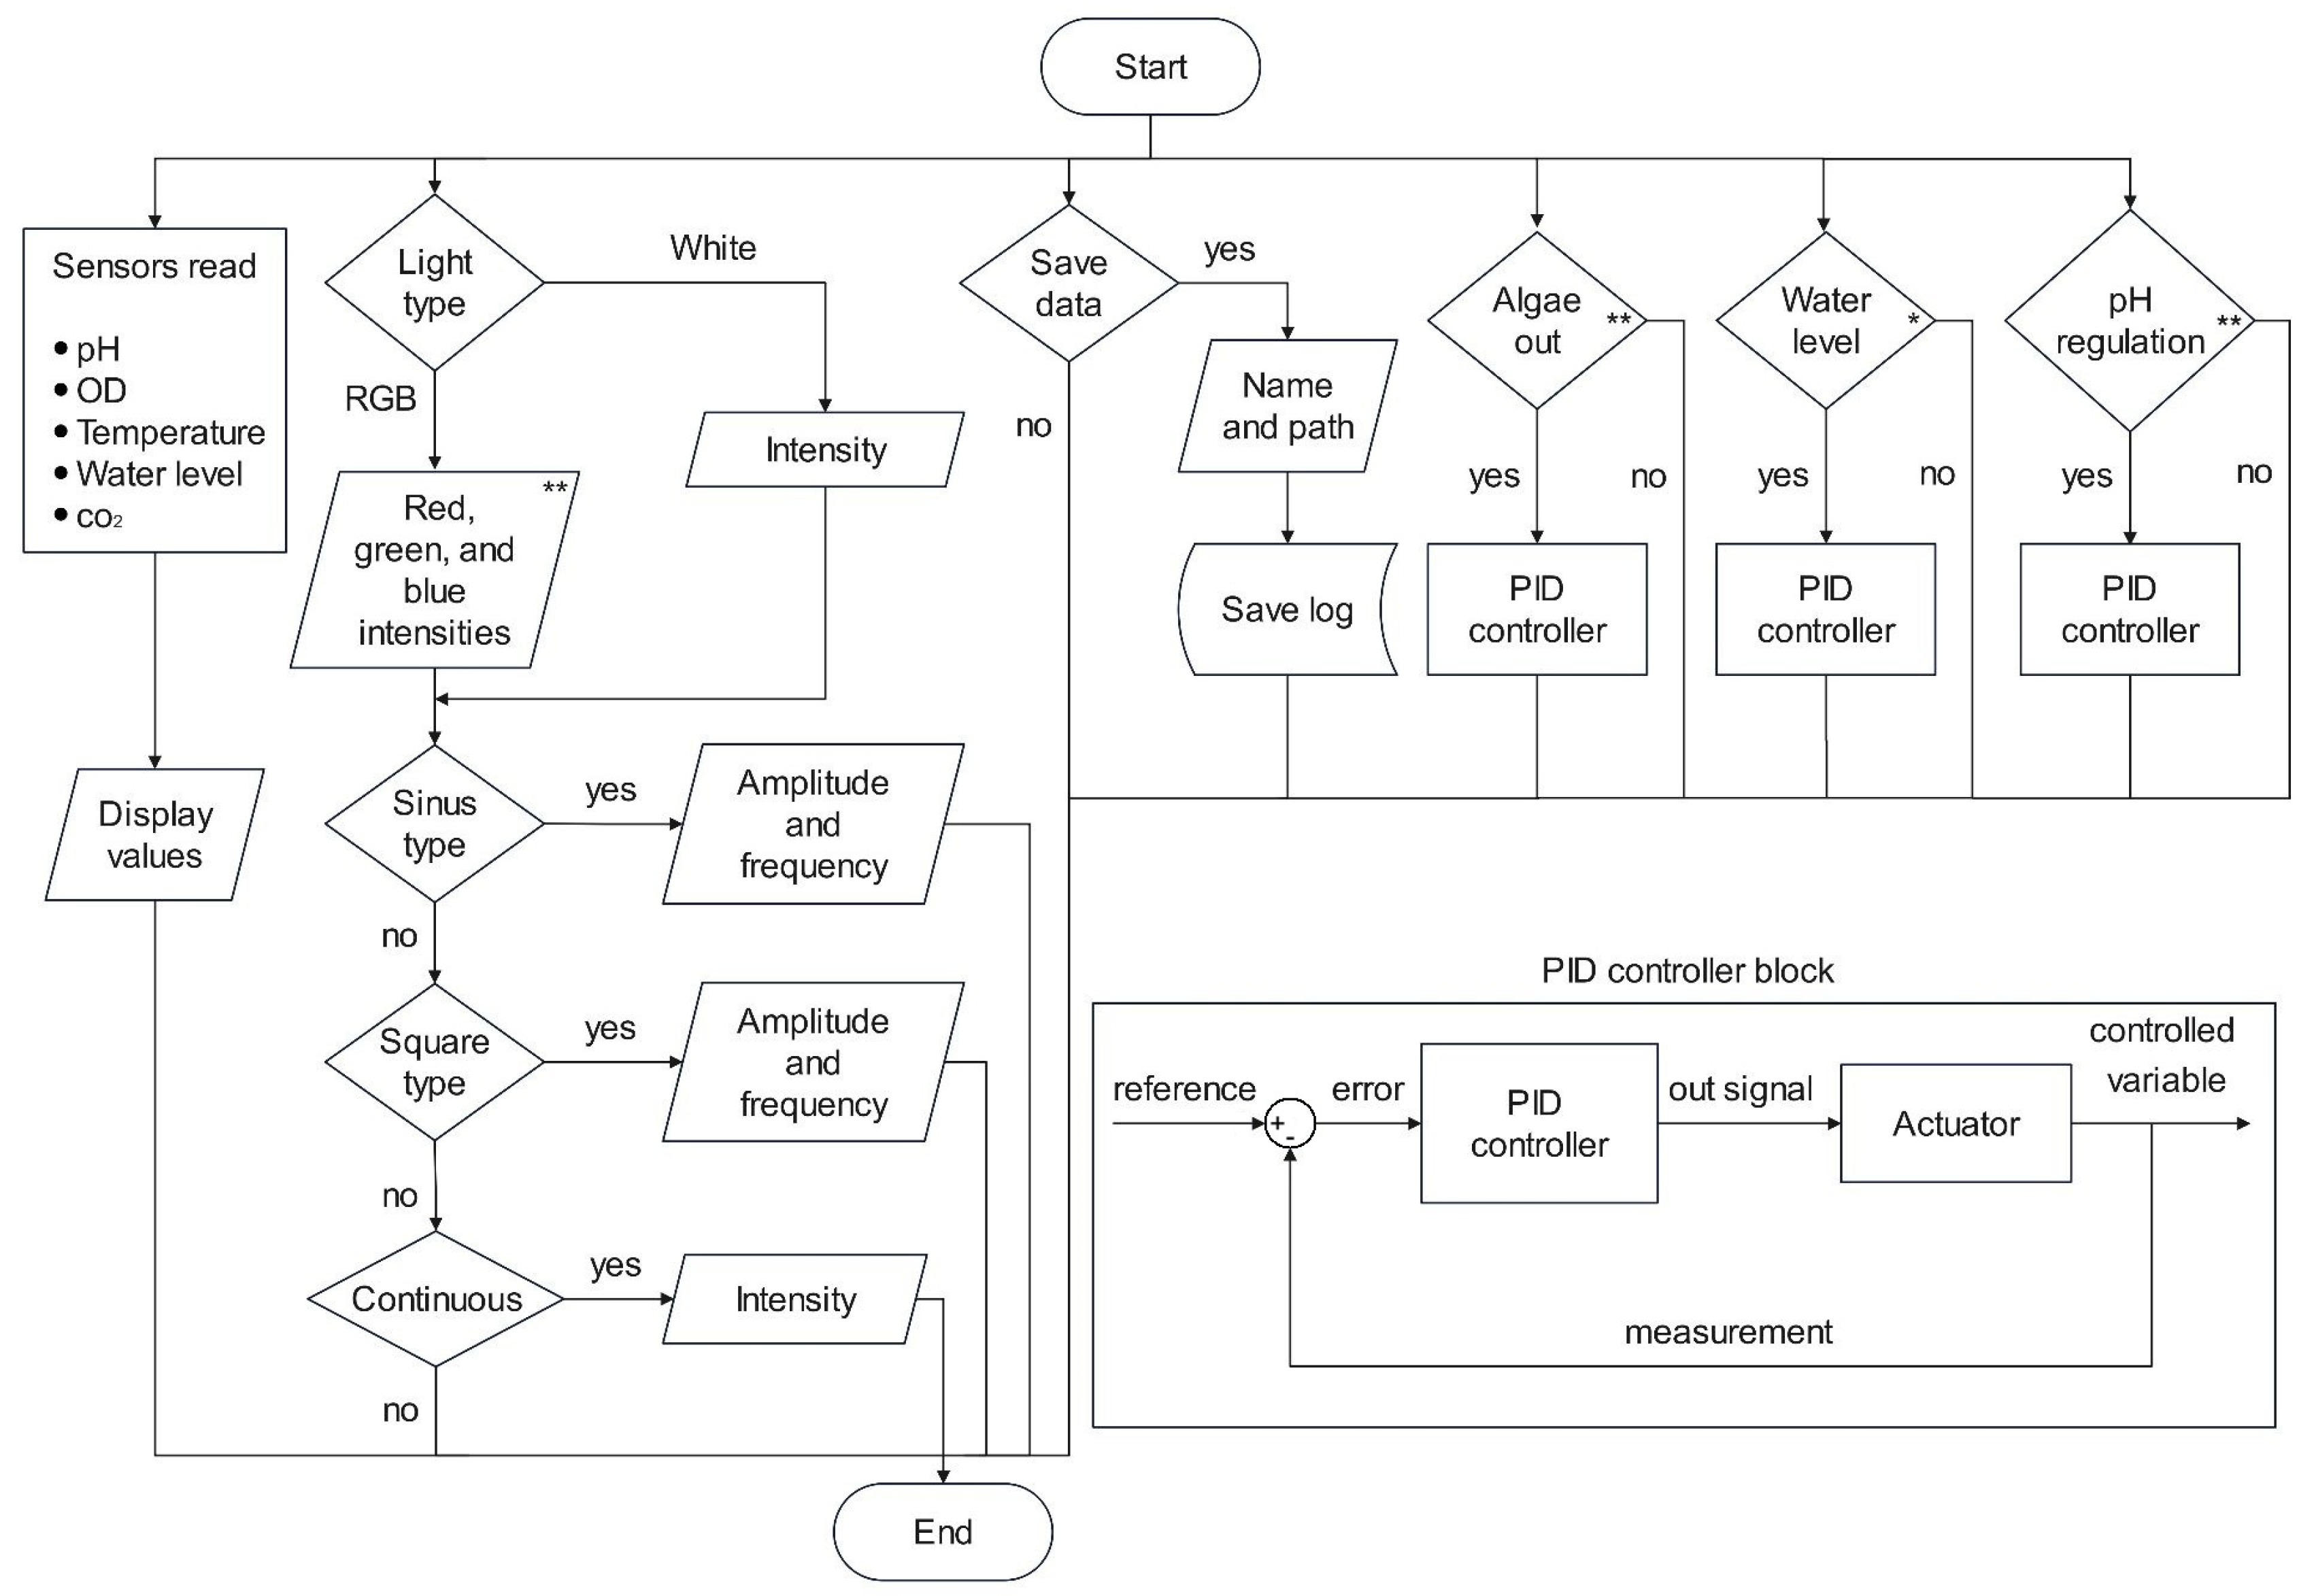
The photobioreactor is controlled through a distributed software architecture that integrates a Raspberry Pi with an Arduino-compatible microcontroller to coordinate sensing, actuation, data acquisition, and user interaction. The software continuously monitors environmental parameters and executes automated control actions based on predefined operating conditions to maintain stable cultivation conditions. Figure 2 shows the flowchart of all features in the automated and controlled system. This robust connectivity ensures efficient bioreactor operation by continuously monitoring and adjusting key variables to maintain an optimal environment for algae cultivation. The different parts and the process flow are detailed as follows:
  • START—The processing methods begin here. Overall, the program supports the parallel execution of six processes. From left to right, the processes are: Process 1—Sensor read: Allows reading and measuring variables through sensors
  • such as OD, temperature, and CO2, and controlled variables including pH and water level.
  • Process 1.1—All measured values from the sensors are displayed on the main screen of the control system in real time.
  • Process 2—Light type: During the cultivation process, it is possible to select the type of lighting, either WHITE or RGB, and set its intensity. RGB lighting control is already implemented in the interface; to activate RGB illumination, only an RGB LED strip needs to be connected.
  • Process 2.1—When the sinus light option is active, the amplitude and the value of half of the cycle must be set. The amplitude can be set to 0 to 100%, where 100% corresponds to the maximum value of 807 μmol photons m−2 s−1, and the half of the cycle determines the on and off times of the light. For example, 50% and 2 s correspond to a sine signal with a maximum value of 403.5 μmol photons m−2 s−1, with a period of 4 s.
  • Process 2.2—When the square light option is active, the amplitude and the value of half of the cycle must be set. The amplitude can be set from 0 to 100%, where 100% corresponds to the maximum value of 807 μmol photons m−2 s−1, and the half of the cycle determines the on and off times of light. For example, 25% and 2 s correspond to a square signal with a maximum value of 201.75 μmol photons m−2 s−1, with a period of 4 s.
  • Process 2.3—When the continuous light option is active, only the intensity can be set; it is not possible to define on and off times.
  • Process 3—Save: This process allows data logging of sensor measurements, lighting settings, and operating time in a *.txt file.
  • Process 3.1—When the save data option is active, the file name and location path are determined by the user by browsing the screen. The application creates one file per day, and at the end of the day, it starts a new one.
  • Process 4—Algae out: This process allows the implementation of a servo-actuated valve for biomass drainage and can be automatically controlled by a Proportional–Integral–Derivative (PID) controller based on measurements from optical density (OD) and water-level sensors. Once a predefined OD threshold, used as a proxy for biomass concentration and indicative of the desired growth level, is reached, the servo valve can be automatically opened to drain the culture into a collection container for subsequent biomass processing. Therefore, implementation of this control strategy requires the integration of an online OD sensor and the definition of an appropriate OD threshold according to the expected biomass growth.
  • Process 5—Water level: With this process, the system allows the incorporation of a filling valve. The water level is measured automatically, and when it is consumed or decreases, it is replenished. To activate the water-level control functionality, a solenoid valve must be incorporated to allow water addition to the Alg-flex system, and a reference water level must be defined.
  • Process 6—pH regulation: pH control is carried out in this process through the measurements of the pH sensor; a servo valve is actuated by adding CO2 gas. Similar to the previous controller, to maintain a pH reference through CO2 regulation, a solenoid valve must be incorporated to allow CO2 injection into the Alg-flex system.
  • END—All parallel processes end here.
Overall, a PID control strategy can be employed to ensure that the bioreactor operates within the desired ranges and setpoints of key process variables, such as liquid level, pH, and temperature, among others. The PID controller continuously compares the measured values of selected variables to a user-defined setpoint and adjusts actuator outputs to minimize the control error. The proportional, integral, and derivative components act on the present, accumulated, and predicted error, respectively, providing stable regulation of the bioreactor operating conditions.
It is important to note that, although pH and liquid-level control were not implemented in the experiments presented in this study, these control strategies are available within the current bioreactor architecture and can be activated if required. However, their implementation requires the incorporation of additional actuators. For this purpose, the interface supports the future integration of actuators, including heating systems and servo-actuated valves for water and CO2 injection into the bioreactor column. These actuators could enable compensation for water losses due to evaporation, pH regulation through controlled CO2 injection, and temperature stabilization through thermal actuators, such as a Peltier module [39], thereby improving process stability and cultivation performance. The PID controller block diagram is shown at the bottom-right of Figure 2.
The graphical interface was developed using Python 3.7, an open-source programming language widely used for scientific and engineering applications due to its extensive ecosystem of libraries and cross-platform compatibility. The interface was designed to facilitate the visualization and interpretation of sensor measurement data. All data and source files to install Alg-flex are available on Github “https://github.com/CZLaboratory/Photobioreactor-Instrumentation” (accessed on 20 August 2026).
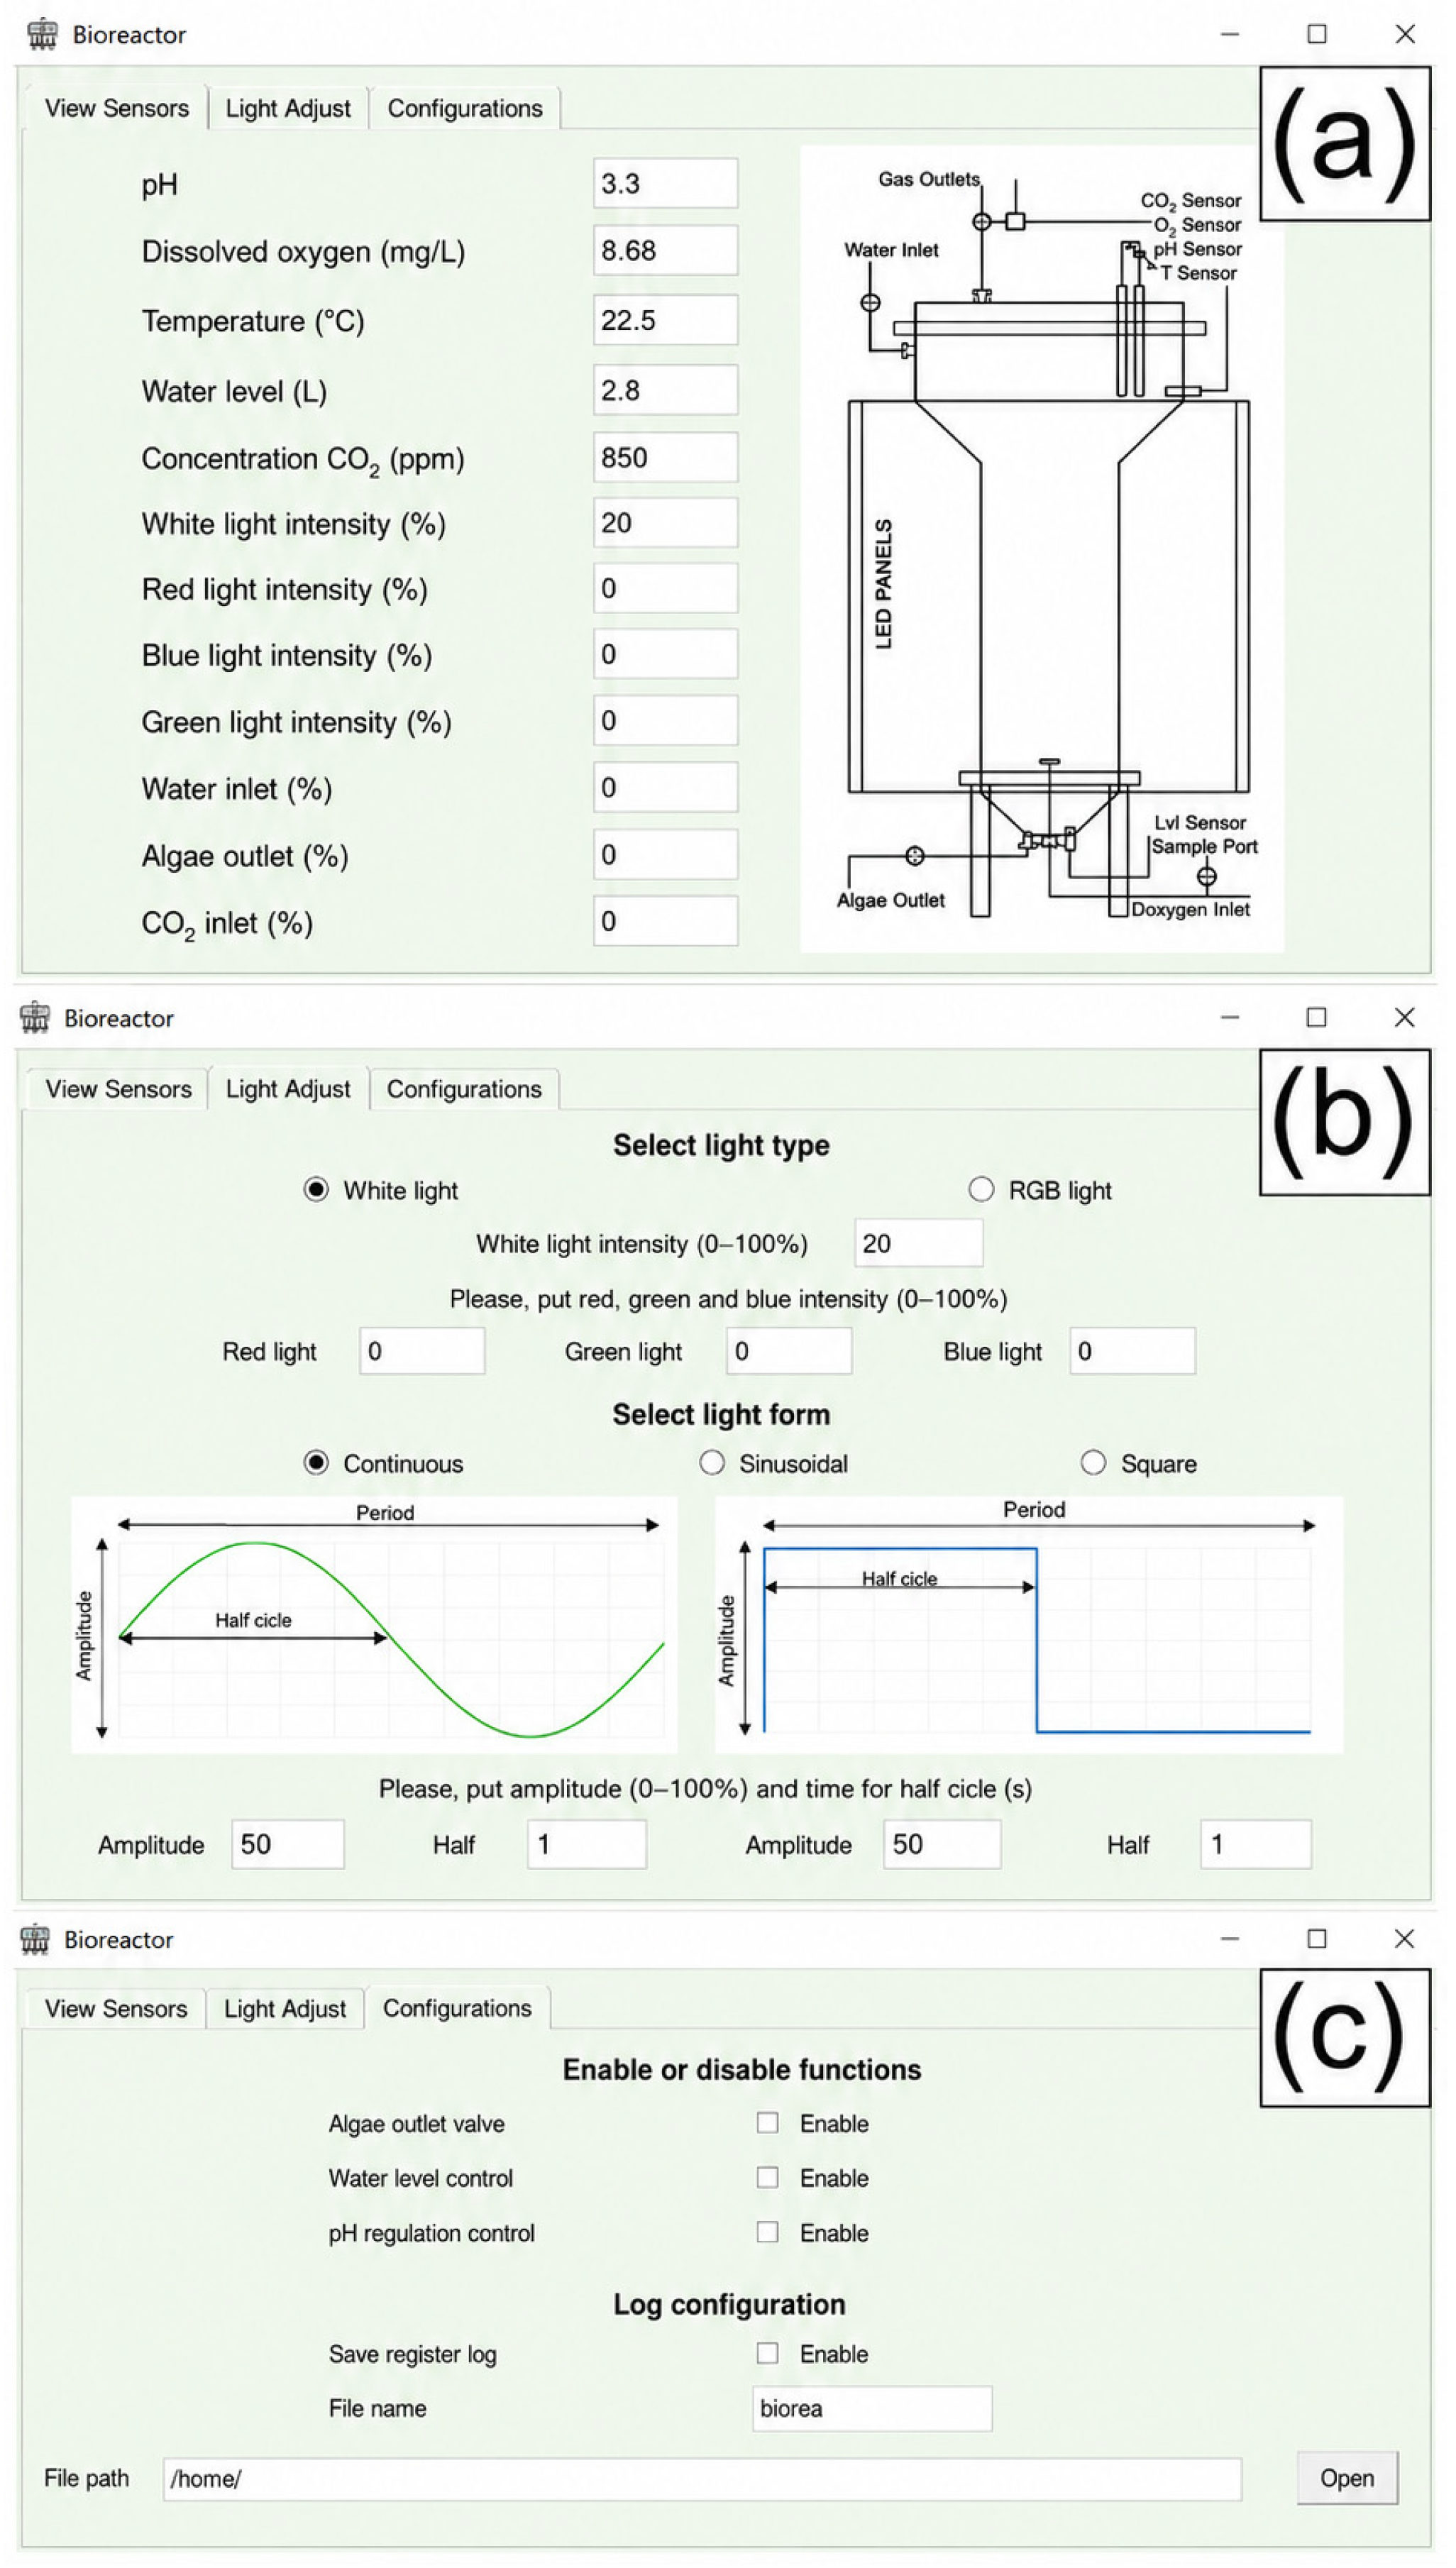
Figure 3 shows the three available windows on the touchscreen interface. The first screen displays the measurements from each sensor and the active lighting parameters in real time (Figure 3a). In Figure 3b, the light spectrum parameters and their intensities are displayed and can be adjusted by selecting a signal; the light intensity can vary over a defined time cycle, allowing the selection between a sine wave, a square wave, or a continuous pulse (Figure 3b). Finally, the controllers can be configured, and the path to save the data can be set in a separate tab (Figure 3c). The user can select a file name and a directory to save the measurement data and lighting parameters, and turn automatic controls for water-level drainage and pH regulation on or off.
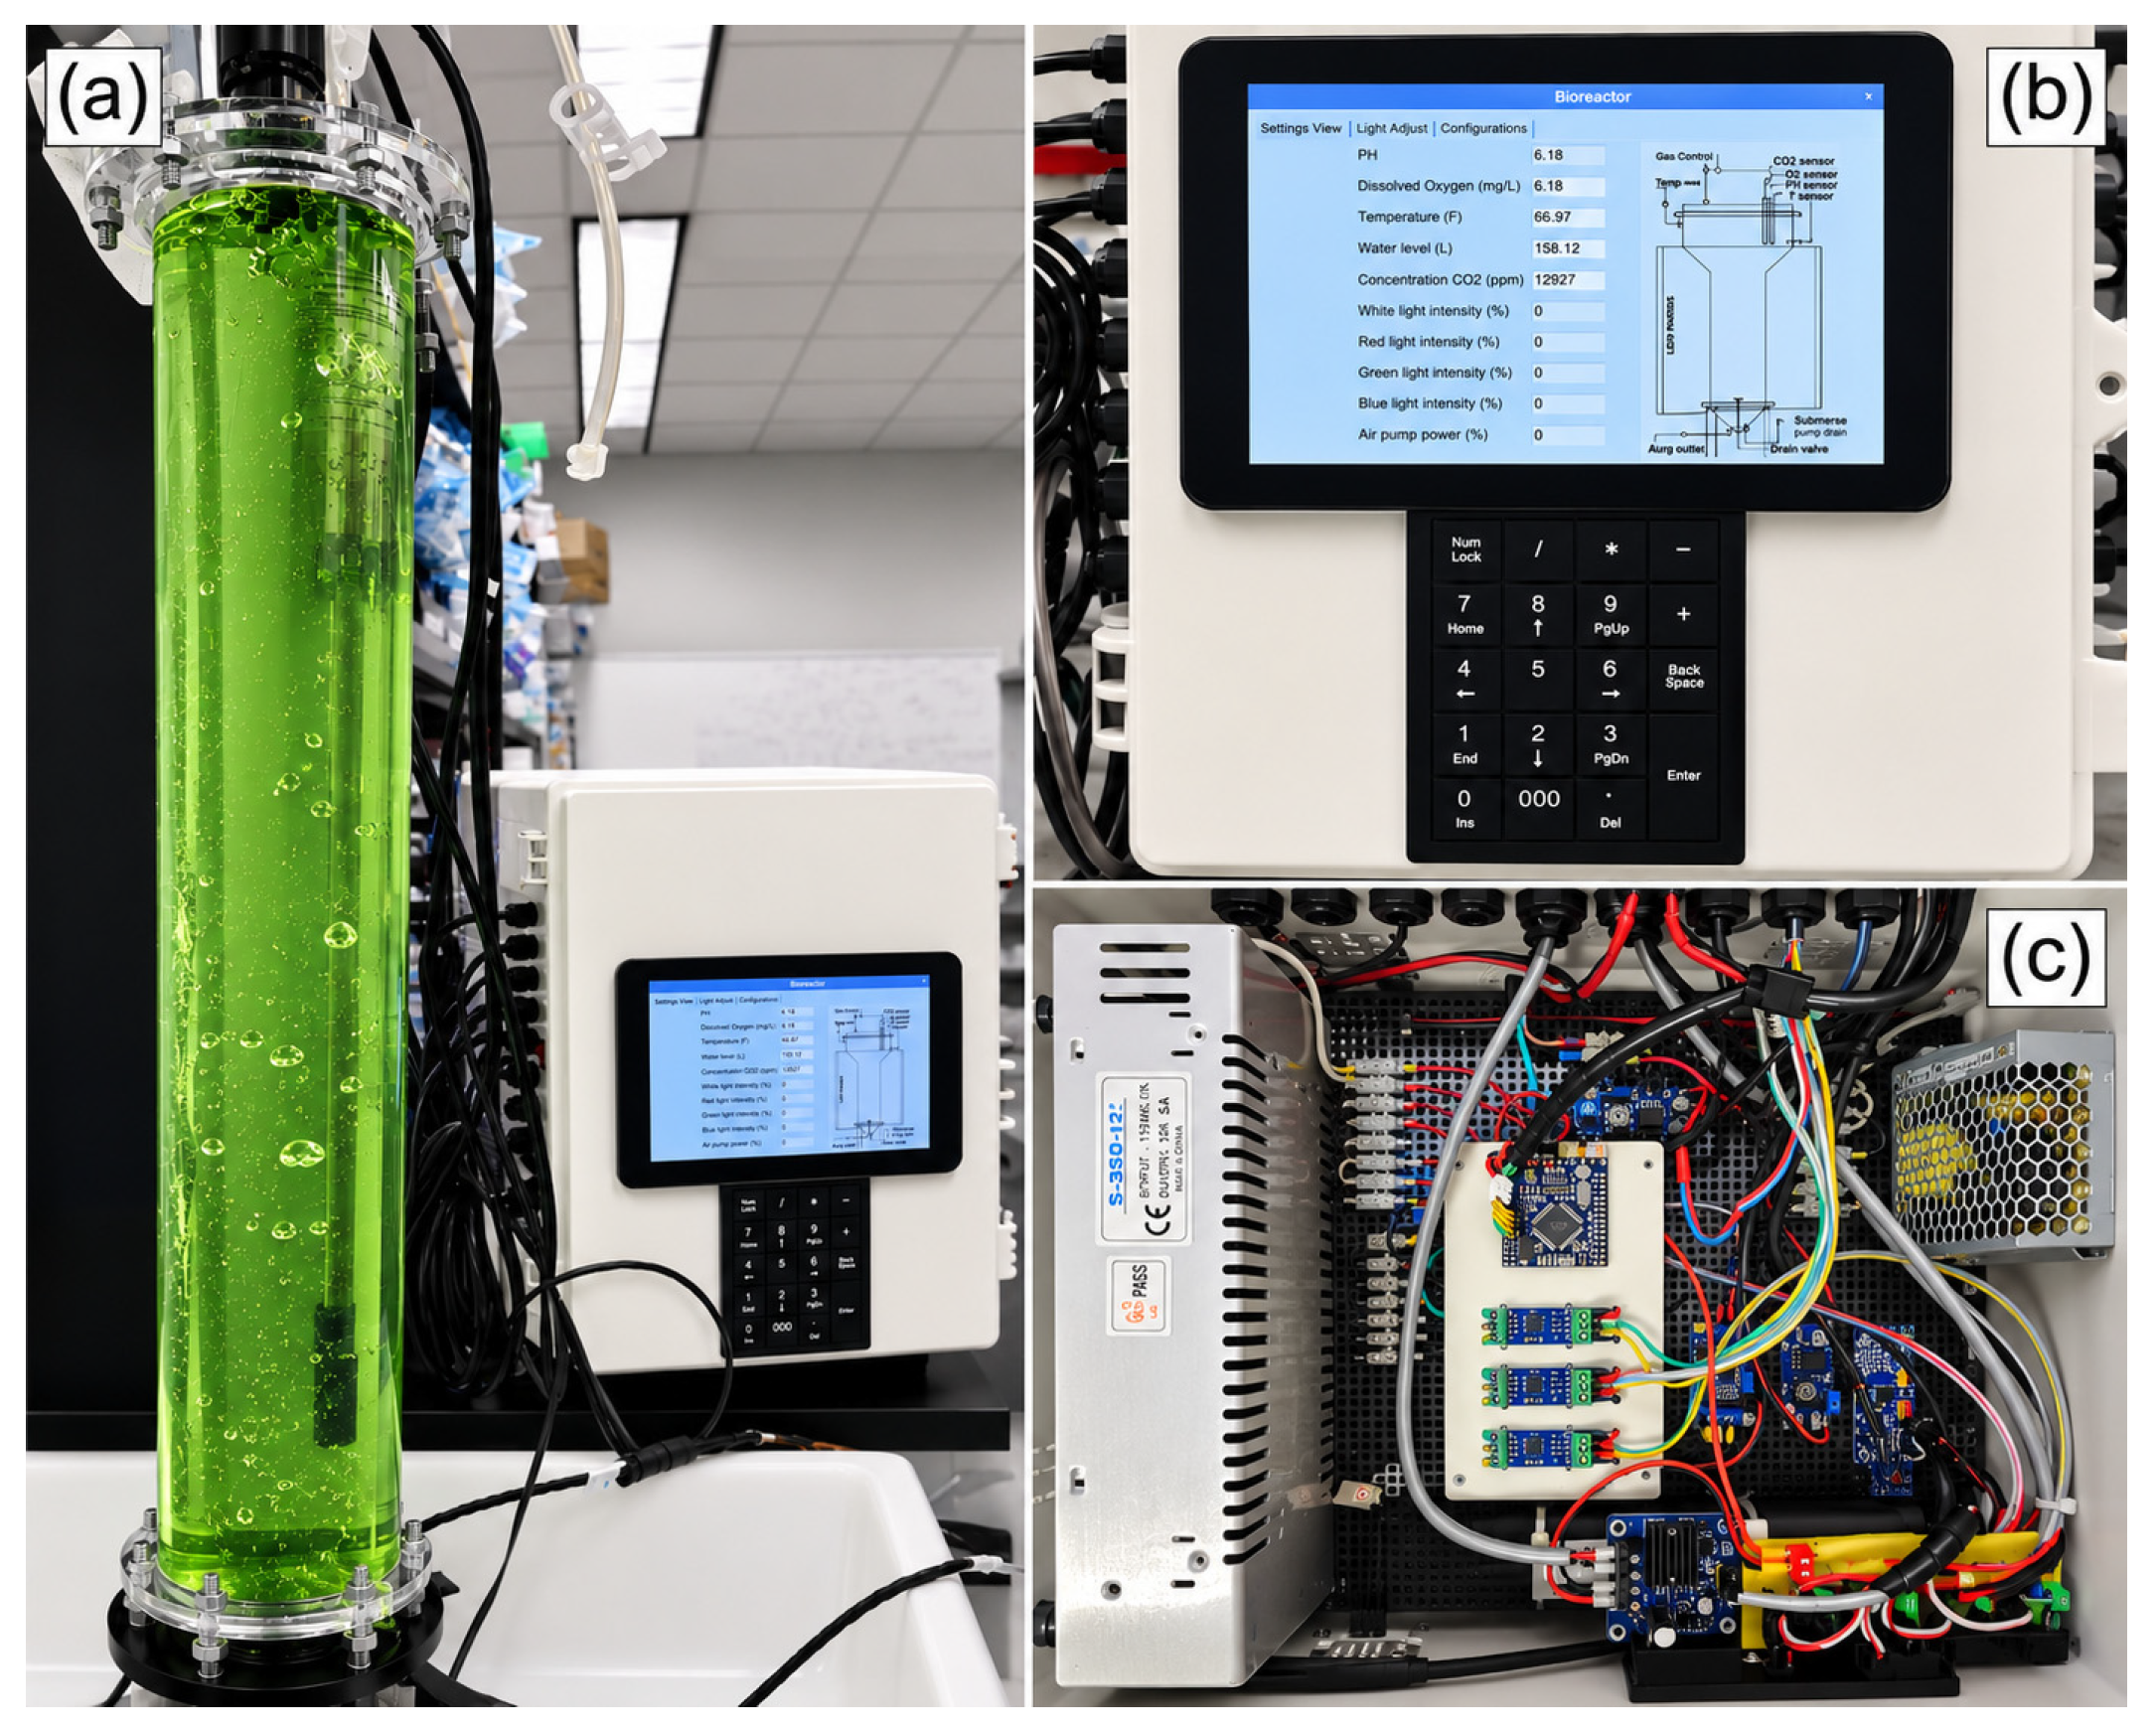
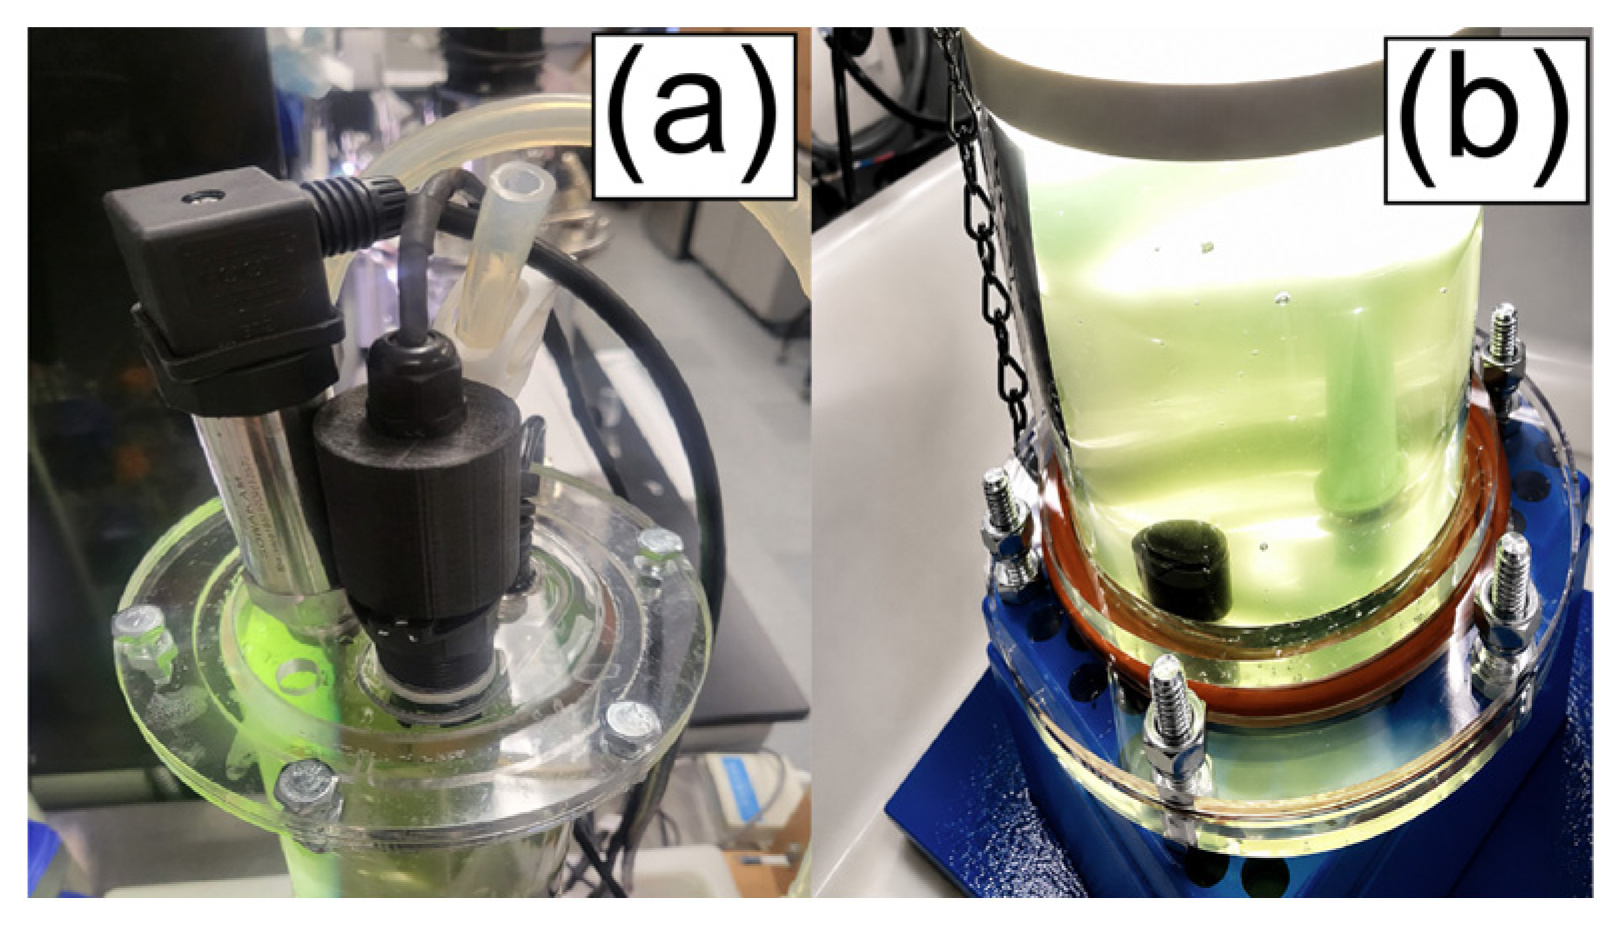
Overall, the Alg-flex system is shown operating in Figure 4 when coupled to a bubble column bioreactor. Sensor diameter measurements are provided in the Supplementary Materials (Figures S2 and S3). A picture of the open module is shown in Figure 4c. A close-up of the top of the bioreactor, where the pH, DO, and temperature sensors are located, is shown in Figure 5a, while Figure 5b depicts the bottom of the bubble column, where the level and oxygen sensors are shown. The air stream at the bioreactor exit was passed through a pipe for measurement.

2.3. Experimental Test

2.3.1. Growth Conditions

H. lacustris strain CCAP 34/13 was obtained from the Culture Collection of Algae and Protozoa (Scottish Association for Marine Science, Dunbeg, Oban, PA37 1QA, Scotland, United Kingdom). All experiments were performed in Bold’s Basal Medium with 3-fold Nitrogen and Vitamins (3N-BBM+V) [40] at an initial pH between 8.0 and 8.3. 3N-BBM+V is composed of (in 1 L): 0.75 g NaNO3, 0.025 g CaCl2•2H2O, 0.075 g MgSO4•7H2O, 0.075 g K2HPO4•3H2O, 0.175 g KH2PO4, 0.025 g NaCl, 6 mL trace metal solution, and 1 mL each of vitamins B1 and B12. The 3N-BBM+V trace metal solution consists of (in 1 L): 0.75 g Na2EDTA, 0.097 g FeCl3•6H2O, 0.041 g MnCl2•4H2O, 0.005 g ZnCl2, 0.002 g CoCl2•6H2O, and 0.004 g Na2MoO4•2H2O. Both bioreactor and flask experiments were incubated at room temperature (~20–24 °C), with a light–dark cycle of 12:12 h. The light cycles were selected following CCAP recommendations to attain optimal growth conditions for the strain.
The bubble column had an operational volume of 3.65 L and was inoculated with 150 mL of a two-week-old seed of H. lacustris. Four photobioreactor experiments were conducted at a controlled room temperature (22–24 °C), resulting in four biological replicates with four technical replicates of OD680. The light intensity was set to a PPFD of 145.26 μmol photons m−2 s−1 at the beginning of the experiment and was gradually increased to 403.5 μmol photons m−2 s−1. The airflow rate was set to 2.0 L/min. This flow rate was selected to promote adequate mixing of liquid in the column while preventing foam formation. The inlet air supplied to the photobioreactor was first passed through a water-filled humidification bottle before entering the bubble column. Humidification of the gas stream reduced evaporative water loss from the culture during long-term operation while maintaining the selected aeration rate. The integrated liquid-level sensor continuously monitored the culture volume to detect any residual changes associated with evaporation.
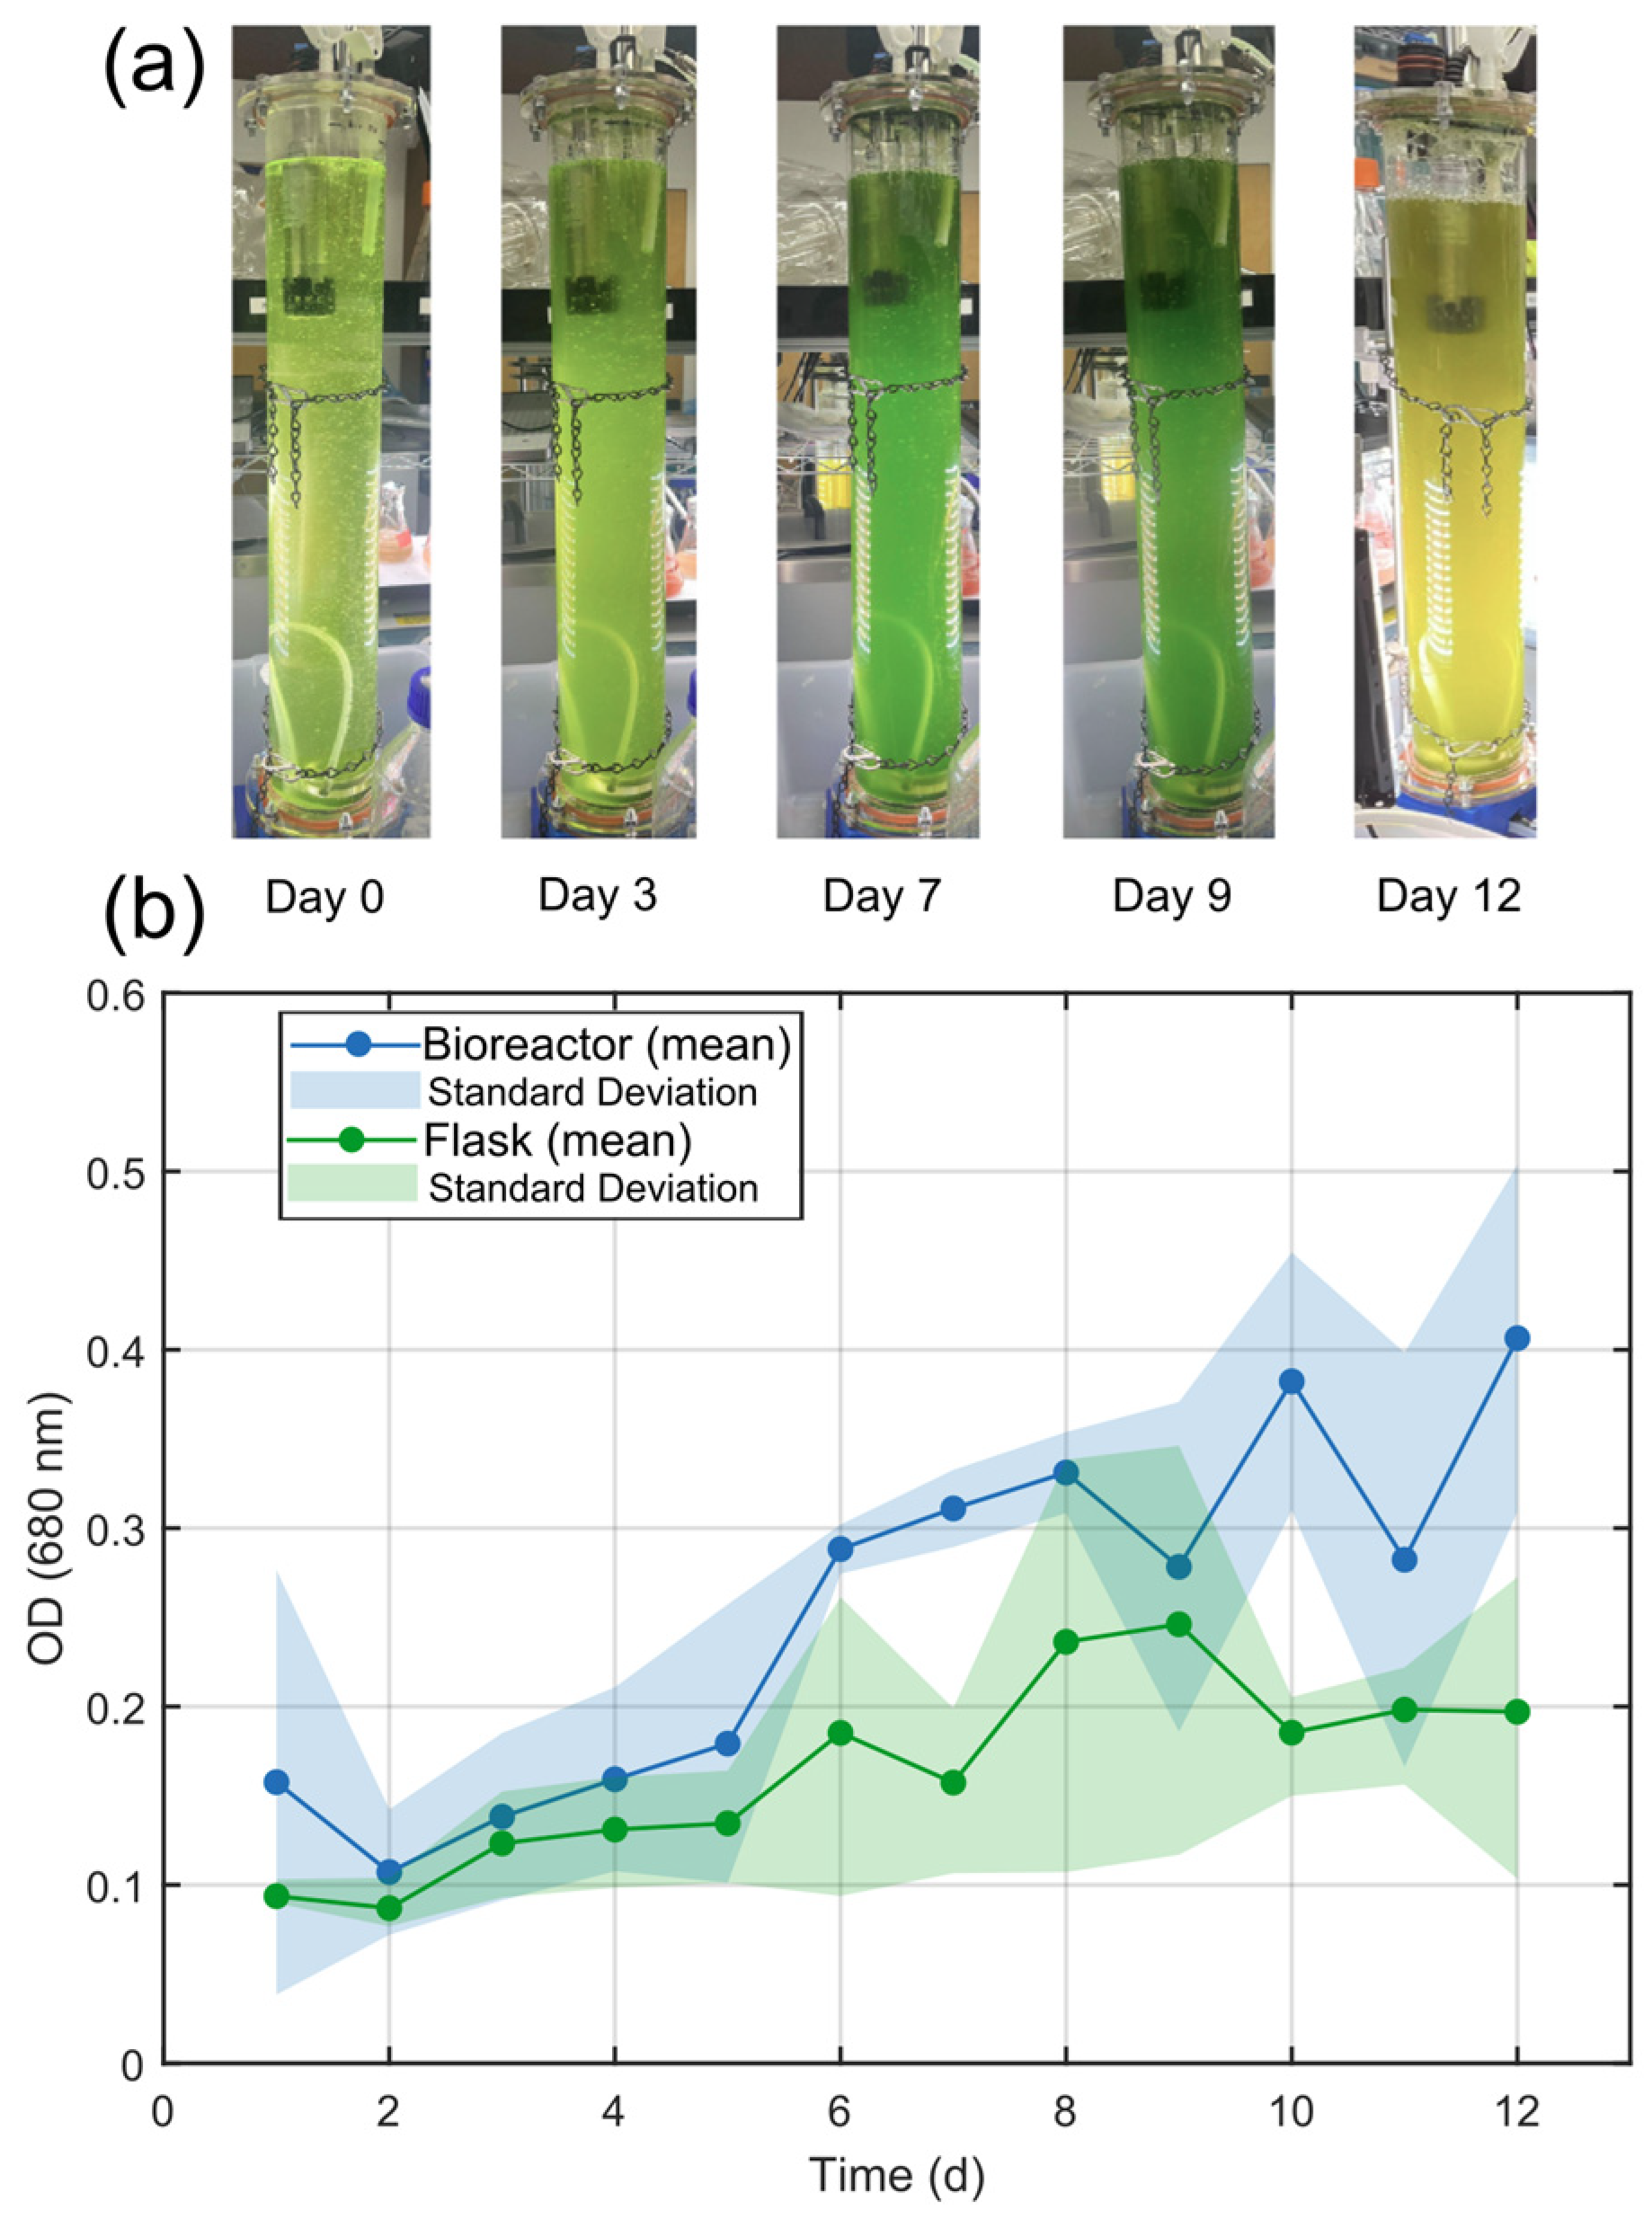
Additionally, a silent bubbler stone was configured at the bottom of the bioreactor to promote further bubbling and mixing within the column (Hygger, Shenzhen, China). Over 12 days of operation, a single 2.0 mL liquid sample was collected every 24 h, and the optical density of four technical replicates of 250 uL of the sample was measured in a 96-well plate using the Tecan plate reader Infinity M plex (Tecan Inc., Männedorf, Switzerland). Separately, four flasks were inoculated with 2.5% v/v of the same seed used to inoculate the bubble column to demonstrate standard microalgae growth trends, resulting in four technical replicates per run. Flask experiments were conducted using the same biological material, culture medium, photoperiod, and controlled room temperature, while differing in reactor configuration, mixing, aeration, and illumination strategy. The flask experiment was conducted twice at the same controlled room temperature with four replicates with a total of eight measurements (see Supplementary Materials, Figure S4). The 500 mL flasks had a total culture volume of 100 mL. The flasks were incubated at 200 rpm and a PPFD of 390 µmol photons m−2 s−1. From each flask, 1.0 mL of sample was taken approximately every 24 h, and optical density was measured twice by pipetting 250 uL of sample into a 96-well plate in duplicates. Figure 6 shows the trends in the photobioreactor and flasks over the course of the experiment.

2.3.2. Analytical Measurements

The optical density was measured as absorbance at 680 nm using a Tecan plate reader Infinity M plex (Tecan Inc., Switzerland), isolated from a spectrum capturing 400 nm to 900 nm in 5 nm intervals. The 680 nm wavelength captures chlorophyll a-containing biomass and was thus used as a proxy for cell density and microalgal growth. Measurements at 680 nm were used because absorbance at this wavelength is strongly associated with chlorophyll a-containing biomass in Haematococcus, which is well-established to have a chlorophyll a and b ratio of 3.5 under the vegetative state. All experiments were performed under the vegetative state [41]. Prior to data analysis, all OD680 measurements were verified to lie within the linear response range of the plate reader based on the laboratory calibration curve relating optical density to dry cell weight; therefore, no dilution of samples was required during the experiment. The calibration curve showing linearity is shown in the Supplementary Materials (Figure S5).
To verify the pH measurements, pH was also measured externally using a Mettler Toledo potentiometer LE409 during each sample collection (Mettler Toledo Co., Columbus, OH, USA). To verify the temperature measurements, ten measurements were taken in a temperature-controlled chamber. The accuracy of each sensor was evaluated by calculating the relative measurement error with respect to a reference instrument. The percentage error was determined as the difference between the sensor reading and the corresponding reference measurement, divided by the reference value and multiplied by 100, as shown in Equation (2).
E r r o r   ( % ) = S e n s o r − r e f e r e n c e r e f e r e n c e × 100

2.3.3. Statistical Methods

The bioreactor experiment was repeated four times with independent inocula, while the flask experiment consisted of two independent sets of four flasks each. Flask experiments shared inoculum with the bioreactor. The growth of H. lacustris was monitored over 12 days using optical density at 680 nm (Figure 6). Prior to statistical analysis, the dataset was screened for outliers using MATLAB R2023 (MathWorks, Natick, MA, USA). Outliers were identified using the isoutlier function with the “quartiles” method, which classifies observations lying more than 1.5 times the interquartile range (IQR) below the first quartile or above the third quartile as outliers. One replicate from the bioreactor growth with a final OD680 was excluded, and one replicate from the flask dataset was also excluded from the primary statistical analysis. Statistical analyses were also performed using the complete dataset to confirm that the conclusions were unchanged.
Averaged absorbance data for the biological and technical replicates of the bioreactor (n = 3, after outlier removal) and flask cultures (n = 7, after outlier removal, see Supplementary Materials for details, Table S3), along with calculated standard deviations, were used to produce a single growth curve for each cultivation method (Figure 6b). OD680 measurements are reported as the mean ± standard deviation (SD). Differences in average final OD680 between the flask and bioreactor cultures were evaluated using both Welch’s two-sample t-test, which does not assume equal variances, and the nonparametric Mann–Whitney U test. Statistical significance was defined as p-value < 0.05.

3. Results and Discussion

Light-driven biotechnology faces challenges in developing laboratory infrastructure capable of providing controlled light to simulate natural day and night cycles, in addition to standard photosynthetic variables such as pH, temperature, and dissolved oxygen. Even with the increasing availability of light-controlled systems in the market, costs remain elevated. Additionally, culturing algae presents its own challenges, as algae behave differently in airlifts, bubble columns, stirred tanks, bags, and other vessels [14].
Through a small survey of several vendors, including Sartorius, GPC, Synoxis Algae, Kbiotech, KIA, and Laboao (Table 2), we found that each company has its own designs and control systems for different types of photobioreactors. The most common products available had working volumes between 1.0 and 5.0 L. The average cost per piece of equipment was $45,850 USD, with a standard deviation of $22,674 USD. Those calculations included six quotes and do not include shipping and tax costs. A comparison was made between the instrumentation developed in this work and a standard commercial version from the brand Kbiotech (Table 3). This version was chosen because it has a price very close to the average of six commercial brands ($38,900 USD), and offers monitoring of the same variables as this work, as well as lighting control via LED lights, as shown in Table 2. The Kbiotech version also provides the capability to control mass flow, a feature that distinguishes it from our version. The comparison shows that both offer similar monitoring and control options, as well as the ability to acquire and display information. However, the total cost of our photobioreactor was less than $1833.07 USD, and it has increased by 15% since the assembly year. Alg-flex was built for $1834 USD in hardware acquisition costs (CAPEX), representing approximately 4% of the average purchase price of comparable commercial photobioreactors. This comparison reflects the initial hardware cost only and does not include operating costs (OPEX), labor, maintenance, or total cost of ownership.
Open-source photobioreactors have been developed with different design objectives and therefore incorporate different combinations of sensing and control capabilities. For example, the Taylor–Couette reactor focuses on illumination and hydrodynamic control, whereas the Environmental Photobioreactor (ePBR) emphasizes environmental simulation with integrated optical density measurements [20,39]. Other systems, including Open Photobioreactor and NinjaPBR, prioritize specific variables such as temperature, pH, optical density, or illumination, while several software-oriented platforms provide only monitoring or control algorithms without complete hardware implementations (Supplementary Materials, Table S1). Consequently, there is currently no open-source platform that simultaneously integrates all sensing, monitoring, and control functions into a single system. In this context, Alg-flex can control pH, liquid level, and gas-phase CO2 and illumination through programmable intensity and waveform selection. Temperature and dissolved oxygen can be continuously monitored. Alg-flex is aimed to be set in rooms with controlled temperature. This modular strategy distinguishes Alg-flex from several existing open-source photobioreactors, which similarly prioritize different combinations of monitoring and control functions depending on their intended application.
Additionally, the modular, open-source design of Alg-flex facilitates component replacement, system customization, and future upgrades using commercially available hardware, reducing dependence on proprietary components and vendor-specific technical support. The overall energy consumption ranges from 0.016 KWh L−1 to 0.030 KWh L−1, depending on the light type (WHITE–RGB). In a growth experiment with a culture volume of 3.65 L, the Raspberry Pi and sensor modules consumed 9.507 W, excluding the lighting system. Over one hour of operation, this represents a specific energy consumption of 0.0026 kWh L−1. The lighting intensity can be adjusted between 0 and 100%, with a maximum power consumption of 110 W at full intensity. Consequently, the total system power consumption ranges from 9.507 W to 119.5 W, resulting in a maximum specific energy consumption of 0.032 kWh L−1 under full illumination. For comparison, a specific energy consumption of 0.124 kWh L−1 under similar operating conditions has been reported [18]. For the 12-day bioreactor experiment, the light intensity was 18% for the first two days, then increased to 25% until day six, and finally reached 50% from day six to 12. This resulted in variations in daily consumption, yielding a total of 14.09 kWh for 3.65 L over the 12 days of the experiment, corresponding to an average consumption of 0.0134 kWh L−1 h−1 corresponding to an average power consumption of approximately 13.55 W L−1. Control of light intensity is critical for column systems with Alg-flex properties, in which shading can be achieved at 0.25 g/L based on the previously reported light-field characterization model [42]. Alternatively, excessive light intensity can damage cellular photosynthetic machinery, resulting in bleaching, reduced growth rates, and/or cell death [43]. Overall, a system that can regulate light intensity could help mitigate these adverse effects, although the exact lighting ramps will depend on the system configuration and the microorganisms under study.
The low-cost, open-hardware, and open-software design allows this system to be maintained without requiring advanced technical expertise, resulting in a longer operational lifespan. Combined with its low energy consumption, these features demonstrate the potential of the Alg-flex system for future light-driven biomanufacturing. These advantages support the expansion of this operation to parallel systems, in which a series of six to 25 bioreactors are set up in a controlled manner [44]. To our knowledge, controlled parallel culturing has been applied only to heterotrophic organisms in academic settings. The development of open-source control systems enables easy sharing of code and data from the photobioreactor. For instance, the photobioreactor displays real-time sensor data and allows export of the data as CSV files. Those files follow the Findable, Accessible, Interoperable, and Reusable (FAIR) policies of this new era of big data [45], in which data are easily discoverable, accessible, compatible with other data systems, and usable for various purposes by different users.
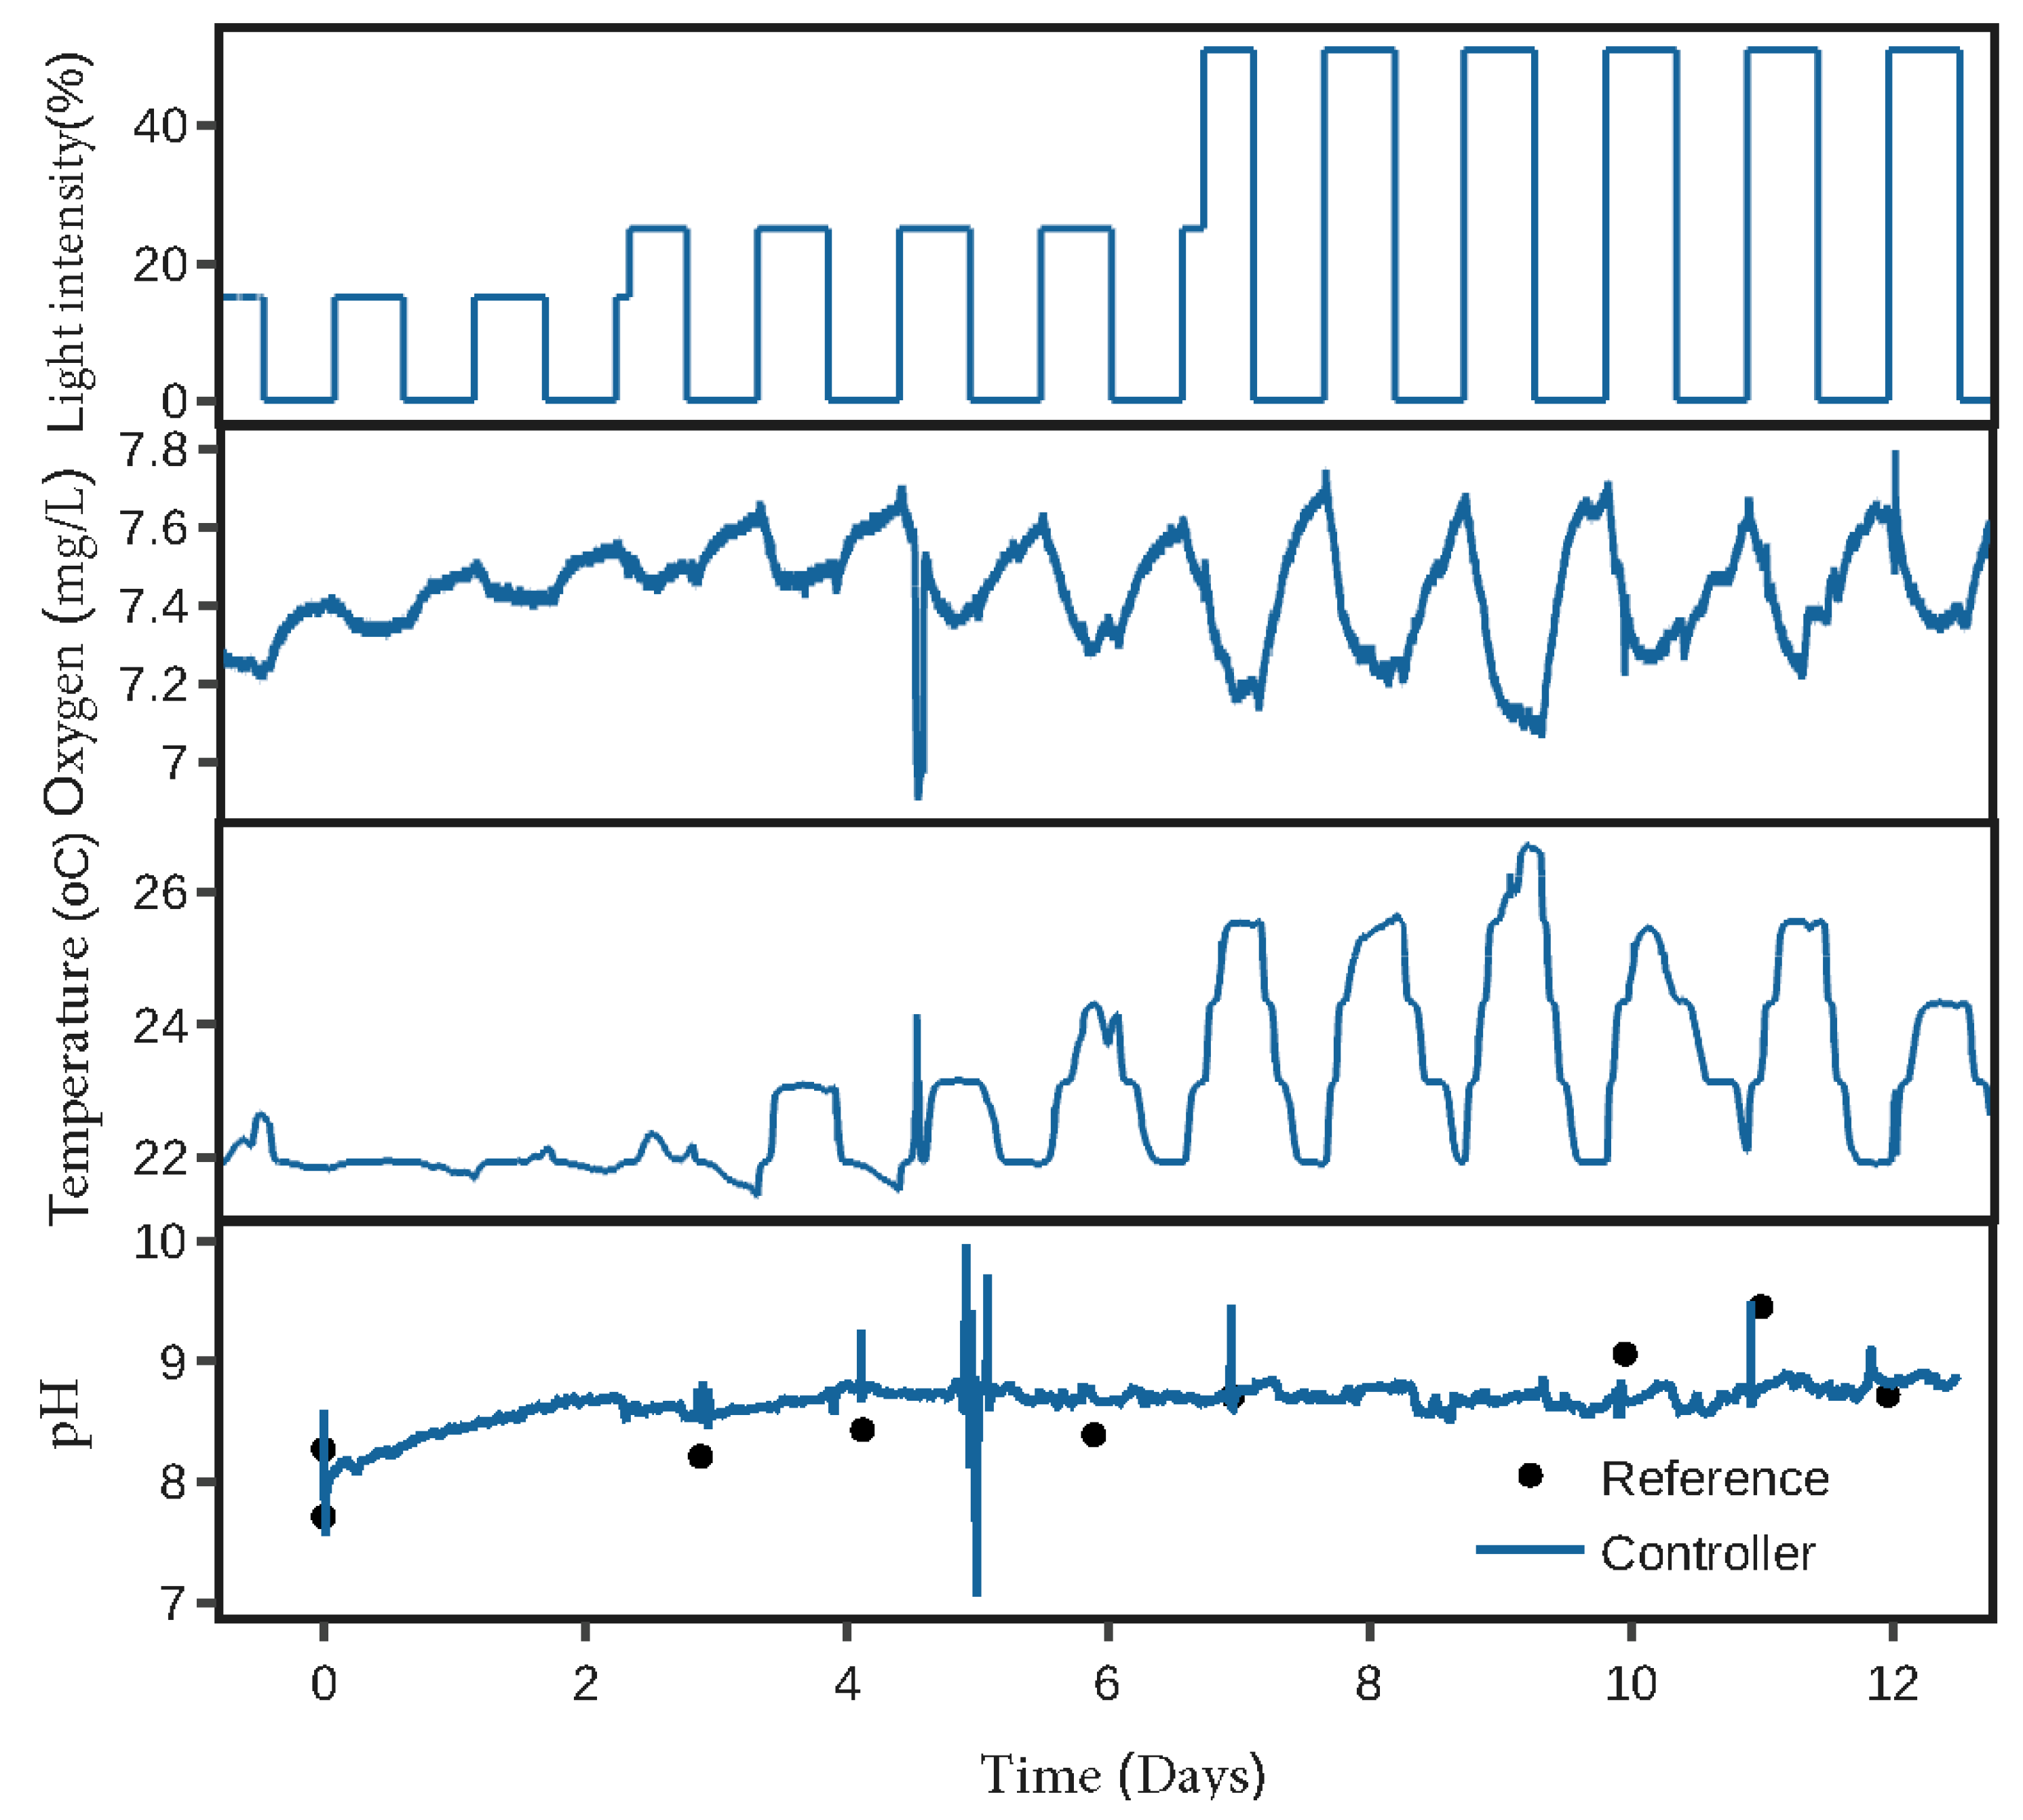
The instrumented Alg-flex was used to cultivate H. lacustris in a bubble column (Figure 4, Figure 5 and Figure 6), resulting in a final optical density that was significantly higher than that observed in flask cultures 0.40 ± 0.09 and 0.19 ± 0.09. Statistical comparisons were performed on the estimated growth rates, which differed significantly between the two cultivation systems (Welch’s t-test (p = 0.0381) and Mann–Whitney U test (p = 0.0333); Figure 6). Similar overall growth trends were observed in both cultivation systems; however, the bioreactor cultures reached a higher final optical density after 12 days of cultivation. Interestingly, in the later stages of the experiment, the photobioreactor cultures gradually changed from green to yellow, whereas the flask cultures remained predominantly green over the same cultivation period. This observation suggests that the different cultivation environments may have influenced the physiological state of the cultures. However, because pigment composition and photosynthetic activity were not quantified in this study, no mechanistic interpretation is made. During cultivation, the pH slightly increased, passing from pH 8.27 to 9.0. For bioreactor experiments, the light intensity was kept low at the start and increased gradually to 50% of the maximum. Both temperature and dissolved oxygen oscillated at the same frequency as the light–dark cycles.
Changes in maximal growth are anticipated, since various factors, including cultivation type and volume, have systemic impact on microalgal growth dynamics and biomass productivity [46]. Still, the observed variation in growth trend between flask and photobioreactor cultivation under standard growth conditions and similar environmental conditions emphasizes the significance of reactor design and control in developing robust algal cultivation systems.
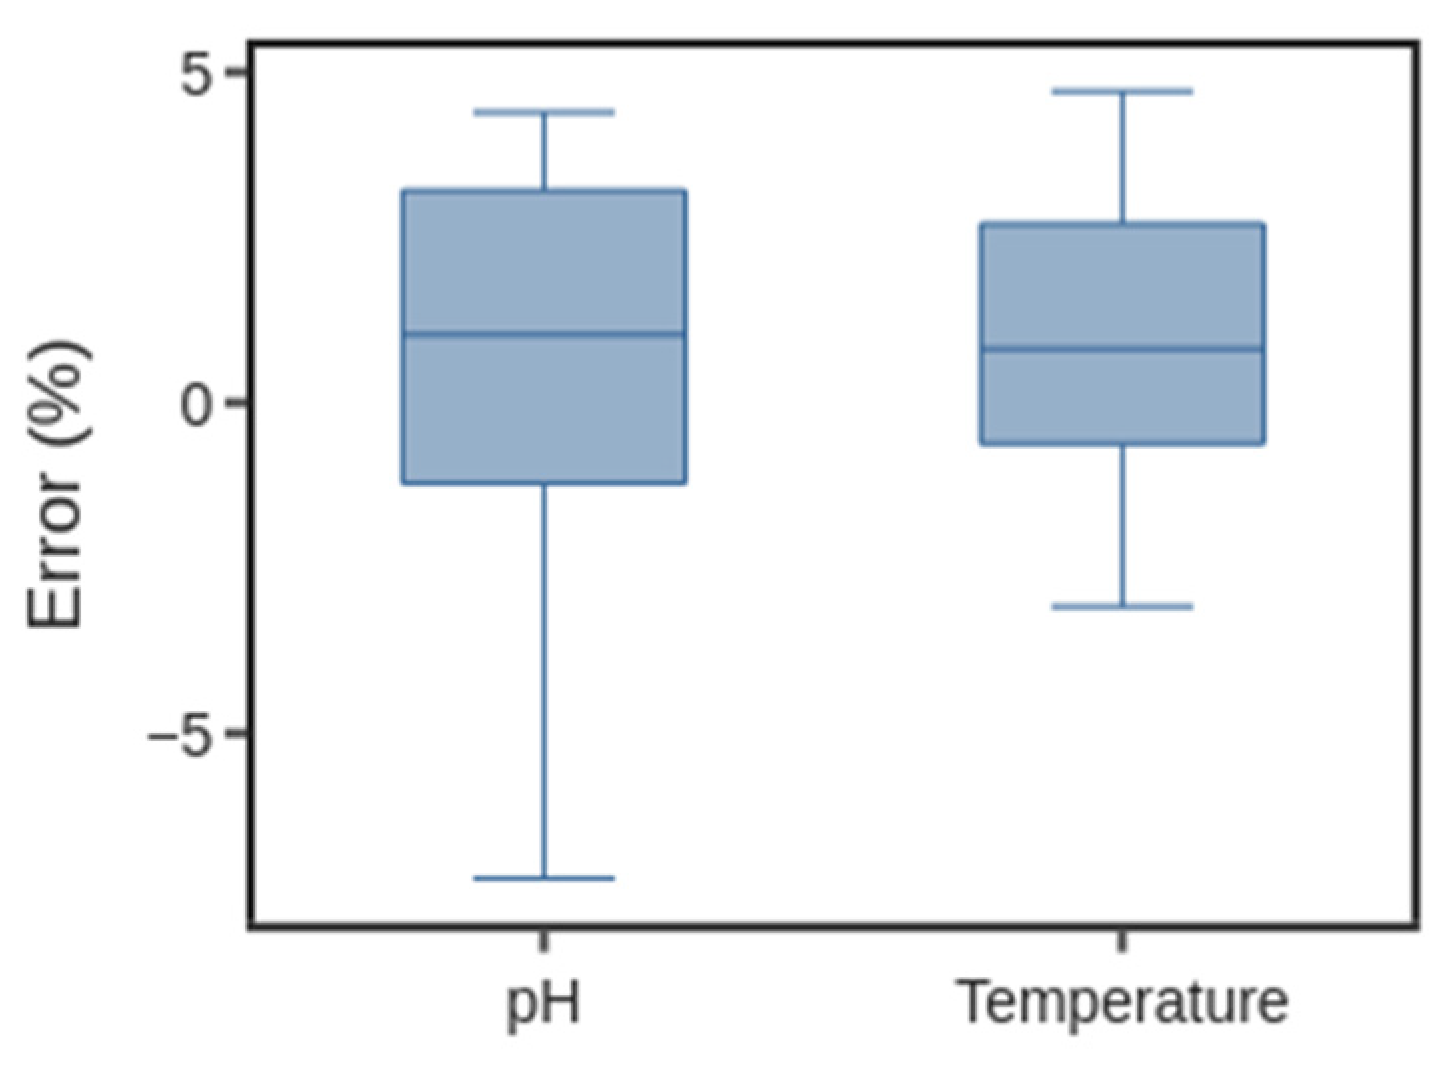
Both temperature and DO exhibited oscillatory profiles during the experiment. Although changes in these profiles coincided with variations in the light conditions, the DO trace appears to be predominantly influenced by the thermal cycle. Therefore, the DO signal is not quantitatively interpreted in terms of biological oxygen production or consumption and is presented only to demonstrate the continuous data acquisition capability of the Alg-flex platform. The pH value did not show oscillations; instead, it increased steadily between 8.27 and 9.01 (see Figure 7). The pH sensor measurements showed good correlation with external pH meter measurements. The median errors were 1.05% and 0.81%; the upper quartiles were 3.21%, and the lower quartiles were −1.22% for pH (Figure 8). The collection of data in an automatic manner enables the design of intelligent systems as well as accelerates the development of new models of cultivation that can accommodate photo-, hetero-, and mixotrophic growth. For example, the microalgae H. lacustris used in this study has the metabolic potential to grow under all growth modes. It should be noted that this validation corresponds to the operating conditions used during H. lacustris cultivation (approximately pH 7.7–9.5 and 22–24 °C) and not a control system.

4. Conclusions

Precision photosynthesis enables the faster implementation of microorganism-driven technologies for successful biomanufacturing. Constructing bioreactors to monitor and control biological variables (e.g., pH and temperature) is critical to making biotechnological processes competitive.
Here, we developed Alg-flex, a high-precision monitoring and control system that uses affordable, widely available hardware. Alg-flex included sensors for pH, temperature, level, dissolved oxygen, and CO2, as well as an adaptive light modulation system. The development and implementation of Alg-flex cost $1834 USD and yielded reliable measurements. The proposed platform demonstrated accurate pH and temperature measurements, with median relative errors below 1.5% compared with benchtop reference instruments. The remaining sensing channels were successfully integrated for continuous monitoring but require additional quantitative validation in future work. Under the tested conditions, H. lacustris cultures in the bioreactor exhibited approximately two-fold higher optical density than flask cultures, with significantly different final optical densities (p = 0.0333). However, because the cultivation systems differed in several operational conditions, the observed differences cannot be attributed specifically to the Alg-flex platform or to any individual controlled parameter. Such automation and real-time monitoring may contribute to reducing the economic barriers associated with implementing smart biomanufacturing systems. Overall, Alg-flex provides a modular and portable platform for controlled microalgae cultivation that can be readily replicated and customized. Its scalable architecture also provides a foundation for future multi-reactor configurations and parallel experiments, with potential applications in higher-throughput studies of light-driven bioproduction.
Future work will include three-point pH calibration to improve measurement accuracy across the operational pH range, as well as closed-loop pH control with automated CO2 dosing, real-time DO feedback, and machine-learning-based predictors. These developments could further improve the monitoring and control capabilities of Alg-flex and support its evolution toward a more autonomous platform for sustainable biomanufacturing.

Supplementary Materials

The following supporting information can be downloaded at https://www.mdpi.com/article/10.3390/phycology6030096/s1, Figure S1. Two-point calibration curve for the pH sensor. Figure S2. Detailed drawing of the photobioreactor top cover used to implement the Alg-flex system. Figure S3. Detailed drawing of the photobioreactor lower cover used to implement the Alg-flex system. Figure S4. Representative time series of live sensor data recorded during the second replicate of the bioreactor cultivation experiment. Similar temporal profiles were observed across all cultivation replicates. Figure S5. Relationship between optical density at 680 nm (OD680) and dry cell weight of Haematococcus lacustris. Supplementary Table S1. Comparative sensor and control features in publicly available bioreactors [47,48,49,50,51]. Supplementary Table S2. Temperature Sensitivity and Compensation Characteristics of the Sensors Integrated into the Alg-flex System. Supplementary Table S3. Supplementary source data for main Figure 6. Supplementary source data for main Figure 6.

Author Contributions

Conceptualization, N.S.Z.-P. and C.Z.; methodology, N.S.Z.-P.; software, S.G.-N.; validation, A.H., A.S. and N.H.-R.; investigation, N.S.Z.-P. and A.H.; resources, N.H.-R. and C.Z.; writing—original draft preparation, N.S.Z.-P.; writing—review and editing, A.H. and C.Z.; visualization, A.H., A.S., S.G.-N. and C.Z.; supervision, S.G.-N. and C.Z.; project administration, C.Z.; funding acquisition, C.Z. All authors have read and agreed to the published version of the manuscript.

Funding

This work was supported by San Diego State University, the National Science Foundation (Grant No. 2313313), and the United States Department of Agriculture (USDA-NIFA-AFRI 2024-67017-42676, USDA-NIFA-NNF 2025-38420-44387). AH was supported by the USDA NIFA NextGen grant to the California State University Agricultural Research Institute, award number 2023-70440-40177. Any opinions, findings, conclusions, or recommendations expressed in this material are those of the author(s) and do not necessarily reflect the views of the National Science Foundation and the United States Department of Agriculture. This work was supported by the Council of Science, Technology, and Innovation (CITNOVA) of Hidalgo State, Mexico, through the international research scholarship program to N.S.Z-P and S.G-N.

Data Availability Statement

Data supporting the findings of this study are available in the GitHub repository “https://github.com/CZLaboratory/Photobioreactor-Instrumentation” (accessed on 20 August 2026) DOI:10.5281/zenodo.21984345.

Acknowledgments

The authors are thankful to Juan Cabello from Universidad Autonoma Metropolitana Unidad Iztapalapa for fruitful discussions and to Daniel Norena-Caro, Isabel Mason, and Barbara Saucedo from San Diego State University for data collection.

Conflicts of Interest

The authors declare that they have no known competing financial interests or personal relationships that could have influenced the work reported in this study.

References

  1. Available online: https://www.un.org/sustainabledevelopment/economic-growth/ (accessed on 1 March 2024).
  2. Li, C.-T.; Eng, R.; Zuniga, C.; Huang, K.-W.; Chen, Y.; Zengler, K.; Betenbaugh, M.J. Optimization of Nutrient Utilization Efficiency and Productivity for Algal Cultures under Light and Dark Cycles Using Genome-Scale Model Process Control. npj Syst. Biol. Appl. 2023, 9, 7. [Google Scholar] [CrossRef] [Scilit] [PubMed]
  3. Norena-Caro, D.A.; Posada-Uribe, L.F.; Morales-Ibarria, M.G.; Canto-Encalada, G.; Álvarez-Láinez, M.L.; Zúñiga, C. Natural Color Biofactories: Advancing the Spectrum of Pigment Production in Phototrophic Microbes. FEMS Microbes 2025, 6, xtaf019. [Google Scholar] [CrossRef] [Scilit] [PubMed]
  4. Esquivel-Hernández, D.A.; Harnden, A.; Peña, C.Z.; Ruiz-Ruiz, P.; Linares, L.C.F.; Morales-Ibarría, M. Microalgae-Derived Biopolymers as Potential Bioplastics. In Handbook of Microalgae-Based Processes and Products; Elsevier: Amsterdam, The Netherlands, 2026; pp. 681–705. [Google Scholar]
  5. Chen, Y.; Wu, R.; Hsu, P.-C. Perspective on Distributed Direct Air Capture: What, Why, and How? npj Mater. Sustain. 2025, 3, 12. [Google Scholar] [CrossRef] [Scilit]
  6. Kanna Dasan, Y.; Lam, M.K.; Chai, Y.H.; Lim, J.W.; Ho, Y.C.; Tan, I.S.; Lau, S.Y.; Show, P.L.; Lee, K.T. Unlocking the Potential of Microalgae Bio-Factories for Carbon Dioxide Mitigation: A Comprehensive Exploration of Recent Advances, Key Challenges, and Energy-Economic Insights. Bioresour. Technol. 2023, 380, 129094. [Google Scholar] [CrossRef] [Scilit] [PubMed]
  7. Tec-Campos, D.; Kumar, M.; Parra, N.; Bracamonte, A.; Castillo-Sanchez, A.; Pae, J.; Zuñiga, C.; Zengler, K. Predictive Algal Systems Biology: Integrating Omics, Genome-Scale Metabolic Models, and Machine Learning. Bioengineering 2026, 13, 633. [Google Scholar] [CrossRef] [Scilit] [PubMed]
  8. Singh, V.K.; Jiménez Del Val, I.; Glassey, J.; Kavousi, F. Integration Approaches to Model Bioreactor Hydrodynamics and Cellular Kinetics for Advancing Bioprocess Optimisation. Bioengineering 2024, 11, 546. [Google Scholar] [CrossRef] [Scilit] [PubMed]
  9. Wang, C.; Wang, K.; Ning, J.; Luo, Q.; Yang, Y.; Huang, D.; Li, H. Transcription Factors From Involved in the Regulation of Astaxanthin Biosynthesis Under High Light-Sodium Acetate Stress. Front. Bioeng. Biotechnol. 2021, 9, 650178. [Google Scholar] [CrossRef] [Scilit] [PubMed]
  10. Andersson, B.; Shen, C.; Cantrell, M.; Dandy, D.S.; Peers, G. The Fluctuating Cell-Specific Light Environment and Its Effects on Cyanobacterial Physiology. Plant Physiol. 2019, 181, 547–564. [Google Scholar] [CrossRef] [Scilit] [PubMed]
  11. Fernández, F.G.A.; Fernández-Sevilla, J.M.; Moya, B.L.; Grima, E.M. Microalgae Production Systems. In Handbook of Microalgae-Based Processes and Products; Elsevier: Amsterdam, The Netherlands, 2020; pp. 127–163. [Google Scholar]
  12. Guagalango-Gómez, P.J.; Balbuena-Campuzano, C.A.; Chunab-Rodríguez, M.A.; Rodríguez-Arce, J.; Viñolas, J.; Santana-Díaz, A. Raspberry Pi-Based Low-Cost System for Electrical Parameters Gathering and Analysis for Performance Evaluation of Electric Vehicles. IEEE Trans. Instrum. Meas. 2023, 72, 3000309. [Google Scholar] [CrossRef] [Scilit]
  13. Reardon, K.F. Practical Monitoring Technologies for Cells and Substrates in Biomanufacturing. Curr. Opin. Biotechnol. 2021, 71, 225–230. [Google Scholar] [CrossRef] [Scilit] [PubMed]
  14. Uyar, B.; Ali, M.D.; Uyar, G.E.O. Design Parameters Comparison of Bubble Column, Airlift and Stirred Tank Photobioreactors for Microalgae Production. Bioprocess Biosyst. Eng. 2024, 47, 195–209. [Google Scholar] [CrossRef] [Scilit] [PubMed]
  15. Castillo, L.A.; Valadés-Pelayo, P.J.; Avila-Paredes, H.J.; Cabello, J.J.; Balbuena, A. Methodology for the Fast Direct Estimation of Spectral Radiative Transport Properties in Microalgae Photobioreactors. Chem. Eng. J. 2023, 458, 141462. [Google Scholar] [CrossRef] [Scilit]
  16. Wang, B.; Wang, Z.; Chen, T.; Zhao, X. Development of Novel Bioreactor Control Systems Based on Smart Sensors and Actuators. Front. Bioeng. Biotechnol. 2020, 8, 7. [Google Scholar] [CrossRef] [Scilit] [PubMed]
  17. Efromson, J.P.; Li, S.; Lynch, M.D. BioSamplr: An Open Source, Low Cost Automated Sampling System for Bioreactors. HardwareX 2021, 9, e00177. [Google Scholar] [CrossRef] [Scilit] [PubMed]
  18. Erbland, P.; Caron, S.; Peterson, M.; Alyokhin, A. Design and Performance of a Low-Cost, Automated, Large-Scale Photobioreactor for Microalgae Production. Aquac. Eng. 2021, 90, 102103. [Google Scholar] [CrossRef] [Scilit]
  19. Baho, I.; Tseo, Y.; Zu, Y.; Padia, V.; Stephanopoulos, G.; Hunter, I. An Open-Source Modular Bioreactor Platform for Cultivation of Synechocystis sp. PCC 6803 and Extraction of Intracellular Glucose. Processes 2025, 13, 2985. [Google Scholar] [CrossRef] [Scilit] [PubMed]
  20. Bates, H.; Zavafer, A.; Szabó, M.; Ralph, P.J. The Phenobottle, an Open-Source Photobioreactor Platform for Environmental Simulation. Algal Res. 2020, 52, 102105. [Google Scholar] [CrossRef] [Scilit]
  21. Paiva, R.J.; Oliveira, D.T.D.E.; Mescouto, V.A.D.E.; Santos, A.V.; Gonçalves, E.C.; Noronha, R.C.R.; Nascimento, L.A.S.D.O. Development and Evaluation of Low-Cost Flat Plate Photobioreactors for Microalgae and Cyanobacteria Cultivation with Biotechnological Potential. An. Acad. Bras. Ciênc. 2024, 96, e20230273. [Google Scholar] [CrossRef] [Scilit] [PubMed]
  22. Lee, H.-H.; Xing, Q.; Park, J.-S.; Lee, H.; Yarish, C.; Kim, J.K. Effects of Different Artificial Photosynthetically Active Radiation (PAR) Sources and Intensity on the Growth and Nutrient Uptake in Ulva Prolifera and Neopyropia Yezoensis. Algal Res. 2023, 72, 103151. [Google Scholar] [CrossRef] [Scilit]
  23. Kalamaras, S.D.; Tsitsimpikou, M.-A.; Tzenos, C.A.; Lithourgidis, A.A.; Pitsikoglou, D.S.; Kotsopoulos, T.A. A Low-Cost IoT System Based on the ESP32 Microcontroller for Efficient Monitoring of a Pilot Anaerobic Biogas Reactor. Appl. Sci. 2024, 15, 34. [Google Scholar] [CrossRef] [Scilit]
  24. García García, B.; Fernández-Manteca, M.G.; Gómez-Galdós, C.; Deus Álvarez, S.; Monteoliva, A.P.; López-Higuera, J.M.; Algorri, J.F.; Ocampo-Sosa, A.A.; Rodríguez-Cobo, L.; Cobo, A. Integration of Fluorescence Spectroscopy into a Photobioreactor for the Monitoring of Cyanobacteria. Biosensors 2025, 15, 128. [Google Scholar] [CrossRef] [Scilit] [PubMed]
  25. Schrimpf, M.; Esteban, J.; Warmeling, H.; Färber, T.; Behr, A.; Vorholt, A.J. Taylor-Couette Reactor: Principles, Design, and Applications. AIChE J. 2021, 67, e17228. [Google Scholar] [CrossRef] [Scilit]
  26. Porras Reyes, L.; Havlik, I.; Beutel, S. Software Sensors in the Monitoring of Microalgae Cultivations. Rev. Environ. Sci. Biotechnol. 2024, 23, 67–92. [Google Scholar] [CrossRef] [Scilit]
  27. Lo, Y.-L.; Chu, C.-S.; Yur, J.-P.; Chang, Y.-C. Temperature Compensation of Fluorescence Intensity-Based Fiber-Optic Oxygen Sensors Using Modified Stern–Volmer Model. Sens. Actuators B Chem. 2008, 131, 479–488. [Google Scholar] [CrossRef] [Scilit]
  28. Zhao, Y.; Zhang, H.; Jin, Q.; Jia, D.; Liu, T. Ratiometric Optical Fiber Dissolved Oxygen Sensor Based on Fluorescence Quenching Principle. Sensors 2022, 22, 4811. [Google Scholar] [CrossRef] [Scilit] [PubMed]
  29. Lamers, P.P.; van de Laak, C.C.W.; Kaasenbrood, P.S.; Lorier, J.; Janssen, M.; De Vos, R.C.H.; Bino, R.J.; Wijffels, R.H. Carotenoid and Fatty Acid Metabolism in Light-Stressed Dunaliella salina. Biotechnol. Bioeng. 2010, 106, 638–648. [Google Scholar] [CrossRef] [Scilit] [PubMed]
  30. Du, W.; Jongbloets, J.A.; Pineda Hernández, H.; Bruggeman, F.J.; Hellingwerf, K.J.; Branco dos Santos, F. Photonfluxostat: A Method for Light-Limited Batch Cultivation of Cyanobacteria at Different, yet Constant, Growth Rates. Algal Res. 2016, 20, 118–125. [Google Scholar] [CrossRef] [Scilit]
  31. Sharakshane, A. An Easy Estimate of the PFDD for a Plant Illuminated with White LEDs: 1000 Lx = 15 μmol/s/m2. bioRxiv 2018. [Google Scholar] [CrossRef] [Scilit]
  32. Sugano, S.; Nitta, R.; Shindo, K.; Nomoto, A.; Yoda, S.; Shigemura, T.; Ishii, M.; Tanabe, S.-I. Spectral Irradiance Simulation for Evaluating Light Environments for Indoor Plants. Jpn. Arch. Rev. 2021, 4, 649–659. [Google Scholar] [CrossRef] [Scilit]
  33. Abu-Ghosh, S.; Fixler, D.; Dubinsky, Z.; Solovchenko, A.; Zigman, M.; Yehoshua, Y.; Iluz, D. Flashing Light Enhancement of Photosynthesis and Growth Occurs When Photochemistry and Photoprotection Are Balanced in Dunaliella salina. Eur. J. Phycol. 2015, 50, 469–480. [Google Scholar] [CrossRef] [Scilit]
  34. Liu, L.; Ying, K.; Wu, K.; Tang, S.; Zhou, J.; Cai, Z. Promoting the Growth of Haematococcus lacustris under High Light Intensity through the Combination of Light/dark Cycle and Light Color. J. Mar. Sci. Eng. 2022, 10, 839. [Google Scholar] [CrossRef] [Scilit]
  35. Xi, Y.; Wang, J.; Chu, Y.; Chi, Z.; Xue, S. Effects of Different Light Regimes on Dunaliella salina Growth and β-Carotene Accumulation. Algal Res. 2020, 52, 102111. [Google Scholar] [CrossRef] [Scilit]
  36. Mumpuni, S.S.; Astutik, R.P. Implementation of Raspberry Pi PICO as PLC for Monitoring and Control in Swiftlet Cultivation Based on Weintek HMI. G-Tech J. Teknol. Terap. 2025, 9, 266–274. [Google Scholar] [CrossRef] [Scilit]
  37. Andrei, C.C.; Tudor, G.; Arhip-Calin, M.; Fierascu, G.; Urcan, C. Raspberry Pi, an Alternative Low-Cost PLC. In Proceedings of the 2020 International Symposium on Fundamentals of Electrical Engineering (ISFEE), Bucharest, Romania, 5–7 November 2020. [Google Scholar]
  38. Loconte, D.; Ieva, S.; Pinto, A.; Loseto, G.; Scioscia, F.; Ruta, M. Expanding the Cloud-to-Edge Continuum to the IoT in Serverless Federated Learning. Future Gener. Comput. Syst. 2024, 155, 447–462. [Google Scholar] [CrossRef] [Scilit]
  39. Lucker, B.F.; Hall, C.C.; Zegarac, R.; Kramer, D.M. The Environmental Photobioreactor (ePBR): An Algal Culturing Platform for Simulating Dynamic Natural Environments. Algal Res. 2014, 6, 242–249. [Google Scholar] [CrossRef] [Scilit]
  40. Oncel, S.S.; Imamoglu, E.; Gunerken, E.; Sukan, F.V. Comparison of Different Cultivation Modes and Light Intensities Using Mono-cultures and Co-cultures of Haematococcus pluvialis and Chlorella zofingiensis. J. Chem. Technol. Biotechnol. 2011, 86, 414–420. [Google Scholar] [CrossRef] [Scilit]
  41. Stegemüller, L.; Caccavale, F.; Valverde-Pérez, B.; Angelidaki, I. Online Monitoring of Haematococcus lacustris Cell Cycle Using Machine and Deep Learning Techniques. Bioresour. Technol. 2025, 418, 131976. [Google Scholar] [CrossRef] [Scilit] [PubMed]
  42. Li, X.; Yang, N. Modeling the Light Distribution in Airlift Photobioreactors under Simultaneous External and Internal Illumination Using the Two-Flux Model. Chem. Eng. Sci. 2013, 88, 16–22. [Google Scholar] [CrossRef] [Scilit]
  43. Takahashi, S.; Murata, N. How Do Environmental Stresses Accelerate Photoinhibition? Trends Plant Sci. 2008, 13, 178–182. [Google Scholar] [CrossRef] [Scilit] [PubMed]
  44. Junne, S.; Neubauer, P. How Scalable and Suitable Are Single-Use Bioreactors? Curr. Opin. Biotechnol. 2018, 53, 240–247. [Google Scholar] [CrossRef] [Scilit] [PubMed]
  45. Rule, A.; Birmingham, A.; Zuniga, C.; Altintas, I.; Huang, S.-C.; Knight, R.; Moshiri, N.; Nguyen, M.H.; Rosenthal, S.B.; Pérez, F.; et al. Ten Simple Rules for Writing and Sharing Computational Analyses in Jupyter Notebooks. PLoS Comput. Biol. 2019, 15, e1007007. [Google Scholar] [CrossRef] [Scilit] [PubMed]
  46. Abdur Razzak, S.; Bahar, K.; Islam, K.M.O.; Haniffa, A.K.; Faruque, M.O.; Hossain, S.M.Z.; Hossain, M.M. Microalgae Cultivation in Photobioreactors: Sustainable Solutions for a Greener Future. Green Chem. Eng. 2024, 5, 418–439. [Google Scholar] [CrossRef] [Scilit]
  47. GitHub. VitorFrost/Photobioreactor: Open PhotoBioReactor Is an Platform for Resarch, Education and Small Companies Who Want to Implement a Low Cost PBR. Available online: https://github.com/VitorFrost/photobioreactor (accessed on 3 August 2026).
  48. GitHub. Roblehmann/NinjaPBR: NinjaPBR—An Open-Source Photobioreactor to Study Circadian Growth in Microalgae and Cyanobacteria. Available online: https://github.com/roblehmann/NinjaPBR (accessed on 3 August 2026).
  49. GitHub. TamataOcean/TamataSpiru: PhotoBioReactor Control App to Make Growing Spirulina. Available online: https://github.com/TamataOcean/TamataSpiru (accessed on 3 August 2026).
  50. GitHub. SmartBioTech/PBR-ControlScripts: Control Scripts for Photon Systems Instruments (PSI) Bioreactor Client. Available online: https://github.com/SmartBioTech/PBR-ControlScripts (accessed on 18 August 2026).
  51. GitHub. Rajul-Kk/Microalgae-Growth-Monitor: Full-Stack Monitoring and Control System for Photobioreactor Facilities—Real-Time MQTT Sensor Ingestion, Prophet-Based Anomaly Detection, and Recurrent-LSTM with PPO Reinforcement Learning Control Recommendations. Available online: https://github.com/rajul-kk/microalgae-growth-monitor (accessed on 18 August 2026).
Figure 1. Bioreactor connections diagram.
Phycology 06 00096 g001
Figure 2. Flowchart of operations in the acquisition and control system. A Proportional–Integral–Derivative (PID) control strategy is employed to ensure that the bioreactor operates within the desired ranges and setpoints of key process variables. All functions are implemented, except: * monitoring only; ** future implementation.
Phycology 06 00096 g002
Figure 3. Bioreactor interface. (a) Sensor view, (b) light control, (c) data saving display.
Phycology 06 00096 g003
Figure 4. Alg-flex set up coupled to a column bioreactor. (a) Instrumented bioreactor. The bubble column is on the left side, while the instrumentation module is on the right. (b) Bioreactor control module. The Human–Machine Interface (HMI) consists of a touchscreen and a numeric keypad. (c) The electronic components for the sensor conditioning include the Raspberry Pi embedded computer and power supplies.
Phycology 06 00096 g004
Figure 5. Placement of sensors. (a) The upper portion of the bioreactor, where the pH, dissolved oxygen, and temperature sensors were positioned, as well as a pipe that allows measuring CO2. (b) The lower portion, where the level sensor and the air inlet were located. The details of the dimensions are provided in the Supplementary Materials (Figures S2 and S3).
Phycology 06 00096 g005
Figure 6. Bioreactor performance using Alg-flex. (a) Pictures of H. lacustris in the bubble column over time. (b) Averaged three optical density (OD) measurements from the bioreactor. The average optical density of the flasks is shown as a proxy of cell concentration. The blue and green shaded regions represent the respective standard deviations from each cultivation experiment. Final OD680 of 0.4 ± 0.09 and 0.19 ± 0.09 were calculated for the bioreactors and flasks, respectively. Averages were significantly different with a p-value < 0.05 for a Welch’s t-test (p = 0.0381) and Mann–Whitney U test (p = 0.0333). Source data deploying all measurements is provided in the Supplementary Materials in Table S3.
Phycology 06 00096 g006
Figure 7. Representative time series of live sensor data recorded during a single bioreactor experiment. Similar temporal profiles were observed across replicate cultivation experiments; therefore, only one representative run is shown for clarity. The controller records data every second, while plots display data sampled every 10 s. Percentage of light intensity when 100% is equivalent to approximately 807 μmol photons m−2 s−1 (PPFD).
Phycology 06 00096 g007
Figure 8. Box plot of relative errors between the controller and reference measurements for pH (n = 15; validation range approximately pH 7.7–9.5) and temperature (n = 10; validation range 22–24 °C). The median errors were 1.05% and 0.81%, the upper quartiles were 3.21% and 2.7%, and the lower quartiles were −1.22% and −0.62% for pH and temperature, respectively.
Phycology 06 00096 g008
Table 1. Cost of devices for the developed automation and measurement system.
PartVendorCatalog Number NUMBERCost (USD) *
October 2023
Cost (USD) **
June 2026
Pressure sensorBlue Robotics, Los Angeles, CA, USABar02$87.32$92.77
Analog-to-digital converters MCP3008Mouser Electronics, Mansfield, TX, USA579-MCP3008-I/P$23.76$27.92
CO2 Sensor ***ComWinTop, Shenzen, GD, CHNCWT-CO2-200K-EXP-O$145.92$171.46
16-Channel 12-bit PWM/Servo driver I2C (PCA9685)Adafruit, Brooklyn, NY, USAPCA9685$37$43.48
Temperature sensorHuadian Automation Technology Co., Ltd., Huaibei, CHNTemperature Transmitter PT100$62.09$72.96
Raspberry Pi with touchscreen and caseCanaKit, Vancouver, BC, CANSKU: PI4-8GB-EXT128EW-C8-BLK
SKU: RSP-LCD-C4-PI4-BLK
SKU: RSP-DISPLAY
$319$374.83
pH sensorAlvin Instrument, Shenzen, GD, CHN PH101$269.38$316.52
Dissolved oxygen sensorAlibaba.com, Hangzhou, CHNRS485 WIFI 4G GPRS LORA LORAWAN 2 IN 1$591.13$694.58
Peristaltic pumpAmazon, Seatle, WA, USASKU: ff_Cinn_151810122200793-14$12.3$14.45
Drain and CO2 valveAmazon, Seatle, WA, USASKU: 1/4TubeOD$19.5$22.91
Power supply 5 VAmazon, Seatle, WA, USASKU: LRS-75-5$22.48$26.41
Power supply 12 VAmazon, Seatle, WA, USASKU: LRS-75-12$24.82$29.16
White LEDs and RGB LEDsAmazon, Seatle, WA, USASKU: 5050 rgb$123.85$145.52
Power wireAmazon, Seatle, WA, USASKU: B0CF91GHF5$7.95$9.34
Electrical cabinetAmazon, Seatle, WA, USASKU: H7-1$53.99$63.44
Motor driverAmazon, Seatle, WA, USASKU: B07SH6BX97$12.78$15.02
Air pumpAmazon, Seatle, WA, USASCF-1/4$6.2$7.29
Module 4–20 mA to 0–3.3 VAmazon, Seatle, WA, USASKU: 682559873597$13.6$15.98
TOTAL$1833.07$2153.87
* Cost during development. ** Current cost. *** Sensor discarded due to unreliability.
Table 2. Overview of photobioreactor cost from commercial and open-source systems. Quotes were obtained in October 2023.
VendorProductModelVolume (L)Cost (USD)
SartoriusHelical tubular glass loopBIOSTAT PBR 2S3$65,000
GPCStirred tank or flat-panelLab PBR3$85,000
Synoxis AlgaeTubular/spiral airliftNANO bench photobioreactor3$25,000–40,000
KbiotechAirlift column (glass PBR)Airlift Bioreactor one-to-one3$47,000
KIAStirred tankPhotobioreactor2$39,000
LaboaoStirred tank/long-narrowPhotoFermentor5$20,000
Université de Toulouse EcoLab **Taylor–Couette reactorAlgal Taylor-vortex photobioreactor4$10,000 *
Phenometrics Inc. ***Columnar (polycarbonate PBR)ePBR0.7$11,000–15,000
* Estimated based on material cost. ** Schrimpf, M. et al. (2021) [25]. *** Lucker, B. et al. (2014) [39].
Table 3. Comparison between this work and a standard-of-the-shelf bioreactor.
CategoryParameter/FunctionStandard Bioreactor *This Work
Bioreactor instrumentationTemperaturexx
pHxx
DOxx
Pressure/Level **xx
SoftwareData acquisitionxx
Interface controllerxx
ControlLight LEDsxx
Mass flow ***x--
* Kbiotech vendor is a standard photobioreactor. The x indicates that the system includes or supports the corresponding function. All functions are implemented, except: ** monitoring only; *** future implementation.
Disclaimer/Publisher’s Note: The statements, opinions and data contained in all publications are solely those of the individual author(s) and contributor(s) and not of MDPI and/or the editor(s). MDPI and/or the editor(s) disclaim responsibility for any injury to people or property resulting from any ideas, methods, instructions or products referred to in the content.