You are currently viewing a new version of our website. To view the old version click .
COVID
  • Article
  • Open Access

26 November 2025

The Class Gap in Pandemic Attitudes and Experiences

Department of Geography and Environmental Studies, Toronto Metropolitan University, Toronto, ON M5B 2K3, Canada
COVID2025, 5(12), 195;https://doi.org/10.3390/covid5120195 
(registering DOI)
This article belongs to the Section COVID Public Health and Epidemiology

Abstract

Attitudes towards COVID-19 and lived experiences during the pandemic depended greatly on people’s level of education. This study extends a previous analysis of vaccine hesitancy as a function of formal education and examines additional indicators from the COVID-19 Trends and Impacts Survey for the United States during 2021–2022. The monthly values for social and health-related activities and constraints, testing and vaccination decisions, and information-seeking behaviours, as well as trust and beliefs, often varied markedly between education-defined classes. Many indicators present a significant gap between the attitudes and experiences of better-educated groups, represented by college/university graduates and those with post-graduate studies, on the one hand, and less-educated groups, including those with only high school or some college education, on the other hand. These patterns suggest that the academic and professional-managerial classes, which supply the vast majority of societal decision-makers, may be ill-equipped to understand and respect the needs and worries of the working class in an emergency situation such as the COVID-19 pandemic. Given growing concerns about the benefit–harm balance of many government policies, a more inclusive pandemic response could have been achieved by respecting and adopting the common sense, scepticism, and outright opposition of the less-educated groups vis-a-vis restrictions and public health measures.

1. Introduction

Human social behaviours changed dramatically from the onset of the COVID-19 pandemic in early 2020 (e.g., []). One of the most controversial issues was vaccine acceptance or hesitancy (e.g., []). In August 2021, alternative media reported that PhDs were “the most vaccine-hesitant group of all” ([]). The claim was based on the first preprint of a study by King et al. [] using US-focused Facebook survey data from the COVID-19 Trends and Impact Survey (CTIS) []. Participants’ attitudes towards the COVID-19 vaccines were tracked from January to May 2021 and the researchers “concluded people with PhDs are not only the most sceptical about getting vaccinated but are also the least likely to change their minds about it” []. Indeed, 23.9% of the holders of a PhD (doctoral) degree remained vaccine-hesitant by the end of the study period, more than any other education level, including those with high school or less (20.8%), some college education (18.3%), a professional degree (including JDs and MDs, 12.3%), a four-year degree (11.0%), or a Master’s (8.3%). However, in subsequent preprint versions and in the published, peer-reviewed article [], the results and discussion had changed, with vaccine hesitancy among PhD holders corrected by more than one-third to 14.6%, now placing them in the middle of the other groups. According to the published article, the data were corrected after identification and exclusion of a significant number of bad-faith survey responses.
The CTIS data have been used by other researchers to examine vaccine hesitancy by socio-demographic factors (e.g., [,]), and to a lesser degree SARS-CoV-2 test positivity by occupation [], mask-wearing [], and mental health []. The survey was also employed to create epidemic models and calibrate model parameters (e.g., [,]). In two of these studies, the groups of interest were indirectly associated with lower levels of formal education: lower-level occupations as “essential workers” entailed higher test positivity [] and rural living was associated with lower vaccination rates []. In contrast to previous analyses of one variable or group of variables such as vaccination behaviours by one or multiple dimensions, the present study aims to systematically analyze all CTIS variables by the education dimension.
Studies focusing on vaccine hesitancy often explained their education-related findings with a lack of interest, information, or understanding among less-educated classes. For example, in late summer 2021, the first year of global distribution of COVID-19 vaccines, a scoping review by Aw et al. [] identified 19 studies that supported the notion that “Lower education (below college)” was among the “Contextual determinants of vaccine related hesitancy in high-income countries or regions” ([], p. 8). Meanwhile, AlShurman et al. [] noted a “growing gap between those with low and high education levels” in their own scoping review and identified seven studies showing “that higher education level was associated with greater vaccination intention than lower education level”, yet interestingly, they also found three studies showing the opposite. However, Green et al. ([], p. 593) caution against viewing non-compliance with public health measures “as irrational responses rooted in ignorance, to be simply countered with more information.” Instead, they argue for integration of a broader range of expertise, lived experiences, and cultural contexts in pandemic response.
Anecdotally, concerns have been raised about a growing chasm between more and less educated people during the pandemic. The experiences of “frontline” and “essential” workers, many of them in poorly paid yet demanding jobs, were hugely different from those of the “laptop class”. Allen [] blames “the ‘laptop class’ and other winners from the lockdown” for doubling down on non-pharmaceutical interventions in fall 2020, despite emerging concerns about the measures’ effectiveness and collateral harms. Or as Tierney [] put it, “The less educated lost jobs so that professionals at minimal risk could feel safer as they kept working at home on their laptops.” In the context of the Freedom Convoy in Canada’s capital city Ottawa in winter 2022, Roy and Gandsman [] identify working-class motivations and symbolism as an early feature of the rally, along with a persistent self-framing of the participants as everyday, blue-collar Canadians.
Anthropologists, sociologists, and political scientists have indeed observed “the rise of the professional-managerial class” [] and, importantly, “the role of the university in the reproduction of a professional-managerial class” (ibd.). In her book short-titled “Virtue Horders”, Liu [] explicitly pits the professional-managerial class against the working class in the political sphere, while Clerval [] more concretely examines the impact of the growth of the professional-managerial class on the ground in terms of urban gentrification. This de facto segregation of population groups can be expected to yield distinct lifestyles and attitudes, which we aim to illustrate, quantify, and discuss in this article with respect to COVID-19 pandemic experiences.

2. Materials and Methods

For the study “Time trends, factors associated with, and reasons for COVID-19 vaccine hesitancy” referenced above, King et al. [] used record-level data from the COVID-19 Trends and Impact Survey (CTIS, []). The survey of “randomly sampled Facebook active users” obtained “roughly 35,000 responses per day, on average”, “conducted from April 2020 to June 2022” ([], p. 1). The present analysis employs the publicly available contingency tables from the now-archived survey site []. Among the available monthly archive files, a comma-separated value spreadsheet containing all survey indicators tabulated by education level (“monthly_nation_all_indicators_edulevel.csv.gz”) was downloaded, extracted, and inspected using LibreOffice Calc.
The 132 rows of data captured 22 months from September 2020 to June 2022. Eighteen columns contained various dimensions, which were reduced to the period end date (last day of the month) and education level. After removal of 22 rows with education level “NA” (not applicable), five levels remained for each month, for a total of 110 rows. The five education levels comprised:
  • Level 1: Less Than High School
  • Level 2: High School
  • Level 3: Some College
  • Level 4: Four Year Degree
  • Level 5: Post Graduate
In addition to the dimensions, a further 1876 columns represented the Facebook survey responses for the United States. Following the documentation from [], only variables prefixed with “val_” were extracted, which captured “the main value of interest, e.g., percent, average, or count, estimated using the survey weights to better match state demographics.” This resulted in 459 variables of potential interest. Of these, 14 were found to be empty and removed manually, leaving 445 remaining indicators.
The CTIS archive [] also provides a codebook for the contingency tables (“contingency-codebook.csv”), which was downloaded and inspected. The codebook defines a total of 672 indicators. After removal of indicators collected at the global level but not for the United States, 539 rows remained which included an indicator’s name, category, description, definition in terms of responses, and start and end dates. The difference in the number of indicators between the cookbook (539) and the data table (445) is explained by the omission of a number of survey responses from the education-specific contingency table.
In the contingency table, the number of respondents is listed for each month and each indicator; these numbers vary greatly over time and also between indicators. As an example of a basic demographic variable (household size) for the August 2021 sample, the education levels according to the above order include the following counts of respondents: 25,115 (2.4%); 143,055 (13.8%); 320,385 (30.9%); 212,000 (20.5%); and 172,415 (16.6%), with 162,775 (15.7%) “NA”, for a total of 1,035,745 responses. The responses were subsequently weighted to represent the target population of American adults []. Specifically, the weighting accounts for non-response bias and coverage bias for age, gender, and geographic jurisdiction among the responding Facebook users [].
Based on this wealth of information, monthly timelines of vaccine hesitancy by education level were reviewed for the full survey period, well beyond King et al.’s [] May 2021 cutoff. Vaccine hesitancy is defined in the codebook as responding “definitely not” or “probably not” to the question, whether one would accept “a vaccine to prevent COVID-19”. It must be noted that this question can be viewed as misleading, since the available vaccines were not consistently shown to prevent infection with SARS-CoV-2 (e.g., [,]). The correct question, based on the vaccine trials and authorizations should have referred to the prevention of “laboratory confirmed infection” [].
Next, two other controversial issues during the pandemic were examined, social distancing and masking. The line charts representing participants’ belief in the effectiveness of these measures were also stratified by education level. The contingency table codebook [] defines these two indicators as the “Percentage of people who believe social distancing is either very or moderately effective for preventing the spread of COVID-19” and the “Percentage of people who believe that wearing a face mask is very or moderately effective for preventing the spread of COVID-19”, respectively.
Finally, the analysis was further expanded to include all 445 indicators with the goal to identify patterns that were similar to those of the first three metrics. To this effect, ChatGPT (GPT-4o model, OpenAI) was used to create a Python 3.10 script that matched categories and descriptions from the codebook to the indicator names in the data table and added the medians of the five education levels to each indicator. Medians rather than means were calculated to more accurately represent the timeline of some indicators, such as vaccine hesitancy, which started with very high or low values but stabilized quickly. Based on the medians, the minima, maxima, and ranges of, and the gaps between, two groups of two education levels were determined:
  • Group A: High School (Level 2) and Some College (Level 3)
  • Group B: Four Year Degree (Level 4) and Post Graduate (Level 5)
All indicators were ranked based on an index determined by the ratio of the gap between group medians A and B (where one existed) divided by the larger difference between medians within a group. Another Python script was created using ChatGPT in order to generate line charts for those 51 (11% of total) indicators with a relative gap greater than 200%. These charts were manually analyzed and discussed.

3. Analysis and Results

3.1. Vaccine Hesitancy 2021–2022 by Level of Education

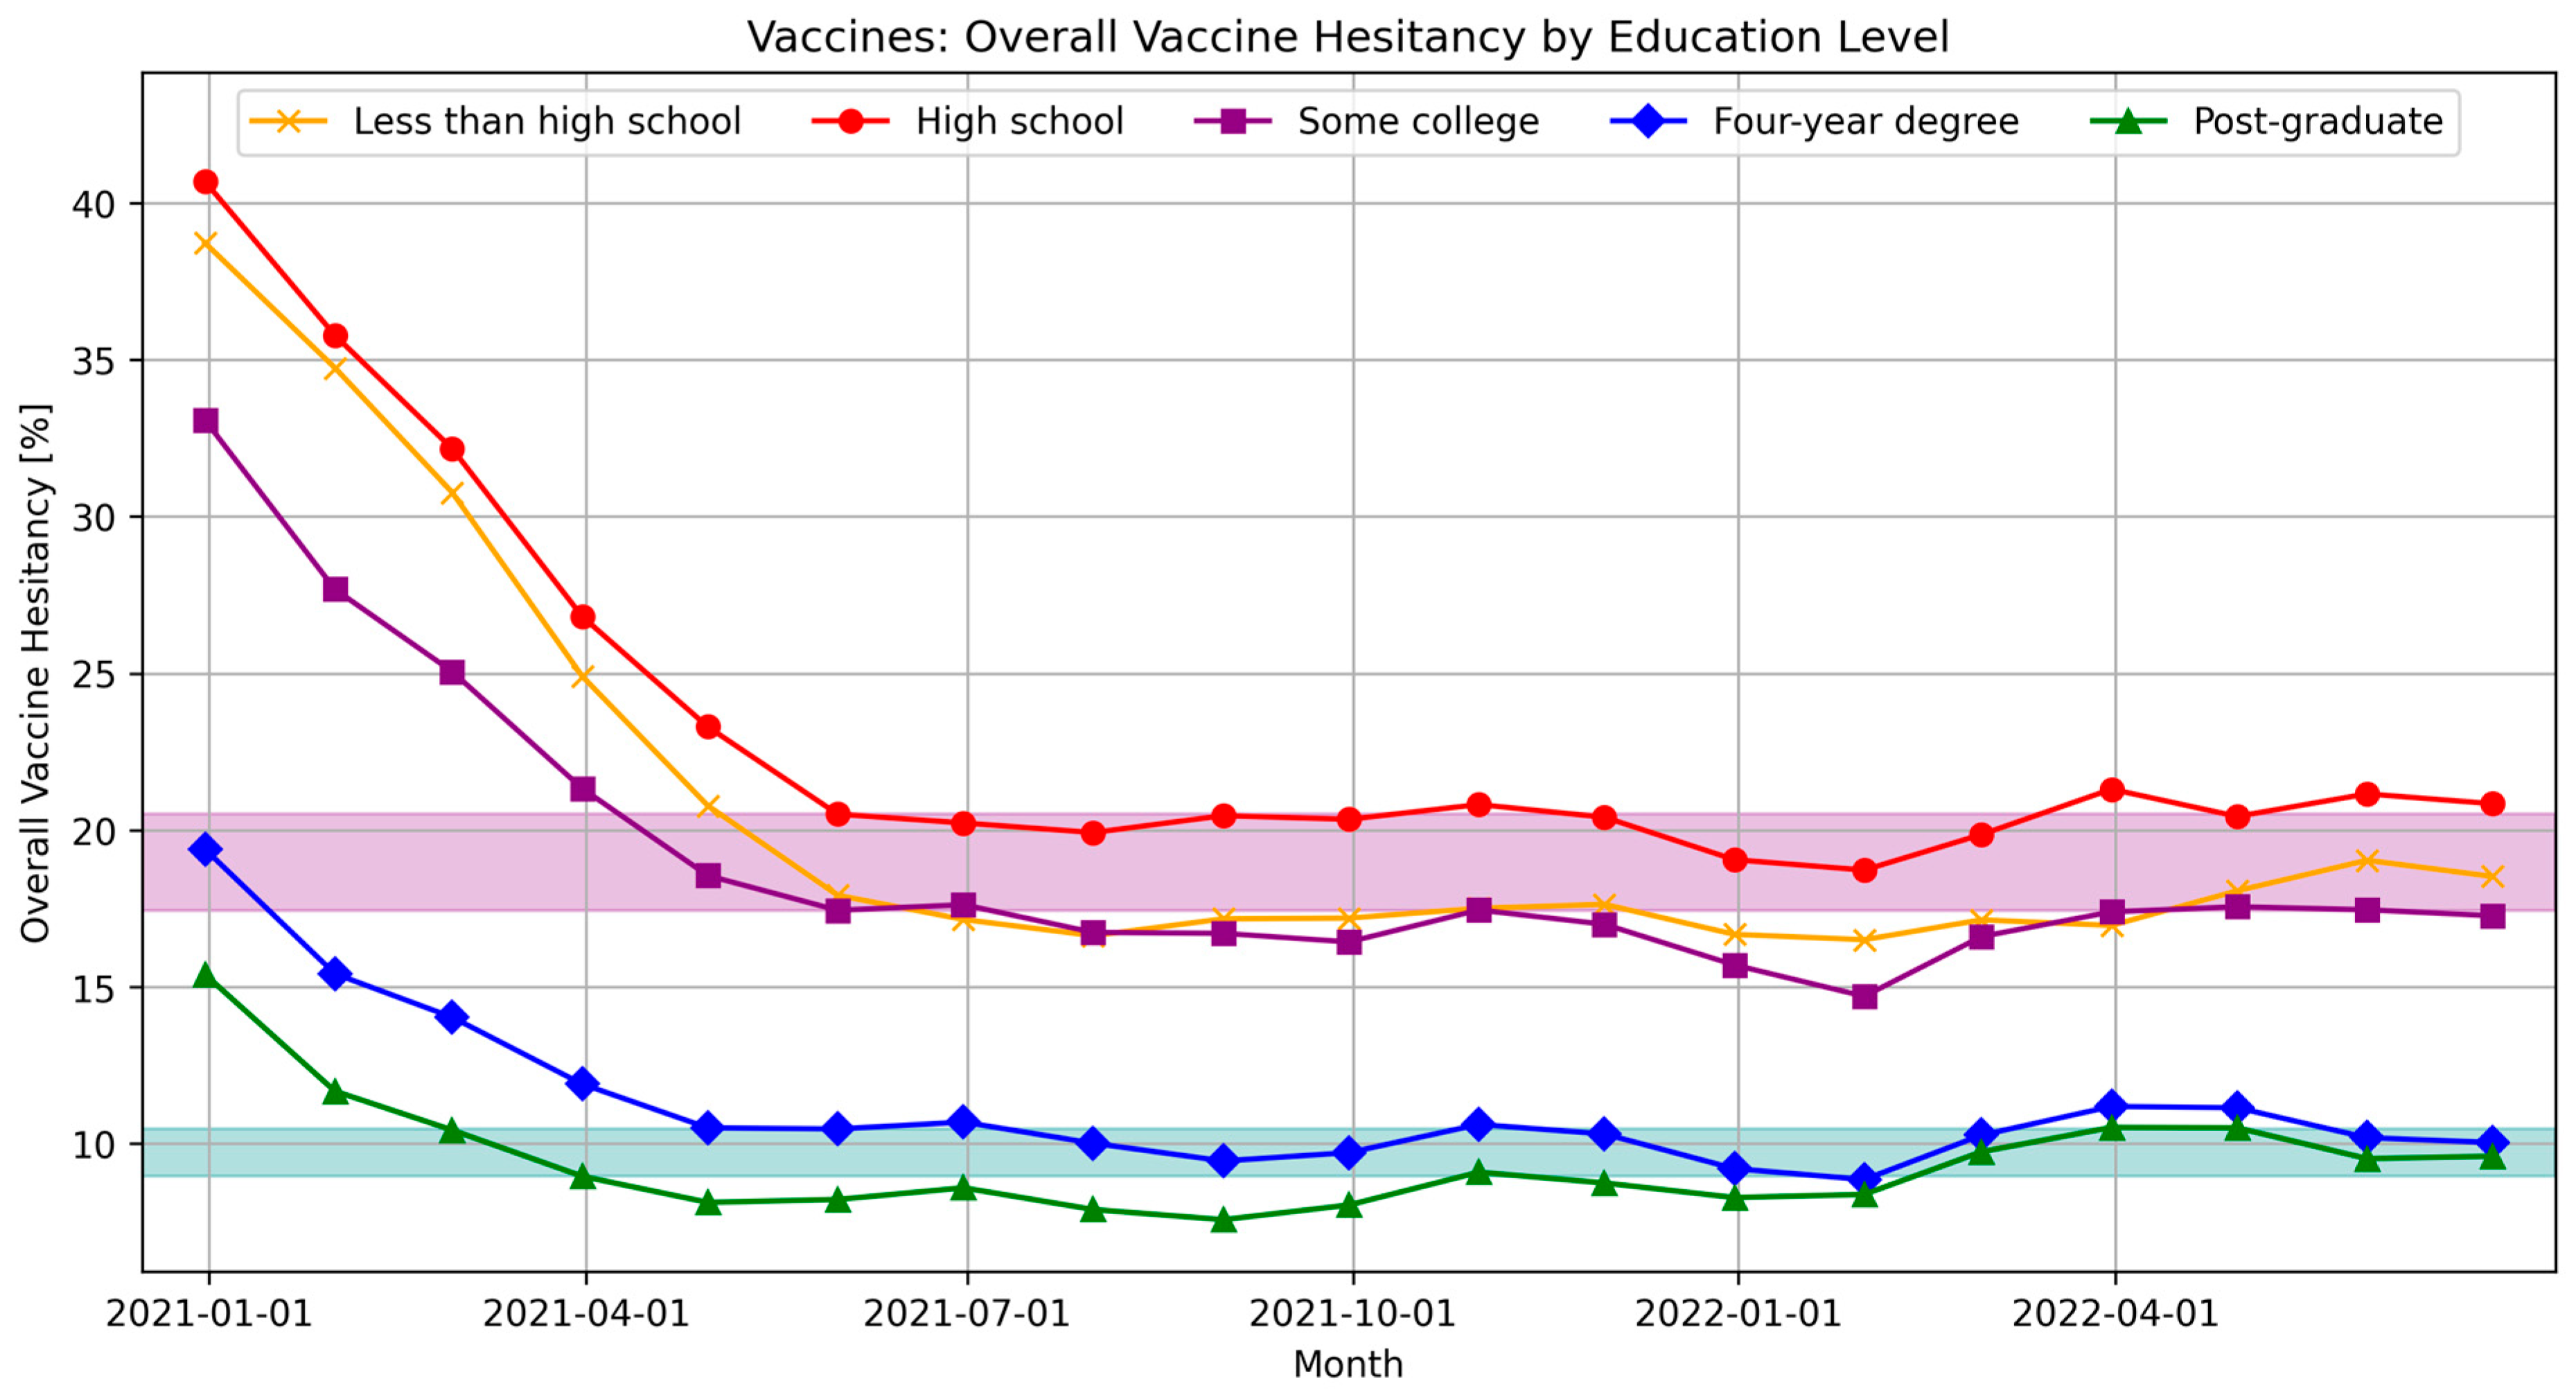
Over the January to May 2021 period studied by King et al. [], COVID-19 vaccine hesitancy decreased across all levels of education. Initially, between 33% and 41% of respondents in the lesser educated Levels 1–3, including the two Group A levels, reported that they would probably or definitely not get vaccinated, while only 15% to 19% among Levels 4–5 (Group B) were vaccine hesitant. By May 2021, these proportions had dropped by almost one half to 17% to 21% for Levels 1–3 and 8% to 10% for Levels 4–5. Extending King et al.’s [] study period, vaccine hesitancy in all groups remained steady within a few percentage points for another full year until the end of the CTIS. During this phase, the line chart in Figure 1 suggests two additional small dips of vaccine hesitancy in late summer 2021 and January 2022, and a small increase from February to June 2022.
Figure 1. Overall vaccine hesitancy by education level, January 2021 to June 2022, United States of America. The purple band spans the median values of the two lower education levels (Group A), while the teal band represents the higher education levels (Group B). Data source: [].
The curves of the four education levels of interest remain remarkably parallel and ordered from highest to lowest education level associated with increasing vaccine hesitancy. The exception are respondents with less than high school education, who start off near the high-school level at the top but quickly decline and stay with the level of those with some college education from mid-2021 onward. The patterns between and within Groups A and B are highly consistent. In addition to the perfect order by declining education level, the distance between “High School” and “Some College” in Group A remains within a few percentage points throughout, while the distance between “Four-Year Degree” and “Post-Graduate” slowly shrinks to near zero. Importantly, the gap between the two groups, specifically between college/university graduates and those with only some college education, drops slightly in the first few months but then stays around twice as large as the larger within-group distance.

3.2. Belief in the Effectiveness of Distancing and Masking

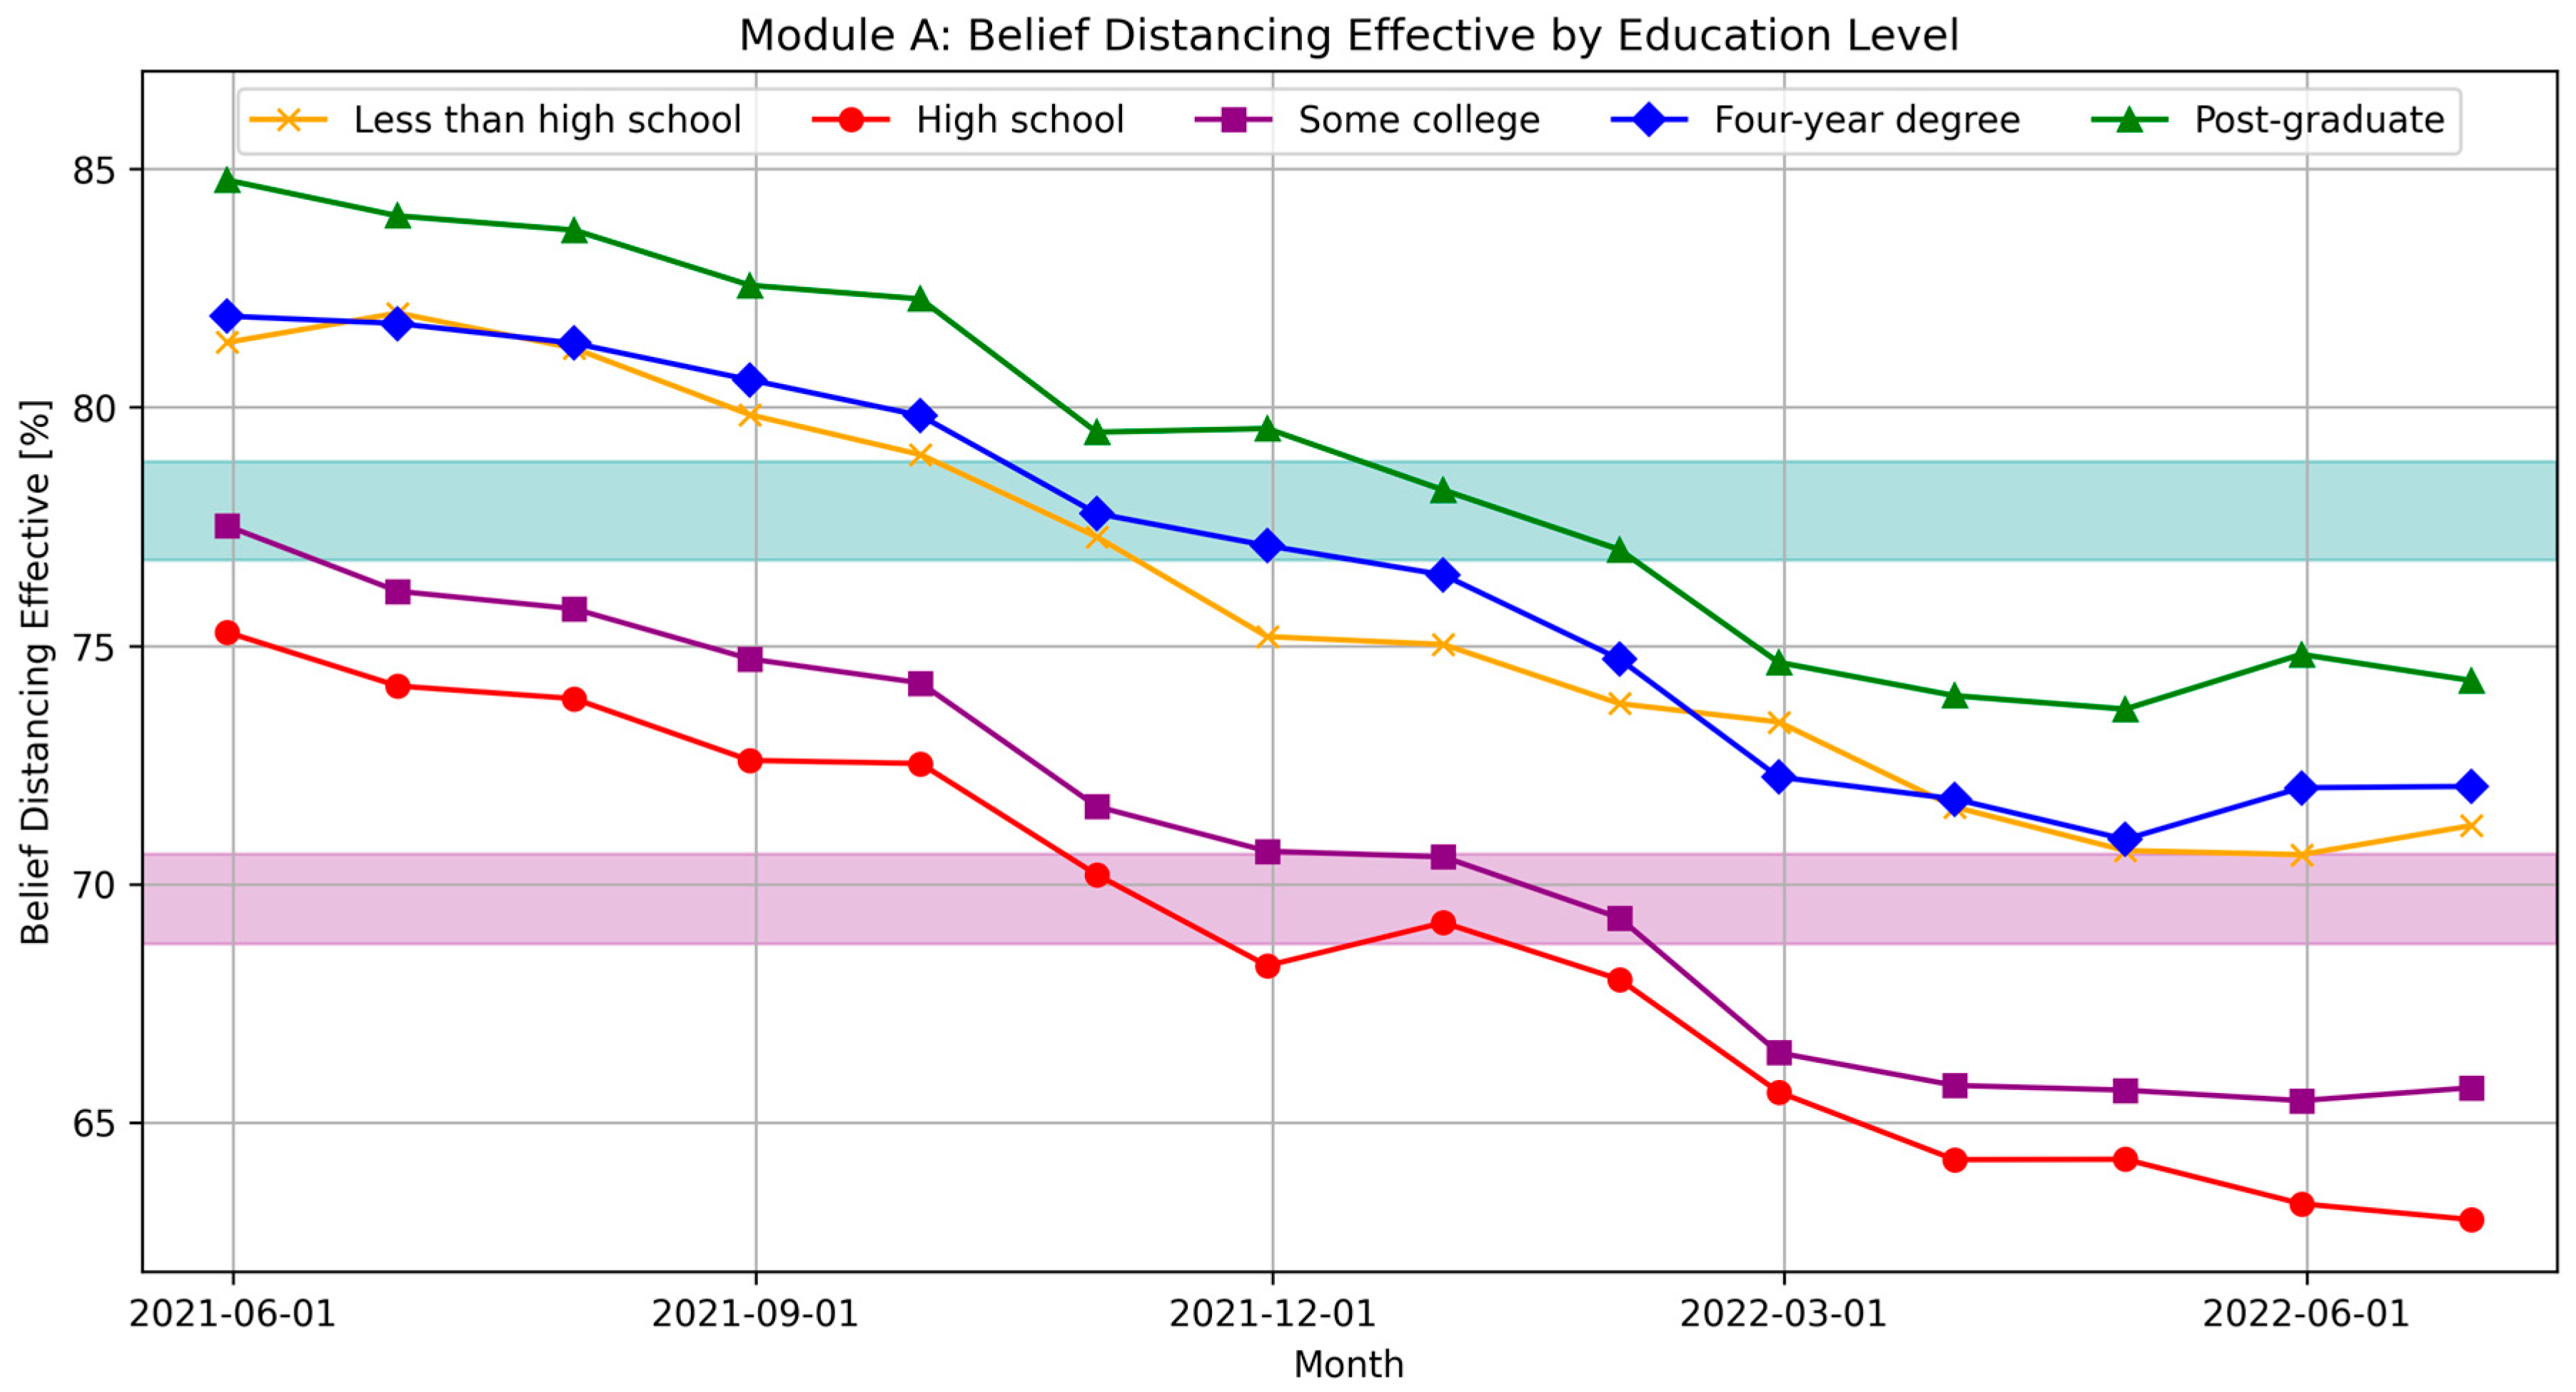
“Social distancing” was employed around the globe to attempt containing the spread of SARS-CoV-2. The corresponding survey question appears in the contingency table only in May 2021, when approximately 75% to 85% of respondents believed in the effectiveness of distancing (Figure 2). Group A (high school graduates and those with some college education) were more sceptical with 75% to 77% believers, which declined to 63% to 66% by the end of the study period. Group B (college/university graduates and post-graduates) started with 82% to 85%, who believed that distancing was effective, declining to 72% to 75% by June 2022. The within-group differences remained within a few percentage points, while the between-group gap spanned two to three times these differences. The main difference between this indicator and vaccine hesitancy is that here, the lowest education level (less than high school) stayed with the higher-education Group B rather than the lower-education Group A.
Figure 2. Belief in the effectiveness of social distancing to prevent the spread of COVID-19 by education level, May 2021 to June 2022, United States of America. The purple band spans the median values of the two lower education levels (Group A), while the teal band represents the higher education levels (Group B). Data source: [].
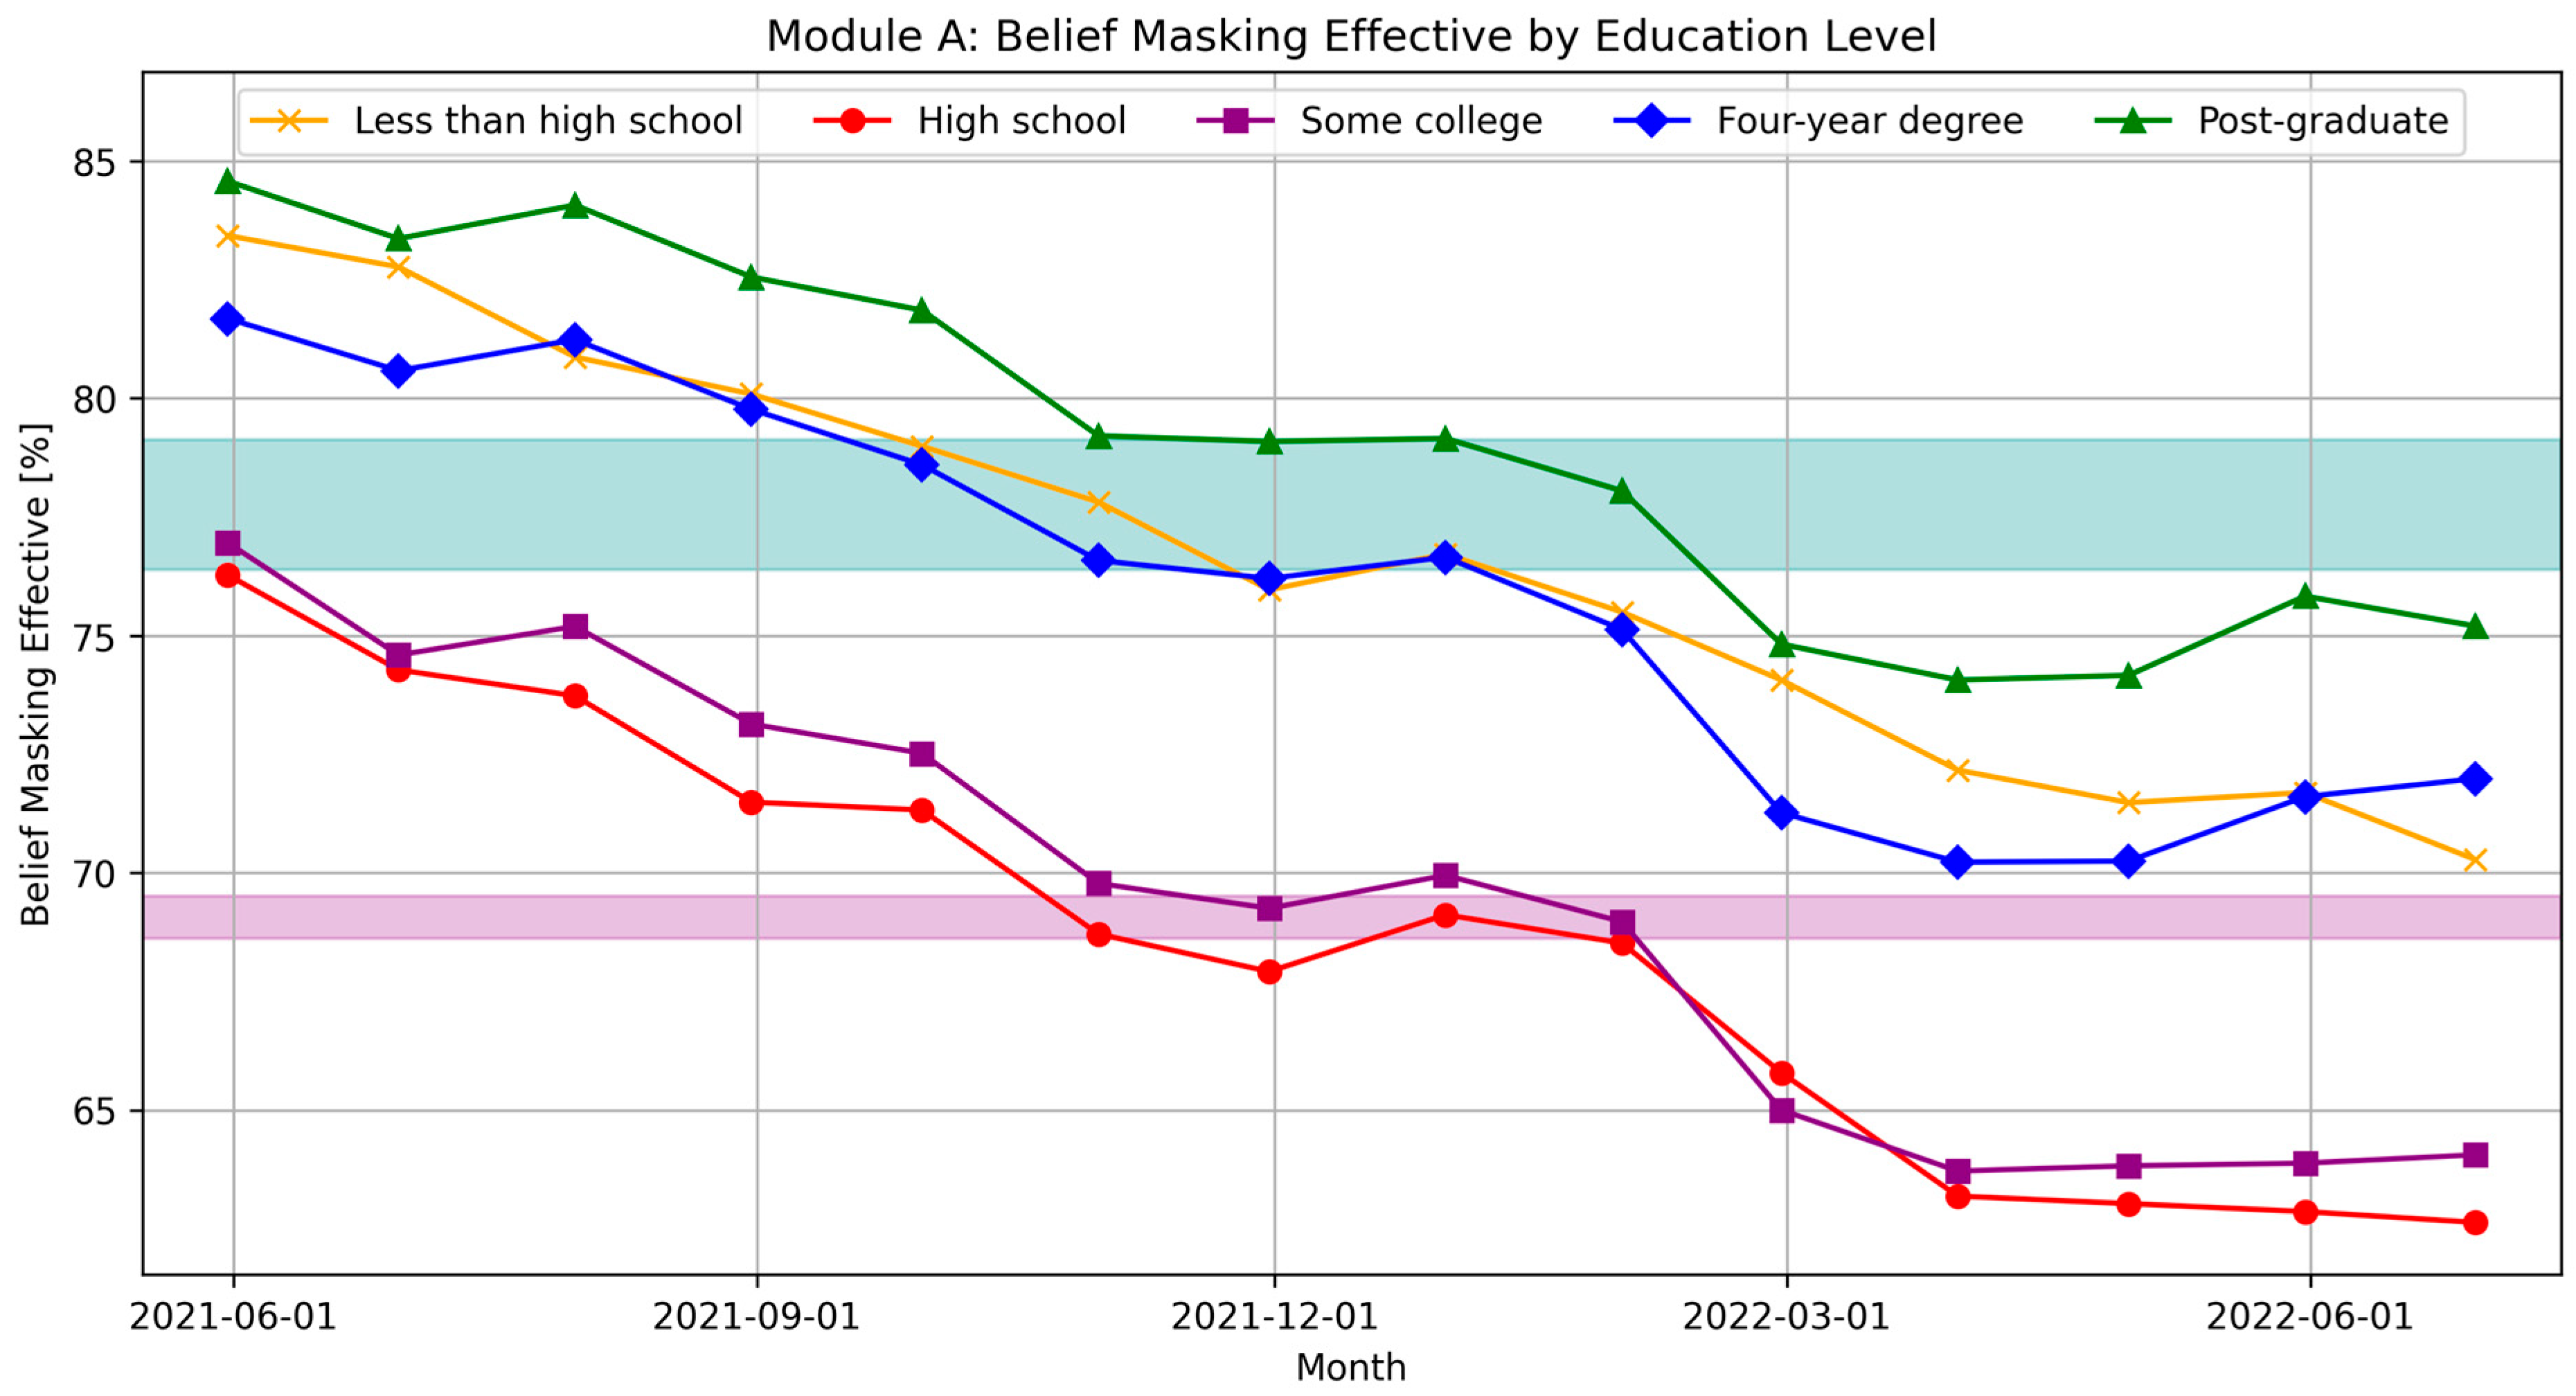
Face covering recommendations and mandates were another widely used pandemic response measure. Similarly to the belief in social distancing, belief in the effectiveness of masking starts between 77% and 85%, with low values of 77% declining to 63–64% for Group A and high values of 82% to 85% declining to 70% to 75% among respondents in Group B as well as those with less than high school education (Figure 3). For this indicator, the Group A band is very narrow, while Group B distance is slightly greater than with the distancing indicator. At the lower end of this band, Level 1 (less than high school) follows Level 4 (four-year degree) very closely. Figure 3 also shows a consistent gap between Group A and B, more than double the larger within-group distance for the higher-education respondents.
Figure 3. Belief in the effectiveness of face masks to prevent the spread of COVID-19 by education level, May 2021 to June 2022, United States of America. The purple band spans the median values of the two lower education levels (Group A), while the teal band represents the higher education levels (Group B). Data source: [].

3.3. Other COVID-19 Attitudes and Experiences

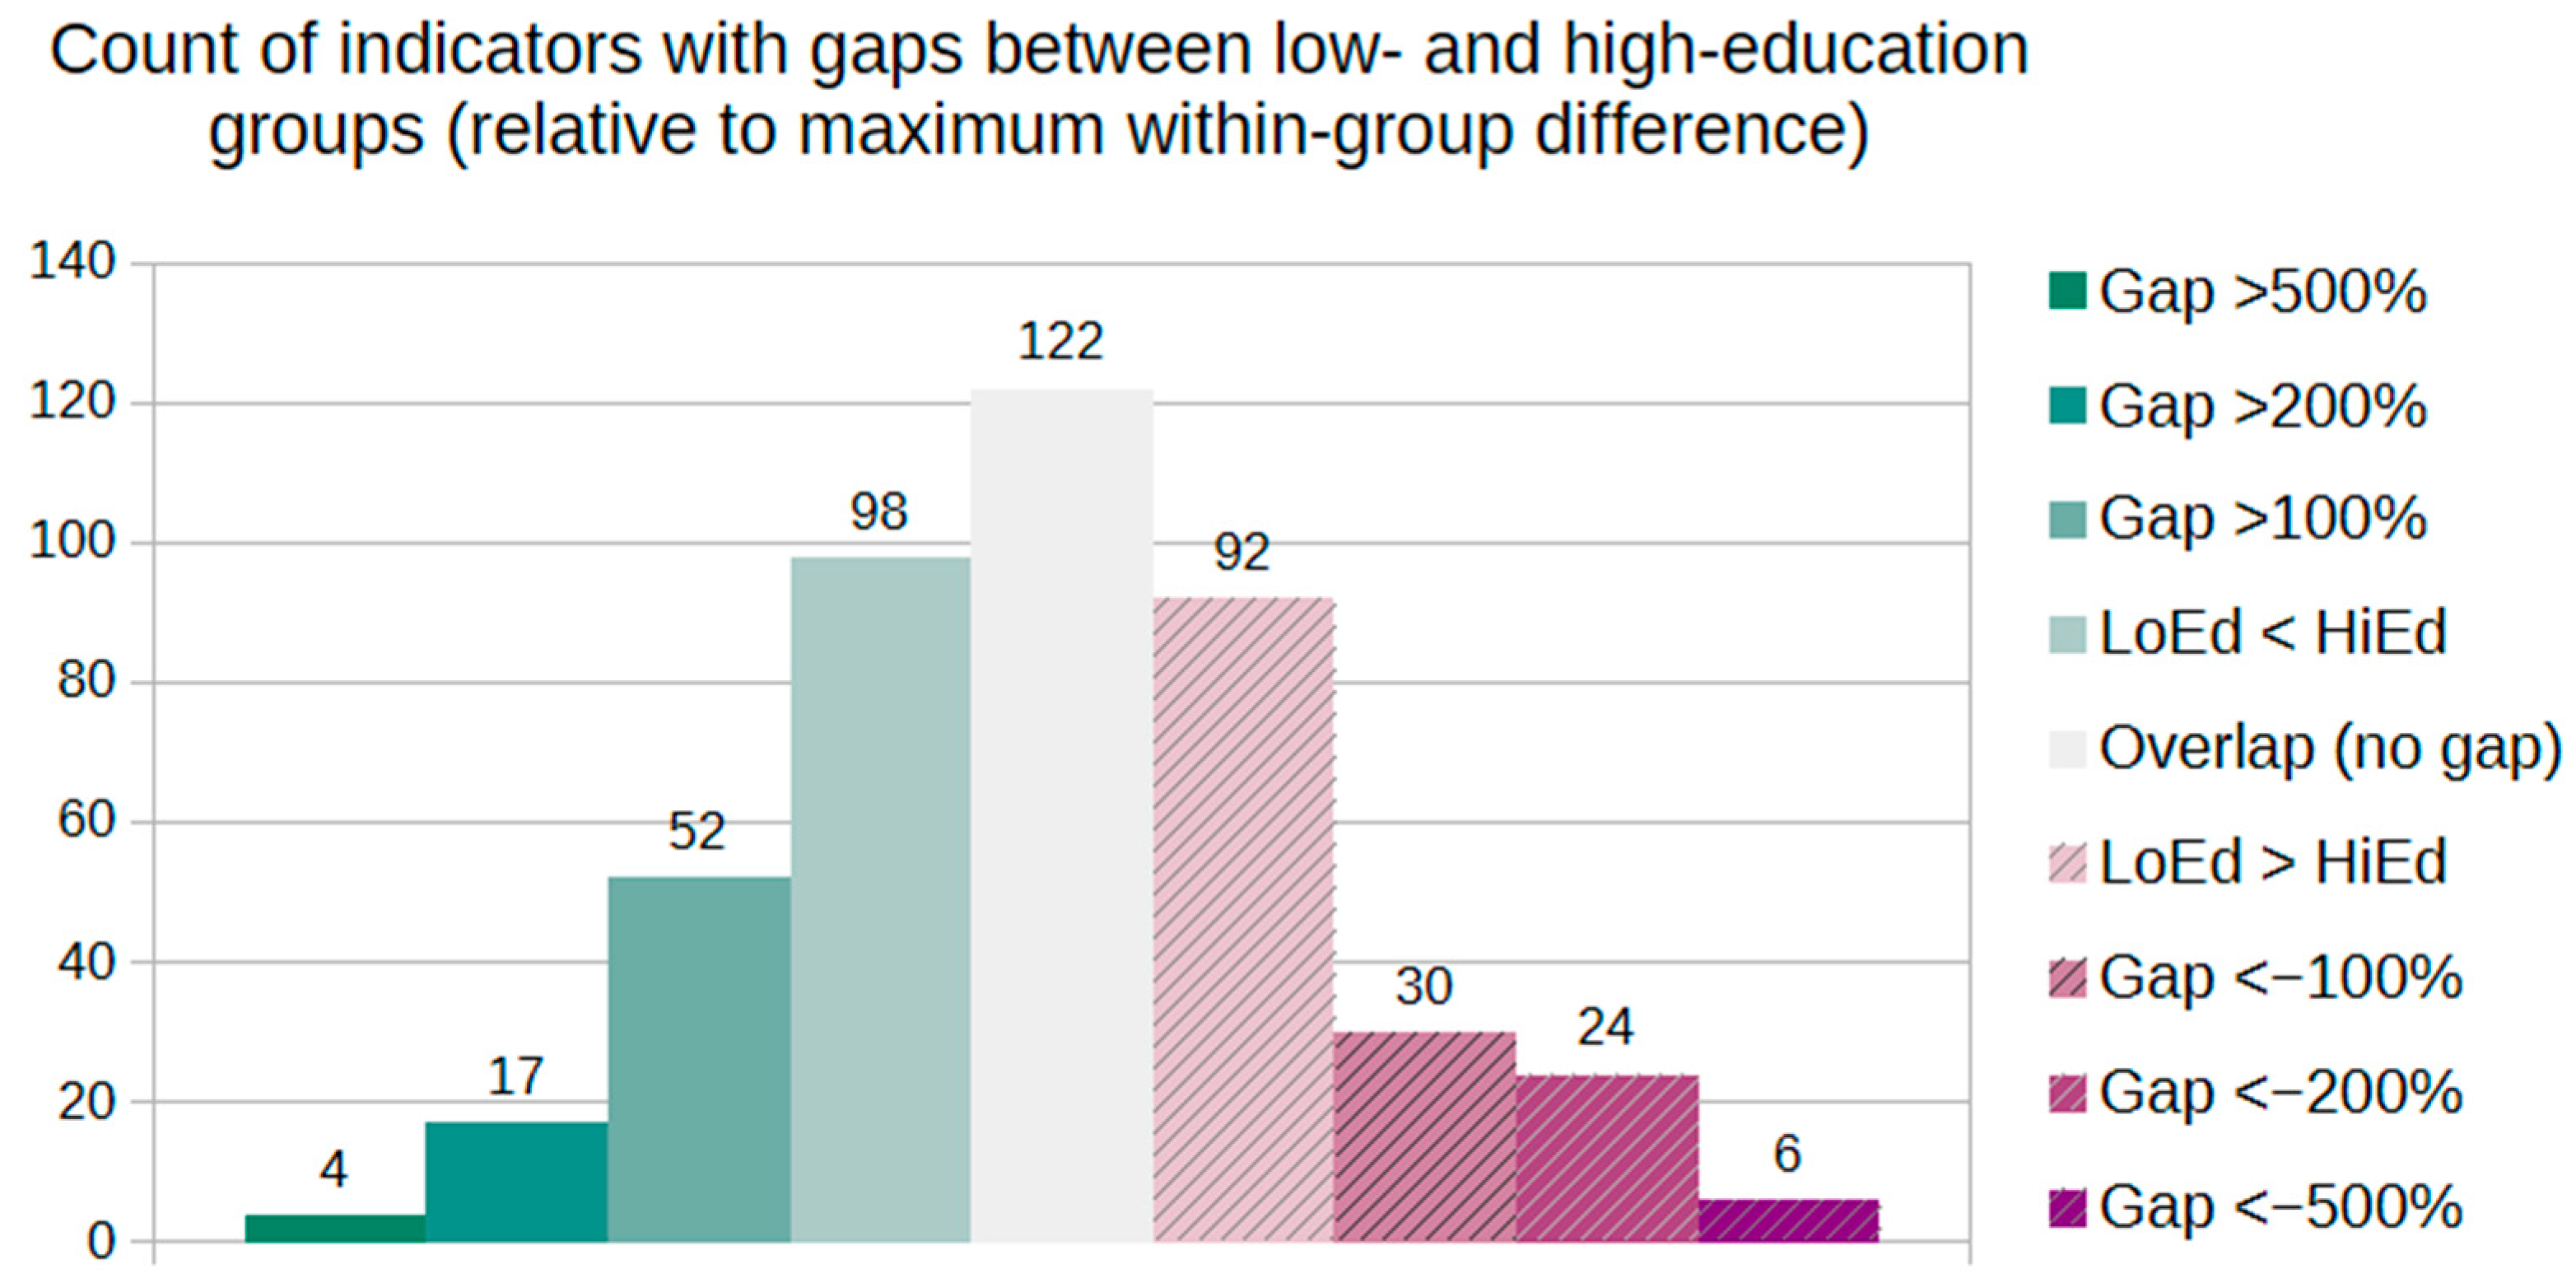
Across 323 out of 445 indicators (73%), the low- and high-education groups were separated. However, in 190 out of these 323 non-overlapping indicators, the gap was relatively small, i.e., within 100% of the larger within-group range. At the other extreme, for ten indicators, the gap was five or more times greater than the larger range (>500%). It was at least twice as large in an additional 41 indicators (>200%), and greater than the larger range in a further 82 indicators (>100%). Figure 4 shows the bi-directional distribution, including the number of indicator medians in Group A (low education) that are significantly lower (left of centre) or higher (right of centre) than Group B (higher education). The three core indicators discussed above had gap ratios of 296% (belief_distancing_effective, A < B), 252% (belief_masking_effective, A < B), and −228% (overall_vaccine_hesitancy, A > B).
Figure 4. Distribution of CTIS indicators with respect to gaps between the medians of low- and high-education groups. Counts on the left of the centre bar represent indicators where the medians for both lower-education groups score below the medians for both higher-education groups. Counts on the right represent gaps in the other direction. The gaps are distinguished by their relative magnitude compared to the larger within-group difference between median values.
Among the four indicators with the largest positive gaps (over 500%), three were from the Testing category, including test_reason_visit and test_reason_large_event (see Figure 5). A related indicator, test_reason_travel, had a smaller yet also positive gap of 153%. For each of these, the higher-education Group B presents much larger median proportions of people who report having been tested in the last 14 days to prepare for family visits, event attendance, or travel. Interestingly, the gap between the groups closes during the first half of 2021, yet it re-opens later that year.
Figure 5. Indicators representing the reason for testing, including family visits (left) and event attendance (right). The purple band spans the median values of the two lower education levels (Group A), while the teal band represents the higher education levels (Group B). Group A has noticeably smaller medians than Group B, with a significant gap persisting through much of the pandemic. Data source: [].
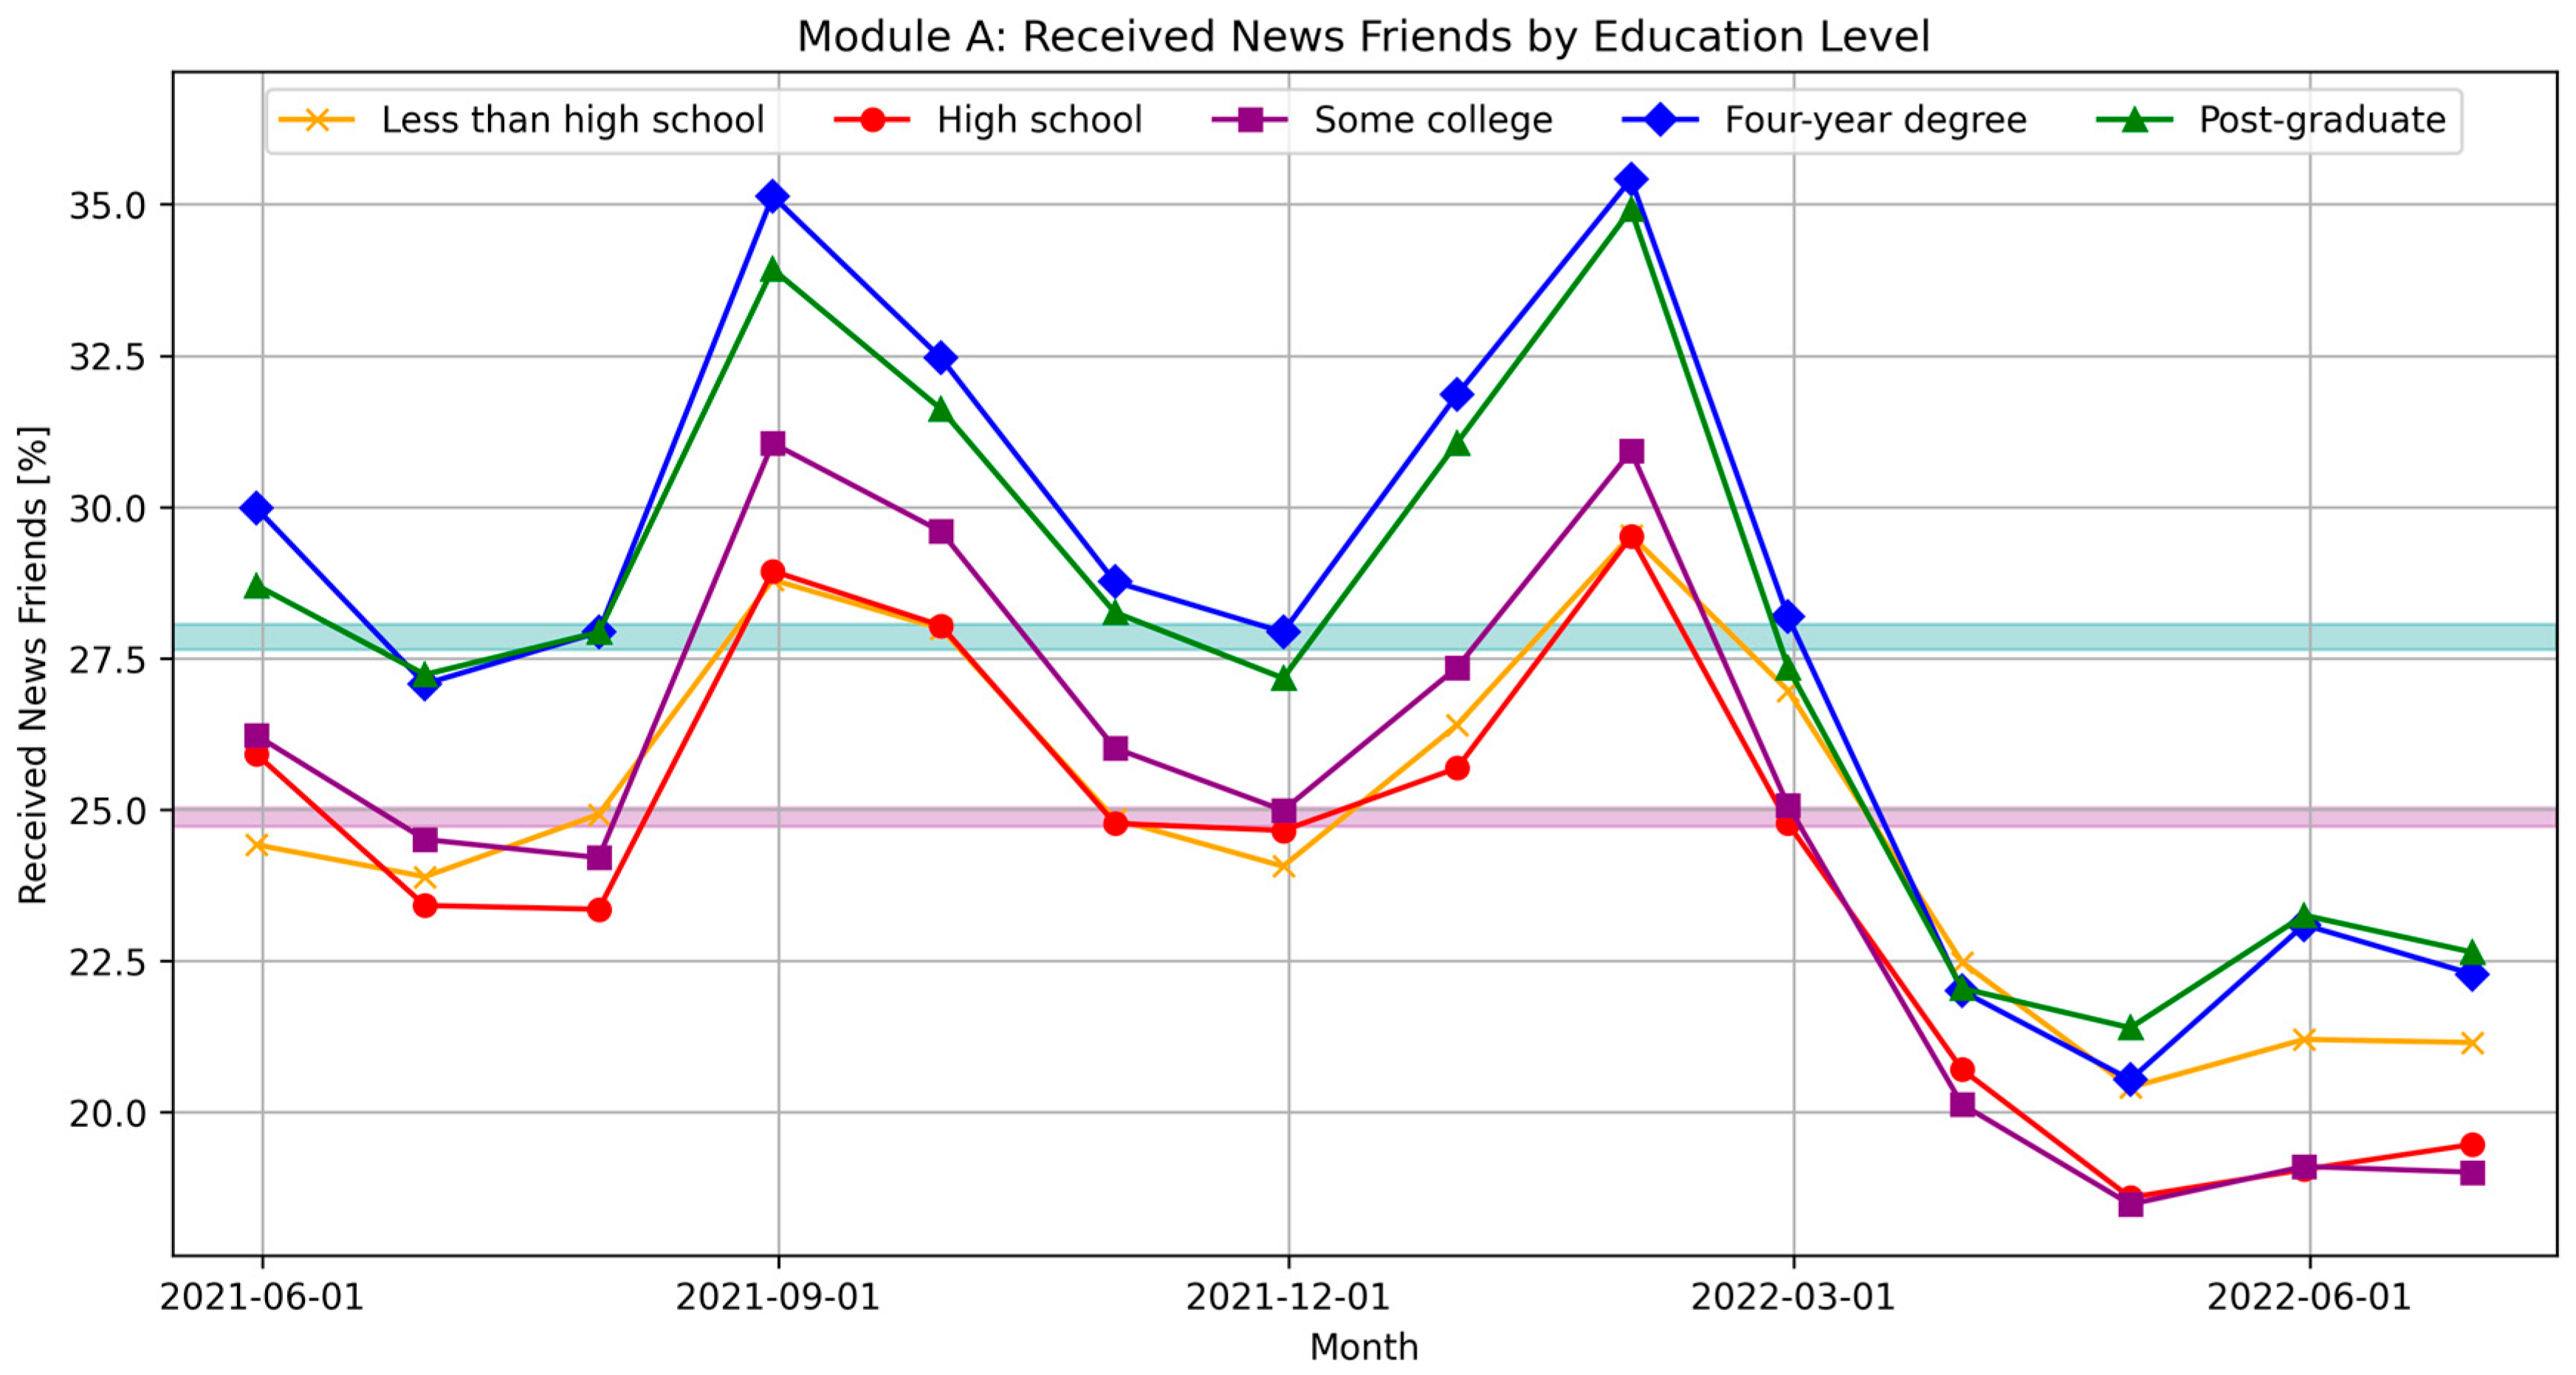
Another large gap between low Group A and high Group B medians occurs in the percentage of respondents who report having “received news about COVID-19 in the past 7 days from friends and family” (see Figure 6). The only other news source with a significant difference, pointing in the same direction, are “journalists”. Meanwhile, no major gap exists for other news sources, including the CDC, “experts”, government health authorities, local health workers, politicians, or religious leaders.
Figure 6. Indicator representing friends as a source of news about COVID-19. The purple band spans the median values of the two lower education levels (Group A), while the teal band represents the higher education levels (Group B). Group A has noticeably smaller medians than Group B, with a significant gap between the monthly values persisting throughout the pandemic. Data source: [].
The 17 indicators with a 2- to 5-fold gap between the low- and high-education groups include six masking- and four vaccination-related metrics. In addition to belief in mask effectiveness (see above), mask wearing and observing others wearing masks presented somewhat different attitudes depending on education level, yet the start and end times of the two variables (fall 2020 to spring or fall 2021) suggest that mask mandates were in place, corresponding to consistent values of over 90% up to near 100% compliance, which was both practised and observed across both groups with small absolute deviations.
By contrast, the vaccination-related metrics are more revealing of education-dependent attitudes. Children’s vaccination is represented by two complementary variables for the periods from May 2021 to December 2021 and December 2021 to June 2022 (see Figure 7). They suggest that Group A respondents are much less likely to vaccinate their children, with positive responses averaging 66% to 67% in the first period and 57% to 60% in the second, compared to higher support levels of 76% to 80% and 72% to 76% from Group B.
Figure 7. Indicators representing the likelihood that respondents will have their children vaccinated. The purple band spans the median values of the two lower education levels (Group A), while the teal band represents the higher education levels (Group B). Group A has much smaller medians than Group B, with a significant gap extending between the two complementary variables throughout the pandemic. Data source: [].
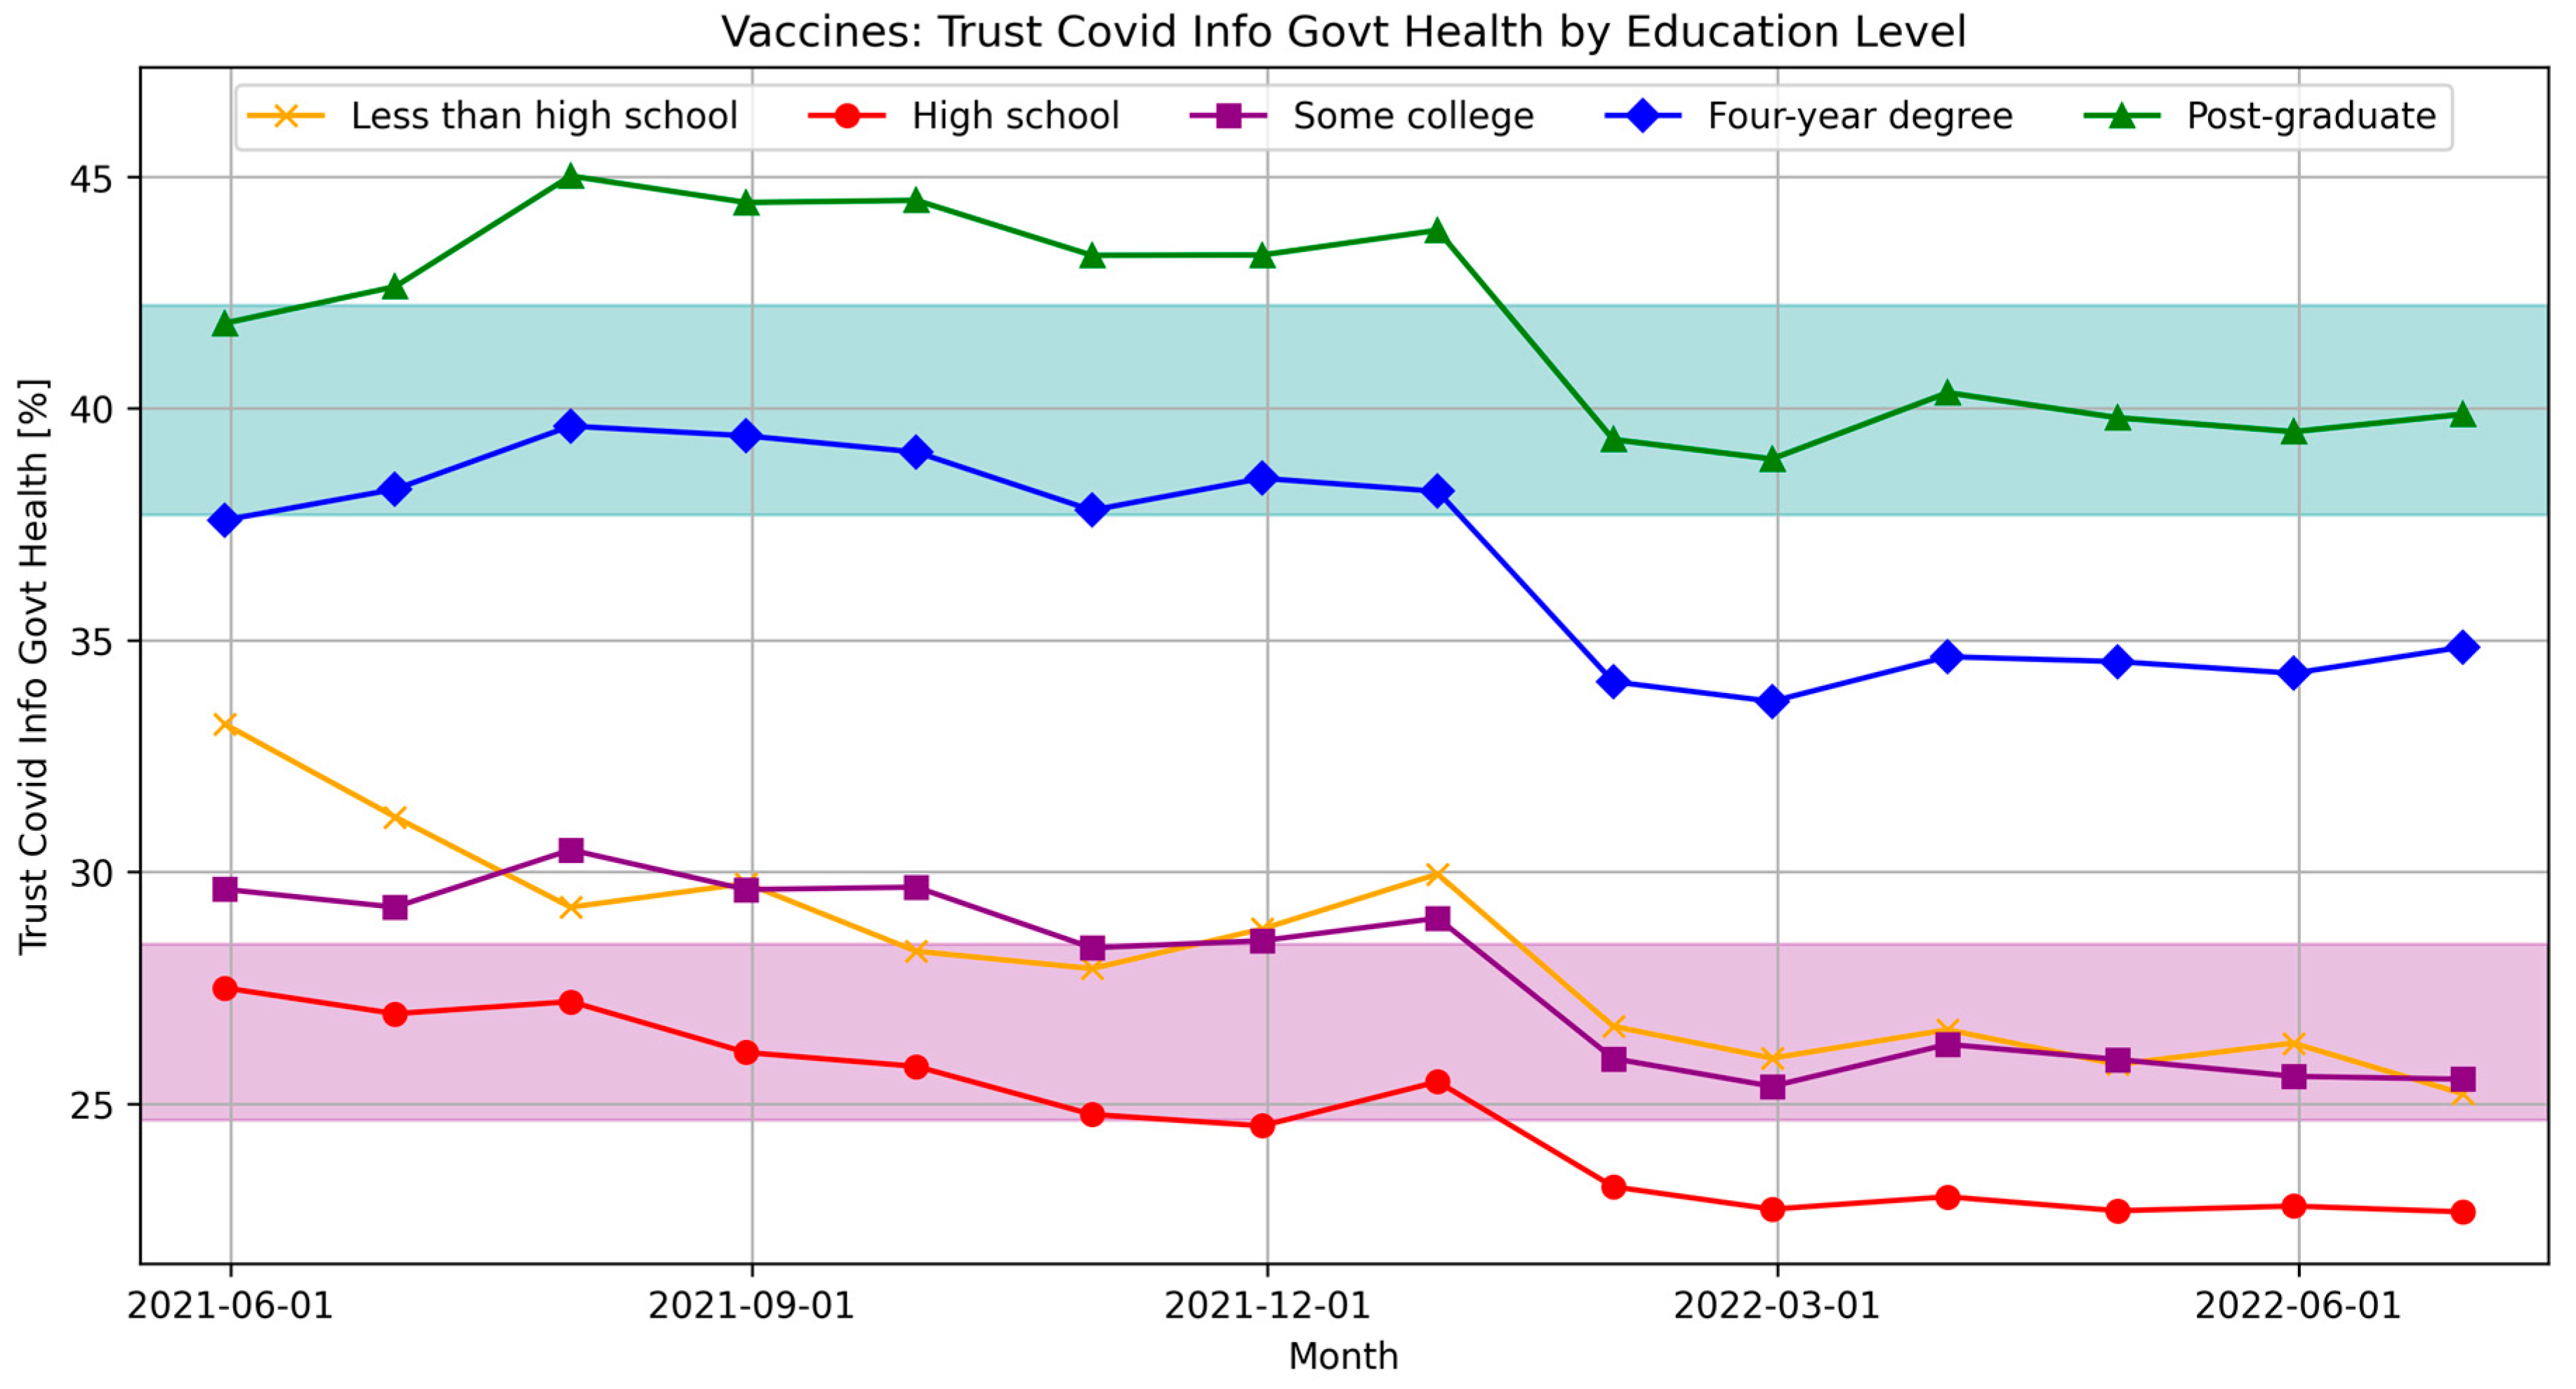
Another large gap exists when it comes to trusting COVID-19 information from government health authorities. A median of only 25% to 28% of the lower-education group affirmed this question, while 38% to 42% of the higher-education group did (see Figure 8). Importantly, trust in government information declines for all groups as time progresses, with a sudden drop at the beginning of 2021. In the data source [], this question was assigned to the Vaccine category, although it does not appear to be limited to this realm.
Figure 8. Indicator representing trust in COVID-19 information from government health authorities. The purple band spans the median values of the two lower education levels (Group A), while the teal band represents the higher education levels (Group B). Group A has much smaller medians than Group B, with a significant gap persisting throughout the pandemic. Data source: [].
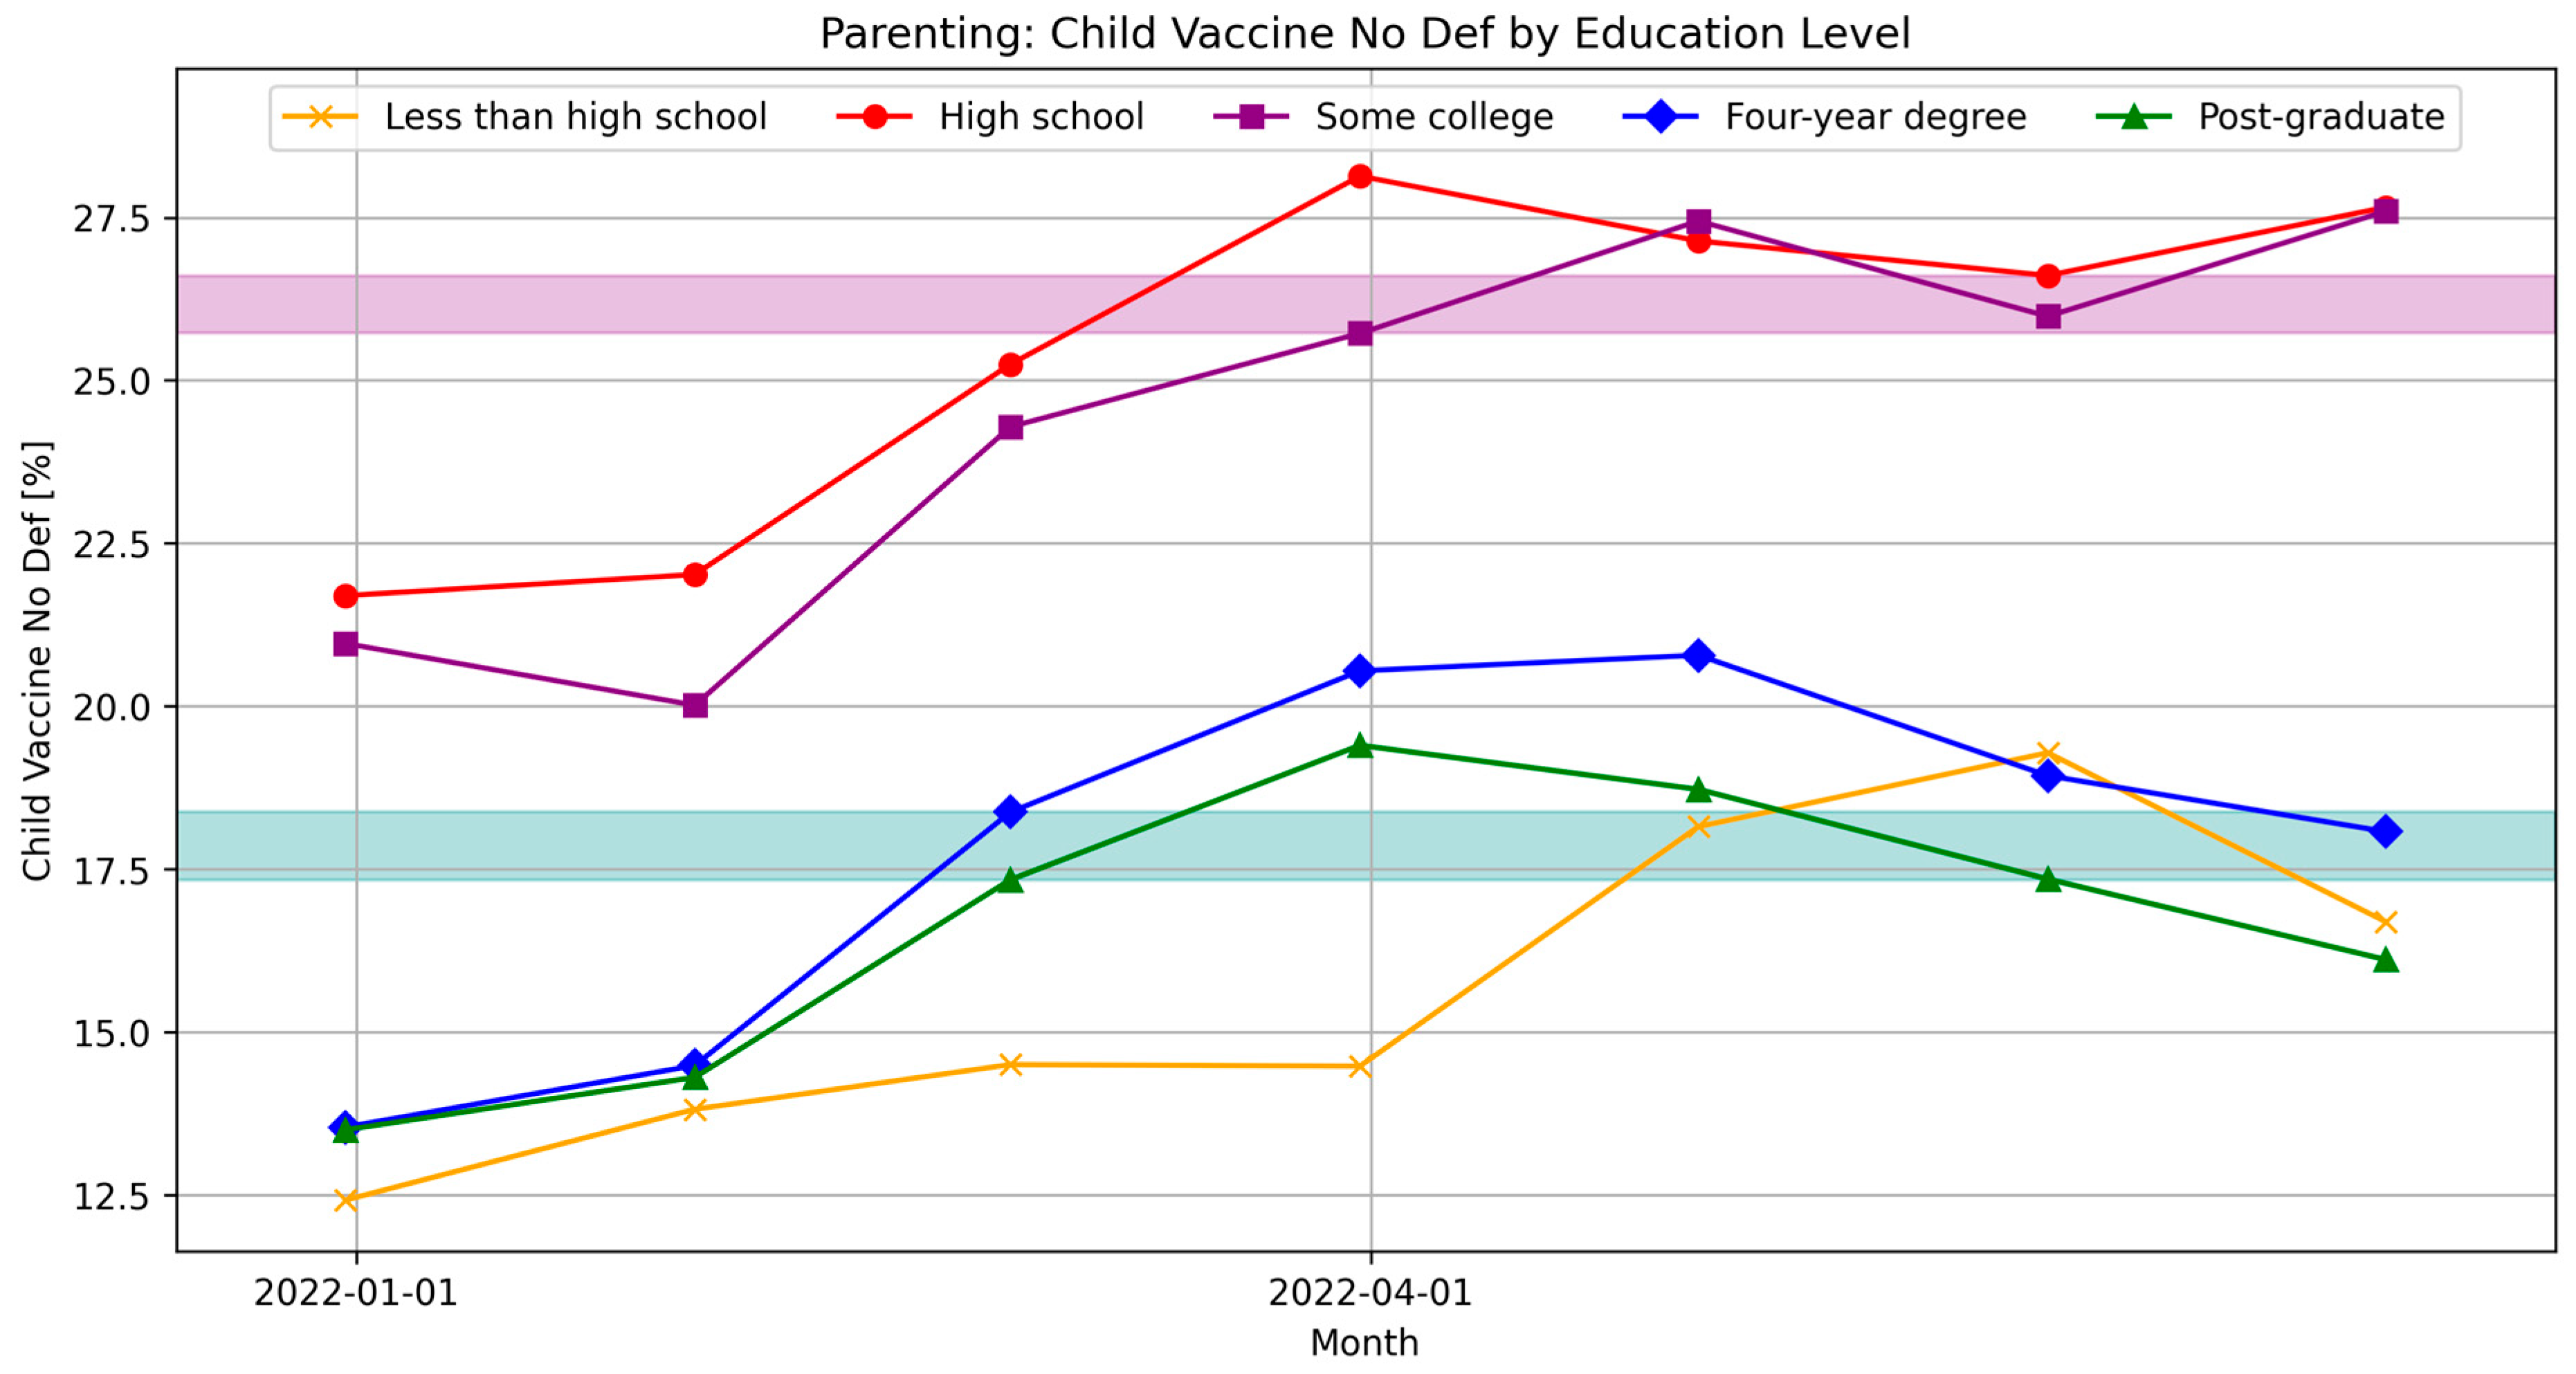
Another vaccination-related variable displays a large gap of 708%. It represents parents who will “definitely not vaccinate their oldest child”, with medians of 26% to 27% in Group A and only 17% to 18% in Group B (see Figure 9). This rejection of children’s vaccination grows noticeably for Group A, from under 22% to over 27%. It also grows for Group B, from under 14% to 19–21% but then falls again to 16–18%.
Figure 9. Indicator representing parents’ rejection of vaccinating their children for COVID-19. The purple band spans the median values of the two lower education levels (Group A), while the teal band represents the higher education levels (Group B). Here, Group A has much higher medians than Group B, with monthly values growing through the first half of 2022 covered by this survey question. A significant and widening gap persists throughout the pandemic. Data source: [].
At the other end of the distribution shown in Figure 4, the six indicators with over 5-fold gaps between higher Group A and lower Group B values include vaccination- and symptom-related survey questions. The gap between the percentages of lesser-educated people who report having difficulties getting time away from school or work as a barrier to vaccination and the corresponding percentages in the better-educated group is almost 40 times greater than the larger within-group range. However, this metric is subject to extremely narrow within-group differences, which affect the ratio.
Additional vaccination-related indicators with gaps between 200% and 500% include vaccine_incomplete_distrust_vaccine and hesitant_barrier_distrust_vaccines. However, the question about reasons for incomplete vaccination was only included in the survey from February to August 2021 and has complete data only from March to May 2021 (see Figure 10, left).
Figure 10. Distrust of the COVID-19 vaccines as a reason for incomplete vaccination (left) and vaccine hesitancy (right). The purple band spans the median values of the two lower education levels (Group A), while the teal band represents the higher education levels (Group B). Despite significantly greater average distrust among Group A, Group B caught up by late 2021 and surpassed Group A, in particular high-school graduates, by mid 2022. Data source: [].
Interestingly, responses to the question pertaining to distrust of the vaccines as a reason for hesitancy to get vaccinated grew larger throughout the vaccination campaign for all groups (see Figure 10, right). Despite the significant gap of −208% between medians, the more educated Group B, which started noticeably lower than Group A, ended up above Group A, i.e., with greater distrust, by mid-2022.
The remaining vaccine-related indicators with a 2- to 5-fold gap between groups concerned time and cost as barriers to getting vaccinated.
Returning to the set of indicators with the greatest gaps > 500%, four indicators refer to having symptoms of illness during the 24 h preceding the survey, including cough, diarrhea, eye pain, and sleep changes. Additional symptoms with gaps between 200% and 500% include headaches, sore throat, nausea, and difficulty breathing. While the survey included a total of 76 symptom-related questions, only 20 asked about the presence of specific symptoms in the last 24 h, and 10 of these were skewed towards the lower-education Group A (and none was skewed in the other direction).
Several other indicators with significant gaps between higher Group A and lower Group B medians represented people’s life and work circumstances, including having had direct contact with people outside their family, having had direct contact with a person who recently tested positive for COVID-19, having a paid job outside their home in the last four weeks, as well as being very worried or somewhat worried about their household’s finances for the next month. For example, Figure 11 (left) shows the large gap between lesser-educated workers with jobs outside their home and the “laptop class” working from home, which narrowed after the beginning of the pandemic but never closed below a 5% separation. The direct-contact variable has a similar pattern but is not available beyond summer 2021, and the financial-worries variable (see Figure 11, right) shows a persistent pattern of greatest worries among the least-educated respondents.
Figure 11. Indicators representing life circumstances (outside work, left, and financial worries, right) show the expected gradient by education, with a greater burden on individuals with lower levels of education. The purple band spans the median values of the two lower education levels (Group A), while the teal band represents the higher education levels (Group B). Data source: [].
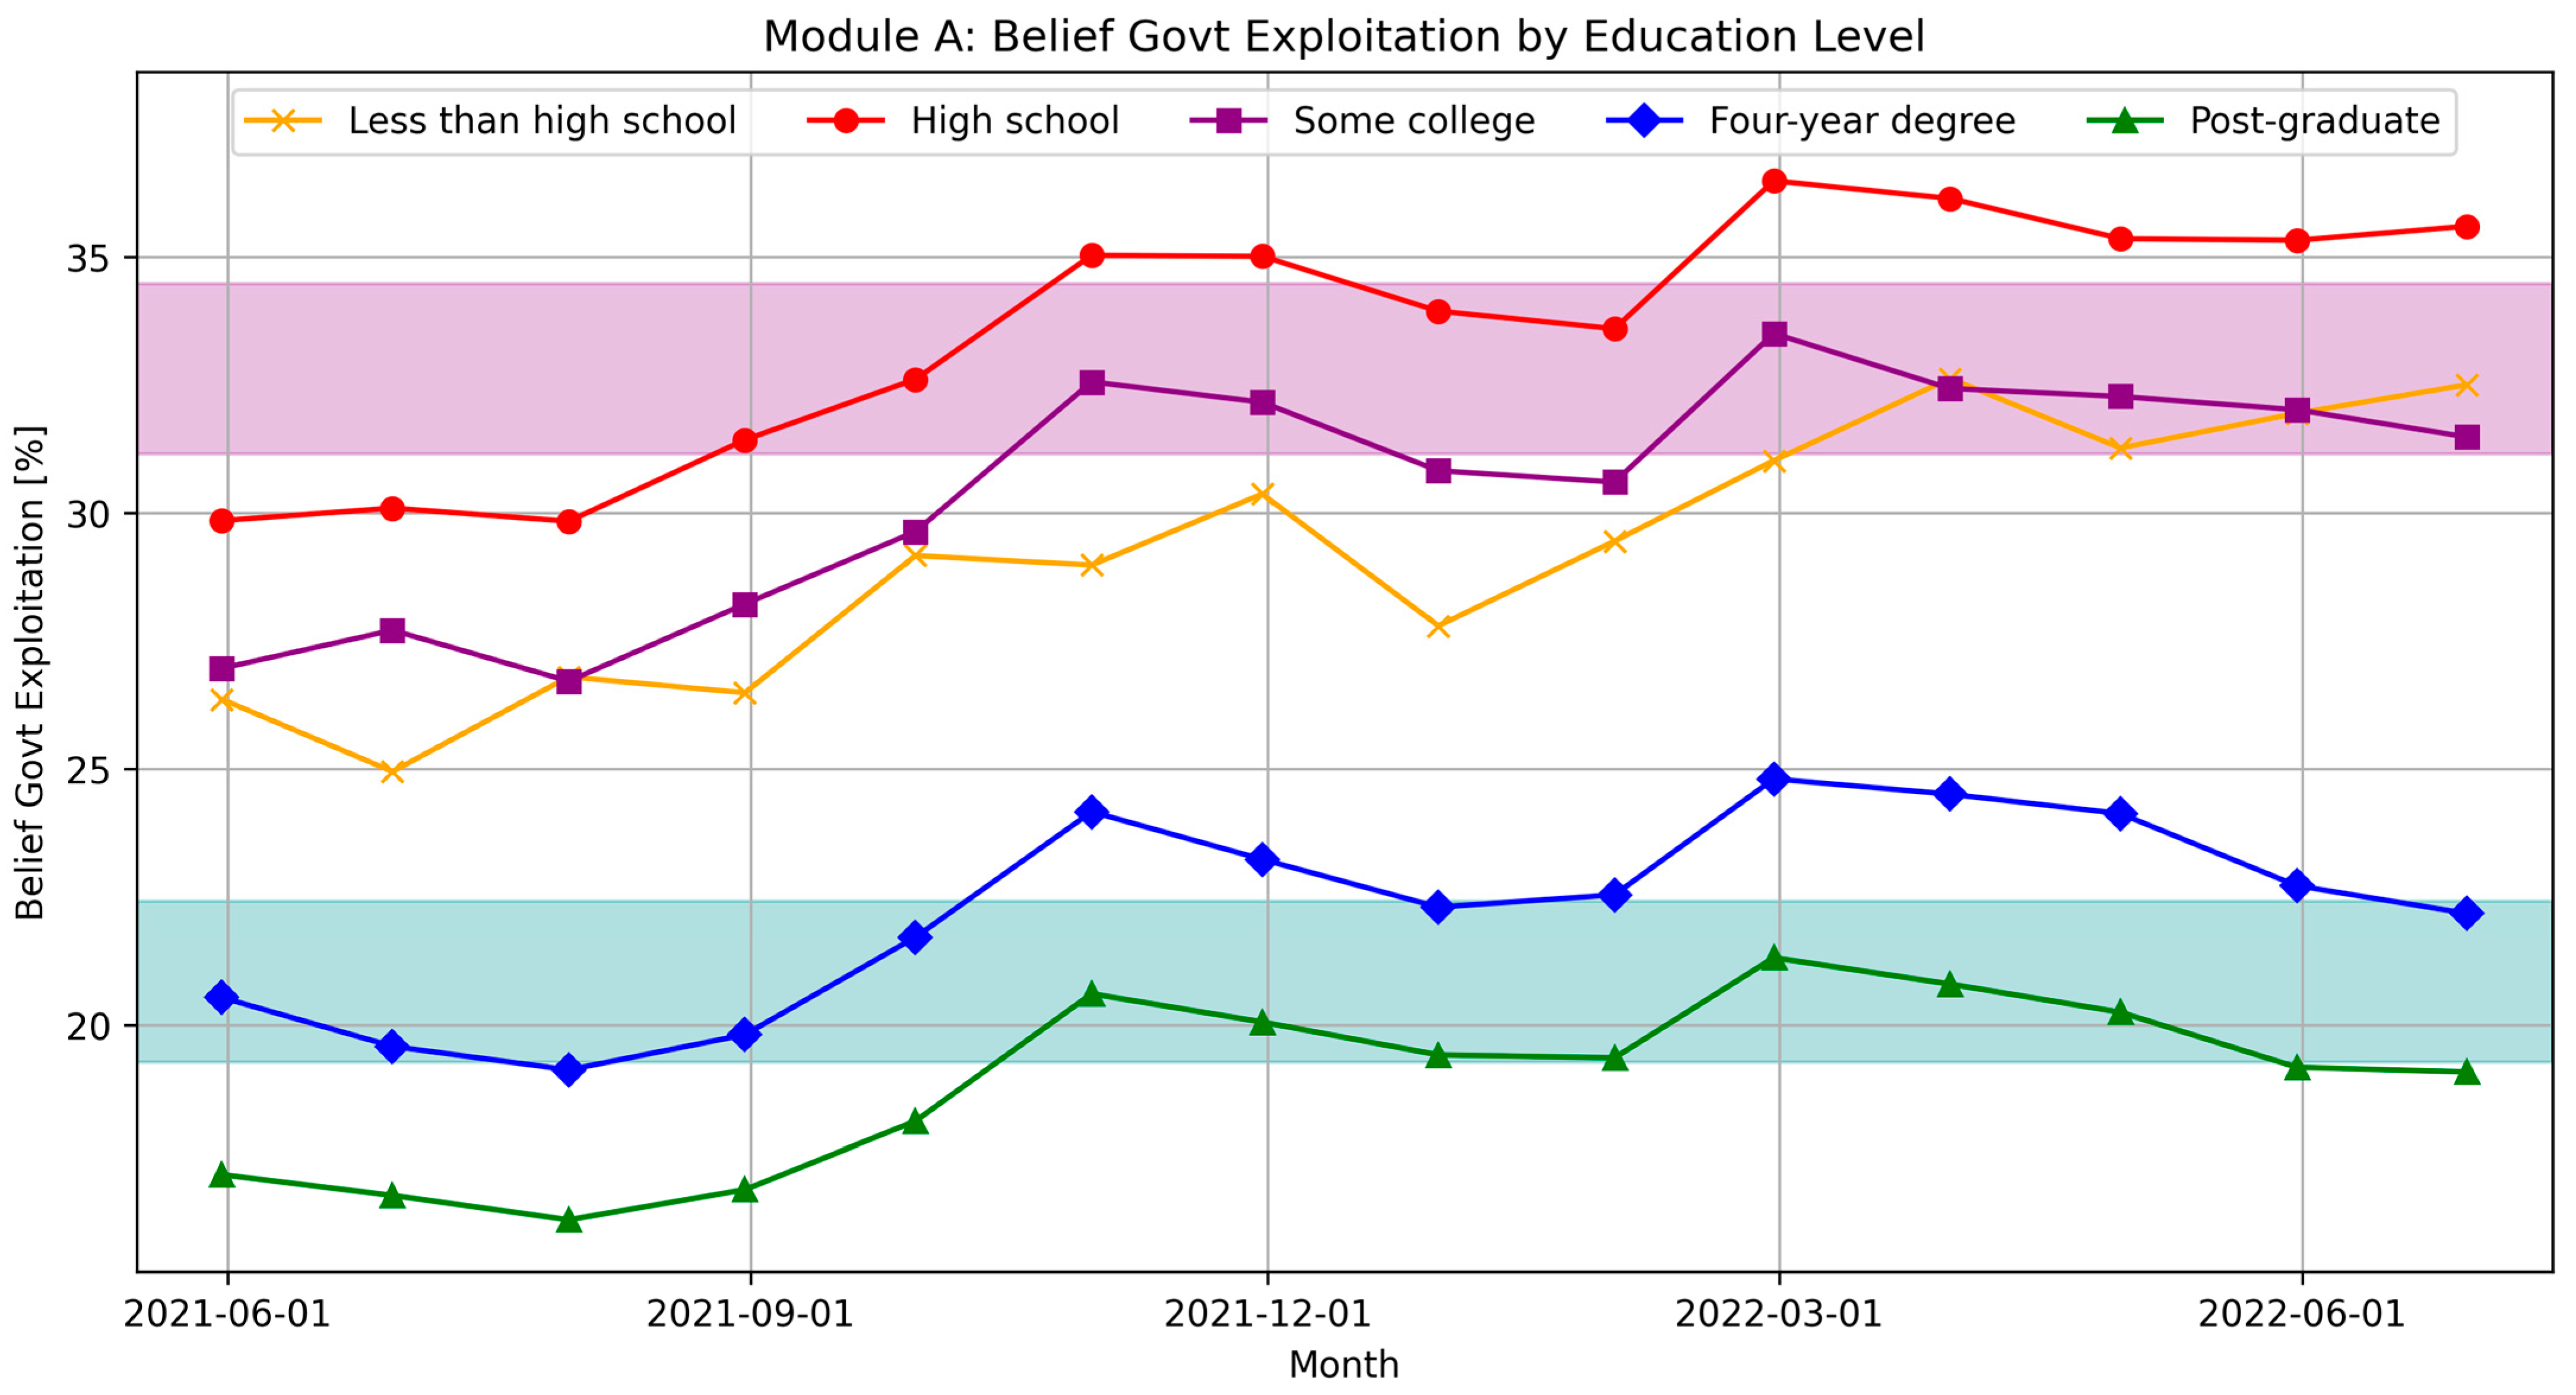
One final indicator of interest also displays a large gap between education groups, belief_govt_exploitation. A full one-third of Group A believe that the pandemic is definitely or probably “being exploited by the government to control people”, while only one-fifth of Group B concur with this statement (see Figure 12). Note that all curves are rising from mid-2021 to mid-2022, illustrating considerably growing distrust in government.
Figure 12. Indicator representing a growing belief that the government exploits the pandemic for control, with a gradient of greater distrust among less-educated groups and rising distrust across the board. The purple band spans the median values of the two lower education levels (Group A), while the teal band represents the higher education levels (Group B). Data source: [].

4. Discussion

The majority of attitudes and experiences reported in the COVID-19 Trends and Impacts Survey [] consistently follow a gradient by degree of formal education with a gap between highly and less educated groups. While our primary metric was the median for each variable and education group throughout the 18-month core period of the pandemic, upon visual examination, changes over time also display remarkably consistent patterns with parallel curves maintaining a significant gap between the two groups of interest. The groups examined were those with formal post-secondary degrees, labelled by Liu [] as “credentialed professionals”, and those without, including high school graduates and college “drop-outs”. This study did not focus on those with less than high school-level education, as their experiences and attitudes were less consistent, sometimes aligning with the lower-education group and sometimes with the higher-education group. In addition, this group provided the smallest fraction of responses by far, making their data susceptible to greater variability and error.
The comprehensive findings from the review of all CTIS questions by education level, well beyond the issue of vaccine hesitancy, illustrate the magnitude of the schism between education groups and its implications on societal decision-making during a crisis like the COVID-19 pandemic. Formally educated individuals are much more likely to be in positions of decision support and decision-making. But are they adequately prepared to make decisions for the rest of society, for those who have very different lived experiences? Attitudes and behaviours of those with less than a college degree are not proportionately represented in public health decision-making and among the “experts” being consulted.
In the context of recent advances in COVID-related science, we also need to ask whose perspectives were closer to reality. For example, regarding attitudes towards face covering policies, a Cochrane review found little evidence for the effectiveness of masks against virus transmission []. Other researchers even identified direct harms from mask-wearing [], making the sceptical perspective of lesser-educated individuals look more commonsensical than reckless. The effectiveness of lockdowns was also questioned since the beginning of the pandemic (e.g., [,,,]), suggesting that low levels of belief in social distancing and similar measures might be a sign of being well grounded rather than poorly informed. The use of the “misinformation” label by the academic expert class to characterize any questioning of pandemic response measures has proven to be disingenuous as more information accrued []. In addition to this power imbalance, there also is an imbalance in the means available to the “laptop class” to create convincing communications to distribute the predominant narrative, while lesser-educated groups are lacking these means of information sharing.
People’s sources of information are a point of interest in itself. Most of the authoritative sources offered in the CTIS questionnaire (US Centers for Disease Control; scientists and other health experts; government health authorities or officials; local health workers, clinics, and community organizations; politicians; and religious leaders) [] showed similar usage across education levels. The response “None of the above” was slightly skewed towards the lower-education groups, suggesting that these individuals did not find their sources (e.g., alternative media) offered in the survey or that they sought information less frequently than the higher-education groups. The latter were more likely to receive news from journalists, implying trust in the mainstream media, and much more likely to receive news from friends and family, possibly suggesting social reinforcement of narratives among the more educated. Based on another category of CTIS questions, the higher-education groups trusted the news received from government health authorities, the US Centers for Disease Control, scientists and other health experts, local health workers, clinics, and community organizations, and lastly journalists significantly more than lower-education groups did.
Importantly, it should be noted that formal education does not equate intelligence, since the direction of the relationship is unclear [] and demonstrated benefits were shown to be modest []. Some even argue that higher education is more about signalling intelligence, conscientiousness, and conformity rather than increasing actual cognitive ability []. Thus, hesitancy and rejection of COVID-19 vaccination could be viewed as street-smart, since more and more issues with vaccine efficacy ([,]), safety ([,,]), and acceptance ([,]) come to the surface. It would also be interesting to examine, whether people with sceptical attitudes towards government interventions were nevertheless susceptible to psychological influencing on the basis of behavioural science or nudging techniques [].
Not surprisingly, this research involves a number of limitations, some of which also suggest opportunities for further analysis. Our results rely on the representativeness of the CTIS sample, its geographic and temporal scope, as well as the availability and accuracy of the contingency data tables. Conclusions drawn from large online surveys during the COVID-19 pandemic were shown to have limited accuracy []. In addition to the sampling issue, the results depend on the selection of variables, although an attempt was made to develop a systematic approach to this selection. The coarse monthly aggregations in the public CTIS data present another limitation, and the overall time span is quite short at only one-and-a-half years.

5. Conclusions

Identifying numerous systematic differences in the experiences of highly educated and less educated groups, we can see a story of two pandemics in the CTIS responses. Generally, better educated individuals displayed strong beliefs in public health measures, while having less worry about their work and living environments. According to this analysis, the “typical” college or university graduate or post-graduate degree holder had a good chance of working from home, did not likely have financial concerns, and believed in the effectiveness of the public health measures. In contrast, the “typical” high school graduate, associate degree holder, or college drop-out was required to work on site, yet worried about their financial situation, and developed growing distrust of government interventions.
Between these two groups, we see a pattern of the better educated professional-managerial class (e.g., []) succumbing to groupthink (see also []). This group tends to be more compliant and less critical of interventions, as group members are firmly integrated in, and dependent upon, government operations and have more to lose, e.g., highly specialized, irreplaceable careers. The possible capture of public agencies by way of influencing their employees gives rise to concerns about regulatory independence, e.g., when it comes to drug approval and pharmacovigilance. Concerningly, since academics are part of the professional class, scientific research may also be tainted by a lack of respect for alternative viewpoints outside our personal comfort zones. When scientists focus on re-educating members of the public, rather than understanding them, they begin to function as an accessory to population manipulation.
Future work could include adding other analytical dimensions such as the urban-rural distinction or age groups. One could also attempt to map the CTIS data onto an ideal-typical schematic of pandemic attitudes such as that by Monaghan []. While we may extrapolate from the American survey respondents to other Western countries, politically and culturally different regions of the world would require their own studies. Additionally, examining geospatial patterns by sub-national units would be of interest, in particular if combined with some of the other dimensions mentioned.

Funding

The author acknowledges the support of the Government of Canada’s New Frontiers in Research Fund (NFRF) under grant No. NFRFR-2022-00305.

Institutional Review Board Statement

Not applicable due to the use of secondary data.

Data Availability Statement

The data from the COVID-19 Trends and Impact Survey used in this research are freely available from the source referenced in the manuscript (CTIS 2020 []).

Acknowledgments

In this study, the author used ChatGPT 4o for the creation and execution of Python code to clean and merge data tables, calculate statistical measures, and generate graphical charts. Generative AI was not used in the preparation of the text for this manuscript. The author has reviewed and edited the output and takes full responsibility for the content of this publication.

Conflicts of Interest

The author declares no conflicts of interest.

References

  1. Martin, R. Human behaviors during the COVID-19 pandemic and their consequences. Int. J. Popul. Stud. 2025, 11, 1–30. [Google Scholar] [CrossRef]
  2. Chaufan, C.; Heredia, C.; McDonald, J.; Hemsing, N. The balance of risks and benefits in the COVID-19 “Vaccine hesitancy” literature: A critical umbrella review. J. Res. Appl. Med. 2023, 2, 9. [Google Scholar]
  3. UnHerd. The Most Vaccine-Hesitant Group of All? PhDs. 2021. Available online: https://unherd.com/newsroom/the-most-vaccine-hesitant-education-group-of-all-phds/ (accessed on 20 March 2025).
  4. King, W.C.; Rubinstein, M.; Reinhart, A.; Mejia, R.J. Time Trends and Factors Related to COVID-19 Vaccine Hesitancy from January–May 2021 Among US Adults: Findings from a Large-Scale National Survey. medRxiv 2021. preprint. Available online: https://www.medrxiv.org/content/10.1101/2021.07.20.21260795v1 (accessed on 9 September 2023).
  5. Salomon, J.A.; Reinhart, A.; Bilinski, A.; Chua, E.J.; La Motte-Kerr, W.; Rönn, M.M.; Reitsma, M.B.; Morris, K.A.; LaRocca, S.; Farag, T.H.; et al. The US COVID-19 Trends and Impact Survey: Continuous real-time measurement of COVID-19 symptoms, risks, protective behaviors, testing, and vaccination. Proc. Natl. Acad. Sci. USA 2021, 118, e2111454118. [Google Scholar] [CrossRef] [PubMed]
  6. Thaler, S. Americans with PhDs Are Most Reluctant to Get Vaccinated Against COVID. 2021. Available online: https://www.dailymail.co.uk/news/article-9893465/Americans-PhDs-reluctant-vaccinated-against-COVID-study-finds.html (accessed on 20 March 2025).
  7. King, W.C.; Rubinstein, M.; Reinhart, A.; Mejia, R. Time trends, factors associated with, and reasons for COVID-19 vaccine hesitancy: A massive online survey of US adults from January–May 2021. PLoS ONE 2021, 16, e0260731. [Google Scholar] [CrossRef] [PubMed]
  8. Soorapanth, S.; Cheung, R.; Zhang, X.; Mokdad, A.H.; Mensah, G.A. Rural–Urban Differences in Vaccination and Hesitancy Rates and Trust: US COVID-19 Trends and Impact Survey on a Social Media Platform, May 2021–April 2022. Am. J. Public Health 2023, 113, 680–688. [Google Scholar] [CrossRef]
  9. Yang, Y.; Dempsey, W.; Han, P.; Deshmukh, Y.; Richardson, S.; Tom, B.; Mukherjee, B. Exploring the Big Data Paradox for various estimands using vaccination data from the global COVID-19 Trends and Impact Survey (CTIS). Sci. Adv. 2024, 10, eadj0266. [Google Scholar] [CrossRef]
  10. Cox-Ganser, J.M.; Henneberger, P.K.; Weissman, D.N.; Guthrie, G.; Groth, C.P. COVID-19 test positivity by occupation using the Delphi US COVID-19 trends and impact survey, September–November 2020. Am. J. Ind. Med. 2022, 65, 721–730. [Google Scholar] [CrossRef]
  11. Nguyen, Q.C.; Yardi, I.; Gutierrez, F.X.M.; Mane, H.; Yue, X. Leveraging 13 million responses to the U.S. COVID-19 Trends and Impact Survey to examine vaccine hesitancy, vaccination, and mask wearing, January 2021–February 2022. BMC Public Health 2022, 22, 1911. [Google Scholar] [CrossRef]
  12. Ettman, C.K.; Badillo-Goicoechea, E.; Stuart, E.A. Evolution of Depression and Anxiety During the COVID-19 Pandemic and Across Demographic Groups in a Large Sample of U.S. Adults. AJPM Focus 2023, 2, 100140. [Google Scholar] [CrossRef] [PubMed]
  13. Rufino, J.; Baquero, C.; Frey, D.; Glorioso, C.A.; Ortega, A.; Reščič, N.; Roberts, J.C.; Lillo, R.E.; Menezes, R.; Champati, J.P.; et al. Using survey data to estimate the impact of the omicron variant on vaccine efficacy against COVID-19 infection. Sci. Rep. 2023, 13, 900. [Google Scholar] [CrossRef]
  14. Huang, C.; Smith, R.L. A modeling study on SARS-CoV-2 transmissions in primary and middle schools in Illinois. BMC Public Health 2024, 24, 3197. [Google Scholar] [CrossRef] [PubMed]
  15. Aw, J.; Seng, J.J.B.; Seah, S.S.Y.; Low, L.L. COVID-19 Vaccine Hesitancy—A Scoping Review of Literature in High-Income Countries. Vaccines 2021, 9, 900. [Google Scholar] [CrossRef]
  16. AlShurman, B.A.; Khan, A.F.; Mac, C.; Majeed, M.; Butt, Z.A. What Demographic, Social, and Contextual Factors Influence the Intention to Use COVID-19 Vaccines: A Scoping Review. Int. J. Environ. Res. Public Health 2021, 18, 9342. [Google Scholar] [CrossRef] [PubMed]
  17. Green, J.; Fischer, E.F.; Fitzgerald, D.; Harvey, T.S.; Thomas, F. The publics of public health: Learning from COVID-19. Crit. Public Health 2022, 32, 592–599. [Google Scholar] [CrossRef]
  18. Allen, D. Why Did Jurisdictions Repeatedly Use Inefficient Lockdowns During the COVID-19 Pandemic? Policy Commons. 2023. Available online: https://policycommons.net/artifacts/3376877/why-did-jurisdictions-repeatedly-use-inefficient-lockdowns-during-the-covid-19-pandemic/4175762/ (accessed on 20 March 2025).
  19. Tierney, J. The Panic Pandemic. City Journal. 2021. Available online: https://www.city-journal.org/article/the-panic-pandemic (accessed on 20 March 2025).
  20. Roy, M.; Gandsman, A. Polarizing figures of resistance during epidemics. A comparative frame analysis of the COVID-19 freedom convoy. Crit. Public Health 2023, 33, 788–802. [Google Scholar] [CrossRef]
  21. Graeber, D. Anthropology and the rise of the professional-managerial class. HAU J. Ethnogr. Theory 2014, 4, 73–88. [Google Scholar] [CrossRef]
  22. Liu, C. Virtue Hoarders: The Case Against the Professional Managerial Class; Forerunners: Ideas First; University of Minnesota Press: Minneapolis, MN, USA, 2021; 90p, Available online: https://www.upress.umn.edu/9781517912253/virtue-hoarders/ (accessed on 20 March 2025).
  23. Clerval, A. Displacement: Cause and consequence of gentrification. Urban Geogr. 2021, 42, 1054–1057. [Google Scholar] [CrossRef]
  24. Reinhart, A.; Mejia, R.; Tibshirani, R.J. COVID-19 Trends and Impact Survey (CTIS), United States, 2020–2022; Inter-University Consortium for Political and Social Research: Ann Arbor, MI, USA, 2025; Available online: https://www.icpsr.umich.edu/web/ICPSR/studies/39207/versions/V1 (accessed on 20 March 2025).
  25. CTIS. Contingency Tables | Delphi Epidata API. 2020. Available online: https://web.archive.org/web/20250207013308/https://cmu-delphi.github.io/delphi-epidata/symptom-survey/contingency-tables.html (accessed on 20 March 2025).
  26. Bleier, B.S.; Ramanathan, M., Jr.; Lane, A.P. COVID-19 Vaccines May Not Prevent Nasal SARS-CoV-2 Infection and Asymptomatic Transmission. Otolaryngol. Head Neck Surg. 2021, 164, 305–307. [Google Scholar] [CrossRef]
  27. Gupta, R.K.; Topol, E.J. COVID-19 vaccine breakthrough infections. Science 2021, 374, 1561–1562. [Google Scholar] [CrossRef]
  28. Doshi, P. Will covid-19 vaccines save lives? Current trials aren’t designed to tell us. BMJ 2020, 371, m4037. [Google Scholar] [CrossRef]
  29. Jefferson, T.; Dooley, L.; Ferroni, E.; Al-Ansary, L.A.; Driel, M.L.; Bawazeer, G.A.; Jones, M.A.; Hoffmann, T.C.; Clark, J.; Beller, E.M.; et al. Physical interventions to interrupt or reduce the spread of respiratory viruses. Cochrane Database Syst. Rev. 2023, 1, CD006207. [Google Scholar] [CrossRef] [PubMed]
  30. Kisielinski, K.; Hockertz, S.; Hirsch, O.; Korupp, S.; Klosterhalfen, B.; Schnepf, A.; Dyker, G. Wearing face masks as a potential source for inhalation and oral uptake of inanimate toxins—A scoping review. Ecotoxicol. Environ. Saf. 2024, 275, 115858. [Google Scholar] [CrossRef] [PubMed]
  31. Schippers, M.C. For the Greater Good? The Devastating Ripple Effects of the COVID-19 Crisis. Front. Psychol. 2020, 11, 577740. [Google Scholar] [CrossRef]
  32. Joffe, A.R.; Redman, D. The SARS-CoV-2 Pandemic in High Income Countries Such as Canada: A Better Way Forward Without Lockdowns. Front. Public Health 2021, 9, 715904. [Google Scholar] [CrossRef]
  33. Allen, D.W. COVID-19 Lockdown Cost/Benefits: A Critical Assessment of the Literature. Int. J. Econ. Bus. 2022, 29, 1–32. [Google Scholar] [CrossRef]
  34. Simandan, D.; Rinner, C.; Capurri, V. The academic left, human geography, and the rise of authoritarianism during the COVID-19 pandemic. Geogr. Ann. Ser. B Hum. Geogr. 2023, 106, 175–195. [Google Scholar] [CrossRef]
  35. Joffe, A.R.; Kazemi, P.; Mdcm, R.E.; Milburn, C. When COVID-19 Claims of ‘Revisionism’ and ‘Misinformation’ Are Themselves Misinformed; The Frontier Centre for Public Policy (FCPP): Winnipeg, MB, Canada, 2025; Report No. 144; Available online: https://fcpp.org/2025/02/12/when-covid-19-claims-of-revisionism-and-misinformation-are-themselves-misinformed/ (accessed on 21 November 2025).
  36. Deary, I.J.; Johnson, W. Intelligence and education: Causal perceptions drive analytic processes and therefore conclusions. Int. J. Epidemiol. 2010, 39, 1362–1369. [Google Scholar] [CrossRef]
  37. Ritchie, S.J.; Tucker-Drob, E.M. How Much Does Education Improve Intelligence? A Meta-Analysis. Psychol. Sci. 2018, 29, 1358–1369. [Google Scholar] [CrossRef]
  38. Caplan, B. The Case Against Education: Why the Education System Is a Waste of Time and Money; Princeton University Press: Princeton, NJ, USA, 2019; 424p, Available online: https://www.torrossa.com/en/resources/an/5563590 (accessed on 20 November 2025).
  39. Goldberg, Y.; Mandel, M.; Bar-On, Y.M.; Bodenheimer, O.; Freedman, L.; Haas, E.J.; Milo, R.; Alroy-Preis, S.; Ash, N.; Huppert, A. Waning Immunity after the BNT162b2 Vaccine in Israel. N. Engl. J. Med. 2021, 385, e85. [Google Scholar] [CrossRef]
  40. Prugger, C.; Spelsberg, A.; Keil, U.; Erviti, J.; Doshi, P. Evaluating COVID-19 vaccine efficacy and safety in the post-authorisation phase. BMJ 2021, 375, e067570. [Google Scholar] [CrossRef]
  41. Fraiman, J.; Erviti, J.; Jones, M.; Greenland, S.; Whelan, P.; Kaplan, R.M.; Doshi, P. Serious adverse events of special interest following mRNA COVID-19 vaccination in randomized trials in adults. Vaccine 2022, 40, 5798–5805. [Google Scholar] [CrossRef]
  42. Guetzkow, J.A.; Levi, R. Effect of mRNA Vaccine Manufacturing Processes on Efficacy and Safety Still an Open Question. BMJ 2022, 378, o1731. Available online: https://www.bmj.com/content/378/bmj.o1731/rr-2 (accessed on 9 October 2023).
  43. Kämmerer, U.; Schulz, V.; Steger, K. BioNTech RNA-Based COVID-19 Injections Contain Large Amounts of Residual DNA Including an SV40 Promoter/Enhancer Sequence. Sci. Public Health Policy Law 2024, 5, 2019–2024. [Google Scholar]
  44. Chaufan, C. Is COVID-19 “vaccine uptake” in postsecondary education a “problem”? A critical policy inquiry. Health 2024, 28, 831–857. [Google Scholar] [CrossRef]
  45. Chaufan, C.; Hemsing, N.; Moncrieffe, R. “It isn’t about health, and it sure doesn’t care”: A qualitative exploration of healthcare workers’ lived experience of the policy of vaccination mandates in Ontario, Canada. J. Public Health Emerg. 2025, 9, 16. [Google Scholar] [CrossRef]
  46. Junger, N.; Hirsch, O. Ethics of Nudging in the COVID-19 Crisis and the Necessary Return to the Principles of Shared Decision Making: A Critical Review. Cureus 2024, 16, e57960. [Google Scholar] [CrossRef] [PubMed]
  47. Bradley, V.C.; Kuriwaki, S.; Isakov, M.; Sejdinovic, D.; Meng, X.L.; Flaxman, S. Unrepresentative big surveys significantly overestimated US vaccine uptake. Nature 2021, 600, 695–700. [Google Scholar] [CrossRef] [PubMed]
  48. Dixon, M. What’s in a Name?: A Critical Review of Barbara and John Ehrenreich’s “Professional-Managerial Class”. Synthesis 1978, 2, 68–89. [Google Scholar]
  49. Joffe, A.R. COVID-19: Rethinking the Lockdown Groupthink. Front. Public Health 2021, 9, 625778. [Google Scholar] [CrossRef] [PubMed]
  50. Monaghan, L.F. Schematising COVID-19 pandemic responses: An ideal typical analysis. Soc. Sci. Med. 2024, 349, 116872. [Google Scholar] [CrossRef] [PubMed]
Disclaimer/Publisher’s Note: The statements, opinions and data contained in all publications are solely those of the individual author(s) and contributor(s) and not of MDPI and/or the editor(s). MDPI and/or the editor(s) disclaim responsibility for any injury to people or property resulting from any ideas, methods, instructions or products referred to in the content.

Article Metrics

Citations

Article Access Statistics

Article metric data becomes available approximately 24 hours after publication online.